Investigation of Synthetic Clay Court’s Response under Cyclic Loading †


1
Department of Industrial and Materials Science, Chalmers University of Technology, 412 96 Gothenburg, Sweden
2
Department of Physics, Chalmers University of Technology, 412 96 Gothenburg, Sweden
3
GSL AB, 431 37 Mölndal, Sweden, Sweden
*
Author to whom correspondence should be addressed.
†
Presented at the 12th conference of the International Sports Engineering Association, Brisbane, Queensland, Australia, 26–29 March 2018.
Proceedings 2018, 2(6), 280; https://doi.org/10.3390/proceedings2060280
Published: 13 February 2018
(This article belongs to the Proceedings of The 12th Conference of the International Sports Engineering Association)
Abstract
:The synthetic clay tennis court’s properties need to be examined and modified to converge towards the playing characteristics of the natural clay tennis court. The aim of this study was to investigate the responses of three distinct carpet-material combinations and evaluate how the materials’ alteration affected the results. The specimens were compressed uniaxially up to 2 kN at 400 N/s loading rate at varying number of cycles. Energy transformation, strain accumulation, step of strain accumulation and moduli of each surface combination were calculated. Results indicated that the measurements were affected by the loading history and that the carpet modification influenced mainly the energy transformation and the strain accumulation, while the material change affected additionally the moduli of the system. Conduction of the experiments enhanced understanding of the clay court’s response and could attribute to the initial modelling of the synthetic clay surface.
1. Introduction
Synthetic clay courts gain popularity because they combine playability throughout the year, lower maintenance costs and similar playing characteristics to natural clay courts. The parameters that should be considered during court design are surface functionality, athlete protection and court’s technical characteristics [1]. Regarding the player’s safety, excessive forces to athlete’s body should be avoided. The impact behaviour of sports surfaces has been previously examined using the Artificial Athlete Berlin [2] (pp. 61–67), impact hammer [3] (pp. 121–129) and the ASTM standard [4,5]. Additionally, compression tests [6,7] and biomechanical measurements [8] (pp. 865–870) were used to obtain information on the stress-strain curve. However, the majority of the tests has been performed on athletic tracks, natural and synthetic turf surfaces and acrylic courts with scarce information existing on the response of the clay courts [5] (pp. 1–9) and the role of the carpet and material.
The target of this paper is to investigate the properties of synthetic clay court and how they are influenced by changes in the carpet-material combination. The modulus, the percentage of energy transformation and the strain accumulation under quasi-static cyclic loading were calculated for three different carpets combined with three ceramic sands with distinct particle size distributions and textures.
2. Response under Cyclic Loading
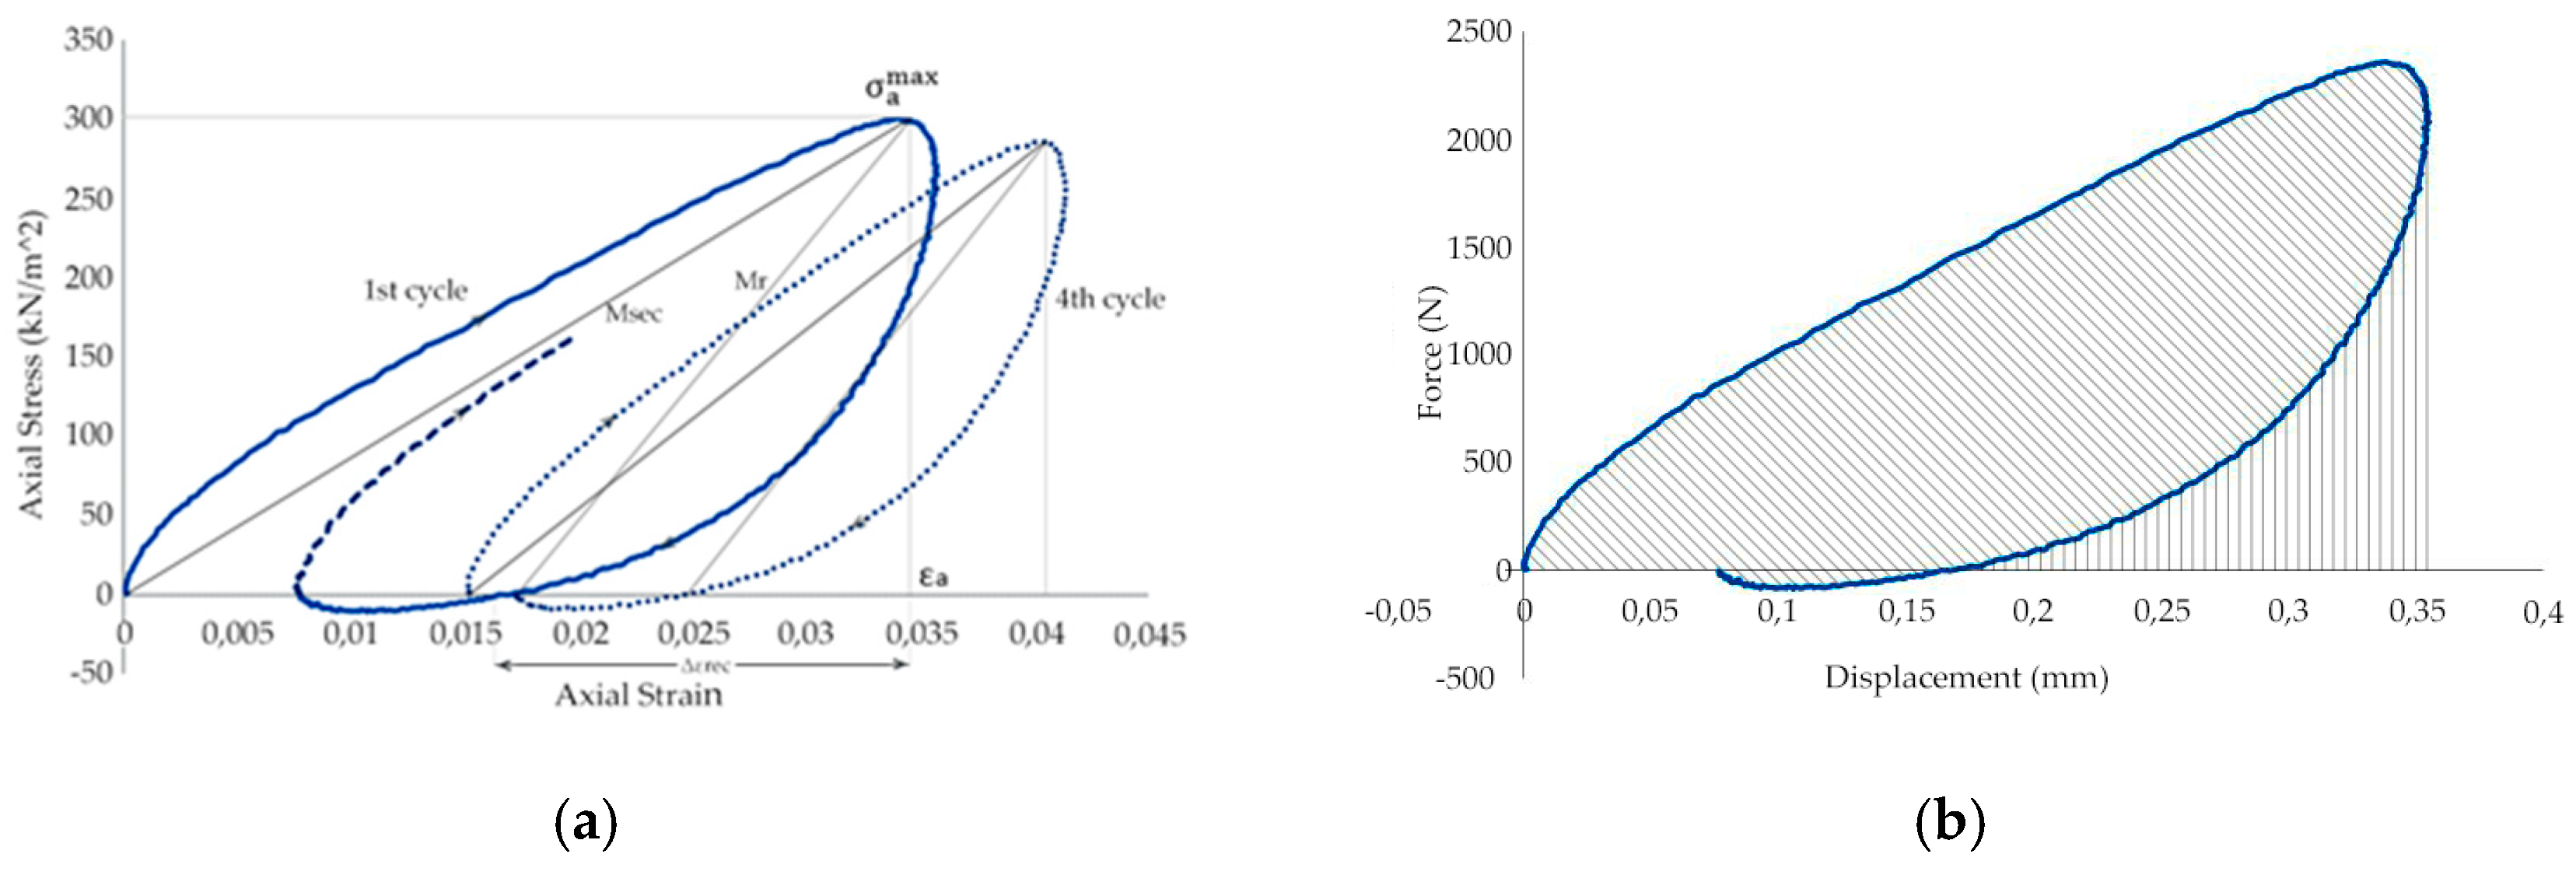
In Figure 1, the response of the system under cyclic loading is depicted. When the carpet-material system is subjected to asymmetrical cyclic loading, strain is accumulated in every cycle until the system either collapses or reaches equilibrium. The phenomenon is called ratcheting and the response is affected by the initial state of the system and the loading amplitude [9] (pp. 55–65).
The system is analysed through secant and resilient modulus and energy transformation in each cycle, similarly to [6]. Secant Modulus is defined as the ratio of the maximum axial stress and the corresponding axial strain , excluding the permanent strain accumulation from previous cycles:
Resilient modulus is defined as the ratio between the maximum axial stress and the recovered axial strain ), which is the difference of the axial strain at maximum stress from the axial strain at the end of the unloading curve of the compression phase.
The player-surface interaction includes the energy exchange between the athlete and the surface. When the athlete steps on the surface, energy is transferred to it and when the athlete lifts his leg a portion of this energy may be returned to the athlete from the surface [10]. The energy transformation in each cycle was calculated based on the force displacement curve (Figure 1b) and the equation that describes the energy exchange is the following:
3. Materials and Methods
The carpets and types of ceramic sand examined are described in Table 1 and Table 2, respectively. In the samples the first letter describes the carpet and the second the ceramic sand.
The samples, carpet and ceramic sand, were placed in a rigid cylinder (100 mm diameter, 105.7 mm height) with a metal base (90 mm diameter and 17.8 mm height) below. The quantity of the material was 5.5 kg/m2 and the sample’s initial height ranged between 7 and 12 mm. The sample’s preparation included pouring of the material on top of the carpet and brushing it until the surface became even. The sample was cyclically compressed in the vertical direction. Axial displacement and vertical force were measured at 100 Hz. Due to the confinement, the strain was developed only along the vertical direction. The losses from the cylinder’s wall were not taken into consideration.
The test was force controlled using a sinusoidal waveform with 200–2000 N range to imitate the movement of a tennis athlete. It corresponds to the repetitive jumping of the athlete on a specific point. The compression phase refers to the duration that the athlete is in touch with the surface and the extension phase to the time that the athlete is on the air. Because of hydraulic function of the machine, the unloading phase was due to gravity and the response relied on the nature of the specimen. The loading rate was set to 0.4 kN/s. However, the value of the actual loading rate changes with time and it depends on the machine characteristics, jog control speed, and the initial stiffness of the sample. From biomechanical tests on clay court, the peak vertical loading rate was 135.52–147.67 BW/s and the average mass of the athlete was 66.75 kg, resulting in 88.7–96.7 kN/s loading rate [12] (pp. 459–463). For the performed tests, the loading rate at maximum force was on average 0.12 kN/s for the 0.4 kN/s target, being three orders of magnitude lower than the real measurements. The presented results refer to specimens with preloading history of 20 cycles and ceramic sand dried in the oven. The tests were performed three times for each carpet-material combination.
4. Results
4.1. Energy Transformation
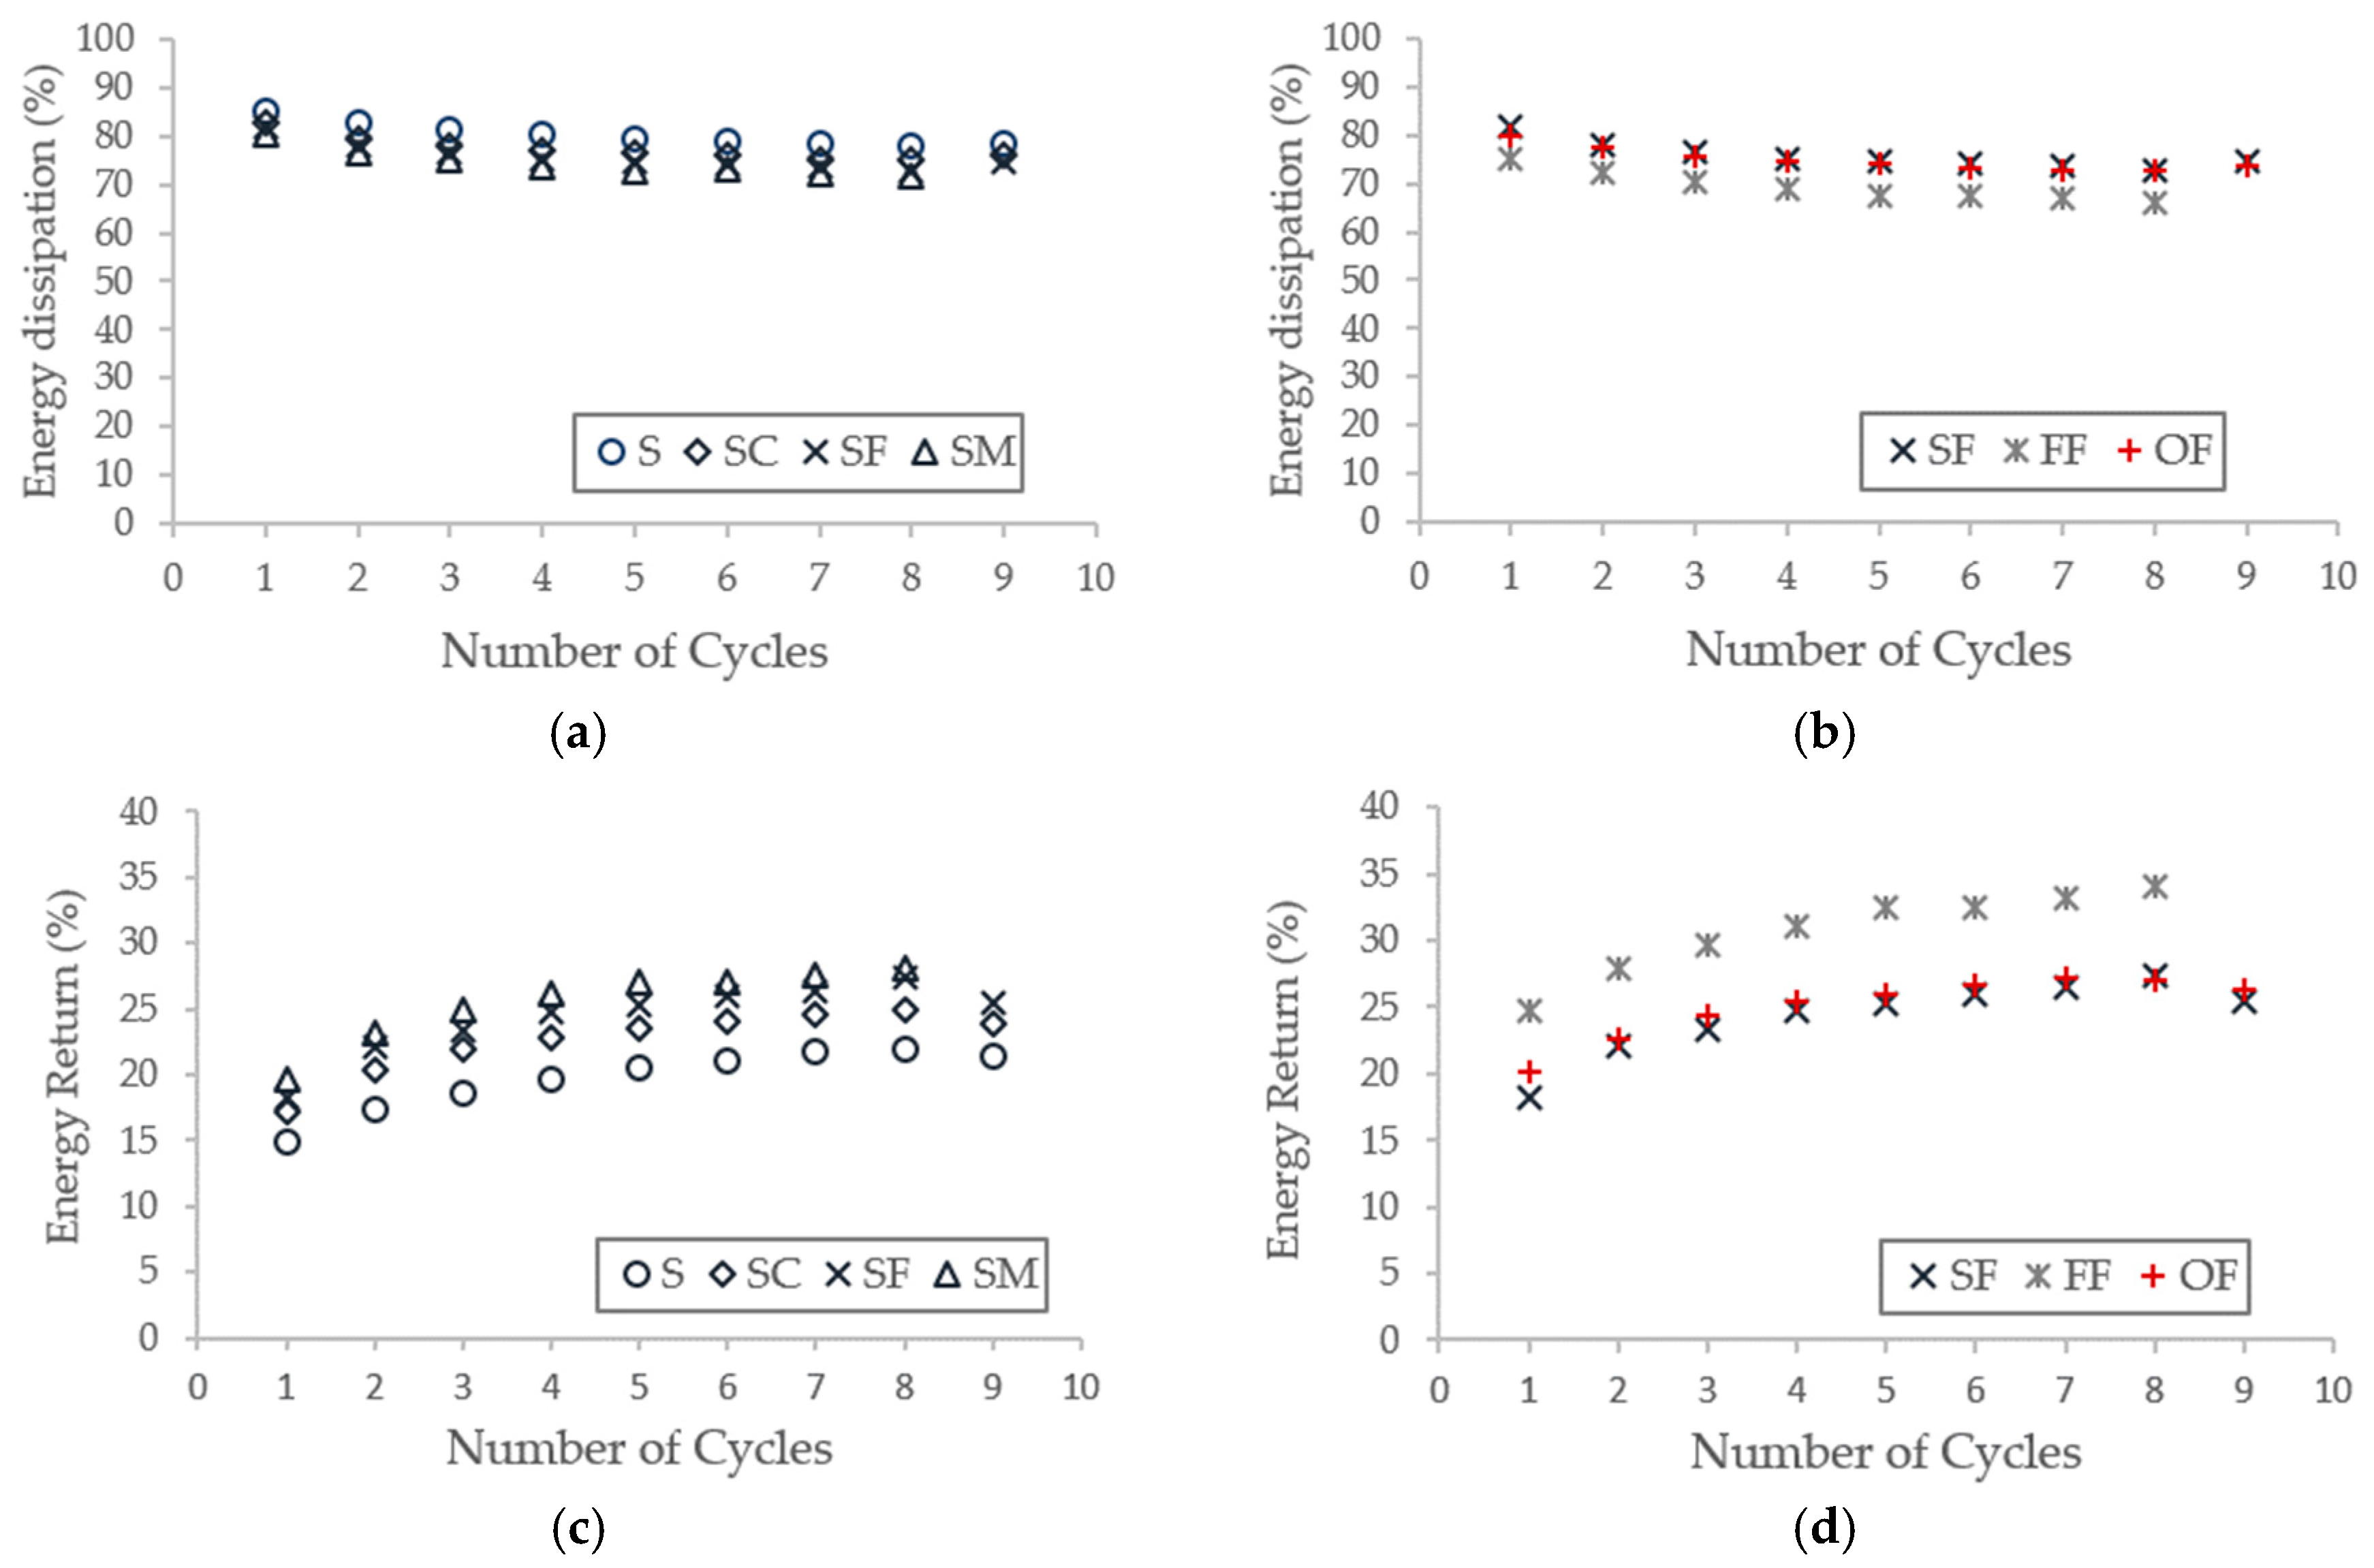
In Figure 2, the energy transformation during nine consecutive cycles is illustrated. The percentage of energy dissipation in all cases was significantly higher compared to the percentage of energy return and it decreased as the number of cycles increased. For carpet S combined with varying types of ceramic sand both recovered and lost energy exhibited similar behaviour, but when the carpet was tested without material it produced lower percentage of energy return. When the infill material was F ceramic sand and the carpet was alternating, all the combinations showed similar percentages of dissipated energy but the FF combination presented the highest percentage of energy return.
4.2. Modulus
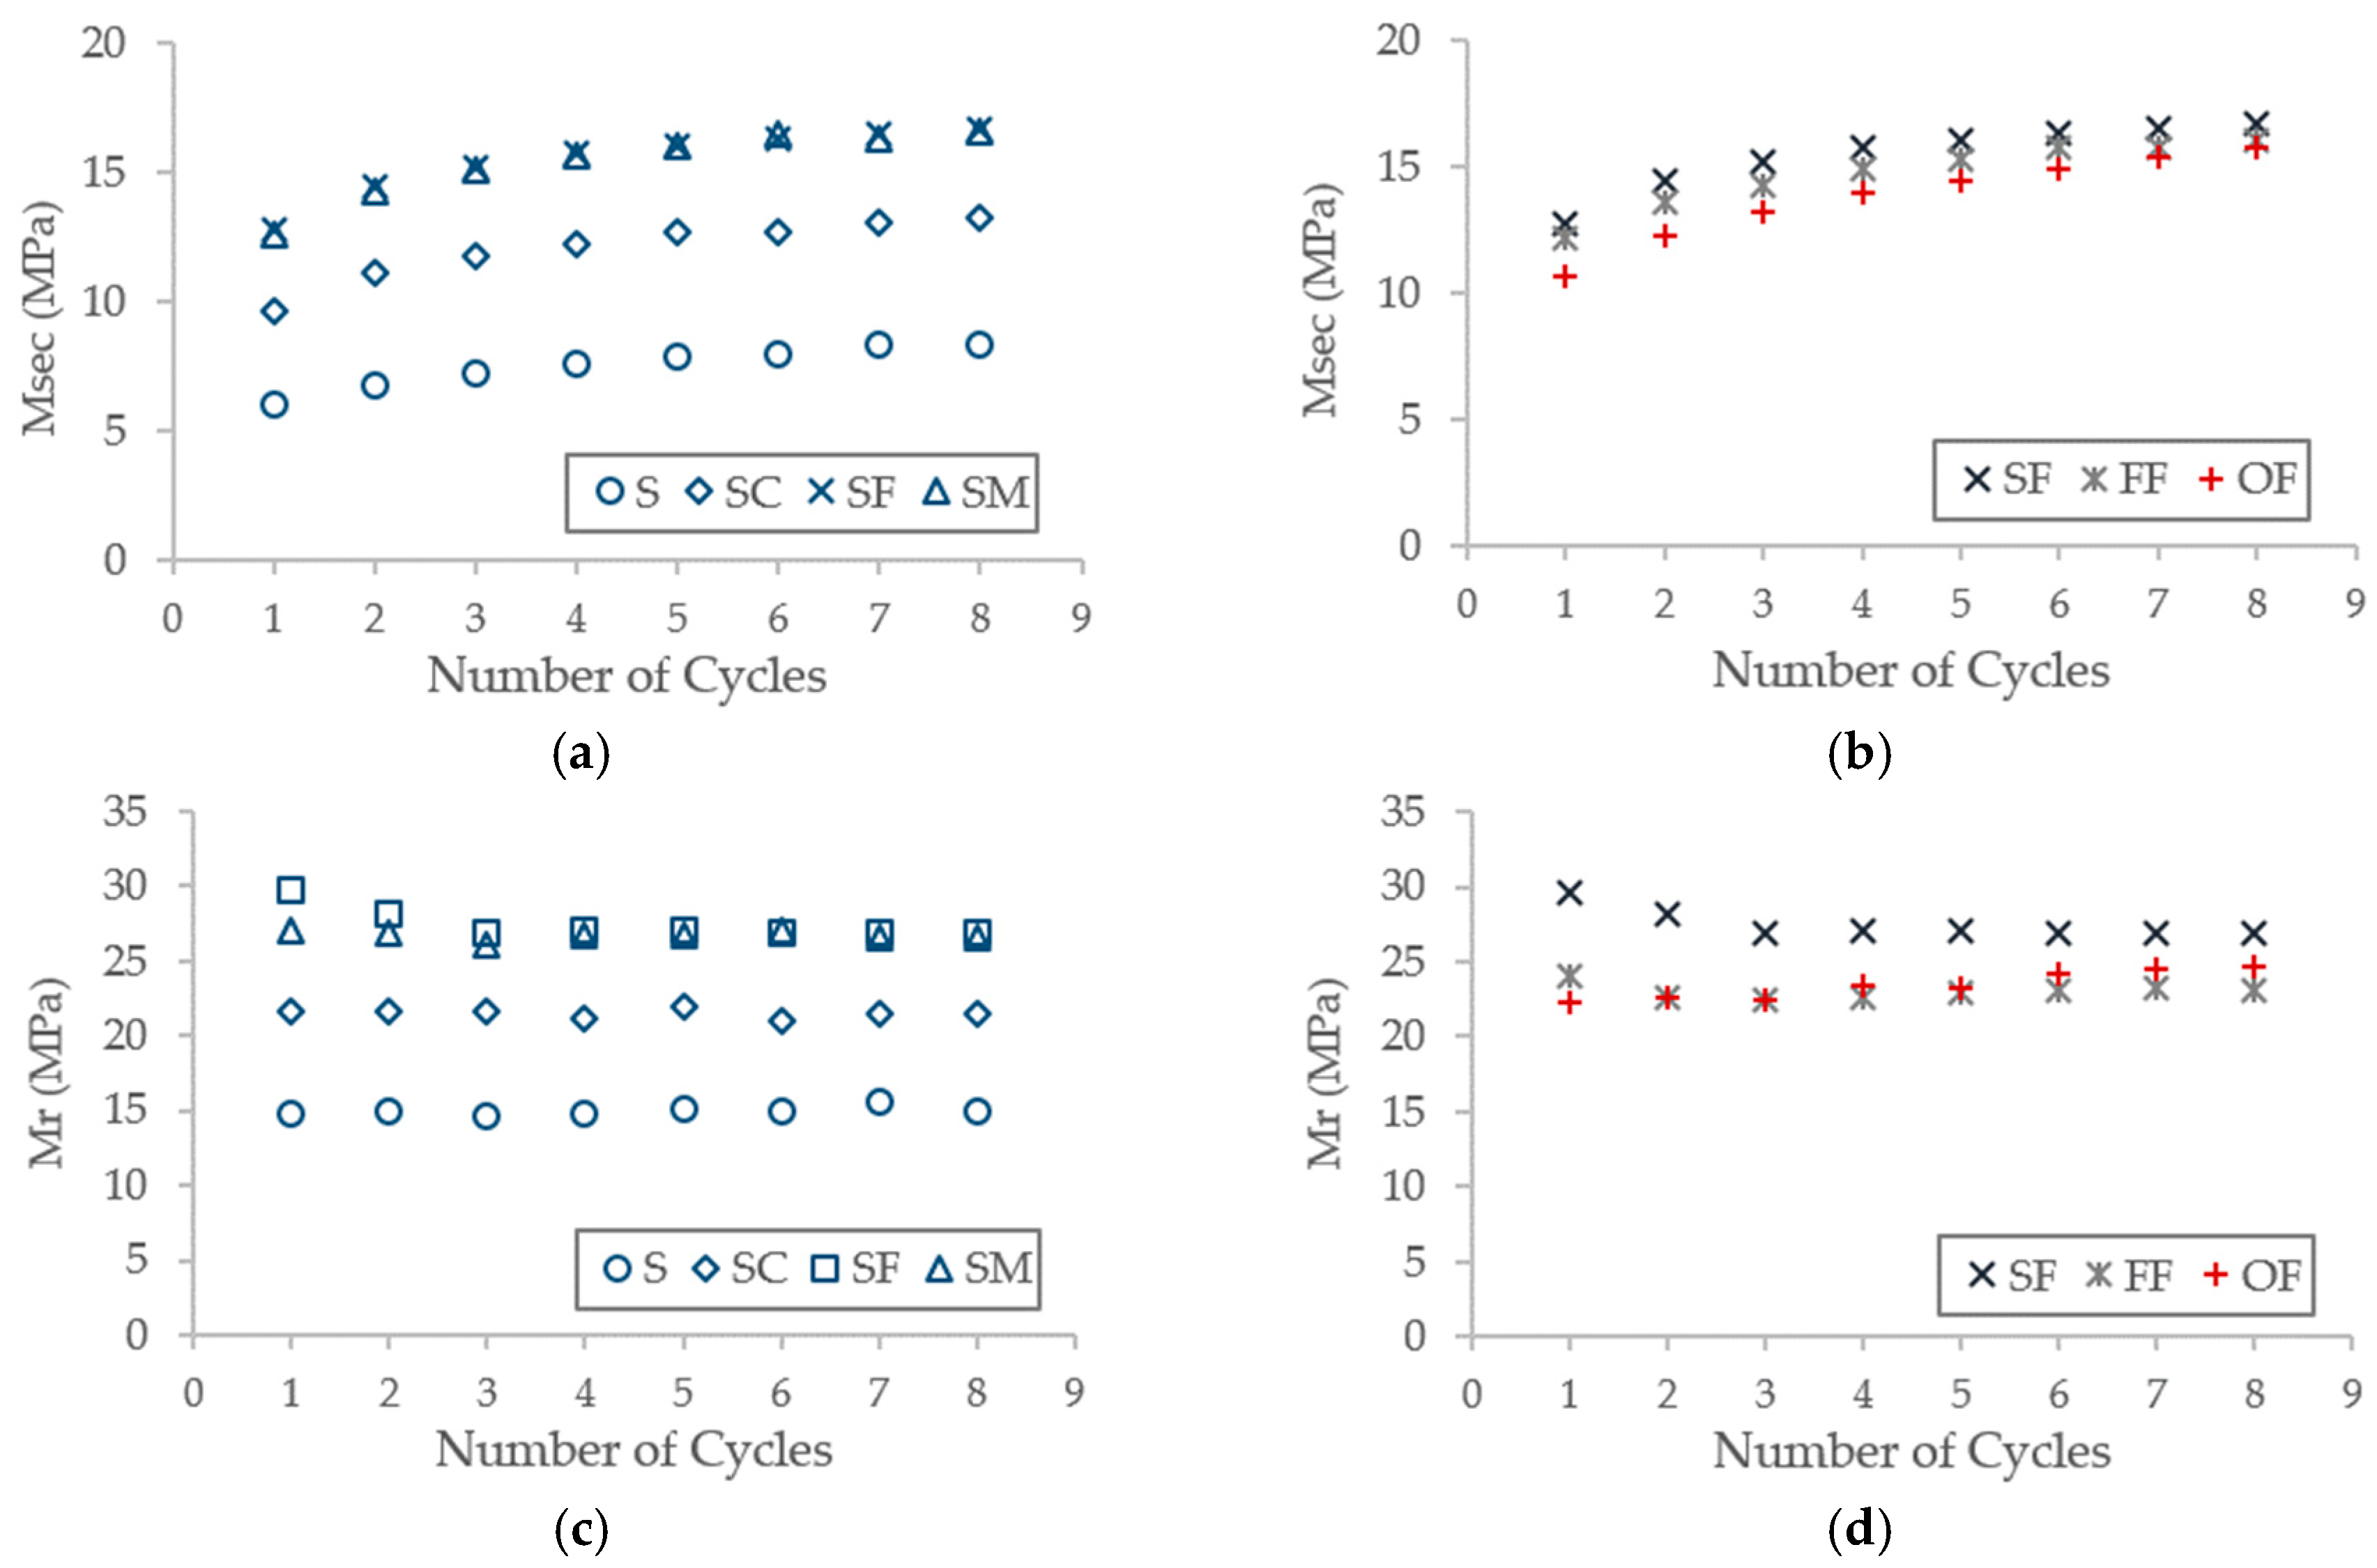
In Figure 3, the secant and resilient moduli of the carpet material system are depicted. The secant modulus increased with the number of cycles while the resilient modulus remained relatively constant. The carpet with no material addition exhibited the stiffest response. For carpet S when infill material was added, the combination with the coarser ceramic sand demonstrated the stiffest response among the three ceramic sands. For fine ceramic sand all three carpets exhibited similar values of moduli.
4.3. Strain Accumulation
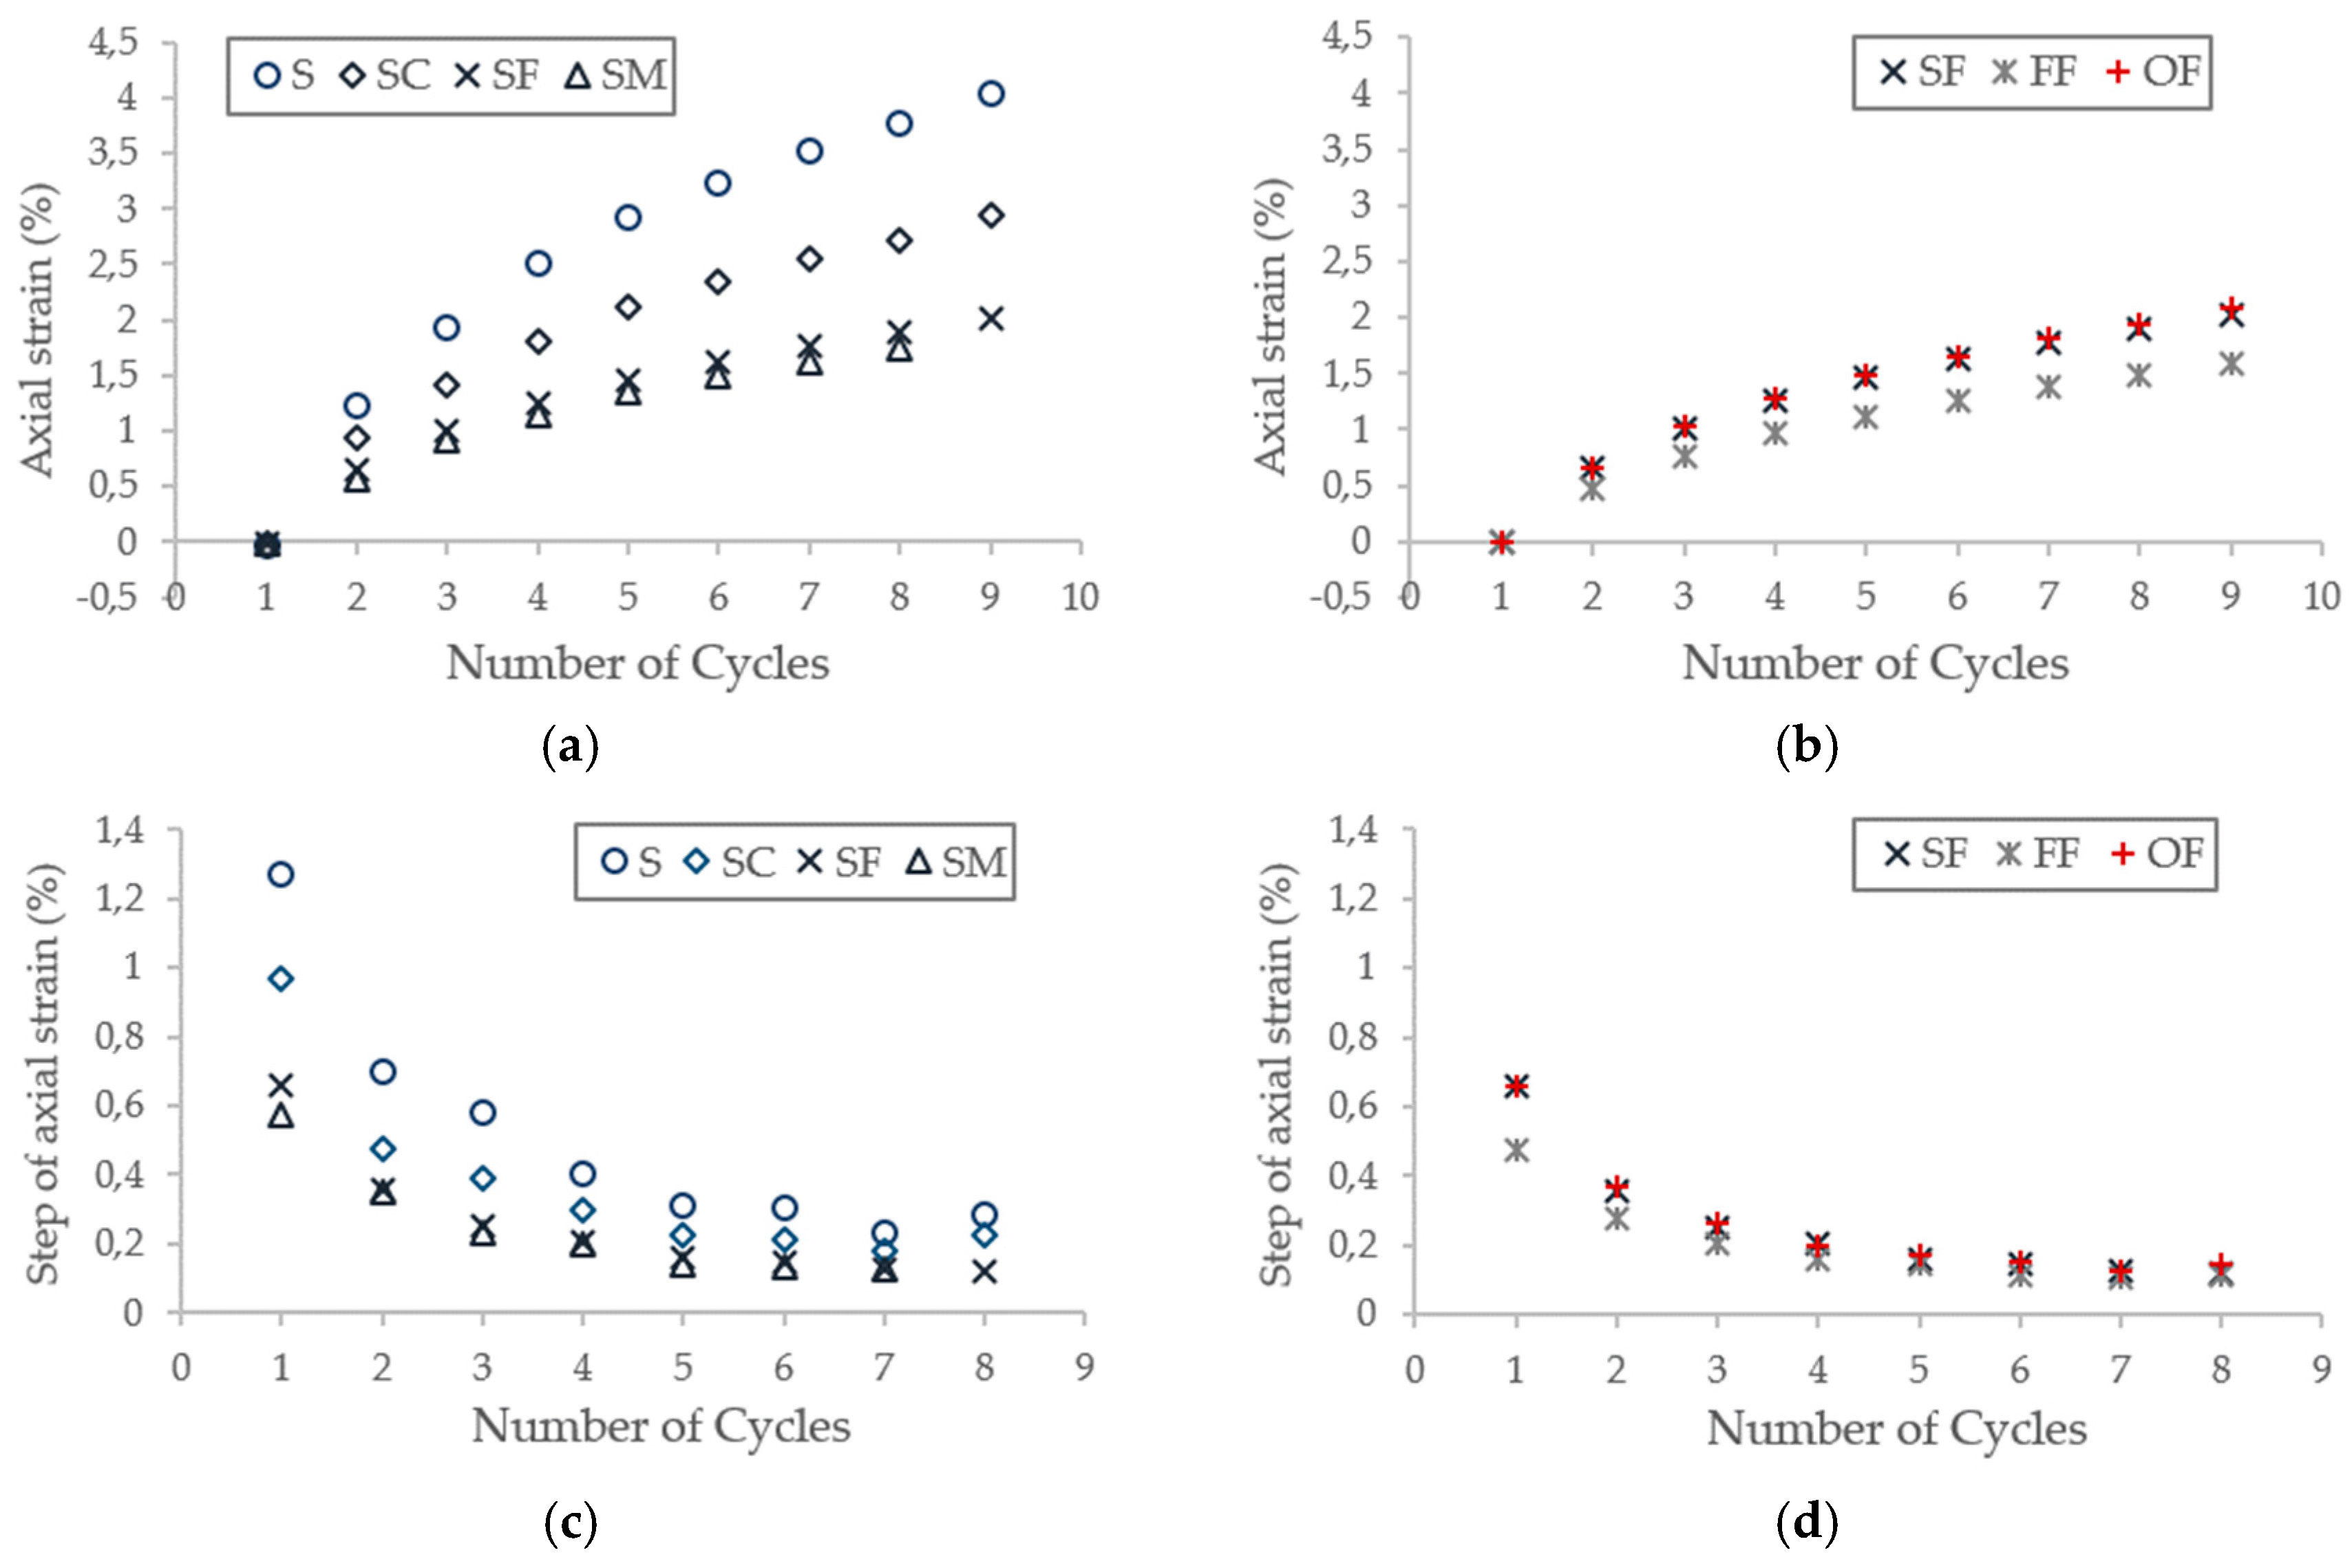
In Figure 4, the strain accumulation and the step of strain accumulation are presented. In each cycle the accumulated strain was increased with decreasing step. For the same carpet the C ceramic sand exhibited the highest strain accumulation and the highest initial step which became similar to the other types of sand for the consecutive cycles. When the ceramic sand was F, the F carpet exhibited slightly lower axial strain and lower first step.
5. Discussion
The presented results display that the response of the synthetic clay court surface was affected by the selection of the carpet and the infill material and by the loading history. The influence of the carpet choice was also demonstrated for artificial turf surfaces [8] (pp. 865–870), while the effect of the material and loading history was investigated for natural turf surfaces [6] (pp. 111–122). In synthetic clay court surfaces, when the same type of carpet was used, the carpet-material combination with the finer (F) and medium (M) ceramic sand had stiffer response, potentially due to the denser state of the material and the different texture compared to the coarser (C) ceramic sand. The coarser ceramic sand had also higher percentage of strain accumulation and initial step of strain accumulation. When a type of ceramic sand was tested with different carpets, the combination with the F carpet provided the highest percentage of energy return and the lowest strain accumulation, with the stiffness being at similar levels.
The results of the compression test are limited by the type of testing and the number of repetitions performed. The confined axial compression allows deformation only on the vertical axis and therefore, the shear deformations were not examined. In addition, the loading rate was three orders of magnitude lower than those experienced by the player during dynamic movements in tennis. Loading rates closer to the real ones will provide a better understanding of the response and the properties of the surface. In addition, the thickness of the samples may have affected the results.
6. Conclusions
The response of the carpet-material combination depends on the type of the carpet and the ceramic sand used. There is an indication that the carpet selection will influence the percentage of energy transformation and the strain accumulation, while the material alteration will have an additional effect on the modulus of the system. The results could be used to select a carpet material combination with the desirable properties and to the initial modelling of the surface response. Further investigation should be carried out at higher loading rates and with additional types of carpet and the influence of water content should also be examined.
Conflicts of Interest
The authors declare no conflict of interest. The funding sponsors had no role in the design of the study; in the collection, analyses, or interpretation of data; in the writing of the manuscript, and in the decision to publish the results.
References
- Kolitzus, H.J. Criteria for the Development of Guidelines/Standards for Sports Surfaces. In Proceedings of the ISSS 3rd Symposium on Sports Surfaces, Calgary, AB, Canada, 1 August 2003. [Google Scholar]
- Colino, E.; Javier, S.S.; García-Unanue, J.; Ubago-Guisado, E.; Haxaire, P. Validity and reliability of two standard test devices in assessing mechanical properties of different sport surfaces. Polym. Test. 2017, 62, 61–67. [Google Scholar] [CrossRef]
- Carré, M.J.; Haake, S.J. An examination of the Clegg impact hammer test with regard to the playing performance of synthetic sports surfaces. Sports Eng. 2004, 7, 121–129. [Google Scholar] [CrossRef]
- ASTM F1976-13; Standard Test Method for Impact Attenuation of Athletic Shoe Cushioning Systems and Materials; ASTM International: West Conshohocken, PA, USA, 2013. [CrossRef]
- Dixon, S.J.; Stiles, V.H. Impact absorption of tennis shoe-surface combinations. Sports Eng. 2003, 6, 1–9. [Google Scholar] [CrossRef]
- Guisasola, I.; James, I.; Stiles, V.; Dixon, S. Dynamic behaviour of soils used for natural turf sports surfaces. Sports Eng. 2010, 12, 111–122. [Google Scholar] [CrossRef]
- Wang, X.; Fleming, P.R.; Dixon, N. Advanced measurement for sports surface system behaviour. Procedia Eng. 2012, 34, 825–830. [Google Scholar] [CrossRef]
- Wang, X.; Fleming, P.; Forrester, S. Advanced Measurement of Sports Surface System Behaviour under Player Loading. Procedia Eng. 2014, 72, 865–870. [Google Scholar] [CrossRef]
- Hübel, H. Basic conditions for material and structural ratcheting. Nuclear Eng. Des. 1996, 162, 55–65. [Google Scholar] [CrossRef]
- Stefanyshyn, D.J.; Nigg, B.M. Energy and Performance Aspects in Sport Surfaces. In Proceedings of the ISSS 3rd Symposium on Sports Surfaces, Calgary, AB, Canada, 01 August 2003. [Google Scholar]
- Swedish Standard EN 933-1; Tests for Geometrical Properties of Aggregates—Part 1: Determination of Particle Size Distribution—Sieving Method; Swedish Standards Institute: Stockholm, Sweden, 2012.
- Starbuck, C.; Stiles, V.; Urà, D.; Carré, M.; Dixon, S. Biomechanical responses to changes in friction on a clay court surface. J. Sci. Med. Sport 2017, 20, 459–463. [Google Scholar] [CrossRef] [PubMed]
Figure 1.
(a) Stress-strain response of the carpet-ceramic sand combination under load controlled cyclic loading when the first irregular cycle is subtracted. (b) Energy transformation in a loading cycle. The diagonally hatched area between the loading-unloading curves corresponds to the dissipated energy whereas the vertically hatched area refers to the recovered energy.

Figure 2.
In each consecutive cycle: (a) Energy dissipation for the S carpet combined with different types of ceramic sand; (b) Energy dissipation for the F ceramic sand and alternating carpets; (c) Energy return for the S carpet combined with different types of ceramic sand; (d) Energy return for the F ceramic sand and alternating carpets.

Figure 3.
In each consecutive cycle: (a) Secant Modulus for the S carpet with alternating types of ceramic sand; (b) Secant Modulus for the F ceramic sand with different carpets; (c) Resilient Modulus for S carpet and varying types of ceramic sand; (d) Resilient Modulus for the F ceramic sand and diverse carpets.

Figure 4.
In each consecutive cycle: (a) Axial strain accumulated for the S carpet with varying ceramic sands; (b) Axial strain accumulated for the F ceramic sand with alternating carpets; (c) Step of axial strain accumulation for the S carpet with different ceramic sands; (d) Step of axial strain accumulation for the F ceramic sand with alternating carpets.


Table 1.
Description of carpets examined: Pattern and way of gluing of each carpet.
| Carpet | Pattern | Gluing |
|---|---|---|
| S | Swiss Cross | Partially glued |
| F | Fishbone | Fully glued |
| O | Oval diagonal | Locally glued |
Table 2.
Properties of ceramic sand examined: Particle size distribution (PSD) according to SS-EN 933-1 Standard [11], median diameter (D50) and moisture content.
Table 2.
Properties of ceramic sand examined: Particle size distribution (PSD) according to SS-EN 933-1 Standard [11], median diameter (D50) and moisture content.
| Ceramic Sand (Designation) | PSD (mm) | D50 (mm) | Moisture (wt %) |
|---|---|---|---|
| C (0.3–0.9) | 0.25–1 | 0.69 | 0.05 |
| M (0.4–0.8) | 0.25–1 | 0.67 | 2.65 |
| F (0.1–0.3) | 0.125–0.5 | 0.24 | 1.69 |
Publisher’s Note: MDPI stays neutral with regard to jurisdictional claims in published maps and institutional affiliations. |
© 2018 by the authors. Licensee MDPI, Basel, Switzerland. This article is an open access article distributed under the terms and conditions of the Creative Commons Attribution (CC BY) license (https://creativecommons.org/licenses/by/4.0/).
Share and Cite
MDPI and ACS Style
Papadopoulou, P.; Karlsteen, M.; Gustafsson, M.; Hulthén, E. Investigation of Synthetic Clay Court’s Response under Cyclic Loading. Proceedings 2018, 2, 280. https://doi.org/10.3390/proceedings2060280
AMA Style
Papadopoulou P, Karlsteen M, Gustafsson M, Hulthén E. Investigation of Synthetic Clay Court’s Response under Cyclic Loading. Proceedings. 2018; 2(6):280. https://doi.org/10.3390/proceedings2060280
Chicago/Turabian StylePapadopoulou, Panagiota, Magnus Karlsteen, Magnus Gustafsson, and Erik Hulthén. 2018. "Investigation of Synthetic Clay Court’s Response under Cyclic Loading" Proceedings 2, no. 6: 280. https://doi.org/10.3390/proceedings2060280