Detailed On-Water Measurements of Blade Forces and Stroke Efficiencies in Sprint Canoe †

Department of Mechanical Engineering, McMaster University, Hamilton, ON L8S 4L7, Canada
*
Author to whom correspondence should be addressed.
†
Presented at the 12th conference of the International Sports Engineering Association, Brisbane, Queensland, Australia, 26–29 March 2018.
Proceedings 2018, 2(6), 306; https://doi.org/10.3390/proceedings2060306
Published: 5 March 2018
(This article belongs to the Proceedings of The 12th Conference of the International Sports Engineering Association)
Abstract
:Measurements of blade forces are made using a load cell mounted between the blade and shaft of a modified paddle. All six force components and moments are measured simultaneously to give a full picture of blade hydrodynamic forces as the centre of pressure on the blade varies throughout the stroke. Blade orientation was also measured using inertial measurement units, one on the blade shaft, and the other on the canoe giving the relative position of blade with respect to the boat, as well as boat speed, acceleration and motion. Testing of the instrumented paddle was undertaken by one of the authors, an ex-national team athlete. The measured forces (and propulsive/vertical forces) are analyzed in detail through the stroke and as stroke averages. Various measures of propulsive efficiency are proposed using either the input force and propulsive force, or using input force and boat speed, and can be used for stroke analysis, or as training tools/targets.
1. Introduction
In sprint canoe, the athletes propel their boats using a paddle with a single blade on one end, with the athlete’s force application transferred to the paddle shaft, levering the boat past the relatively stationary blade as it is placed in the water. The hydrodynamics of the interaction between the moving blade and the water then control how efficiently this athlete force is transferred. There is also an inherent feedback in that the motion of the blade is the product of the athlete technique and force application together with the hydrodynamic resistance (i.e., the blade force). Accurate measurement of the blade forces is then crucial to understanding how the athlete power can be transferred into boat speed, maximising the propulsive efficiency of the athlete, and in possible future changes in blade design.
Previous experimental measurements of forces in sprint canoe are relatively scarce. Stodart et al. [1] developed a strain gauge system measuring shaft bending as a proxy for athlete force, and provided these force profiles through the stroke. A very similar system has recently become commercially available [2]. Similar systems have been developed in rowing [2,3] and kayak [4,5]. However, the single measurements of shaft bending do not capture the full blade loading, which consists of three force components (x, y, z forces in general, or, treating the blade as a hydrofoil, lift and drag and side forces) and the location (in 3D space) of the centre of action of these forces (alternatively expressed as a pitching, roll and yaw moments). To fully quantify the blade forces, all six force and torque components must be measured. It is expected that for relatively flat symmetric sprint canoe blades, that the side forces and roll and yaw moments will be small, and that the blade normal force and pitch moment will dominate.
Morgoch et al. [6] consequently developed an instrumented paddle with 4 sets of strain gauge full bridges along the paddle shaft allowing them to use the differences in the bending moment measurements to track of the distance along the blade of the centre of pressure of the blade force (i.e., the pitching moment) through the stroke. Two force components (blade normal, and vertically along the shaft) were also obtained, although they discussed how their approach did not allow good measurement of the vertical force due to the high compressive/tensile stiffness of the carbon fibre shaft. Results for the low rate/low power strokes presented showed a migration of the centre of pressure through the stroke from the blade tip at entry to roughly the middle of the blade, but without showing the expected return towards the tip during the end of the stroke and blade extraction from the water.
The objective here is to provide a full measurement of all of the blade forces and moments using a 6 degree-of-freedom load cell for race-like sprint canoe strokes. With the full force information and measurements of blade orientation through a stroke, a decomposition of the forces into propulsive and other components can be done similar to that developed by Morgoch and Tullis [7], which was based solely on blade path analysis. Various measures of instantaneous and stroke average efficiency measures can also be developed.
2. Methodology
A six degree-of-freedom (all three forces and three torques), waterproof load cell transducer (ATI Mini58 IP68) is mounted between the shaft and blade of a sprint canoe paddle. The key dimensions of the modified Braca ExtraWide (24 cm) sprint canoe paddle are the same as that used regularly by the athlete, and are presented in Table 1. The load cell is connected by wire through the paddle shaft then along the athlete’s upper arm and back to a small lightweight ATI wireless transmitter with a direct wifi connection (at 76 Hz) to the data acquisition laptop computer on an accompanying coach boat. This wireless system has a minimal impact on the athlete’s motion and with a range of about 50 m allows the real-time monitoring of the measurements.
A 9DOF inertial measurement unit (IMU) is attached to the blade shaft in a small waterproof enclosure. This allows the orientation of the blade to be simultaneously recorded. Pitch is the off-vertical fore(−)-aft(+) angle, roll is the off-vertical beamwise angle (negative away from the side of the hull) and yaw is the angle about the vertical axis of the blade shaft (here defined relative to the boat yaw angle at the catch of each stroke, with positive angles defined as the blade aft pressure surface facing away from the boat). A similar IMU but with a GPS sensor is attached to the boat giving boat speed, pitch and roll measurement, and allowing the differential measurement of the blade yaw. These two IMUs connect to the data acquisition computer using Bluetooth with a range of up to 30 m. Blade and boat orientation data is sampled at 90 and 82 Hz respectively, while the GPS velocity is at 10 Hz.
The blade was tested using one of the authors (DM, an ex-national team member) as the athlete. Data was recorded from an accompanying coach boat. A range of stroke powers and lengths were examined after an extensive commissioning procedure. The results presented here mainly focus on strokes undertaken at a 1000 m race pace.
3. Results and Discussion
3.1. Blade Orientation and Forces through a Stroke
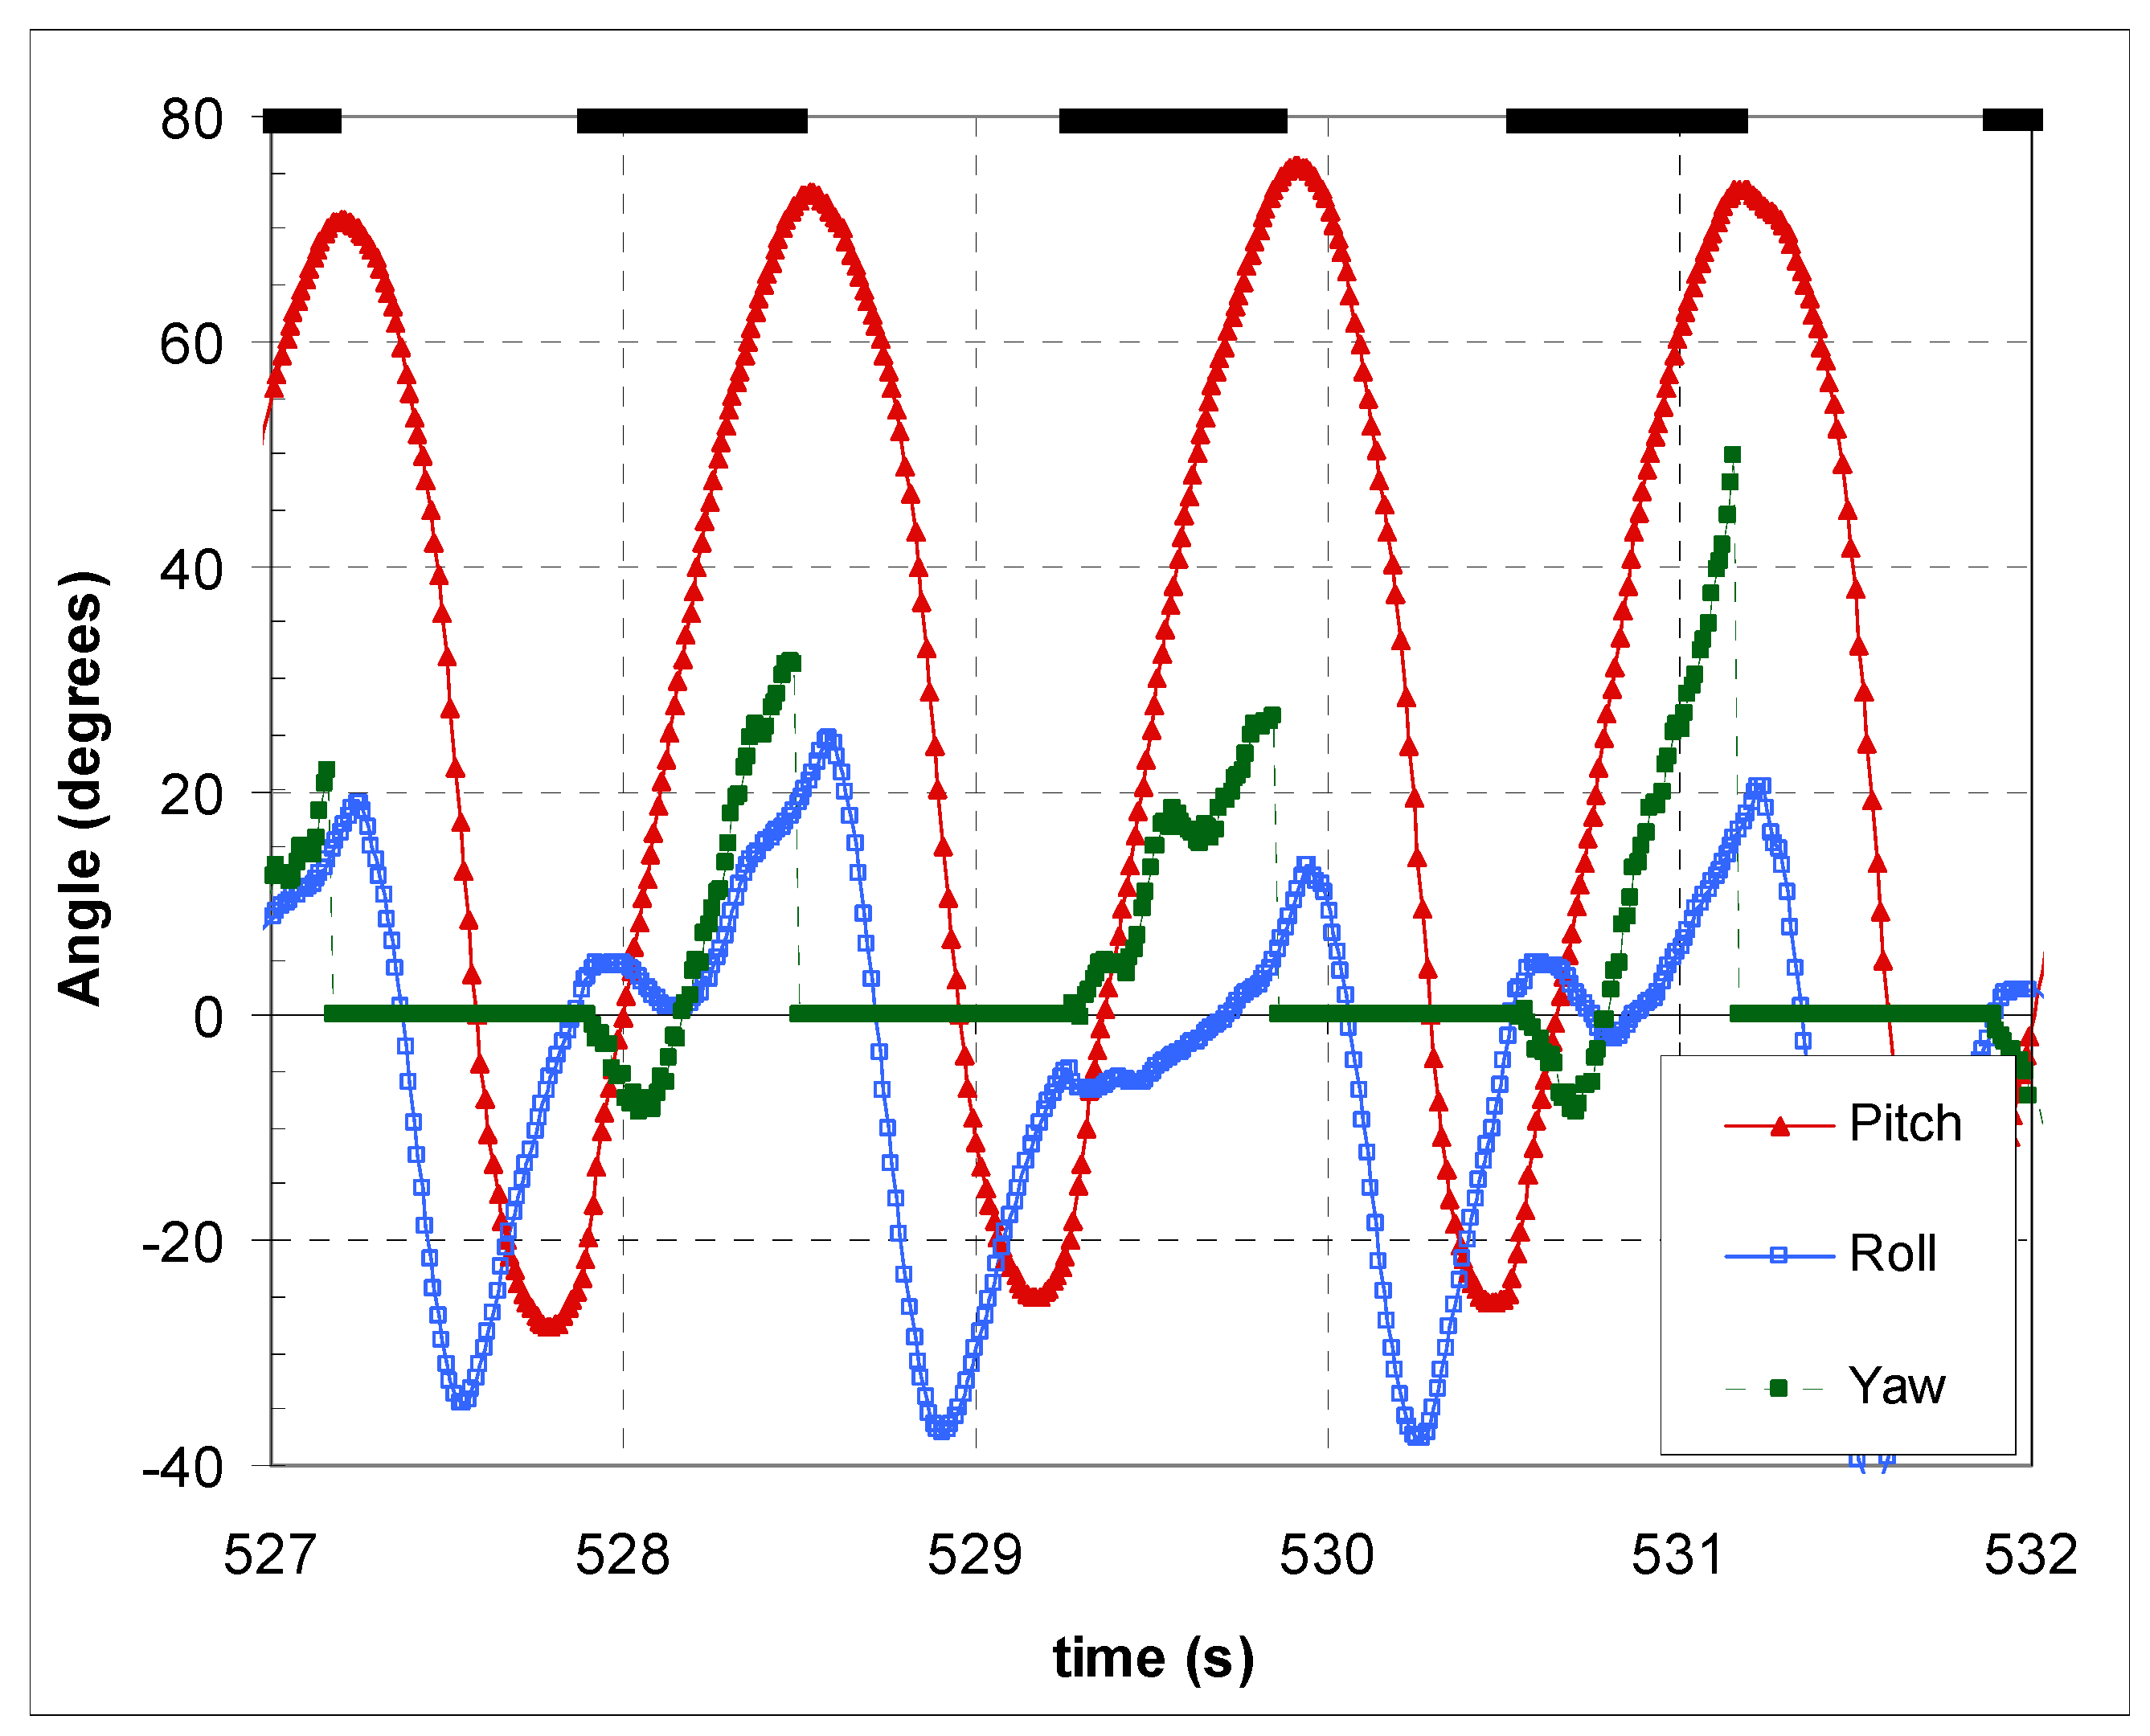
Figure 1 shows the blade orientation for a set of four strokes at a 1000 m race pace. While the blade is in the water, the blade is essentially travelling on a vertical fore-aft plane through the catch and drive of the stroke. Roll is within 5° of vertical during catch and early part of the drive phases of the stroke, but increases to up to 25° towards the finish, and similarly, yaw is within 10° of flat during catch but increases to over 40° at the finish depending on the amount of steering done.
The blade pitch angles are highly consistent with elite athletes; here, at this pace, the pitch angle at blade entry of −26.5° was maintained within 1.5°. After the initial blade entry, the pitch rate (i.e., the rotation rate) remains relatively constant for the catch and drive phases, but slows during the blade exit.
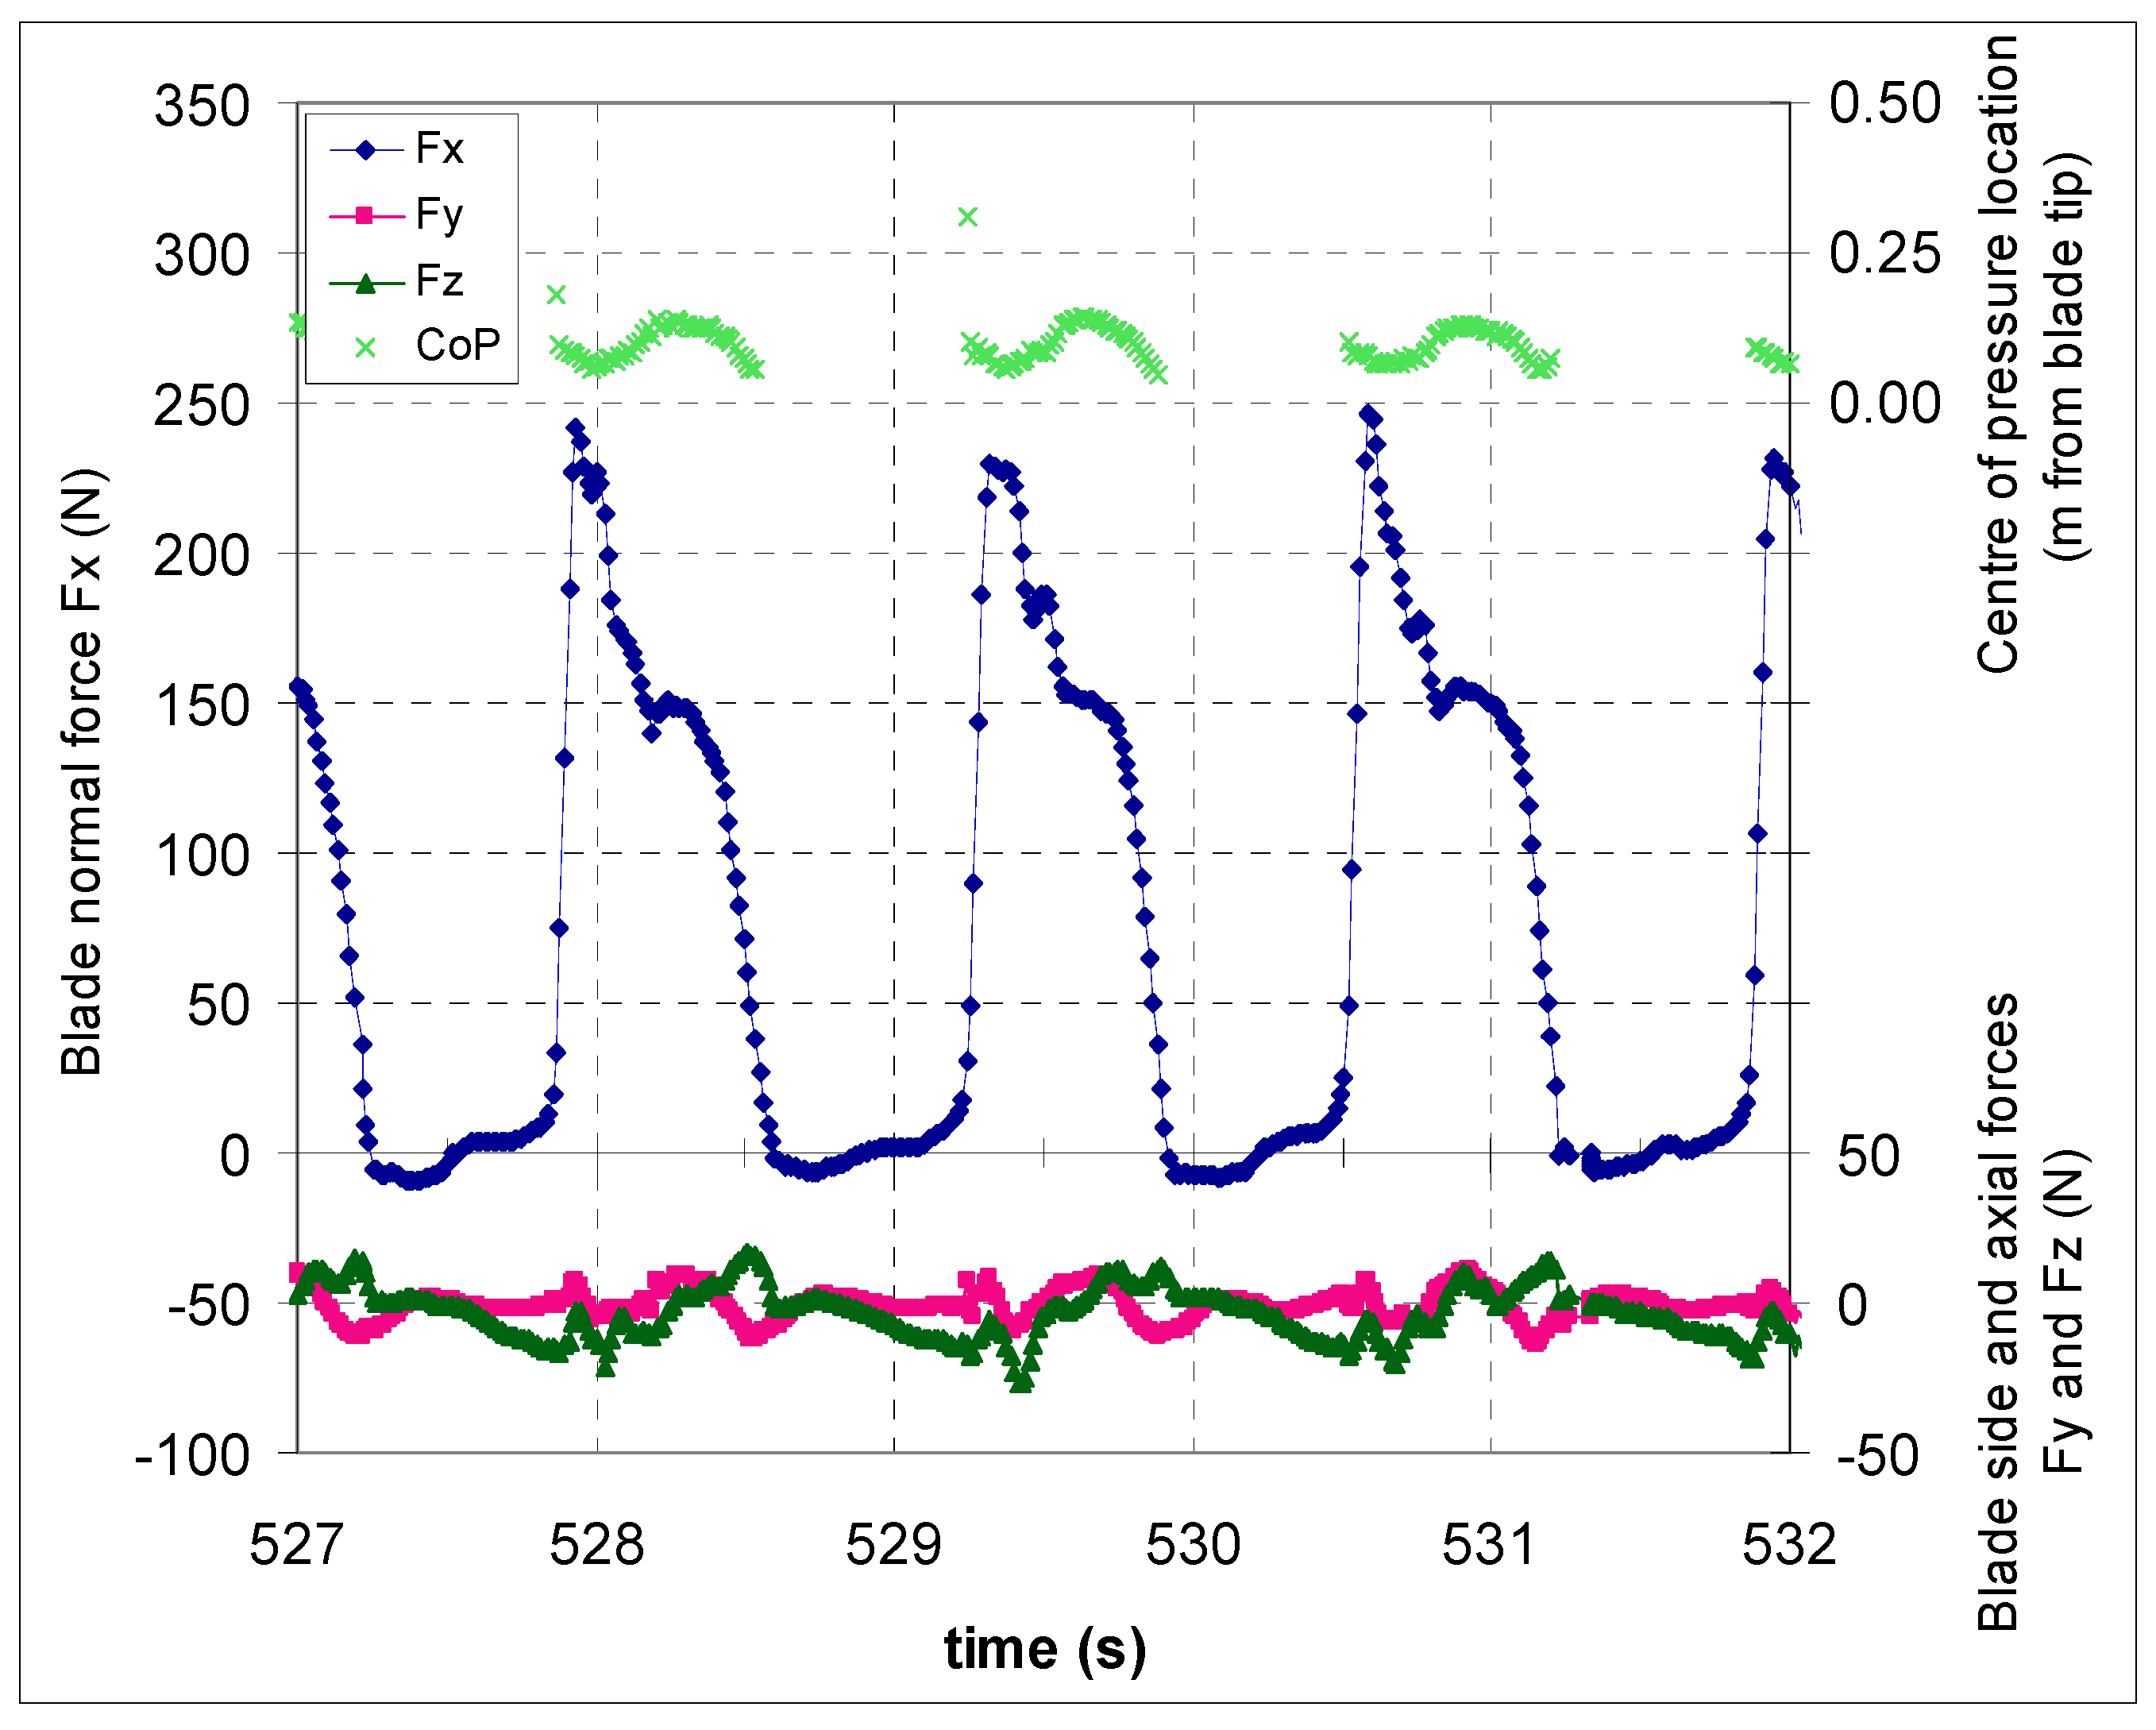
The raw blade forces measured during the same interval are shown in Figure 2. The blade face normal force (Fx) dominates the forces seen, here rapidly rising to a peak of 200–250 N during the catch. There is a distinct shoulder shape to this force profile corresponding to the draw phase of the stroke. The blade side forces (Fy) are much smaller, usually less than about 15 N during stroke with the largest values seen during the final 1/3 of stroke during steering at blade exit. The compressive/tensile force along the blade shaft (Fz) is also small relative to the blade normal force, and is only in the range of −20 N (compressive) at the catch and +10 N (tensile) during exit. The very small Fy and Fz forces are expected given the essentially flat blade surface of this Braca paddle. It can also be seen that the blade forces are not exactly zero while the blade is in the air between strokes—these are mainly the result of air drag forces (the negative blade normal forces Fx) and centripetal loading (seen as tensile Fz loading) as the blade is rapidly swung back towards blade entry.
The location of the net forces acting on the blade (i.e., the centre of action, or centre of pressure, as pressure is the main force acting on the blade) is important in determining the force decomposition and effects on boat propulsion. Considering only the blade normal force, this location is equivalent to knowing the pitching moment on the blade. Simple single location strain gauges measuring blade bending must assume a centre of pressure somewhere on the blade. Our group’s previous multiple stain gauge system [6] could roughly determine this location by tracking the difference in blade bending along the shaft, and suggested the centre of pressure started at the blade tip during entry and settled at mid blade after the catch phase (about 50% of way through stroke). It should be noted that the data presented in [6] was for low speed, low rate (36 SPM) low power paddling with a different athlete. Here, the pitch torque is measured directly in the load cell transducer under higher power, faster rate conditions (Figure 2). The centre of action is seen to increase to approximately 8–9 cm from the blade tip during the rapid blade entry, dip slightly to about 6–7 cm during the end of the catch/start of the draw, then move up the blade to about 12–14 cm during the draw (at the shoulder of the force profile), before finally moving to the tip as the blade is extracted. These more blade tip based forces are in better agreement with the CFD results also presented in [6].
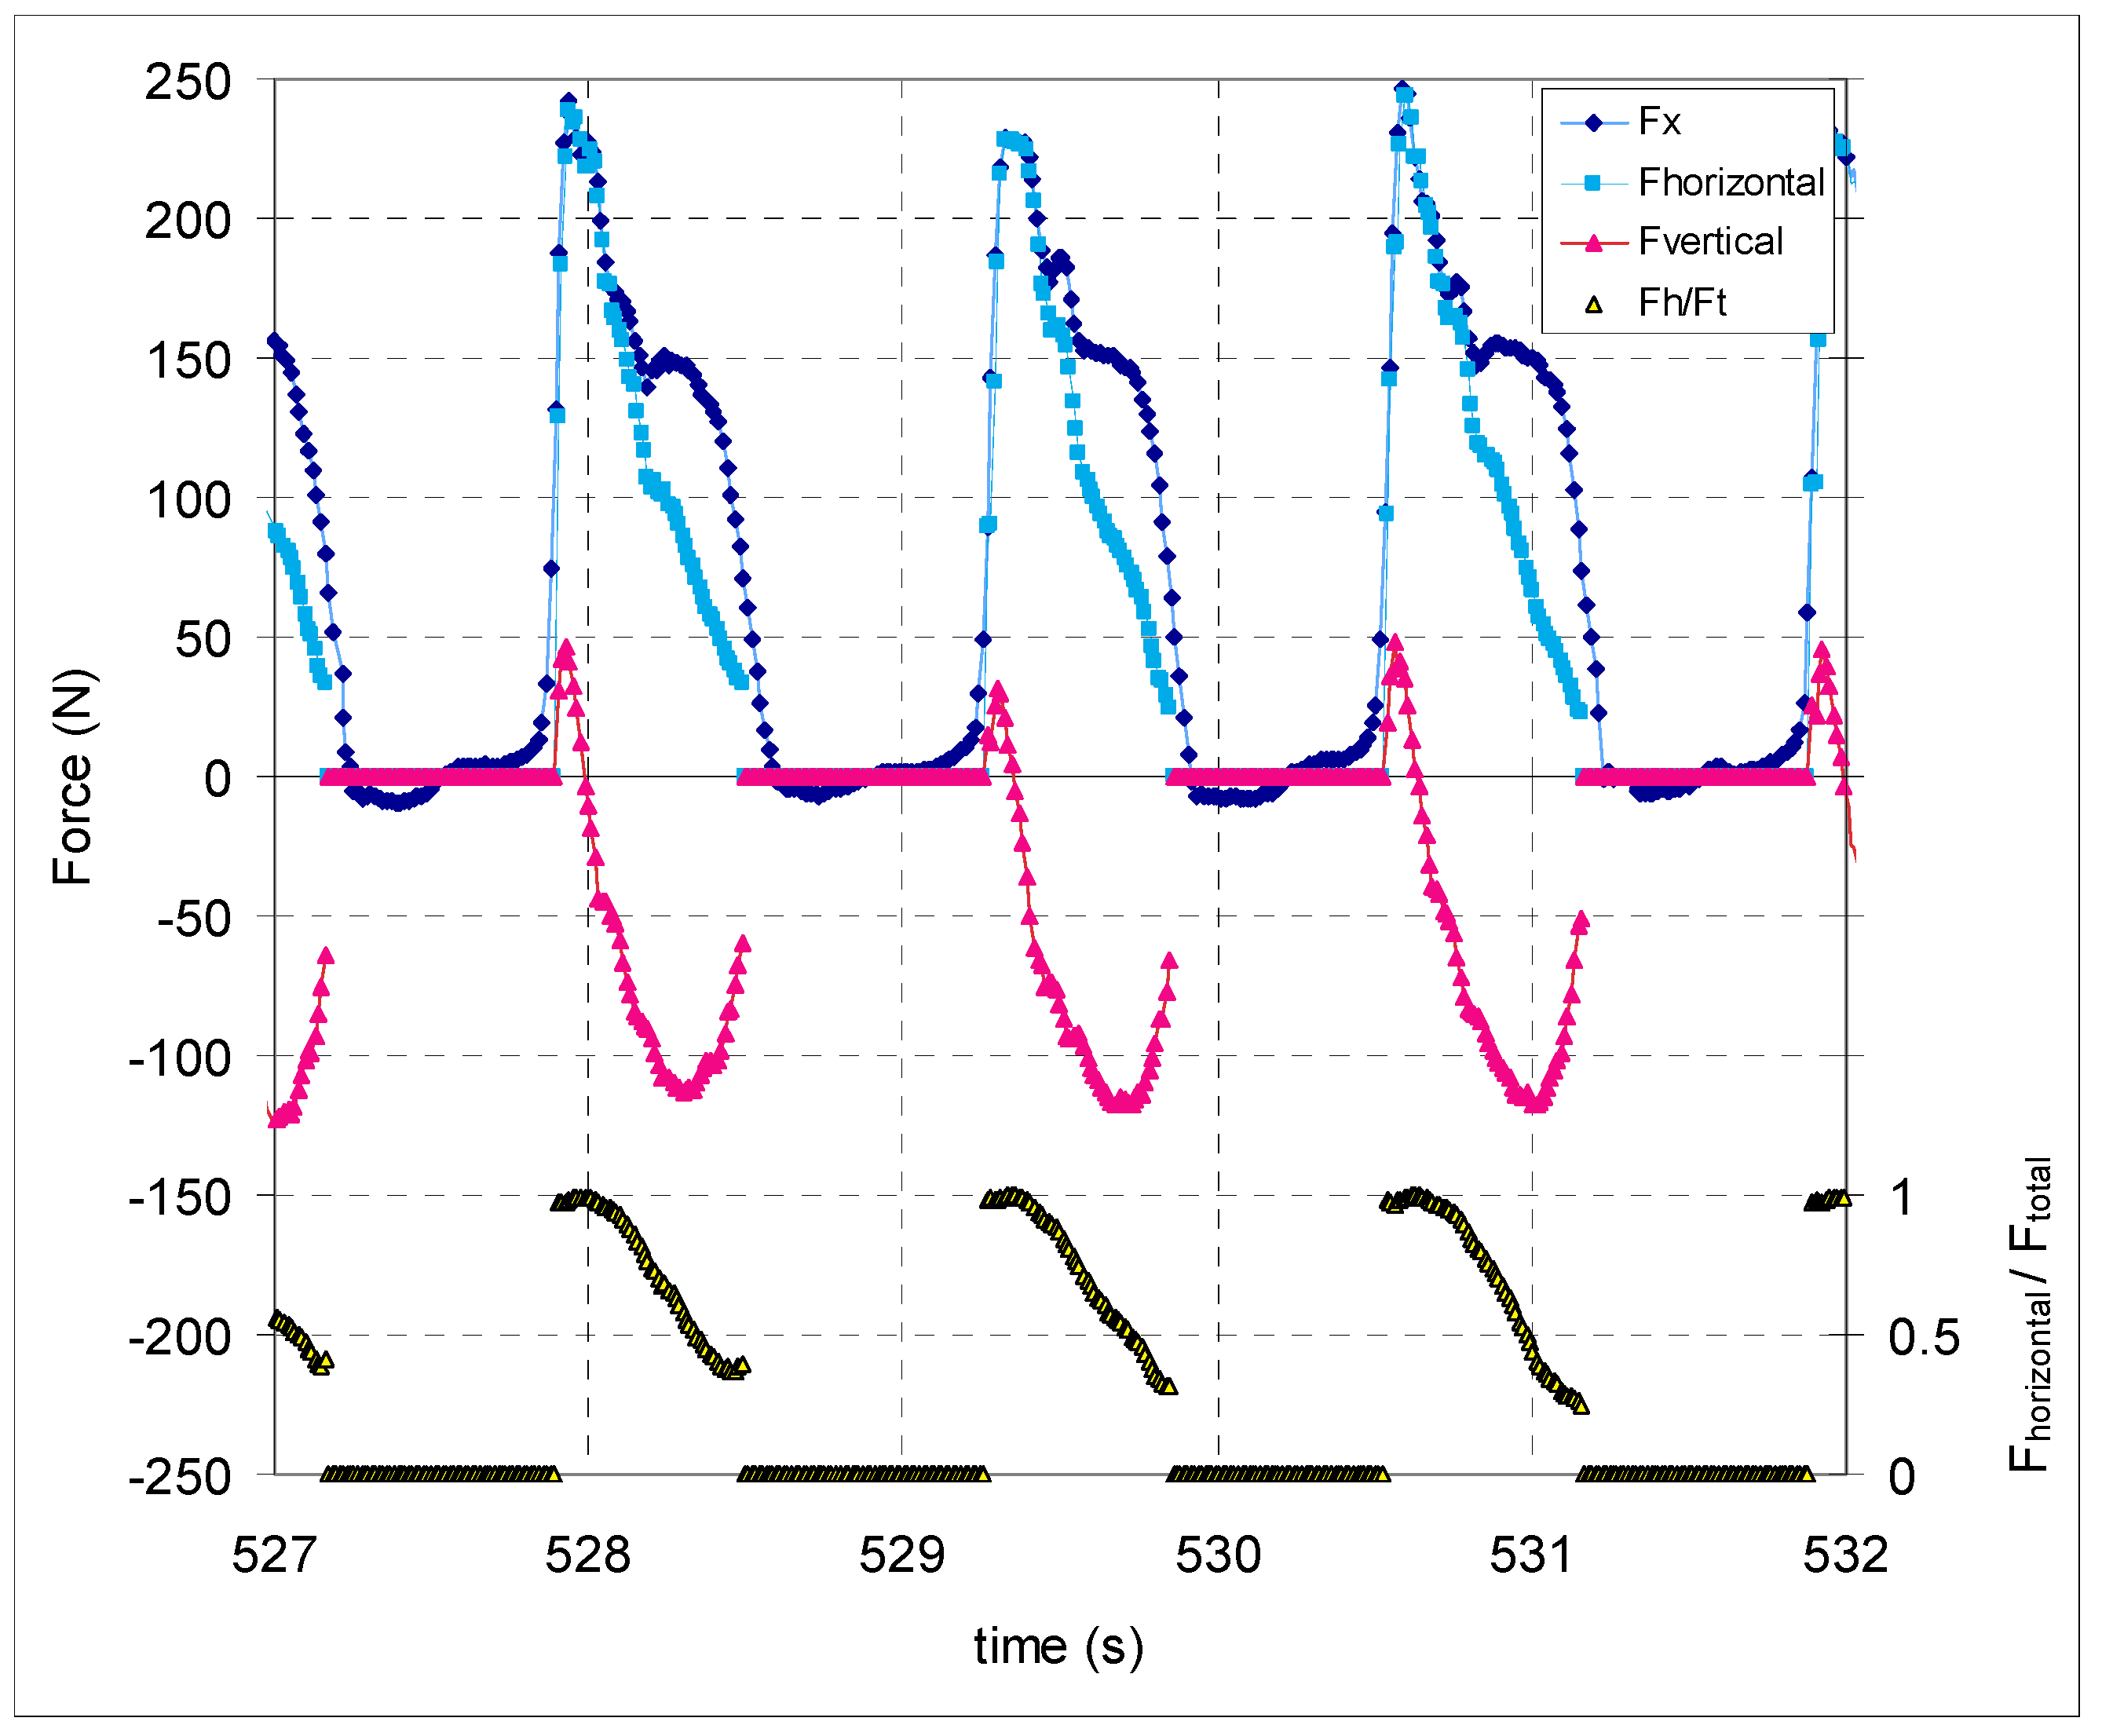
The blade forces can be decomposed into horizontal (propulsive), vertical and side forces through the stroke (Figure 3). The dominance of the blade normal force and low pitch angle, nearly-in-plane motion, results in the horizontal force very closely matching the blade normal force during the catch through to about mid-stroke. Thereafter, this propulsive force decreases to zero without the shoulder seen in the blade normal force. The vertical component of the blade force is upwards (30–70 N) during the early part of catch of the stroke, but is downwards through the bulk of the stroke with maxima of 100–130 N around the end of the draw phase. Such large downward forces can be seen in the vertical acceleration of the boat and has a significant drag penalty both by increasing the wetted area of the canoe hull and in wave production. The side force component is dominated by the blade normal force coupled with the yaw of the blade, and is consequently small except at the end of stroke (with high stroke-to-stroke variation) when the boat is being actively steered.
3.2. Blade/Stroke Efficiency
Various measures of propulsive efficiency can be proposed using either the input (overall) force and useful output (propulsive) force, or using input force and boat speed. These efficiencies are both instantaneous and stroke-integrated quantities.
3.2.1. Instantaneous Efficiencies through the Stroke
The most classical “propulsive efficiency” would be defined as power output (as a propulsive force times boat velocity) divided by the athlete power input. Defining athlete power would technically be a sum of the athlete hand forces applied to the blade shafts times their respective velocities (with each hand then has its own power output). However, this quantity is difficult to calculate as here we have only blade orientation, not total velocities. Using the instantaneous boat velocity is problematic as it not just a function of the propulsive force, but is also highly affected by the significant fore-aft motion of the athlete’s centre of mass through a stroke.
A more straightforward approach could be to just take the ratio of the propulsive component of the blade forces to the total force on the blade whenever the blade is in the water (shown in Figure 3). During the strokes examined here, this force ratio is close to 1 through the catch phase then decreases roughly linearly with time through the rest of the drive and exit phases. Using a value of force ratio of 0.9 as the start of the decline, gives a coincidence with a vertical pitch angle of +21° ± 3° and the start of the increase in blade yaw angle (i.e., steering). The force ratio, by definition is associated with the increase in negative vertical force (which also increases wetted area and drag), and with the large vertical forces seen here, represent a possible technique modification opportunity.
3.2.2. Stroke Average Efficiencies
The stroke average force ratio is calculated here as the ratio of the propulsive impulse to the total blade impulse while the blade is in the water as:
Full stroke and in-water impulses here are the same because the propulsive force and total forces are both considered zero when the blade is out of the water. An alternative to this approach would be to simply average the instantaneous force ratios, but this would not give proper weighting to the overall blade power—low efficiencies at low power would be considered the same as low efficiencies at high power.
In using stroke averages (where the net athlete acceleration is zero), another approach is possible—relating the stroke average total blade force to the average boat speed , or more accurately, a force required to maintain an average boat speed, as:
An exponent of a = 2 would represent the drag force increase with velocity due to skin friction drag, although wave drag is more linearly related to boat speed giving an exponent of a = 1. For similar thin hulls at near displacement speed, drag is often related to speed with an intermediate exponent between a = 1 and a = 2 (here, coasting without paddling has an exponent of approximately 1.9), although the effect of hull motion (mainly pitch and heave cycling) on sprint canoe drag remains unclear—upwards lift (heave) reduces wetted area, but the wavemaking effects of both blade force induced and athlete motion induced pitch and heave are not well quantified. Using the stroke-average force in this relationship accounts for the time that the blade is not in the water, so this is a measure of the overall applied force that can be related to the ultimate target of average boat speed.
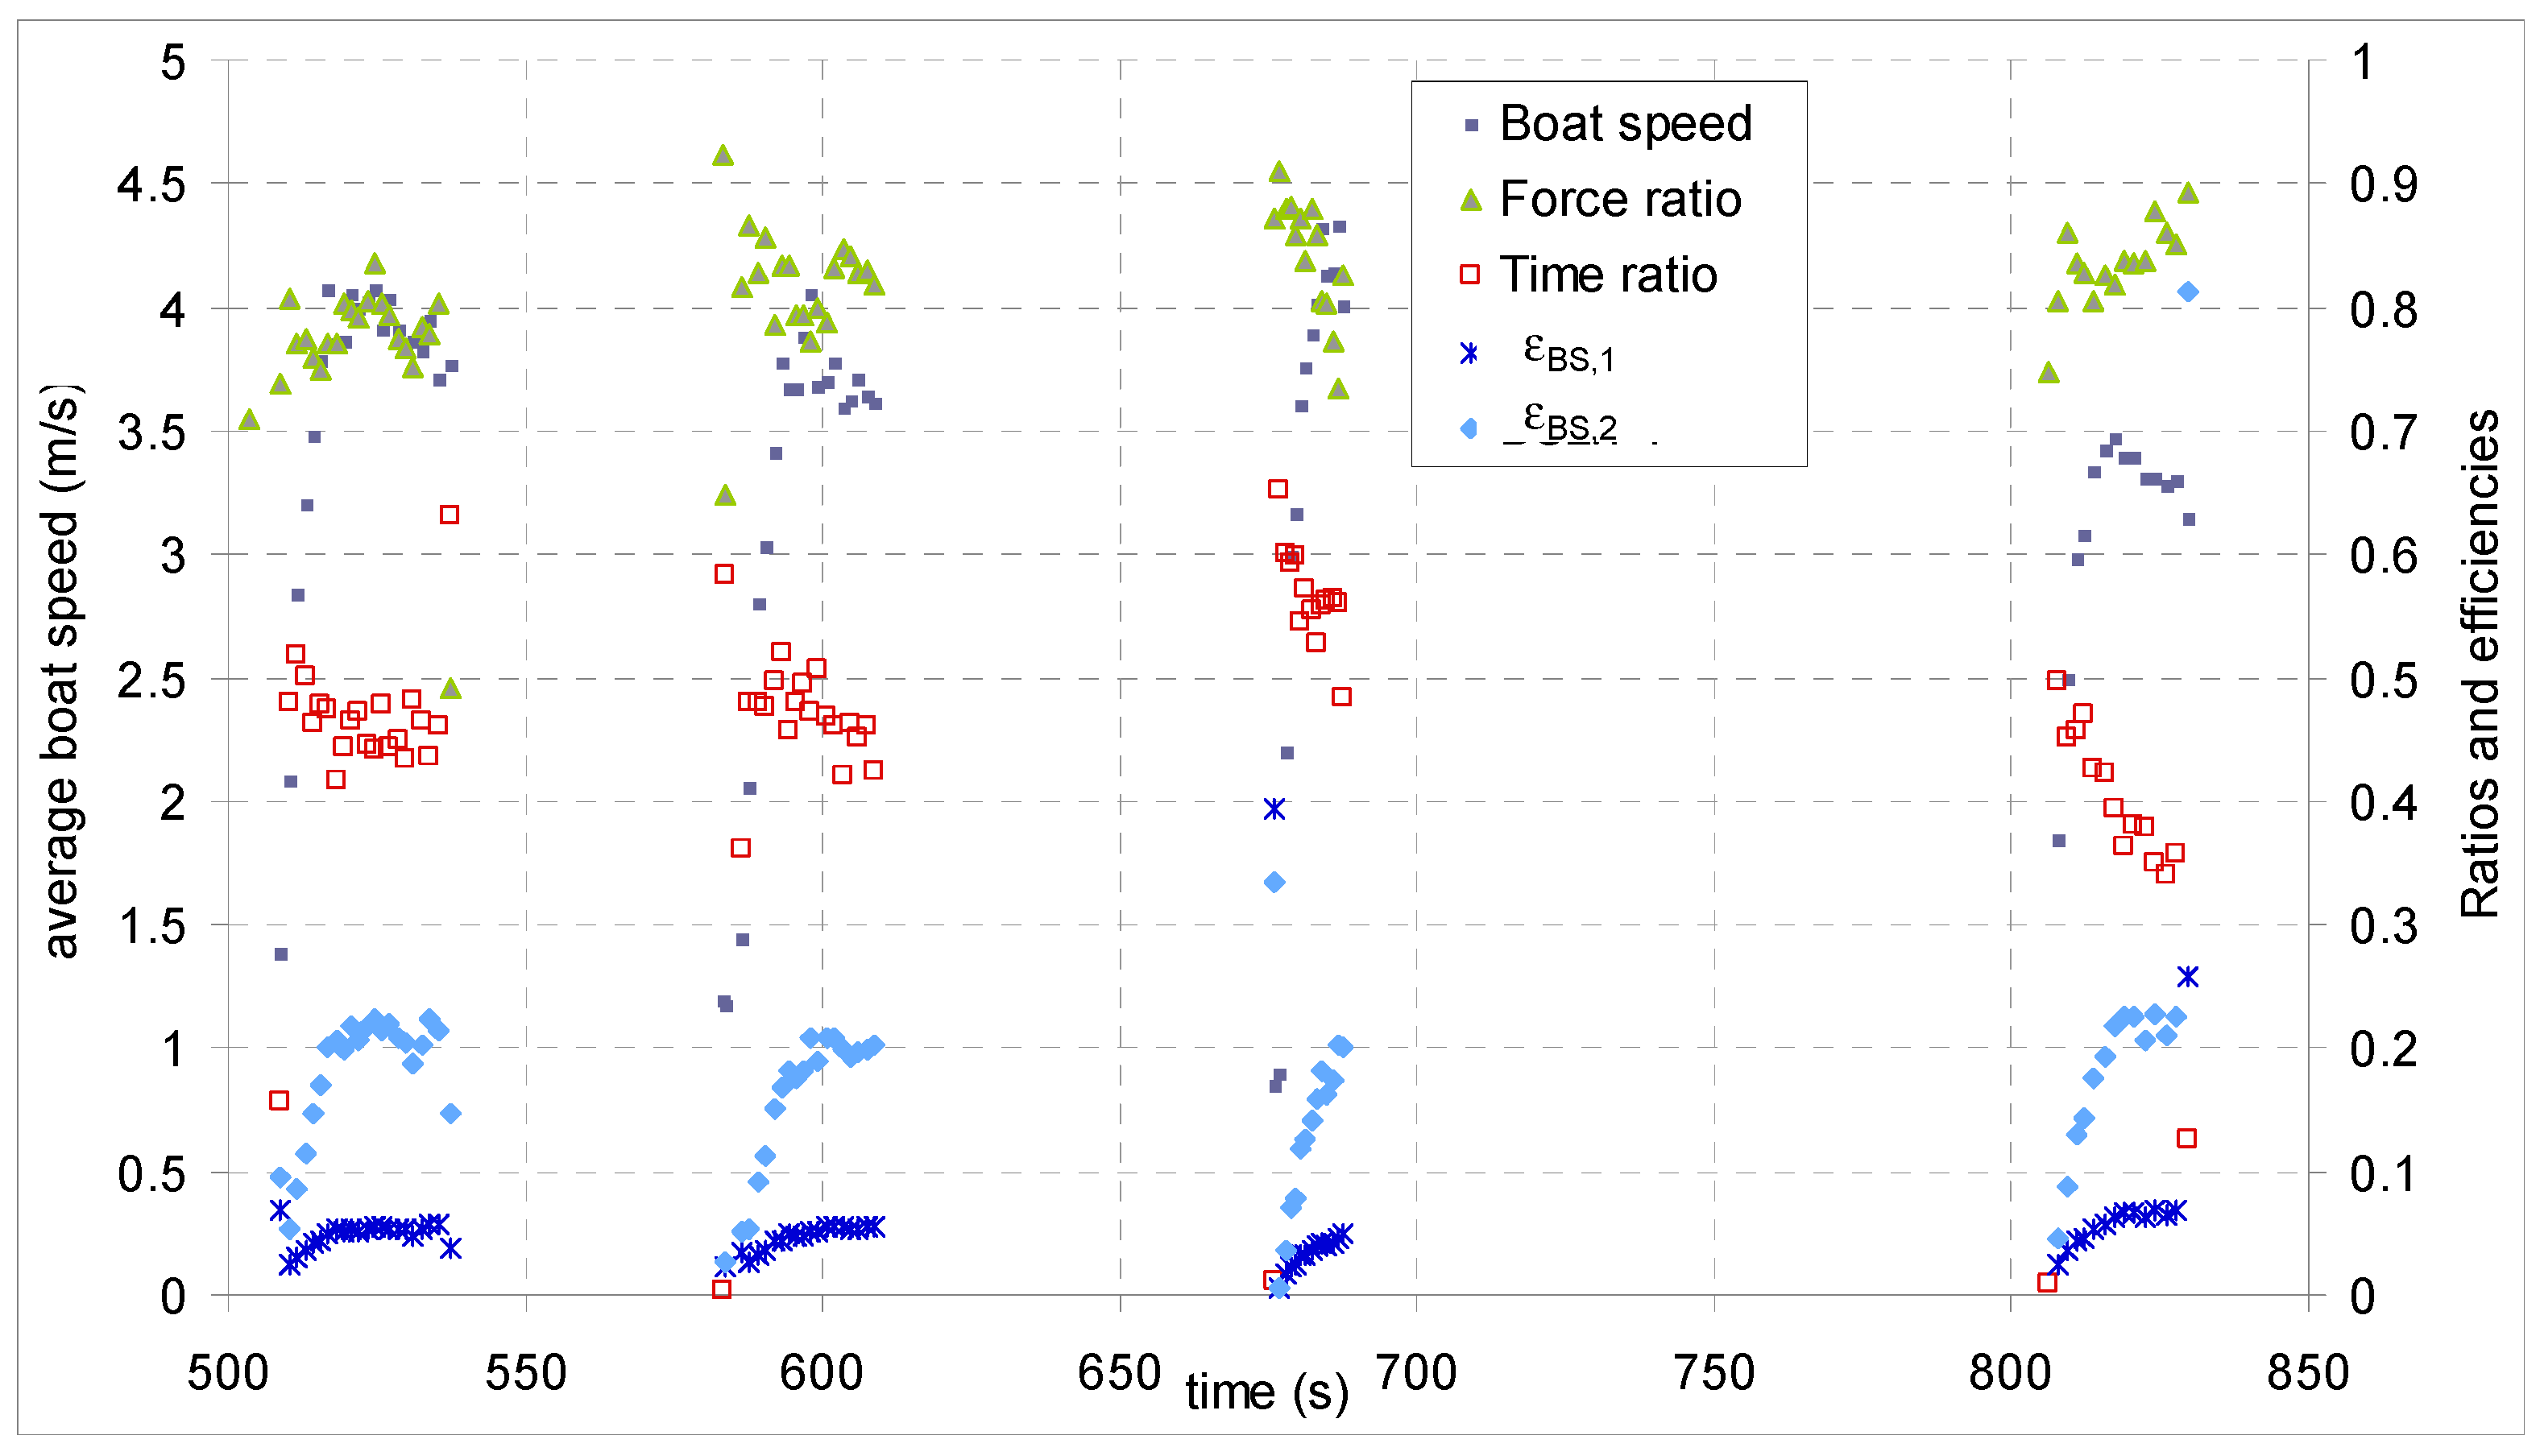
Figure 4 and Table 2 show and summarize three separate sets of strokes (pieces): the first two are repeats of a build to, then maintenance of, a 1000 m race pace, the third is a more technical piece at a lower athlete power (“75% power”) and stroke rate. The propulsive to total force ratio appears to distinguish between the two 1000 m pace set pieces; there is a clear increase in , suggesting an increase in efficiency for the second piece as more of the athlete force input is going toward boat propulsion. This increase in is the result of a reduced vertical force decreasing the total force while the propulsive force remained relatively constant. However, the boat speed is 0.2 m/s less for the second piece, while one should again note that the two pieces have almost identical propulsive forces. Of course, the vertical blade forces (the main component of the non-propulsive forces) affect boat speed. But the reduction in boat speed given almost identical propulsive force and improved , suggests that the propulsive to total force ratio, although worth having, is not the ideal measure of stroke efficiency.
Using the boat “drag force” to stroke average total blade force ratio εBS, the two 1000 m pace pieces have roughly equal efficiencies, but the relative rank of each piece depends on the exponent “a”. For the technical 75% power piece, εBS,1, is considerably higher than the 1000 m pace pieces, even though εBS,2 is similar. An intermediate exponent a that matches the real boat performance, would then probably give the best results, and would result in the two 1000 m pace pieces having efficiencies nearly equal to each other but lower than that of the technical 75% power piece. Regardless, at any given boat speed (or athlete power), increasing either or εBS is a worthy target.
4. Conclusions
Detailed measurements of the forces on a sprint canoe paddle under realistic on-water testing have been made. The use of a 6 component load cell transducer allowed the accurate determination of all of the blade forces, without the need to assume a centre of pressure or action on the blade. Indeed, the motion of the centre of pressure could be tracked through a stroke. Various approaches to evaluating the efficiency on an instantaneous or stroke-average basis were also developed and tested using the on-water measurements. The most useful are the instantaneous propulsive to overall force ratio, and the stroke-average boat force to total blade force ratio.
References
- Stothart, J.; Reardon, F.; Thoden, J. A system for the evaluation of onwater stroke force development during canoe and kayak events. In Proceedings of the ISBS-Conference Proceedings Archive, Seoul, Korea, 14–18 July 2008; Volume 1. [Google Scholar]
- One Giant Leap, Nelson/Gisborne New Zealand. Available online: http://onegiantleap.co.nz/ (accessed on 1 September 2017).
- Kleshnev, V. Propulsive efficiency of rowing. In Proceedings of the XVII International Symposium on Biomechanics in Sport, Edith Cowan University, Perth, Australia, 30 June–6 July 1999; pp. 224–248. [Google Scholar]
- Caplan, N.; Gardner, T.N. A fluid dynamic investigation of the Big Blade and Macon oar blade designs in rowing propulsion. J. Sports Sci. 2007, 25, 643–650. [Google Scholar] [CrossRef] [PubMed]
- Baker, J. Evaluation of biomechanic performance related factors with on-water tests. In International Seminar on Kayak-Canoe Coaching and Science; Vrijens, J., Ed.; University of Gent Press: Gent, Belgium, 1998; pp. 50–66. [Google Scholar]
- Morgoch, D.; Galipeau, C.; Tullis, S. Sprint canoe blade hydrodynamics-modeling and on-water measurement. In Proceedings of the 11th conference of the International Sports Engineering Association, Delft, The Netherlands, 11–14 July 2016. [Google Scholar]
- Morgoch, D.; Tullis, S. Force analysis of a sprint canoe blade. Proc. Inst. Mech. Eng. Part P J. Sports Eng. Technol. 2011, 225, 253–258. [Google Scholar] [CrossRef]
Figure 1.
Blade orientation through a series of four strokes at 1000 m race pace. The black bars at the top of the figure denote when the blade is in the water. Yaw values are only given when the blade is in the water.
Figure 1.
Blade orientation through a series of four strokes at 1000 m race pace. The black bars at the top of the figure denote when the blade is in the water. Yaw values are only given when the blade is in the water.

Figure 2.
Blade forces measured at the load cell transducer through a series of four strokes at 1000 m race pace. For clarity, the blade normal force Fx (left axis) is displaced from the blade side (Fy, negative is away from the side of the boat) and axial (Fz, negative is vertically upward along the shaft) forces. The location of the centre of pressure (based on only the blade normal force and blade pitching moment) is also plotted on the top right axis.

Figure 3.
Horizontal (propulsive) and vertical force decomposition of blade forces, while the blade is in the water. Blade normal force from Figure 2 is shown for comparison. Also shown is the instantaneous ratio of the propulsive force to total blade force.
Figure 3.
Horizontal (propulsive) and vertical force decomposition of blade forces, while the blade is in the water. Blade normal force from Figure 2 is shown for comparison. Also shown is the instantaneous ratio of the propulsive force to total blade force.

Figure 4.
Stroke averaged boat speed and time in the water to overall stroke time ratio versus various measures of stroke average efficiency. Each data point corresponds to an individual stroke. The set of strokes starting around t = 675 s is a race-like start.
Figure 4.
Stroke averaged boat speed and time in the water to overall stroke time ratio versus various measures of stroke average efficiency. Each data point corresponds to an individual stroke. The set of strokes starting around t = 675 s is a race-like start.


Table 1.
Sprint canoe paddle and athlete main dimensions. Locations are given from the top of the paddle (i.e., top hand location = 0 m).
Table 1.
Sprint canoe paddle and athlete main dimensions. Locations are given from the top of the paddle (i.e., top hand location = 0 m).
| Paddle length (m) | 1.770 |
| Bottom hand location (middle finger) (m) | 0.945 |
| Load cell location (m) | 1.150 |
| Blade length (m) | 0.50 |
| Athlete height (m) | 1.90 |
Table 2.
Summary of stroke averaged quantities and efficiency measures for three of the pieces shown in Figure 4. Quantities are averaged over the number of strokes considered for each piece when the stroke speeds and forces, and boat speeds had settle to approximately steady values.
Table 2.
Summary of stroke averaged quantities and efficiency measures for three of the pieces shown in Figure 4. Quantities are averaged over the number of strokes considered for each piece when the stroke speeds and forces, and boat speeds had settle to approximately steady values.
| Piece # Description | 1 1000 m Race Pace | 2 1000 m Race Pace | 3 Technical 75% Power |
|---|---|---|---|
| Time interval considered (s) | 520–535 | 598–608 | 818–828 |
| Number of strokes considered | 11 | 8 | 6 |
| Stroke rate (SPM) | 46 | 46 | 34 |
| Stroke in-water time | 0.60 | 0.61 | 0.64 |
| Time in-water/total stroke time | 0.46 | 0.46 | 0.36 |
| Propulsive force (N) | |||
| (in-water average) | 128 | 123 | 118 |
| (stroke average) | 58 | 57 | 50 |
| Vertical force (N) | |||
| (in-water average) | −63 | −43 ± 8 | −32 |
| (stroke average) | −29 | −20 | −11 |
| 0.79 | 0.82 | 0.85 | |
| (m/s) | 3.95 | 3.72 | 3.33 |
| 0.053 | 0.054 | 0.066 | |
| 0.21 | 0.20 | 0.22 |
Publisher’s Note: MDPI stays neutral with regard to jurisdictional claims in published maps and institutional affiliations. |
© 2018 by the authors. Licensee MDPI, Basel, Switzerland. This article is an open access article distributed under the terms and conditions of the Creative Commons Attribution (CC BY) license (https://creativecommons.org/licenses/by/4.0/).
Share and Cite
MDPI and ACS Style
Tullis, S.; Galipeau, C.; Morgoch, D. Detailed On-Water Measurements of Blade Forces and Stroke Efficiencies in Sprint Canoe. Proceedings 2018, 2, 306. https://doi.org/10.3390/proceedings2060306
AMA Style
Tullis S, Galipeau C, Morgoch D. Detailed On-Water Measurements of Blade Forces and Stroke Efficiencies in Sprint Canoe. Proceedings. 2018; 2(6):306. https://doi.org/10.3390/proceedings2060306
Chicago/Turabian StyleTullis, Stephen, Cameron Galipeau, and Dana Morgoch. 2018. "Detailed On-Water Measurements of Blade Forces and Stroke Efficiencies in Sprint Canoe" Proceedings 2, no. 6: 306. https://doi.org/10.3390/proceedings2060306