Utilising GPS Data to Quantify Torso Range of Motion in Field Hockey Athletes †


1
School of Exercise Science, Australian Catholic University, Brisbane 4014, Australia
2
Sport Performance Innovation and Knowledge Excellence Unit, Queensland Academy of Sport, Brisbane 4111, Australia
*
Author to whom correspondence should be addressed.
†
Presented at the 12th Conference of the International Sports Engineering Association, Brisbane, Queensland, Australia, 26–29 March 2018.
Proceedings 2018, 2(6), 294; https://doi.org/10.3390/proceedings2060294
Published: 12 February 2018
(This article belongs to the Proceedings of The 12th Conference of the International Sports Engineering Association)
Abstract
:Global Positioning System (GPS) along with micro-electrical mechanical system (MEMS), technology is now commonplace in today’s sporting environment. Little has been published utilising this combination of technologies to quantify the postures of athletes during match-play. This paper presents the results of a preliminary investigation into developing a methodology that allows practitioners to use the technology readily available to them to quantify the postural demands of field hockey players during match-play.
1. Introduction
The primary function of Global Positioning System (GPS) technology is to measure location on the surface of the Earth via measures of latitude and longitude. Recently the utilisation of GPS units has become commonplace in a range of applications that vary from the tracking of a package location, to the quantification of athletic performance [1,2]. Along with verifying a location, GPS technology is also capable of measuring the velocity of athletes wearing the devices via positional differentiation or Doppler-shift [1,2,3]. It is this ability to track the velocity of a GPS unit that has captured the attention of sport scientists and engineers alike in an increasingly significant manner over the last decade, and enabled the quantification of physiological effort during sports performance.
In a team sporting context, GPS units have been predominantly used to quantify the metabolic demands of a range of sports including Australian Rules Football [4], rugby league [5], rugby union [6] and field hockey [7]. The addition of micro-electrical mechanical systems (MEMS) that are the triaxial accelerometers, gyroscopes and magnetometers, allows investigators to measure changes in accelerations, orientations and headings of the GPS unit. This has enabled research to be conducted examining the impact forces experienced in various sports and their additive effect to the metabolic demand placed on the athlete [2] as well as the association of these forces with injury [8].
However, despite their widespread use in team sport, very little research has sought to utilize the combined GPS and MEMS technologies to examine body orientation with reference to location. As such, little is known about how changes in body posture may influence athletic performance. Team sport performance is dynamic, and requires athletes to be continually exploring their playing environment while carrying out sport-specific skills [9]. Visual exploration allows the athlete to identify the opportunities for action that continually present in this ever-changing environment, and is crucial to their decision making process [10]. This exploration is achieved through the manipulation of visual gaze via the coordinated movements of the head and torso, to discover the opportunities for action that surrounds the player [11]. It is likely that exploration is constrained by the postures (torso angles) that are required by the athlete’s on and off the ball actions. The MEMS technology housed within GPS units positioned on the torso of athletes, has the capacity to measure the torso postures that these athletes adopt during match-play. Hence, measuring torso angles during match-play will enable practitioners to link the constraints placed on the athlete’s torso to the exploratory behaviours exhibited during athletic performance.
To our knowledge, this preliminary investigation presents the first attempt to use data collected via a commercially available GPS unit to quantify the torso postures of field hockey athletes during match-play. The results presented here have implications for sport practitioners, researchers and manufacturers of GPS units, in so far as it presents a viable method of analysis for body posture of the athlete in-situ using already available technology.
2. Materials and Methods
Members of the Queensland Hockey Men’s Open squad were instrumented with GPS devices (Catapult Minimax S4 and S5 units, Catapult Innovations, Melbourne, Australia) held in place between the athlete’s scapulae in a manufacturer supplied vest. Data were collected during a match played at the 2016 Australian Hockey League (AHL) tournament hosted in Perth, Western Australia. The data presented here are from the six defenders within that squad.
Each file was initially examined within the manufacturer supplied software (Catapult Sprint ver. 5.1.7, Catapult Innovations, Melbourne, Australia). The horizontal dilution of precision (HDOP) data was examined to identify the quality of the satellite signal and hence the accuracy of the GPS positional data. Any areas of the collected files where the HDOP signal exceeded one were excluded based on poor accuracy and reliability of the GPS signal [1]. Accelerometry in the three axes (forward/backward, up/down, and sideways), distance travelled, Player Load, and the GPS latitude and longitude data channels along with time were used to identify and label periods of match-play for each athlete for analysis. Examination of these data streams enabled the investigators to identify the quarters of play during the match and exclude the warm-up and cool-down periods along with any periods of rest. After the four quarters of match-play were identified, selected raw data channels were exported into Microsoft Excel (Microsoft, Redmond, WA, USA) as comma delimited files (.csv) for analysis. The data selected included the accelerometry channels (forward/backward, up/down, sideways), gyroscopic channels (Gyr1, Gyr2, Gyr3), magnetometer channels (Mag Fwd, Mag Left, Mag Up), distance travelled (odometer), and HDOP data channels all sampling at 100 Hz, and the GPS latitude and longitude channels sampling at 10 Hz (S4 units) or 15 Hz (S5 units) respectively.
The rectangular playing surface was defined by establishing the longitude and latitude of each of the four corners. Zones within the playing surface were identified by using each of the 23-yard lines and the halfway line, and the longitude and latitude of where they intersect with the sidelines, dividing the playing surface into four quarters. These quarters were labeled as: (i) Zone 1—Attacking; (ii) Zone 2—Attacking Midfield; (iii) Zone 3—Defensive Midfield; and (iv) Zone 4—Defensive. Consideration was given on which direction the team was playing in the first half of the match, and an account made in the analysis routine for the change in running direction made at half-time.
A subsequent analysis routine was performed using a custom written script in MATLAB (Mathworks, Natick, MA, USA). This analysis incorporated an Attitude and Heading Reference System (AHRS) algorithm to fuse the nine degrees of freedom inertial unit data output from the GPS unit. This approach outputs orientation information (yaw, pitch, and roll), in a global reference frame with respect to gravity and the Earth’s magnetic field. The filter is accurate in dynamic situations, with a maximal RMS error of <1.7 degrees when contrasted to retroreflective motion capture [12]. The output of this analysis routine produced measures of time in play for the entire match, quarter and time spent in each zone of the playing surface, along with a measure of trunk angle in the sagittal plane (pitch) of the athlete. Trunk angles were grouped into 15 bands each spanning 10 degrees of flexion. A perfectly upright trunk position was identified as zero degrees of flexion.
3. Results
To visually represent the results of this investigation, a series of histogram and line graphs are presented below. Figure 1 illustrates the relationship between trunk angle in the sagittal plane and time expressed as a percentage of the total time played during the entire match. Displaying the data in this fashion identifies the range of trunk flexion that is predominately displayed by this group of field hockey defenders during match-play. Approximately 80% of the playing time during the match was spent between 10 to 60 degrees of trunk flexion, with a peak of 23.93% of playing time spent in between 30 to 40 degrees of trunk flexion.
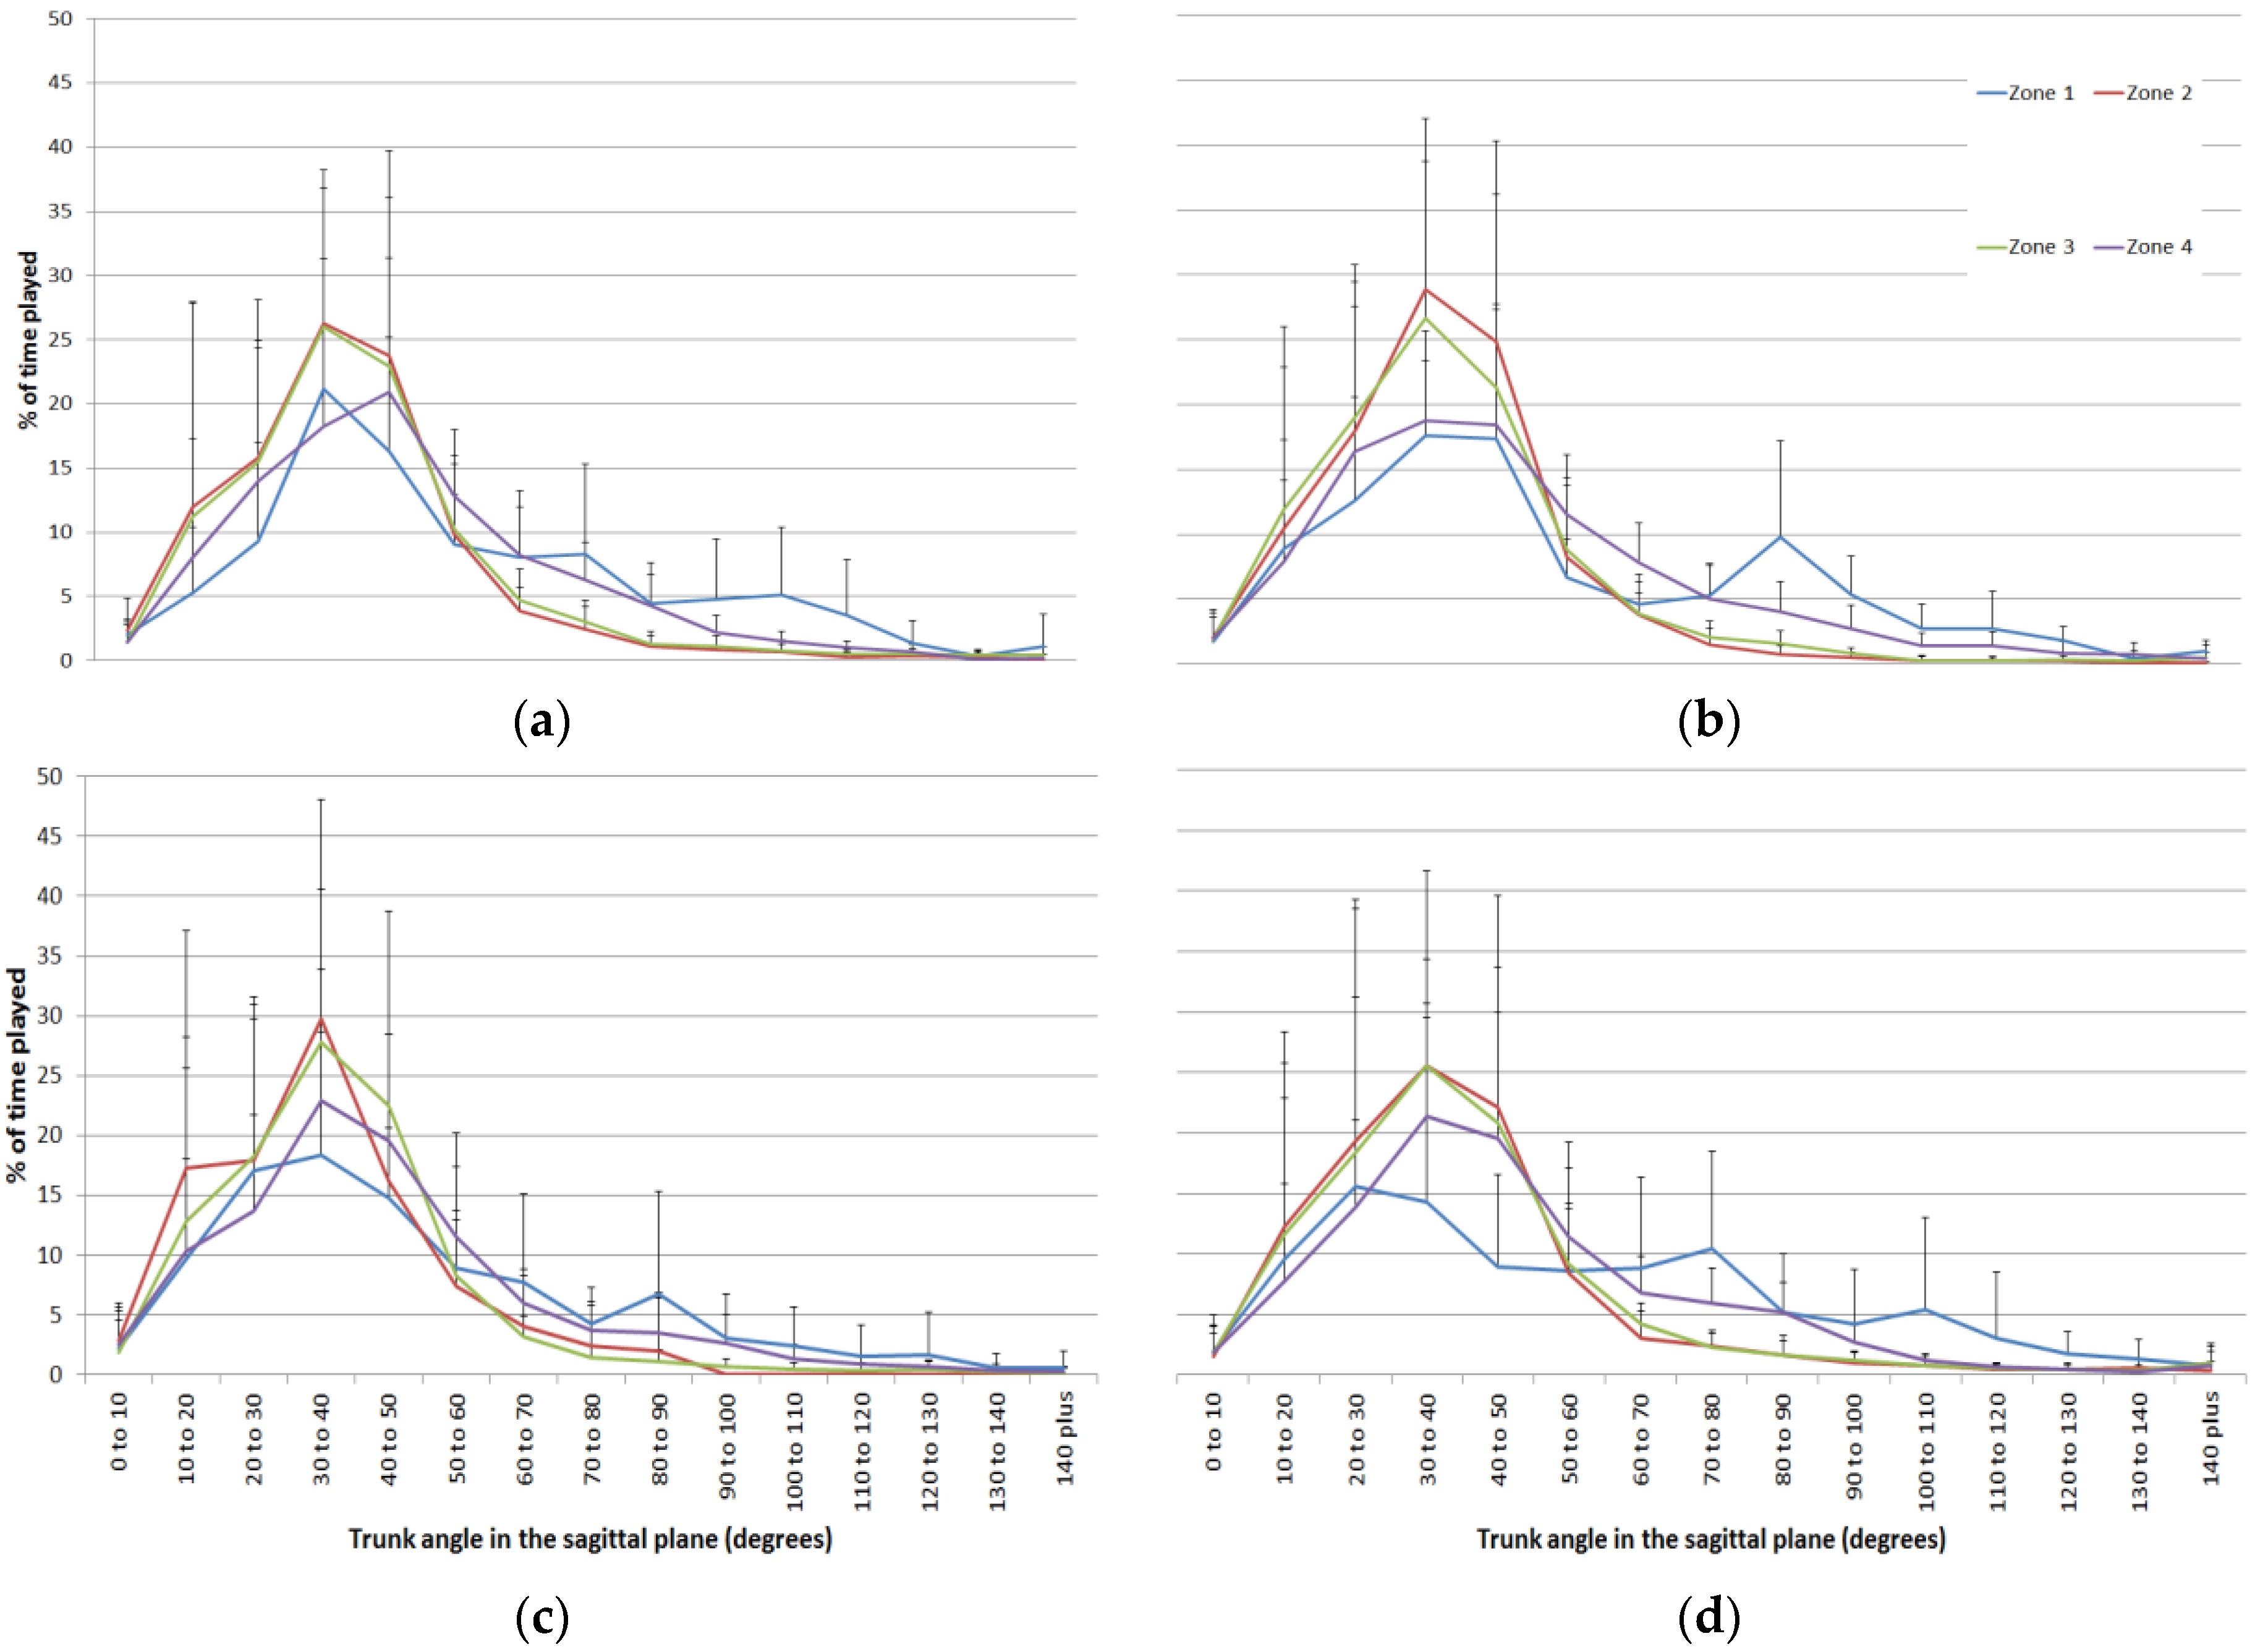
Figure 2 illustrates the time spent in each of the postural bands, in each quarter of the match, while tracking the athletes in each of the identified zones of the playing surface. During the 1st quarter, peaks in the curves appear in the band that ranges from 30 to 40 degrees flexion while the athletes were in zone 1 (attacking) at 21.18% of the time spent playing in that quarter, zone 2 (attacking midfield) at 26.26% and zone 3 (defensive midfield) at 25.99%. However, in zone 4 (defensive) the curve shifted slightly to the right and peaks in a somewhat more stooped posture at 40 to 50 degrees flexion at 20.94% of the time spent playing in that quarter. During the 2nd quarter of play, the peak in percentage time spent in play occurred at 30 to 40 degrees of trunk flexion for each of the zones of the playing surface (zone 1: 17.64%, zone 2: 28.91%, zone 3: 26.64%, zone 4: 18.77%). The 3rd quarter of play reveals a very similar pattern to the two previous quarters. With peaks in the percentage time spent playing in that quarter in the postural band defined by 30 to 40 degrees of trunk flexion in each of the zones of the playing field. Zone 2 peaked at 29.77% and zone 3 at 27.77%, while both zone 1 and 4 peaked slightly lower at 18.38% and 22.88% respectively. In the 4th quarter peaks in the curves occur at 30 to 40 degrees of trunk flexion while the athletes where in each of zone 2 (25.59%), zone 3 (25.55%), and zone 4 (21.38%). However, the analysis of the activity performed in this quarter while in zone 1, produced a peak in a slightly more upright posture in the band defined by 20 to 30 degrees of trunk flexion at 15.62% of time spent playing.
Of further note in Figure 2, in each quarter of the match, the curves representing activity in zones 1 and 4 appear to be somewhat less kurtotic and slightly skewed to the right when compared to the curves of zones 2 and 3. This would represent a more even spread of the percentage time spent across a couple of the postural bands and a move to spending more time in a position of greater trunk flexion in those zones.
4. Discussion
This investigation has demonstrated that the torso posture of athletes during match-play can be quantified by commonly used, commercially available GPS units. Coaching staff and applied sport scientists could use this approach to analyse existing GPS data to quantify the postural demands being placed on their athletes. Thereby gain a better understanding of how posture may affect the ability of their athletes to explore the playing environment and inform their decision making process.
The results here demonstrate that field hockey defenders spend much of their time in a position of trunk flexion that ranges from 10 to 60 degrees of flexion in the sagittal plane, and most of the time in that range, in and around 30 to 40 degrees of trunk flexion in the sagittal plane. It is likely that this is due to the specific tasks demanded of these athletes during play. Field hockey defenders are continually using their hockey stick and body to deny space, and attempt to take possession away from the attacking player. This sees the athlete often placed in this position of trunk flexion for extended periods of play during a match. Adopting this posture allows for the performance of the sport-specific skill but will limit their ability to further manipulate the torso to visually explore the environment. To our knowledge this study is the first of its kind to quantify the time spent in this demanding posture.
Further analysis by quarters of match-play, with respect to the zone of the playing surface that the athlete is in, allows practitioners to examine what effect position on the pitch and/or time during the match may have on the postural demands placed on athletes. The results from zones 1 (attacking) and 4 (defensive) particularly, may be representative of the changing task and hence postural demands in each of those zones for these defensive players. The reduction in kurtosis and the skewness to the right in both zones across all four quarters is indicative of a shift in time spent in each postural band to be spread across a greater range and towards a more significant forward flexed posture. This information provides coaching staff a clearer understanding of how the task demands of specific regions of the playing surface impacts on the postures adopted by athletes, and possibly affects their visual exploration and subsequent decision making. Team strategies, quality of opposition and the situational stage of the match may change the demands on the athletes. Further research establishing these links to postural demands is warranted.
The high variability seen in these results is somewhat limiting to establishing statistical significance in any of these measures, and is likely due to the variability seen in the performance of actions [13]. Research needs to be conducted including more matches and a variety of playing positions. This would perhaps allow for the development of stronger trends in the measures and for comparisons to be made based on playing position.
5. Conclusions
The continued advancement of GPS and MEMS technology has improved the accuracy and reliability of the data collected using these commercially available GPS units. However, work still needs to be done to standardise the analysis and reporting of this information [1]. The results presented in this preliminary investigation provide some promising insight into the extended utility of the data collected by GPS units for quantifying torso posture and its relation to match demands.
Acknowledgments
While completing this work Geoffrey Warman was supported by a joint research scholarship from the Queensland Academy of Sport’s (QAS) Sport Performance Innovation and Knowledge Excellence Unit and the Australian Catholic University. The authors would like to acknowledge Dr Trish King (QAS) for her work in the collection of the data, and the support of Mr Matthew Wells, Head Coach, High Performance Men’s Program, Queensland Hockey.
Conflicts of Interest
The authors declare no conflict of interest. The QAS were involved in the collection of the data, but had no role in the design of the study; in the analyses, or interpretation of data; in the writing of the manuscript, and in the decision to publish the results.
References
- Malone, J.J.; Lovell, R.; Varley, M.C.; Coutts, A.J. Unpacking the Black Box: Applications and Considerations for Using GPS Devices in Sport. Int. J. Sports Physiol. Perform. 2017, 12, S2-18–S2-26. [Google Scholar] [CrossRef] [PubMed]
- Cummins, C.; Orr, R.; O’Connor, H.; West, C. Global Positioning Systems (GPS) and Microtechnology Sensors in Team Sports: A Systematic Review. Sports Med. 2013, 43, 1025–1042. [Google Scholar] [CrossRef] [PubMed]
- Aughey, R.J. Applications of GPS Technologies to Field Sports. Int J. Sports Physiol. Perform. 2011, 6, 295–310. [Google Scholar] [CrossRef] [PubMed]
- Bartlett, J.D.; O’Connor, F.; Pitchford, N.; Torres-Ronda, L.; Robertson, S.J. Relationships Between Internal and External Training Load in Team-Sport Athletes: Evidence for an Individualized Approach. Int. J. Sports Physiol. Perform. 2017, 12, 230–234. [Google Scholar] [CrossRef] [PubMed]
- Kempton, T.; Sirotic, A.C.; Cameron, M.; Coutts, A.J. Match-related fatigue reduces physical and technical performance during elite rugby league match-play: A case study. J. Sports Sci. 2013, 31, 1770–1780. [Google Scholar] [CrossRef] [PubMed]
- Tee, J.C.; Lambert, M.I.; Coopoo, Y. Impact of Fatigue on Positional Movements During Professional Rugby Union Match Play. Int. J. Sports Physiol. Perform. 2017, 12, 554–561. [Google Scholar] [CrossRef] [PubMed]
- Jennings, D.H.; Cormack, S.J.; Coutts, A.J.; Aughey, R.J. GPS analysis of an international field hockey tournament. Int. J. Sports Physiol. Perform. 2012, 7, 224–231. [Google Scholar] [CrossRef] [PubMed]
- Gabbett, T.J.; Ullah, S. Relationship between running loads and soft-tissue injury in elite team sport athletes. J. Strength Cond. Res. 2012, 26, 953–960. [Google Scholar] [CrossRef] [PubMed]
- Fajen, B.R.; Riley, M.A.; Turvey, M.T. Information, affordances, and the control of action in sport. Int. J. Sport Psychol. 2009, 40, 79–107. [Google Scholar]
- Fajen, B.R.; Phillips, F. Spatial perception and action. In Handbook of Spatial Cognition; Waller, D., Nadel, L., Eds.; American Psychological Association: Washington, DC, USA, 2013; pp. 67–80. [Google Scholar]
- Reed, E.S. Encountering the World: Toward an Ecological Psychology; Oxford University Press: Cary, NC, USA, 1996. [Google Scholar]
- Madgwick, S.O.H.; Harrison, A.J.L.; Vaidyanathan, R. Estimation of IMU and MARG orientation using a gradient descent algorithm. In Proceedings of the 2011 IEEE International Conference on Rehabilitation Robotics (ICORR), Zurich, Switzerland, June 29–July 1 2011; Institute of Electrical and Electronic Engineers (IEEE): Piscataway, NJ, USA, 2011; pp. 179–185. [Google Scholar] [CrossRef]
- Davids, K.; Glazier, P.; Araujo, D.; Bartlett, R. Movement systems as dynamical systems—The functional role of variability and its implications for sports medicine. Sports Med. 2003, 33, 245–260. [Google Scholar] [CrossRef] [PubMed]
Figure 1.
Range of mean trunk angles expressed during the entire match.

Figure 2.
Range of mean trunk angles expressed during the (a) 1st quarter; (b) 2nd quarter; (c) 3rd quarter; and (d) 4th quarter while in the identified zones of the playing surface.
Figure 2.
Range of mean trunk angles expressed during the (a) 1st quarter; (b) 2nd quarter; (c) 3rd quarter; and (d) 4th quarter while in the identified zones of the playing surface.
Publisher’s Note: MDPI stays neutral with regard to jurisdictional claims in published maps and institutional affiliations. |
© 2018 by the authors. Licensee MDPI, Basel, Switzerland. This article is an open access article distributed under the terms and conditions of the Creative Commons Attribution (CC BY) license (https://creativecommons.org/licenses/by/4.0/).
Share and Cite
MDPI and ACS Style
Warman, G.E.; Chalkley, D.; Cole, M.H.; Pepping, G.-J. Utilising GPS Data to Quantify Torso Range of Motion in Field Hockey Athletes. Proceedings 2018, 2, 294. https://doi.org/10.3390/proceedings2060294
AMA Style
Warman GE, Chalkley D, Cole MH, Pepping G-J. Utilising GPS Data to Quantify Torso Range of Motion in Field Hockey Athletes. Proceedings. 2018; 2(6):294. https://doi.org/10.3390/proceedings2060294
Chicago/Turabian StyleWarman, Geoffrey E., Daniel Chalkley, Michael H. Cole, and Gert-Jan Pepping. 2018. "Utilising GPS Data to Quantify Torso Range of Motion in Field Hockey Athletes" Proceedings 2, no. 6: 294. https://doi.org/10.3390/proceedings2060294