The Influence of Face Angle and Club Path on the Resultant Launch Angle of a Golf Ball †


Engineering Department, PING, Inc., Phoenix, AZ 85029, USA
*
Authors to whom correspondence should be addressed.
†
Presented at the 12th conference of the International Sports Engineering Association, Brisbane, Queensland, Australia, 26–29 March 2018.
Proceedings 2018, 2(6), 249; https://doi.org/10.3390/proceedings2060249
Published: 23 February 2018
(This article belongs to the Proceedings of The 12th Conference of the International Sports Engineering Association)
Abstract
:A two-part experimental study was conducted in order to better understand how the delivered face angle and club path of a golf club influences the initial launch direction of a golf ball for various club types. A robust understanding of how these parameters influence the ball direction has implications for both coaches and club designers. The first study used a large sample of golfers hitting shots with different clubs. Initial ball direction was measured with a Foresight Sports camera system, while club delivery parameters were recorded with a Vicon motion capture system. The second study used a golf robot and Vision Research camera to measure club and ball parameters. Results from these experiments show that the launch direction fell closer to face angle than club path. The percent toward the face angle ranged from 61% to 83%, where 100% designates a launch angle entirely toward the face angle.
1. Introduction
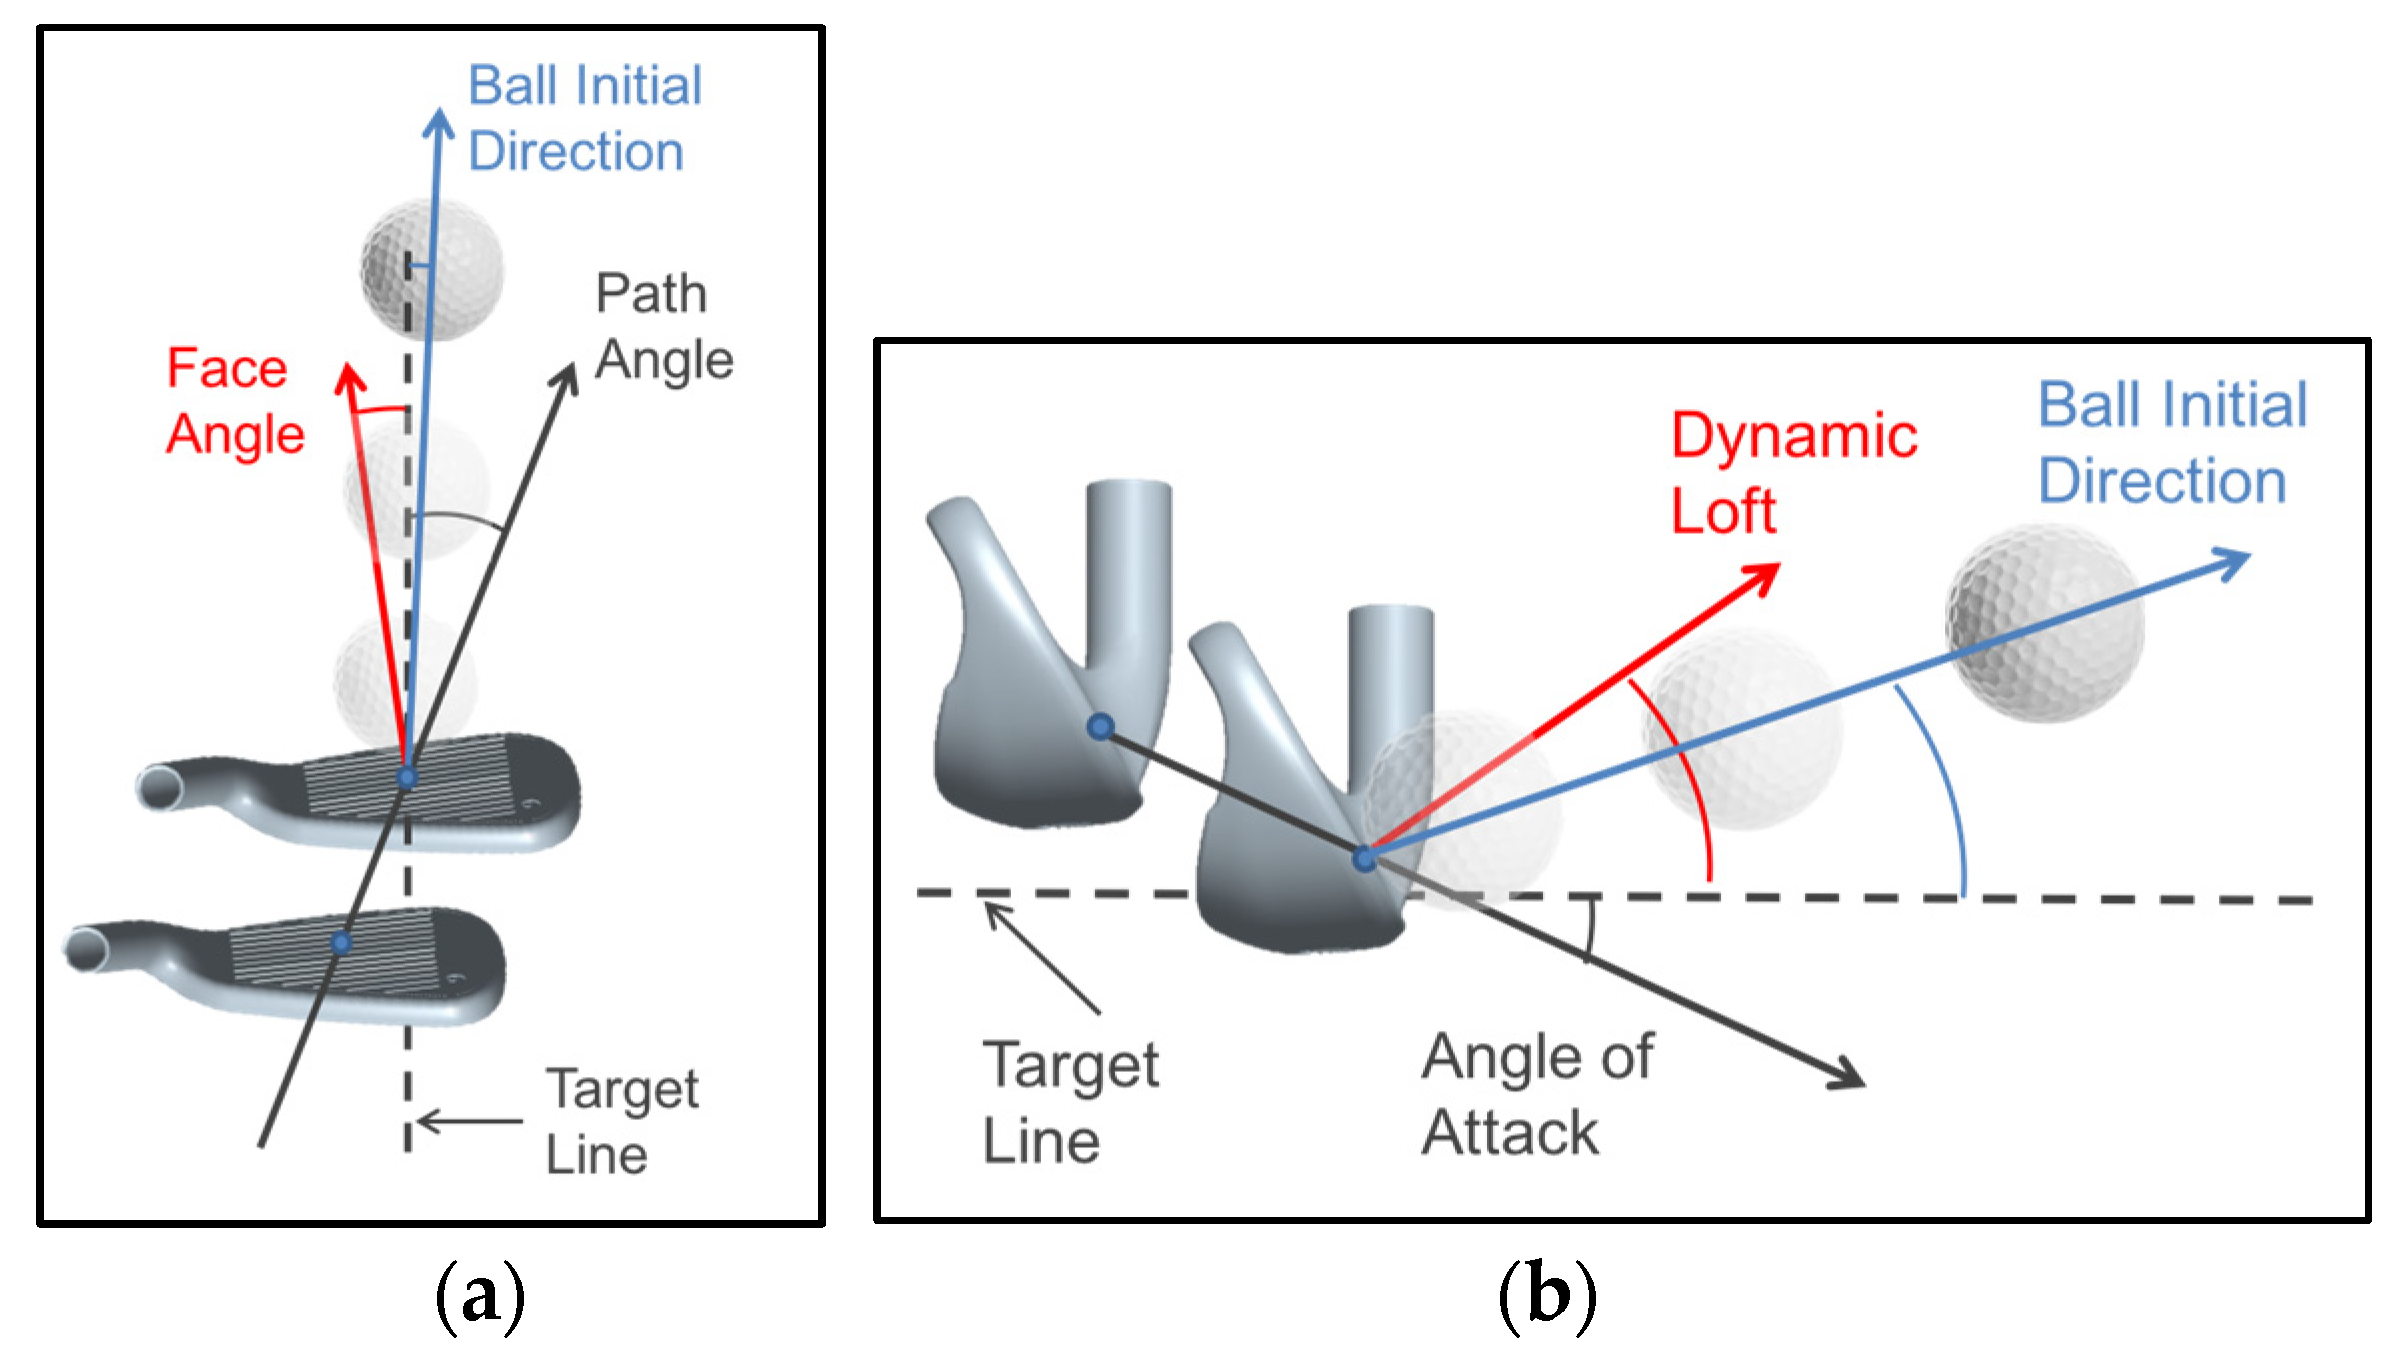
Golf is a game of distance and direction control. Broadie [1] statistically analysed the importance of variations in direction and distance on the golf course and how they contribute to the score. Numerous books and papers discuss the physics of the golf swing, the club-ball impact and the flight of the ball [2,3,4,5,6]. The flight of the ball is determined by the speed, position and orientation of the golf club at impact. Consequently, golfers and golf teachers are motivated to understand how to determine the initial direction of the ball in relation to the direction of travel and angle of the face of the club. Figure 1 shows a diagram of the club head at impact in the horizontal and vertical planes. The direction of movement of the golf club head at impact with the ball is defined as Club Path when projected onto a horizontal plane, and Angle of Attack when projected onto a vertical plane. The direction the centre of the club face is pointing at impact is defined as Face Angle in the horizontal plane and Dynamic Loft in the vertical plane. Similarly, the components of initial direction of travel of the ball are defined as Horizontal Launch Angle and Vertical Launch Angle.
The effect of an oblique impact between the club path and the club face is a ball that launches between the club path and the face angle and an angular velocity (spin) on the ball which causes the ball to curve in the air. It is well understood that changes in the initial direction and angular velocity of the ball can lead to dramatic changes to ball flight [2] and have a large impact on scoring [1].
There is little experimental data published regarding the resultant initial direction of the ball based on club delivery measurements. Cochran and Stobbs [2] gave a single example with a −20 degree club path (0.35 rad), 0 degree face angle and resultant ball direction said to be about −7 degrees, which indicates the ball starts 65% toward the face angle. Jorgensen [3] derived equations to determine the ball’s vertical launch angle and an example for some typical golf club and ball parameters, yielding an initial direction just over 80% towards the dynamic loft. Sweeney et al. [7] showed a small data set from an experiment where the face direction relative to the club path changed by 16 degrees while the ball initial direction changed by 10 degrees giving an initial direction that can be calculated as 62% determined by the face angle. McCloy et al. [8] included measurements of dynamic loft, attack angle and vertical launch angle, yielding an average vertical launch 68% toward the dynamic loft. Trackman Golf (Copenhagen, Denmark) [9] included data in their training material that shows the ball initial direction dictated much more by face angle than path.
The PGA Teaching Manual [10], used as the primary textbook for newly qualifying PGA coaches, set out information about the factors dictating initial ball direction. The book indicated that initial ball direction is more toward face angle than club path. However, due to a misunderstanding of the material, the PGA test for many years required candidates to state that the initial direction of the ball is equal to the club path. This likely contributed to the topic of the ball’s initial direction being widely debated among golf teachers in recent years.
There are studies using various modelling techniques to gain insights into the multiple factors that could influence the ball’s initial start direction. For example, Maw et al. [11] modelled the friction between an object such as a golf ball and a flat surface such as a club face. Cross [12] performed experiments to calculate friction forces on balls used in sport. Using a model of the friction force at impact could yield insights into the nuances of variation in ball flight. The type of golf ball was also shown to have an impact on initial velocity, direction and angular rate [13].
This paper provides empirical evidence for the initial start direction of the ball by analysing two independent methods of collecting data: a large number of players swinging a variety of clubs and a robot test where a repeatable swing was set up to produce impacts with various face angles.
2. Materials and Methods
2.1. Player Testing
157 right-handed golfers (handicap: 10.1 +/− 10.0) were selected to hit 10 shots, 5 with a driver and 5 with a 7-iron. A subset of these players (10 players, handicap: 1.2 +/− 1.7) were asked to hit 10 shots each with a 58 degree wedge. All testing was conducted in an indoor hitting bay. Golf club kinematics were collected using an 8-camera optical system (T40S, Vicon Motion Systems Ltd., Oxford, UK) operating at 720 frames per second. Two additional video cameras (Bonita, Vicon Motion Systems Ltd., UK) were used to locate the golf ball during each trial. Prior to testing, 3 tracking markers were installed on the upper shaft of each club near the grip. Tracking markers were also installed on the club head and hosel (4 for the driver and 3 for the iron and wedge). During the calibration process, calibration clusters with additional markers were placed on the face, shaft, and grip to help establish virtual coordinate systems. For this study, the coordinate system established at the face centre is of primary importance. Figure 2a shows the marker set for a driver head and the face centre coordinate system. The X-axis of this right-handed coordinate system is directed normal to the club face, and the Y-axis is parallel with the grooves directed towards the golfer. All variables reported at impact were calculated using the marker data and the club face coordinate system, including the last frame prior to impact, by a custom golf club pipeline within the Vicon Nexus motion capture software (ENSO, Nexus v. 2.5, Vicon Motion Systems Ltd., Oxford, UK). A five-point forward difference extrapolation was used to determine the values of each variable at the instant the club face was predicted to touch the ball. Reported ball initial conditions were recorded with a Foresight GC2 launch monitor (Foresight Sports, San Diego, CA, USA) [14]. Prior to testing, the Vicon system and Foresight units were aligned to a designated target line.
Clubs used in the testing were all commercially available drivers, irons and wedges from PING, Inc. Each player was given a driver and 7-iron with a club loft and shaft stiffness appropriate for their swing speed. In total, three drivers and three 7-iron clubs were used in the test, spread roughly equally across the 157 participants. Each player was allowed a warm-up period before beginning the test.
2.2. Robot Testing
A 7-iron was tested using the PING Man swing robot (developed in house by PING, Inc. Phoenix, AZ, USA). The club was used to perform 3 trials at 5 different face angle positions: 0, 2, 4, 6 and 8 degrees open. The club was set in the robot and a swing was calibrated such that the speed of the centre of the club face at impact was 41 ms−1 (91 mph), impact location was in the geometrical centre of the face, and club delivery (angle of attack and dynamic loft) were set to yield a vertical launch angle of approximately 20 degrees and an initial backspin of approximately 764 rad s−1 (7300 rpm).The wrist of the robot was rotated so that shots hit from the centre of the face flew straight. Open face angle settings were achieved by rotating the wrist of the club from this 0 position. The trials were measured and analysed from a birds-eye view using a mirror and a Phantom high speed camera at 9000 fps. Figure 2b shows the experimental set up.
The high-speed video was analysed manually using Phantom CV 2.8 software. Horizontal launch angle was measured from impact to the ball’s last position within the camera frame. One pixel difference changed the measured angle by 0.15 degrees. Face angle at impact was measured by tracking two markers placed parallel to the club’s face angle. One pixel difference changed the measured angle by 0.30 degrees. Club path did not vary across all shots.
3. Results
3.1. Player Testing
The total dataset of player test data includes 731 shots with the driver, 745 shots with the 7-iron and 99 shots with the wedge. Results were filtered to use only shots where the impact location fell within 0.25′′ in both the vertical and horizontal directions of the centre of the club face in order to minimize changes in initial angle caused by the twisting of the club head during impact. For the horizontal graphs, results were further filtered to only use shots with at least 1.5 degrees of difference between face angle and club path in calculation of the average horizontal launch ratio. This was done to minimize measurement error effect on the data. In particular, the Foresight Sports GC2 system was found to have a typical variability in horizontal launch angle of at least a few tengths of a degree [14]. When calculating a launch angle ratio, a small face to path angle will result in division by a number close to 0 and therefore small errors in measured angles can result in huge changes to the calculated launch ratio. The results were compared for face angle to club paths of at least 1.5 degrees, 3 degrees and 4.5 degrees and the calculated ratios differed by no more than 3% in each case. 1.5 degrees resulted in the fewest filtered shots and so these results are presented.
Figure 3 shows 4 plots of the player testing data and Table 1 shows key calculations using the data. Figure 3a shows all of the filtered driver shots as a scatter plot of the face angle to club path difference against the horizontal launch angle to club path difference. The data shows a range of face angle to path from about 6 degrees closed to about 12 degrees open. A linear regression has been added for visual reference. The average horizontal launch angle to face angle ratio for each filtered shot (using only those with a face angle to path difference of at least 1.5 degrees) is 76%. Figure 3b shows the same data for 7-irons with a regression line for reference and 69% average ratio.
Table 1 calculates the average proportion the ball launch direction is in line with the face angle. These numbers are calculated for the vertical and horizontal plane and for all 3 club types. Figure 3b shows a much tighter fit to the regression line for 7 iron data than for the driver data in Figure 3a. Figure 3c,d show clearly that the ratio goes down for both horizontal and vertical components of initial launch angle as the obliqueness of impact increases. The numbers in the table show this number dropping from 83% and 76% for drivers in Vertical and Horizontal planes respecitvely to 72% and 61% with wedges. A comparison of Figure 3c,d also shows that there is a lot more variation in the launch ratio in the horizontal component.
3.2. Robot Testing
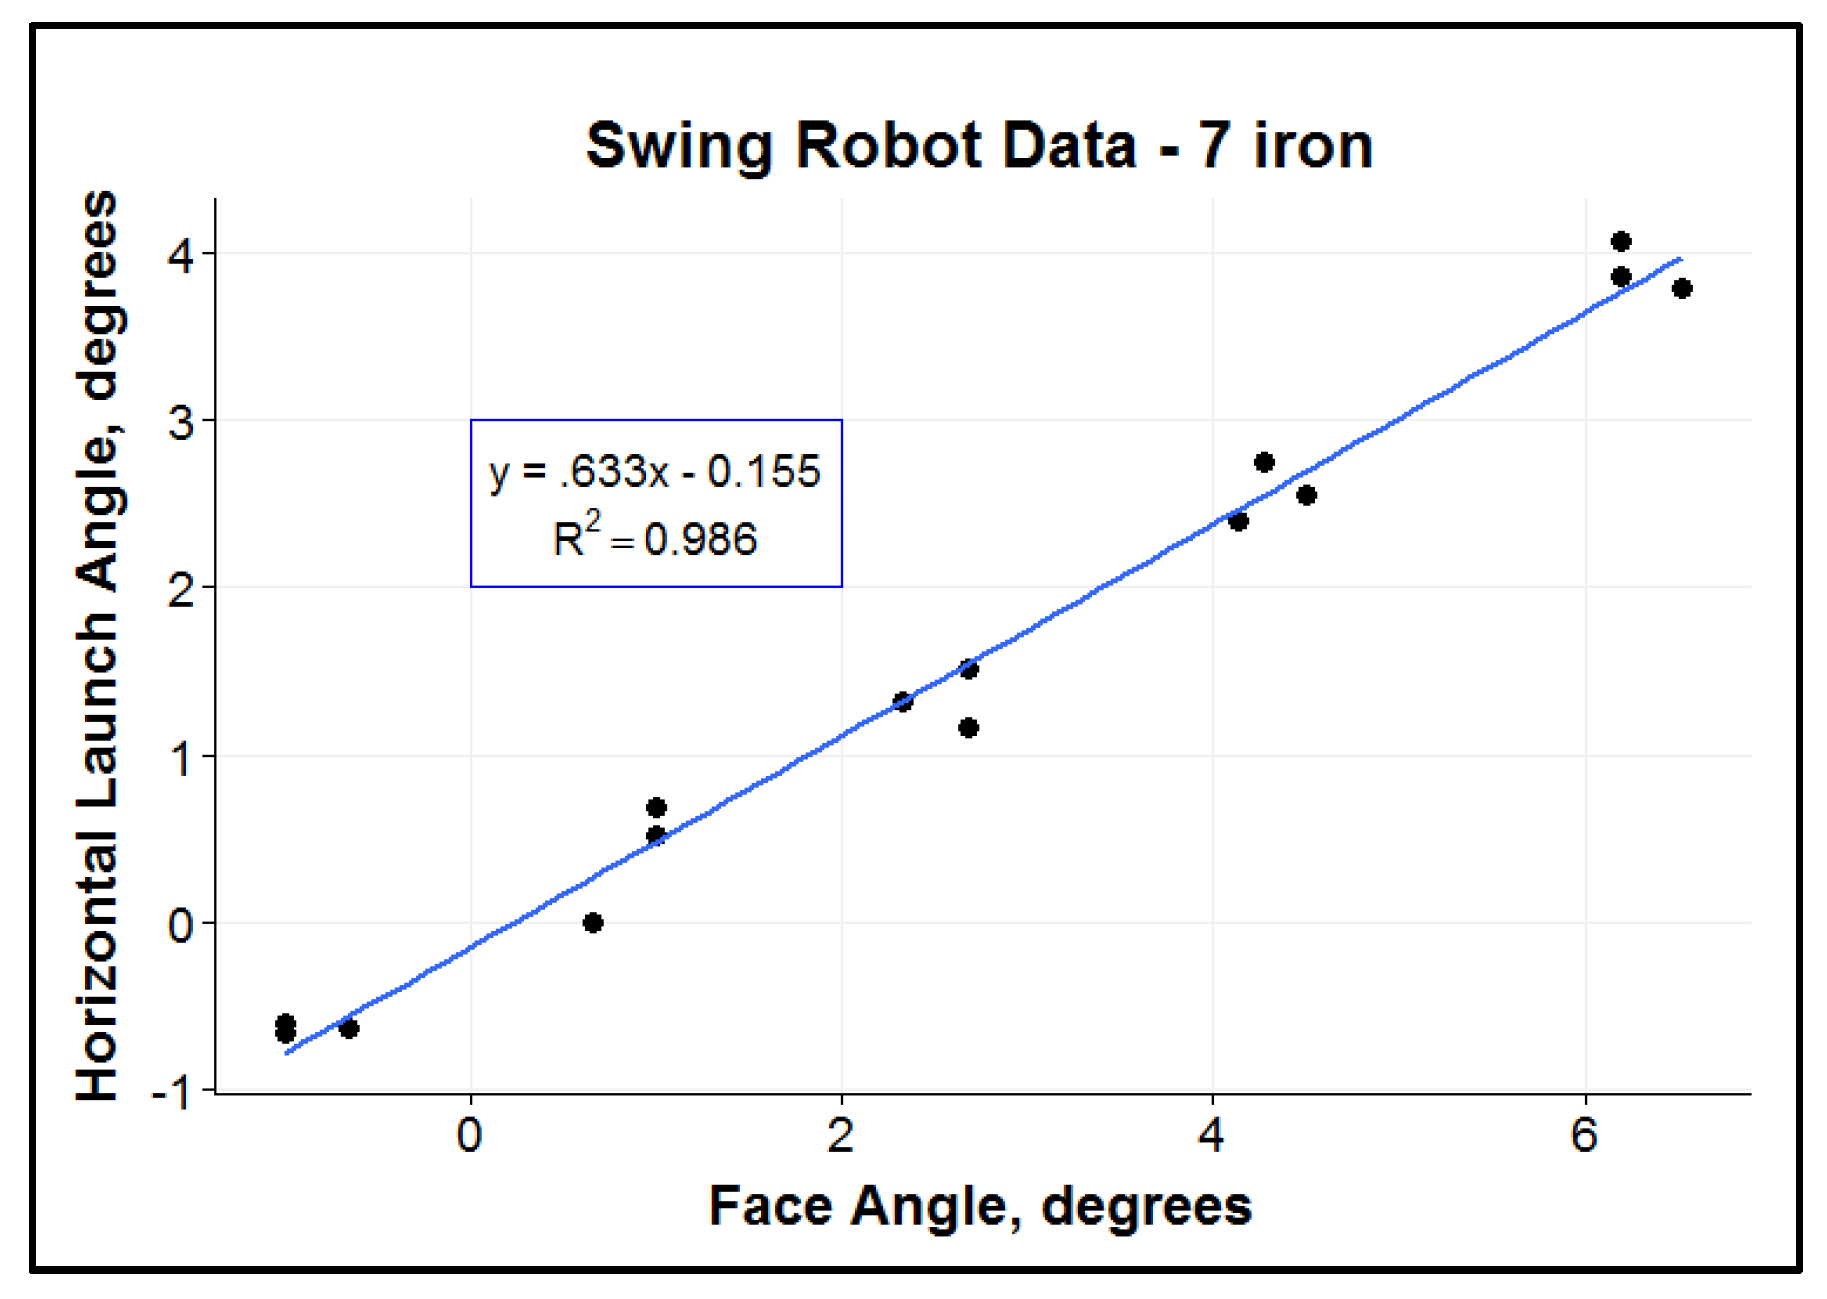
Three shots were hit in each wrist angle setting on the swing robot. The actual range of face angles achieved in the test was appoximately −1 to 6.5 degrees. Figure 4 shows the change in horizontal launch angle of the ball resulting from the change in face angle of the club for the 15 total shots, while club path stays constant. The data shows extremely good fit to the regression line, with an R2 value of 0.986. The slope of this curve is 0.63, implying a 63% influence of the face angle on initial launch direction of the ball.
4. Discussion
The player test data shows a wide range of variability, but is unequivocal in showing that the face angle is more important in determining the initial direction of the ball than the club path. Likewise, in the vertical plane the dynamic loft is more important in determining initial direction of the ball than angle of attack. Using the swing robot to create a very controlled experiment, merely changing the wrist open/closed angle on the machine to create different face to path relationships, yielded similar results. Thus, two different methods of measuring the determination of initial launch direction of the ball have produced similar results.
The biggest potential causes of error in the player data likely come from a couple of sources. There is measurement error in both Vicon and Foresight systems and a possible slight misalignment of the two systems. Variation in impact location will also have a measurable effect on launch angle due to twisting of the club during impact and inconsistencies in the clubs themselves such as fluctuations in the flatness of the face. The advantage of the player test data comes from the large sample size of players, number of shots and number of clubs tested. If there are inconsistencies in parts of the data, the large data set provides compelling evidence that the numbers generated for launch angle ratio are repeatable. Figure 3c,d and Table 1 show a systematic trend to a smaller percent initial direction due to face angle/dynamic loft when the obliqueness of impact is higher. This trend would suggest that there is a non-linear relationship. A future paper will try to explore this relationship in more detail via mathematical modelling and validation.
The robot data showed a comparatively flatter slope and therefore a lower number for the proportion the launch angle is dictated by the face angle. The robot arm acceleration profile does not change significantly from swing to swing but the effect of changing the wrist angle does introduce a slight change in the impact location (estimated to be 2 mm or less from square position to extremely open). In addition, the more open positions increase dynamic loft by about 1 degree for every 2 degrees the face angle is opened. The effect of a change in impact location this small is likely negligible but the change of approximately 4 degrees of dynamic loft from extreme closed to extreme open may have the effect of creating a slightly flatter slope, in line with the player test finding that higher dynamic lofts see a flatter slope.
5. Conclusions
Two completely different methods have been used to study the relative influence of face angle and club path on the initial launch direction of a ball for driver, iron and wedge clubs. Both methods show clearly that the face angle is more influential than club path and the ball starts in general between 61% and 83% toward the face angle, with higher numbers when the dynamic loft is lower. This information can be helpful to golfers in predicting ball flight changes based on club delivery parameters.
Acknowledgments
All funding for this research has come from PING, Inc.
Conflicts of Interest
The authors declare no conflict of interest.
References
- Broadie, M. Every Shot Counts; Penguin Books: New York, NY, USA, 2014. [Google Scholar]
- Cochran, A.; Stobbs, J. The Search for the Perfect Swing; Lippincott: Philadelphia, PA, USA, 1968. [Google Scholar]
- Jorgensen, T.P. The Physics of Golf; Springer Science & Business Media: Philadelphia, PA, USA, 1999. [Google Scholar]
- Penner, A.R. The Physics of Golf. Rep. Prog. Phys. 2002, 66, 131–171. [Google Scholar] [CrossRef]
- Cochran, A.J. Science and Golf (Routledge Revivals): Proceedings of the First World Scientific Congress of Golf; Routledge: Abingdon, UK, 2010. [Google Scholar]
- Cochran, A.J.; Farrally, M. Science and Golf II; Taylor and Francis: Abingdon, UK, 2002. [Google Scholar]
- Sweeney, M.; Mills, P.; Alderson, J.; Elliott, B. The influence of club-head kinematics on early ball flight characteristics in the golf drive. Sports Biomech. 2003, 12, 247–258. [Google Scholar] [CrossRef] [PubMed]
- McCloy, A.J.; Wallace, E.S.; Otto, S.R. Iron golf club striking characteristics for male elite golfers. In Engineering of Sport 6; Springer: New York, NY, USA, 2006; pp. 353–358. [Google Scholar]
- Trackman University. Available online: https://trackmanuniversity.com (accessed on 22 September 2017).
- Wiren, G. PGA Teaching Manual; PGA of America: Palm Beach Gardens, FL, USA, 1990. [Google Scholar]
- Maw, N.; Barber, J.R.; Fawcett, J.N. The oblique impact of elastic spheres. Wear 1976, 38, 101–114. [Google Scholar] [CrossRef]
- Cross, R. Grip-slip behavior of a bouncing ball. Am. J. Phys. 2002, 70, 1093–1102. [Google Scholar] [CrossRef]
- Gobush, W. Impact force measurements on golf balls. In Science and Golf (Routledge Revivals); Routledge: Abingdon, UK, 2010; pp. 219–224. [Google Scholar]
- Leach, R.; Forrester, S.; Mears, A.; Roberts, J. How valid and accurate are measurements of golf impact parameters obtained using commercially available radar and stereoscopic optical launch monitors? Measurement 2017, 112, 125–136. [Google Scholar] [CrossRef]
Figure 1.
(a) Horizontal and (b) vertical depictions of the club movement (club path and angle of attack), angle (face angle and dynamic loft) and ball initial direction.
Figure 1.
(a) Horizontal and (b) vertical depictions of the club movement (club path and angle of attack), angle (face angle and dynamic loft) and ball initial direction.
Figure 2.
(a) Driver with ENSO markers and the coordinate system (b) Robot experimental setup.
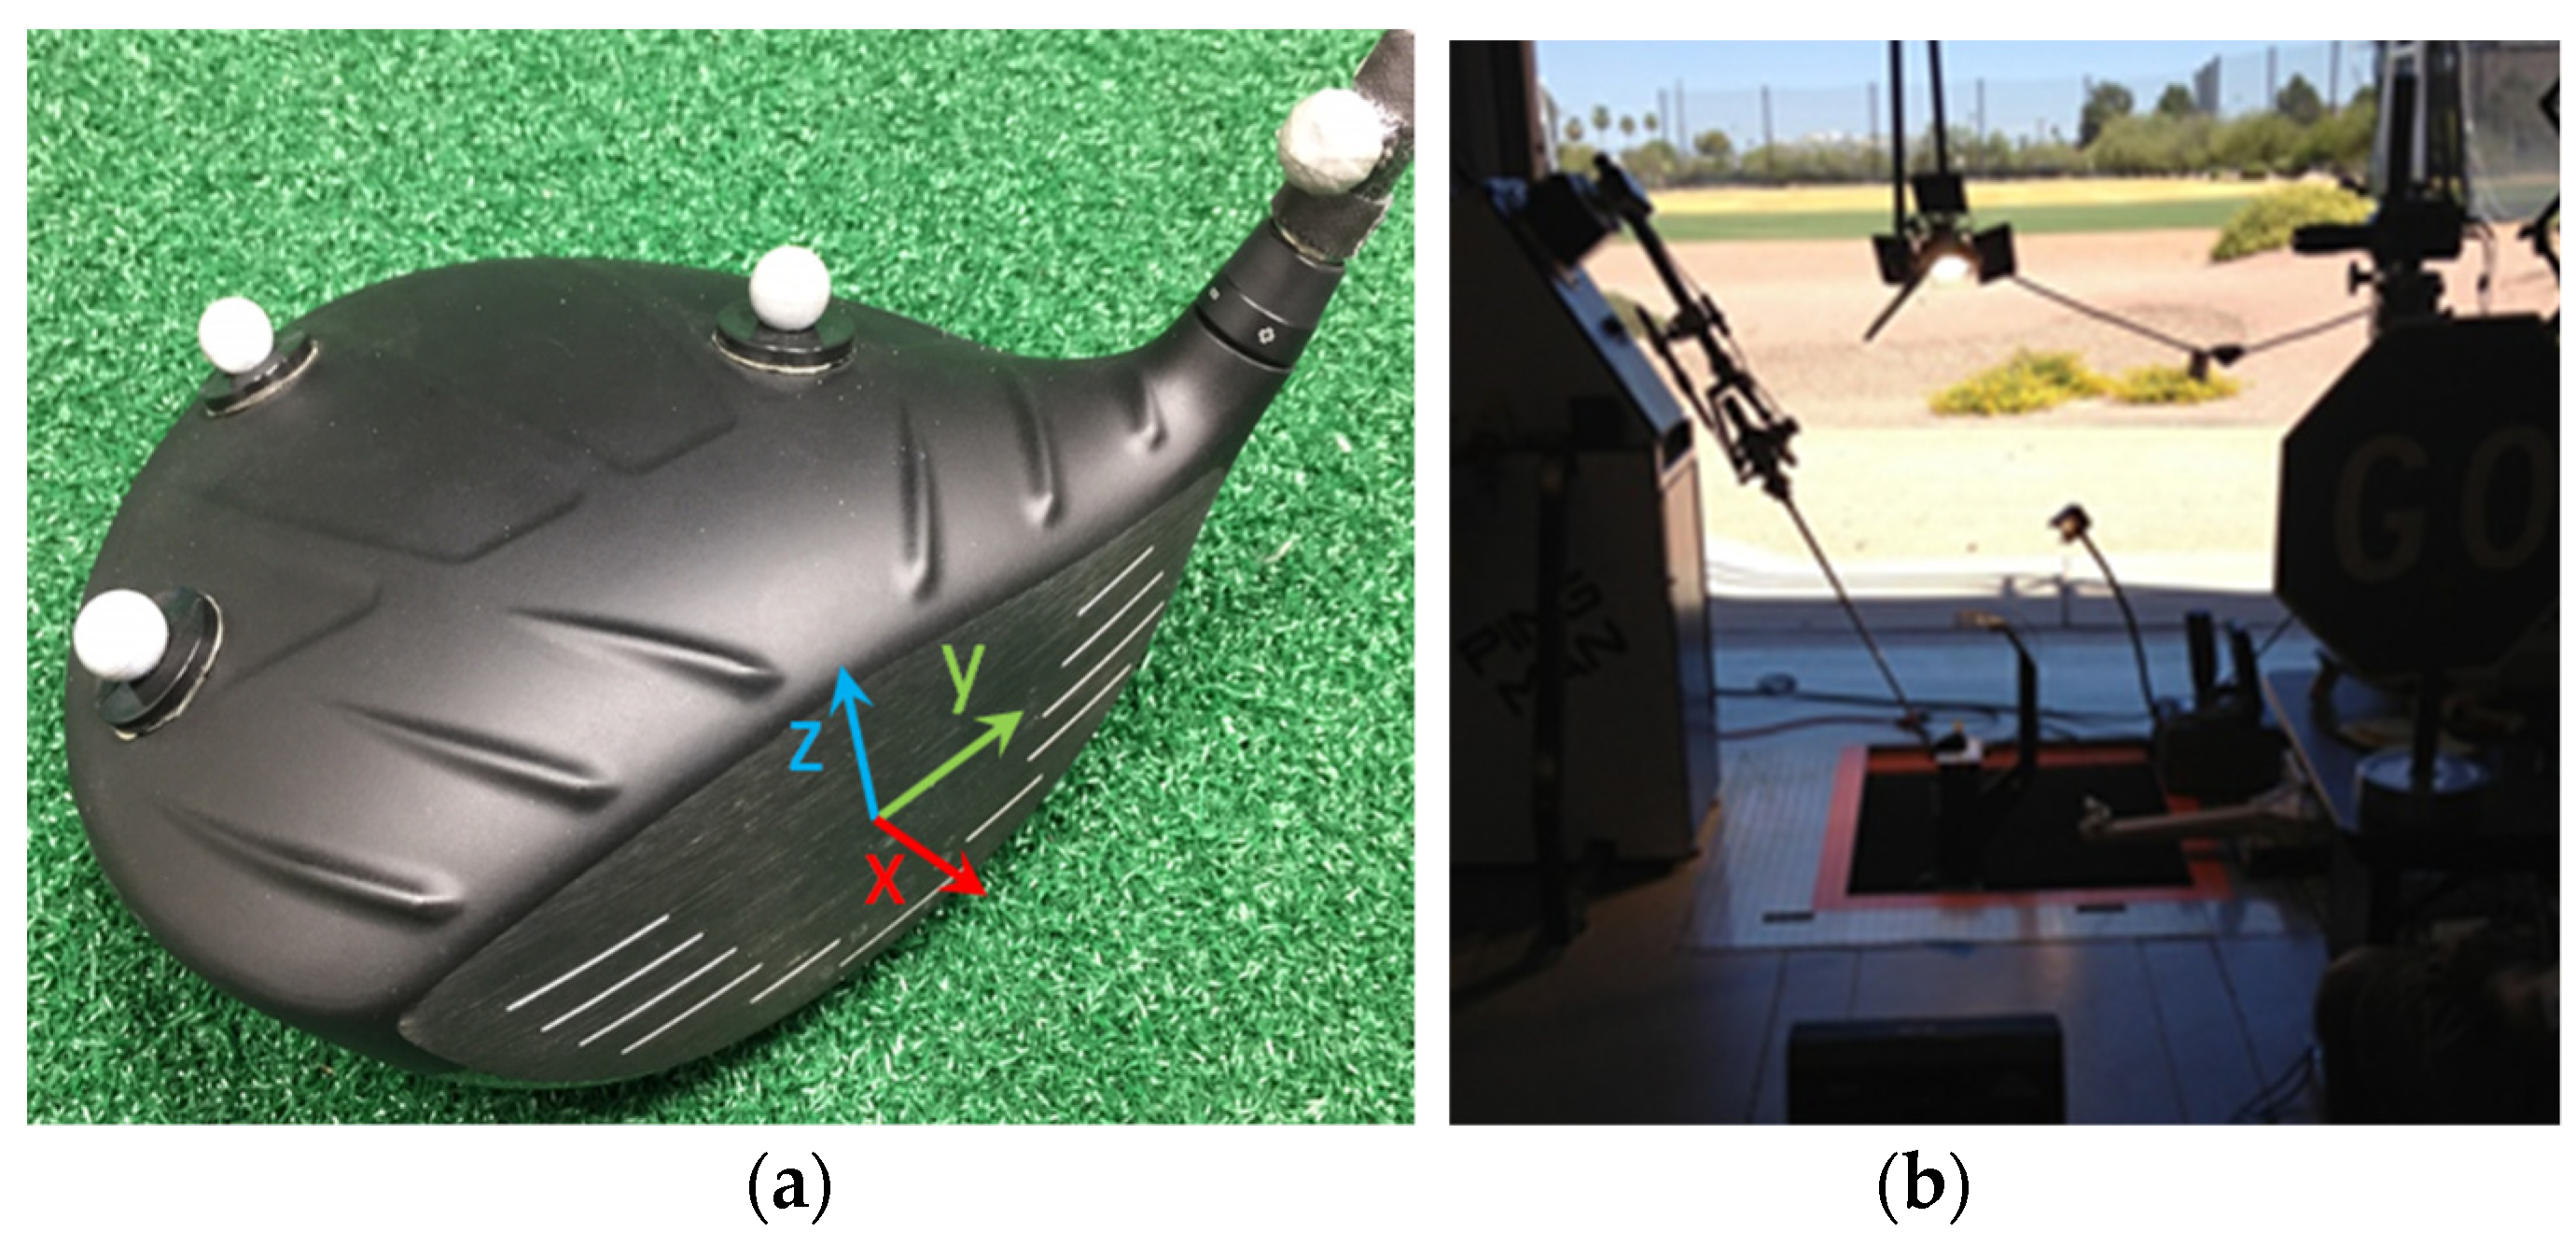
Figure 3.
Player data showing (a) scatter plot of horizontal launch angle relative to club path against face angle relative to club path for filtered driver shots; (b) the same data for filtered 7-iron shots; (c) scatter plot of the ratio of horizontal launch angle to face angle as a function of obliqueness of impact (dynamic loft–angle of attack) for all filtered shots; and (d) the same data using the vertical launch angle to dynamic loft ratio.
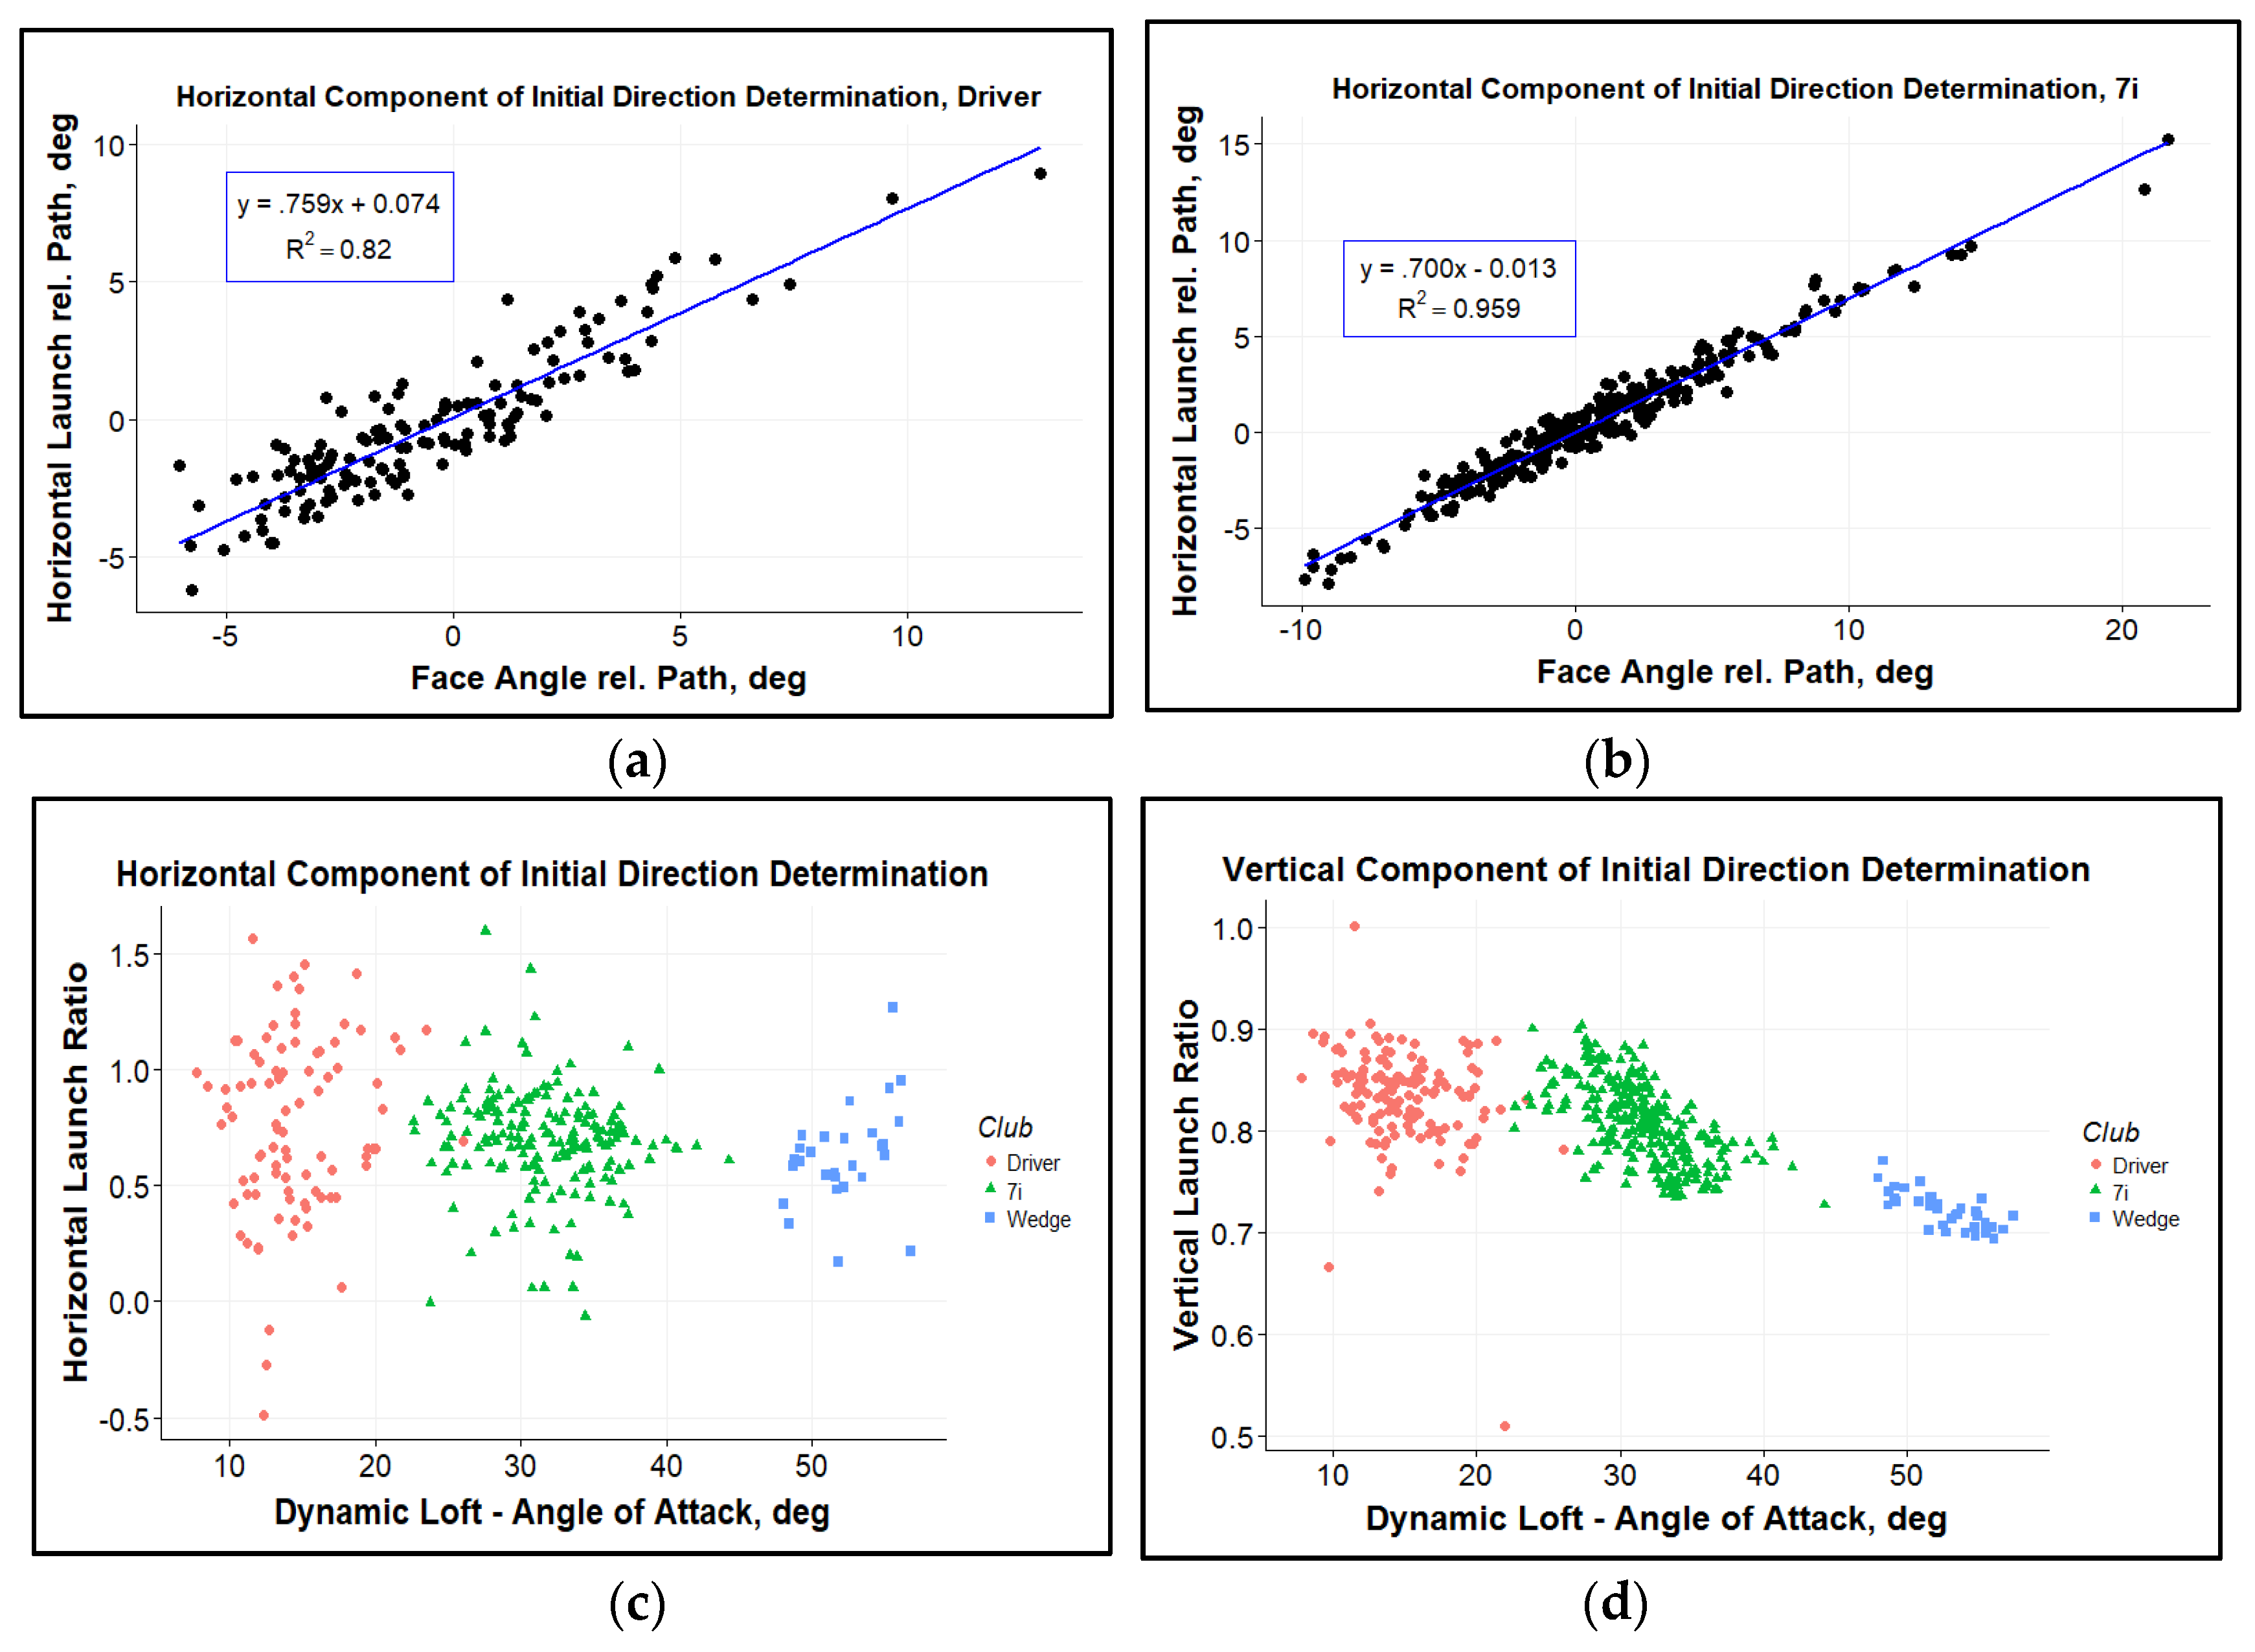
Figure 4.
Robot test data showing change in horizontal launch angle changes as a result of face angle changes.
Figure 4.
Robot test data showing change in horizontal launch angle changes as a result of face angle changes.

Table 1.
Calculation of average initial direction as a function of club direction and face angle for the three club types in both player and robot testing in the vertical and horizontal plane. 95% confidence interval. Number in brackets denotes the number of data points used after filtering.
Table 1.
Calculation of average initial direction as a function of club direction and face angle for the three club types in both player and robot testing in the vertical and horizontal plane. 95% confidence interval. Number in brackets denotes the number of data points used after filtering.
| Calculation | Driver | 7 Iron | Wedge |
|---|---|---|---|
| Average Vertical Launch ratio toward Dynamic Loft | 83% ± 8% (137) | 81% ± 5% (252) | 72% ± 6% (36) |
| Average Horizontal Launch toward Face Angle | 76% ± 8% (89) | 69% ± 3% (172) | 61% ± 7% (28) |
| Robot Data Horizontal Launch toward Face Angle | 63% ± 4% (15) |
Publisher’s Note: MDPI stays neutral with regard to jurisdictional claims in published maps and institutional affiliations. |
© 2018 by the authors. Licensee MDPI, Basel, Switzerland. This article is an open access article distributed under the terms and conditions of the Creative Commons Attribution (CC BY) license (https://creativecommons.org/licenses/by/4.0/).
Share and Cite
MDPI and ACS Style
Wood, P.; Henrikson, E.; Broadie, C. The Influence of Face Angle and Club Path on the Resultant Launch Angle of a Golf Ball. Proceedings 2018, 2, 249. https://doi.org/10.3390/proceedings2060249
AMA Style
Wood P, Henrikson E, Broadie C. The Influence of Face Angle and Club Path on the Resultant Launch Angle of a Golf Ball. Proceedings. 2018; 2(6):249. https://doi.org/10.3390/proceedings2060249
Chicago/Turabian StyleWood, Paul, Erik Henrikson, and Chris Broadie. 2018. "The Influence of Face Angle and Club Path on the Resultant Launch Angle of a Golf Ball" Proceedings 2, no. 6: 249. https://doi.org/10.3390/proceedings2060249