Information Theory for Equalizing the Residue-Wise Information Amounts of the Proteins and Protein-Coding DNA †

Department of Biophysics, School of Medicine, Altinbas University, Kartaltepe Mahallesi, Incirli Caddesi No11, 34147 Bakirkoy, Istanbul, Turkey
†
Presented at the 4th International Electronic Conference on Entropy and Its Applications, 21 November–1 December 2017; Available online: http://sciforum.net/conference/ecea-4
Proceedings 2018, 2(4), 165; https://doi.org/10.3390/ecea-4-05017
Published: 20 November 2017
(This article belongs to the Proceedings of The 4th International Electronic Conference on Entropy and Its Applications)
Abstract
:Information content of a polymeric macromolecule can be calculated in bits, by multiplying the number of building blocks that encompasses the entire length of the macromolecule with the Shannon’s entropy of each building block, which could be determined through the degree of variation (in the number) of those building blocks. DNA and the proteins that are encoded by genes, which are certain protein-coding regions of the DNA, are also polymeric macromolecules that are comprised of such building blocks, named residues. However, there is seemingly lower residue-based information amount in the protein if the mentioned approach is applied to a protein of specific size and the DNA that would be encoding the same length of a protein. Accordingly, this work initially presents the attempt to eliminate the decrease in the information amount of the protein by implementation of a new parameter in the calculation with the assumption that the information is not lost (or gained) during the protein translation process. An important additional biological significance of the work is revealed during latter calculations for the equalization of the information amounts in the protein and DNA molecules, which is the resolution of the problem of the presence of immense variation in the sizes of the proteins by accounting for the presence of introns in the eukaryotic genome.
1. Introduction
Here a method that involves the information communication theory and the relation of the DNA and protein molecules’ lengths is presented. It is done by equalization of the information contents of these two macromolecules and is based on the assumption that the information amount that is encrypted in a protein cannot be solely determined by residue variation along the length of a protein. Therefore, it is claimed here that the length (or the size, which is used here interchangeably) variations in the proteins could be implemented for a better comprehension. Accordingly, the method to be presented here is related to the evolution of the protein translation machinery and the other evolutionary processes since the protein sizes were not constant over time. So, protein-length is an evolutionary concern [1,2,3] and its distribution was previously investigated for extracting the information on the evolutionary forces that are acting on the proteins [2]. For instance, length distributions of the proteins evolving under weaker functional constraints were studied through different organisms [2]. On the other hand, length is a concept that fundamentally retains dimensionality, or simply the size, as a feature in a material world. Therefore, the length of proteins can be analyzed through these relevant terms.
Shannon’s communication theory [4,5,6] is the basis in calculating the information amount of a message that can be carried through molecules and hence it is utilized for the biological molecules [7,8,9,10]. The information contents of DNA and protein molecules can be calculated through the information entropies (Shannon’s entropy) of the DNA- and the protein-residues. However, this approach apparently results in a lowered information amount in the protein when it is performed separately for a protein of a specific size and a DNA that would be encoding a protein of the same length. The information that resides in a certain length of DNA is a potent criterion for defining the upper limit of the information amount of a certain length of protein, assuming no other relevant information communication is present. Accordingly, a protein-length-derived parameter is aimed to be introduced here as a new variable in the calculation of the information amount of the protein and for the equalization of the Shannon’s information amount of a protein and the DNA molecule that would be coding for the same length of a protein. This attitude is potentially of biological relevance.
2. Methods
2.1. Theory
Information amount of the DNA and proteins can be calculated through the information entropies of each nucleotide bp of the DNA or that of each amino acid of the protein. However, this normally ends up in diminished information amount in the proteins, compared to that of the DNA molecules that would be encoding the same length of proteins. Due to its being the primary source of information, the amount of information of the DNA molecule can be used to set the maximum-limit of a certain length of protein. Therefore, a new variable is introduced here in the calculation of the information amount of the proteins. Afterwards, the lengths of proteins, at which the differences of the information amounts of the DNA and proteins are minimized, are found. These are suggested to be the protein and DNA sizes that are favored, that are observed to a higher extent in the biological systems. The details of the calculations are given below. However, some features of the DNA-to-protein information communication process are mentioned first:
It is already stated that the residues, namely the building blocks of the proteins are the amino acids and that of the DNA molecules are the nucleotide bps. Three-nucleotide-long small DNA regions code for the amino acids that make up the proteins. Genes are the DNA regions that encode full-sizes, or in other words the full-lengths, of the proteins. In this situation, one could expect the genes to be only three times longer than the proteins, in terms of the number of residues that they contain. However, in the eukaryotic genome, genes also contain regions that are named introns, which are removed during the protein synthesis process that is termed as the protein translation. Therefore, the sizes, or in other words the residue-wise lengths, of the genes can be extremely longer than that of the proteins they are coding for. It means that some of the information that resides in the DNA is eliminated in a specific manner during protein synthesis. The actual situation is of course much more complex than that which is described in an overly simplified manner here. Yet, the aim of the current work is to equalize the information amounts of the DNA and the proteins based on the inherent relation between the protein-coding regions of the DNA (the genes) and the proteins.
2.2. Calculations
According to the Shannon’s communication theory [4,5,6], Shannon’s entropy H of a message in each highly-variable residues of the molecular chains can be calculated in bits, through the following equation:
Wherein, P0 is the probability of the event represented by the message after being received and P1 is the probability of the event represented by the message before being received. Messages are in the form of nucleotide bases in the DNA and in the form of amino acids in the proteins. P0 is 1 for both the nucleotide bps of the DNA molecules and the amino acids of the proteins. Here it is assumed for the sake of simplicity that the probability of each message P1 is separately the same and equal in both the DNA and the protein molecules, which are correspondingly 0.25 and 0.05. These probability values are sourced by the information of the total number of possible messages at each residue, which is 4 and 20, respectively, for each DNA nucleotide bp and protein amino acid. This information is derived through the common knowledge that there are 4 distinct nucleotides and 20 distinct amino acids. As a result, information entropy of each DNA nucleotide is 2 bits and that of a protein amino acid is about 4.3 bits. This calculation can be expressed differently and in a better way than the simplified versions of the calculations that are presented here. Please refer to the Appendix A for further details.
2.2.1. Calculations for the Protein without the Protein-Length Dependent Parameter
Adding up the results of the calculation by using Equation (1), respectively, for all the nucleotides and the amino acids of certain corresponding lengths of the DNA and protein molecules would end up in the information amounts of these polymeric macromolecules. So, the calculation for a given length of protein could be approximated in bits, through the following Equation (2), along with the assumption that there is no bias in the presence of certain amino acid(s) at any position or through the entire-length of the proteins:
Wherein, n is the length (or the size, which is used here interchangeably, as mentioned in the very beginning) of the protein in terms of the number of amino acids. The value of the term (P0/P1) in Equation (1) is written 20 in Equation (2) and that 20 is representing the total variation in the amino acids. (Please refer to the Appendix A for further explanation about the calculations and this simplified scheme of the calculation that is formulized as Equation (2).)
2.2.2. Calculations for the DNA
Equation (3) can be used to calculate the information amount of a given length of a coding DNA that does not contain any introns (untranslated regions of a gene). This DNA would be used for the translation of a protein with n number of amino acids. The result is in bits and the multiplication factor of 3n is due to the fact that each amino acid of the protein is encoded by a triplet nucleotide of the DNA molecule. Again, it is assumed that there is no bias for the presence of a certain nucleotide at any position or through the entire-length of the DNA molecule:
Wherein, 3n is the length of the coding DNA that does not contain any introns. This length is given as the number of nucleotide bps. The value of the term (P0/P1) in Equation (1) is written as 4 this time in Equation (3). This is the number of variation in the nucleotides that are observed at each residue of the DNA molecules. (Please refer to the Appendix A for further explanation about the calculations and this simplified scheme of calculation as Equation (3). Also, the chain-terminating codes are not considered in this study, due to their relatively minor influence.)
2.2.3. Calculations for the Protein with the Protein-Length Dependent Parameter
Here, a protein-length dependent parameter is included as a multiplier of Equation (2), with 4 distinct, semi-randomly-chosen alternative exponents, as shown in Equation (4). This new parameter is written in the first part of Equation (4) below:
Wherein, n is the length of the protein in terms of the number of amino acids. Equation (4) is calculated separately with the following exponents of the first term: 1/4, 1/3, 1/2, and 3/4. Information amounts in the proteins is aimed to be correlated to that in the corresponding sizes of the genes, namely the certain DNA regions that encode for the proteins, by the aid of Equation (4). However, the results of the calculations should better be considered here as the average sizes of the proteins and the corresponding genes since the variation in the lengths of the different proteins and their corresponding genes is immense. (Average gene size refers to the average lengths of the DNA molecules that would be coding for certain average lengths of the proteins.)
2.2.4. Calculations for the DNA with Introns (the Noncoding DNA Regions) and ΔH Calculations
Introns in the eukaryotic genomes as the noncoding DNA regions are introduced to the presented-calculations, by multiplying the information amount of the corresponding length of a DNA that is calculated by the Equation (3), with the values of the exponent m as 10, 20, 25, and 30. ΔH is the difference of the information amounts in the protein and DNA that would be encoding the same length of a protein. That is initially performed through calculations for the protein without the protein-length dependent parameter, by taking the difference of Hp and Hdna. Then, the ΔH value is calculated by using the Hp′ results, through taking the difference of Hp′ and Hdna. Finally, to this manner of ΔH calculation, the presence of introns is implemented, as shown in Equation (5). It is the difference of Hp′ and the multiples of Hdna. In Equation (5), the parameter A is allowed to take the values 10, 20, 25, and 30, separately, in each calculation. So, Equation (5) is calculated independently by using each time, one of the given A values. Calculations are performed up to a protein-length of 2400 amino acids. From the results of those calculations, the protein and the corresponding DNA lengths with the minimum non-negative ΔH value are extracted manually and compared with the literature data.
Average gene and protein sizes of distinct species that are reported in different sources in the literature are checked for their compatibility with the calculated values. The literature values of the average gene and protein sizes of distinct species are as follows: The gene size of archaea is used as 847, based on taking the average of 757 and 936 nucleotide bp-average gene sizes of the Pyrobaculum acrophilum and M. acetivorans, respectively [11]. The average protein length of archaea is 283 amino acids [12]. The average gene size of bacteria is 1000 bp [13] and the average protein length of bacteria is 320 amino acids [12]. The average gene size of yeast is 1400 bp [14] and the average protein length of yeast is 466 amino acids [15]. The average gene size of Arabidopsis thaliana is 2190 bp [16] and the average protein length of Arabidopsis thaliana is 403 amino acids [12]. The average gene size of human is 42,049 bp and the average protein length of human is 510 amino acids. This last information is derived from the respective information in the literature [17]. In humans, these values are dissected further into subgroups of average gene sizes that code for different average lengths of proteins. Consequently, genes with average sizes of 33,228 bp codes for average 386 amino acids in case of relatively short proteins, genes with average sizes of 110,202 bp code for average 1223 amino acids in case of long proteins, and genes with average sizes of 150,831 bp code for average 2421 amino acids in case of very long proteins. This information is derived from the literature as well [17]. Derivation of the average gene sizes are approximated through the reported values, by multiplying the average number of introns per gene with the average length of introns and then adding the result to that obtained by multiplying the average number of exons (the coding regions of the gene) per gene with the average length of exons. The deviations are not included in these calculations for the sake of ease.
3. Results and Discussion
Based on the inherent relation between the DNA and proteins, information amounts of the DNA and the proteins are aimed to be equalized. It is possible that there could be better approximations for the information amount equalization attempt that is described herein. However, the current one is useful in the sense that it seems to be approximating, to some extent, the increasing protein sizes with the genomes and the presence of introns in the eukaryotic genome.
When a length-wise parameter is included in the calculations as a multiplication factor (see in Equation (3)), information amount of the proteins comes to be rather comparable to that of DNA that would be coding the proteins with the same sizes as those of interest. This observation is significant since it can be biologically relevant to the observations on the organism- and species-specific distributions of the protein lengths, which are limited to certain ranges.
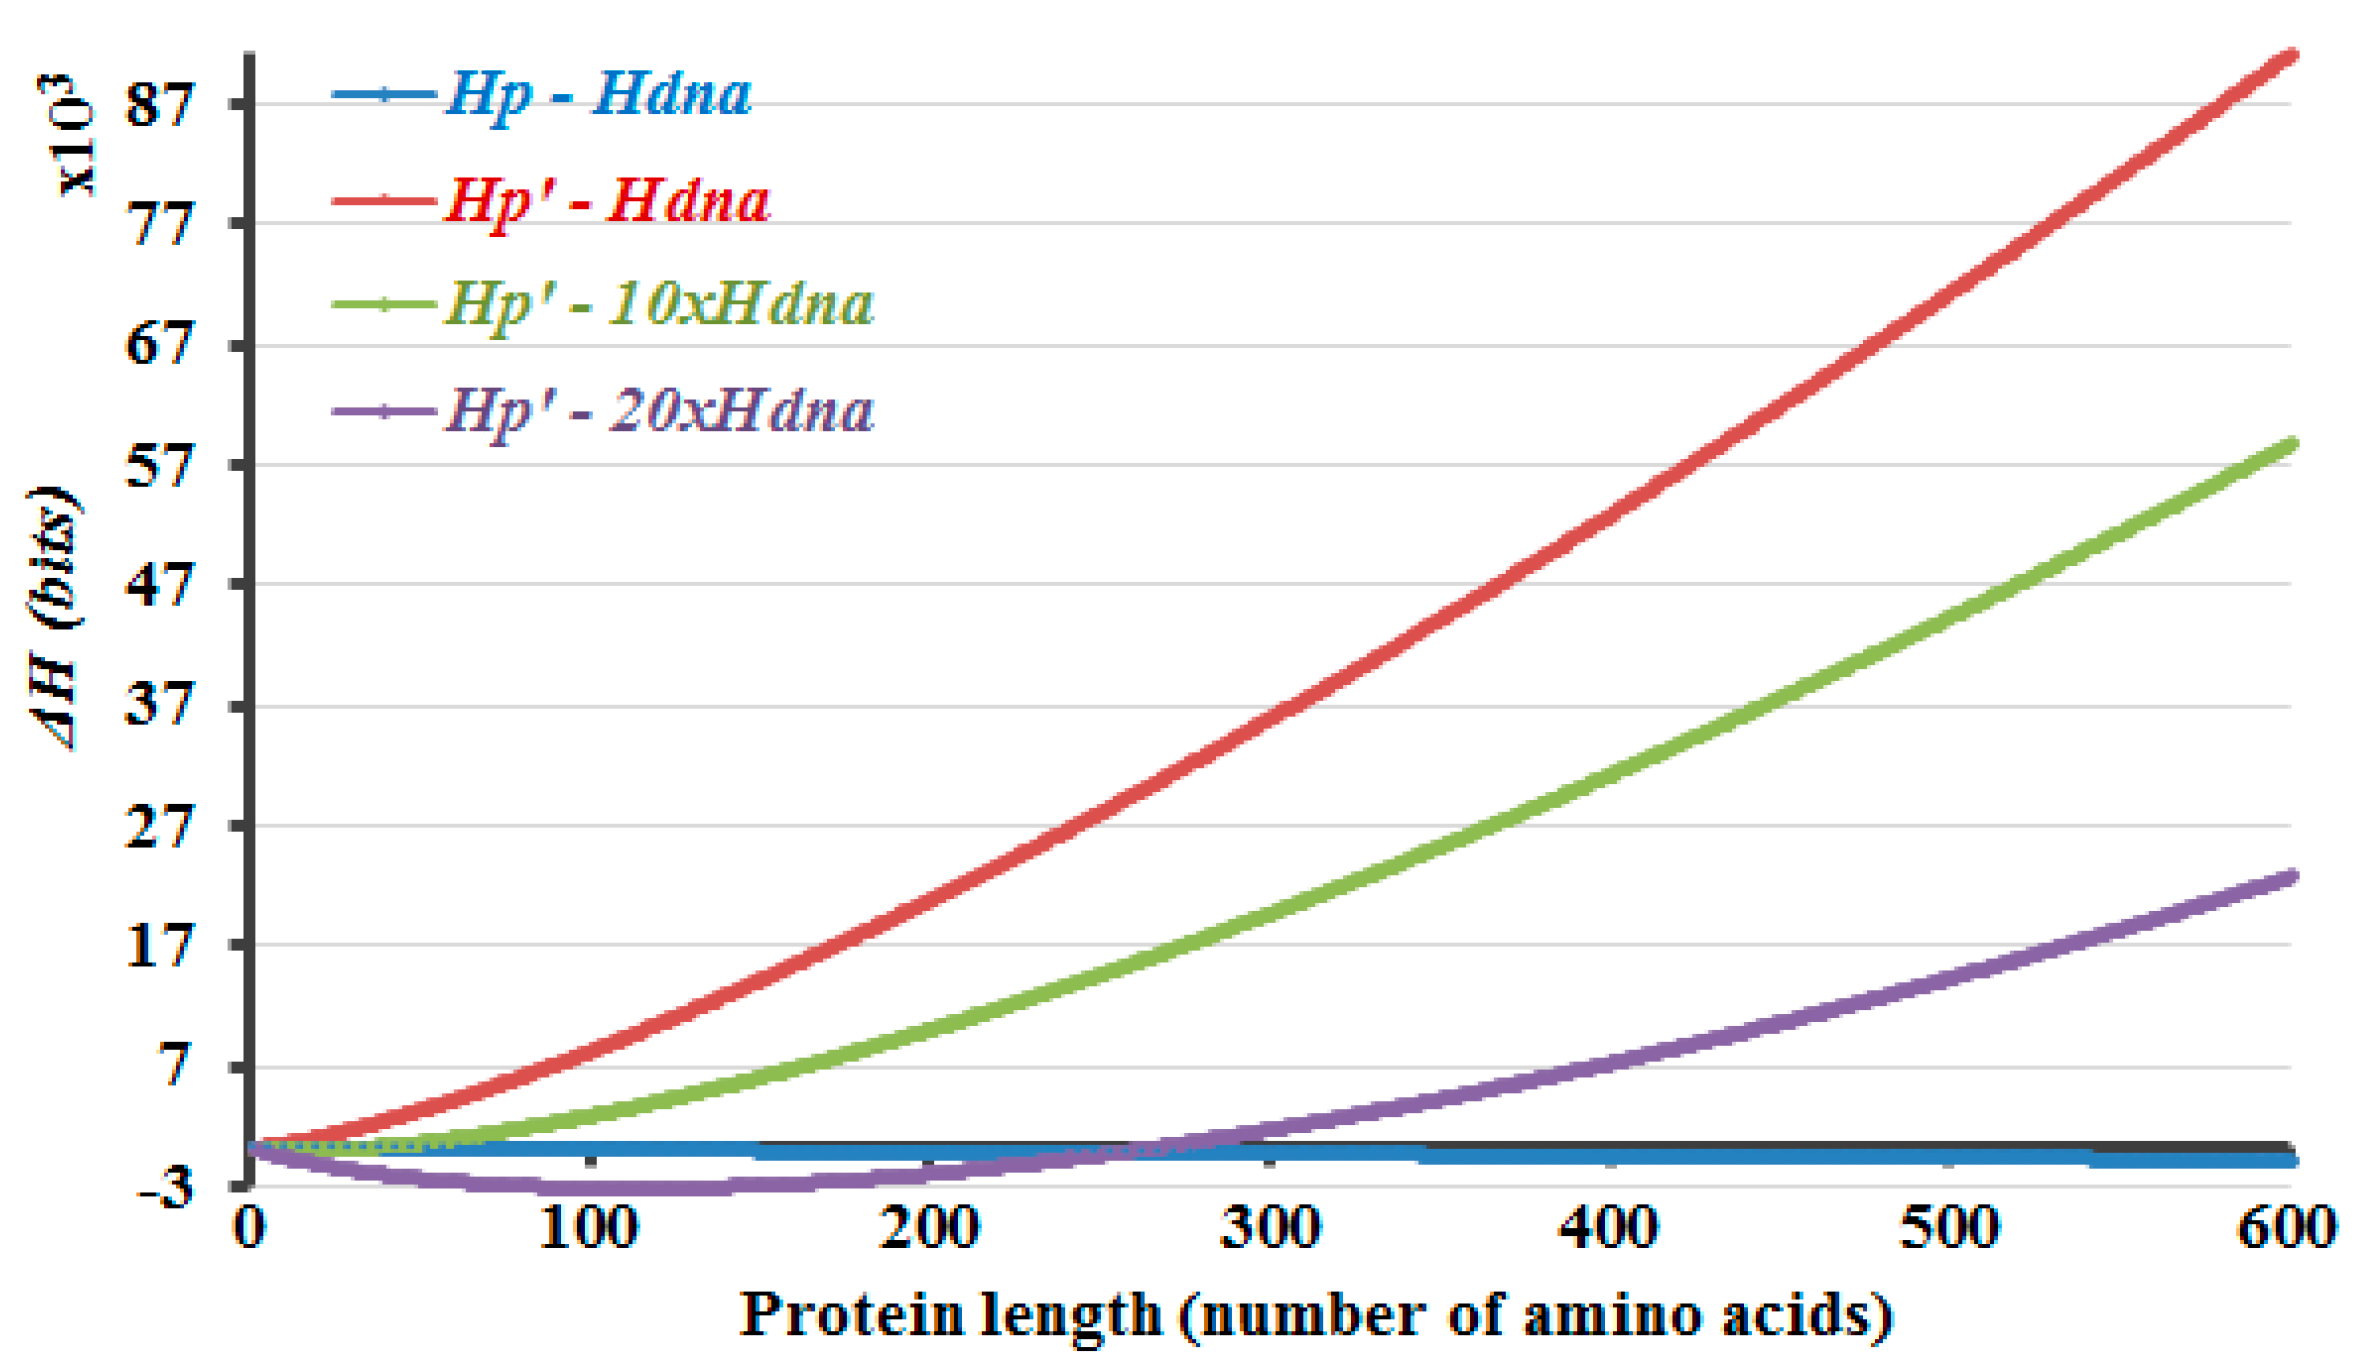
Protein-length-dependent variation of ΔH values that are calculated differently but under the condition that the exponent m is 1/3, are shown in Figure 1, as an example, and also as the results that reveal the closest approximation to the literature values (Figure 2). Actually, this work could be summarized along with the data that is shown in Figure 1. It is observed that the ΔH values that are calculated by taking the difference of Hp and Hdna (Figure 1, blue curve) decrease gradually and become more negative, as the protein length increases. Preventing this is the initial and equalization of the difference in the information amounts of the DNA and protein molecules is the latter aim of the current study. So, the mentioned decline in the information amount of proteins compared to the corresponding lengths of DNA is prevented (Figure 1, red curve) by introducing a protein-length dependent parameter in the calculations, which is described in the methods section. Although it may seem obvious to some, one may still ask why additional information amount is assumed to be present only in case of the protein molecules, in the form of information that is residing in the size, structure, and/or function features of the proteins. This is due to the fact that the direction of information flow in the process of protein translation is towards the protein, which is being translated by using the information that is encrypted in the DNA. Therefore the message-transfer event is prone to noise in that direction, from the DNA to the protein, and this can affect the success of the information transfer process. Here, regardless of such facts about the information transfer during protein translation in the biological realm, it is assumed that there is no loss (and actually also no gain) of information amount, during the translation of a protein from its encoding gene.
Turning back to Figure 1, the ΔH values that are calculated by taking the difference of Hp′ and Hdna (Figure 1, red curve) prevents the decay in the information amount in the protein, compared to that of the DNA that would be encoding the same length of proteins. However, it is obvious that the equalization is observed only at around certain length ranges of the protein and the DNA molecules, in this manner of ΔH calculation. Yet, there are introns in the eukaryotic genome and the sizes of the proteins are larger and much more varied in the eukaryotes. So, introns increase the corresponding DNA sizes to a great extent and in a variable manner. The presence of introns is implemented accordingly in the ΔH calculations, by using a multiplication factor A for the Hdna part. This multiplication factor represents the non-coding/coding regions ratio in the gene. Eventually, equalization of the information amounts of the protein and DNA molecules is started to be observed at around diverse length ranges of the proteins and the corresponding DNA molecules, as the multiplication factor A changes.
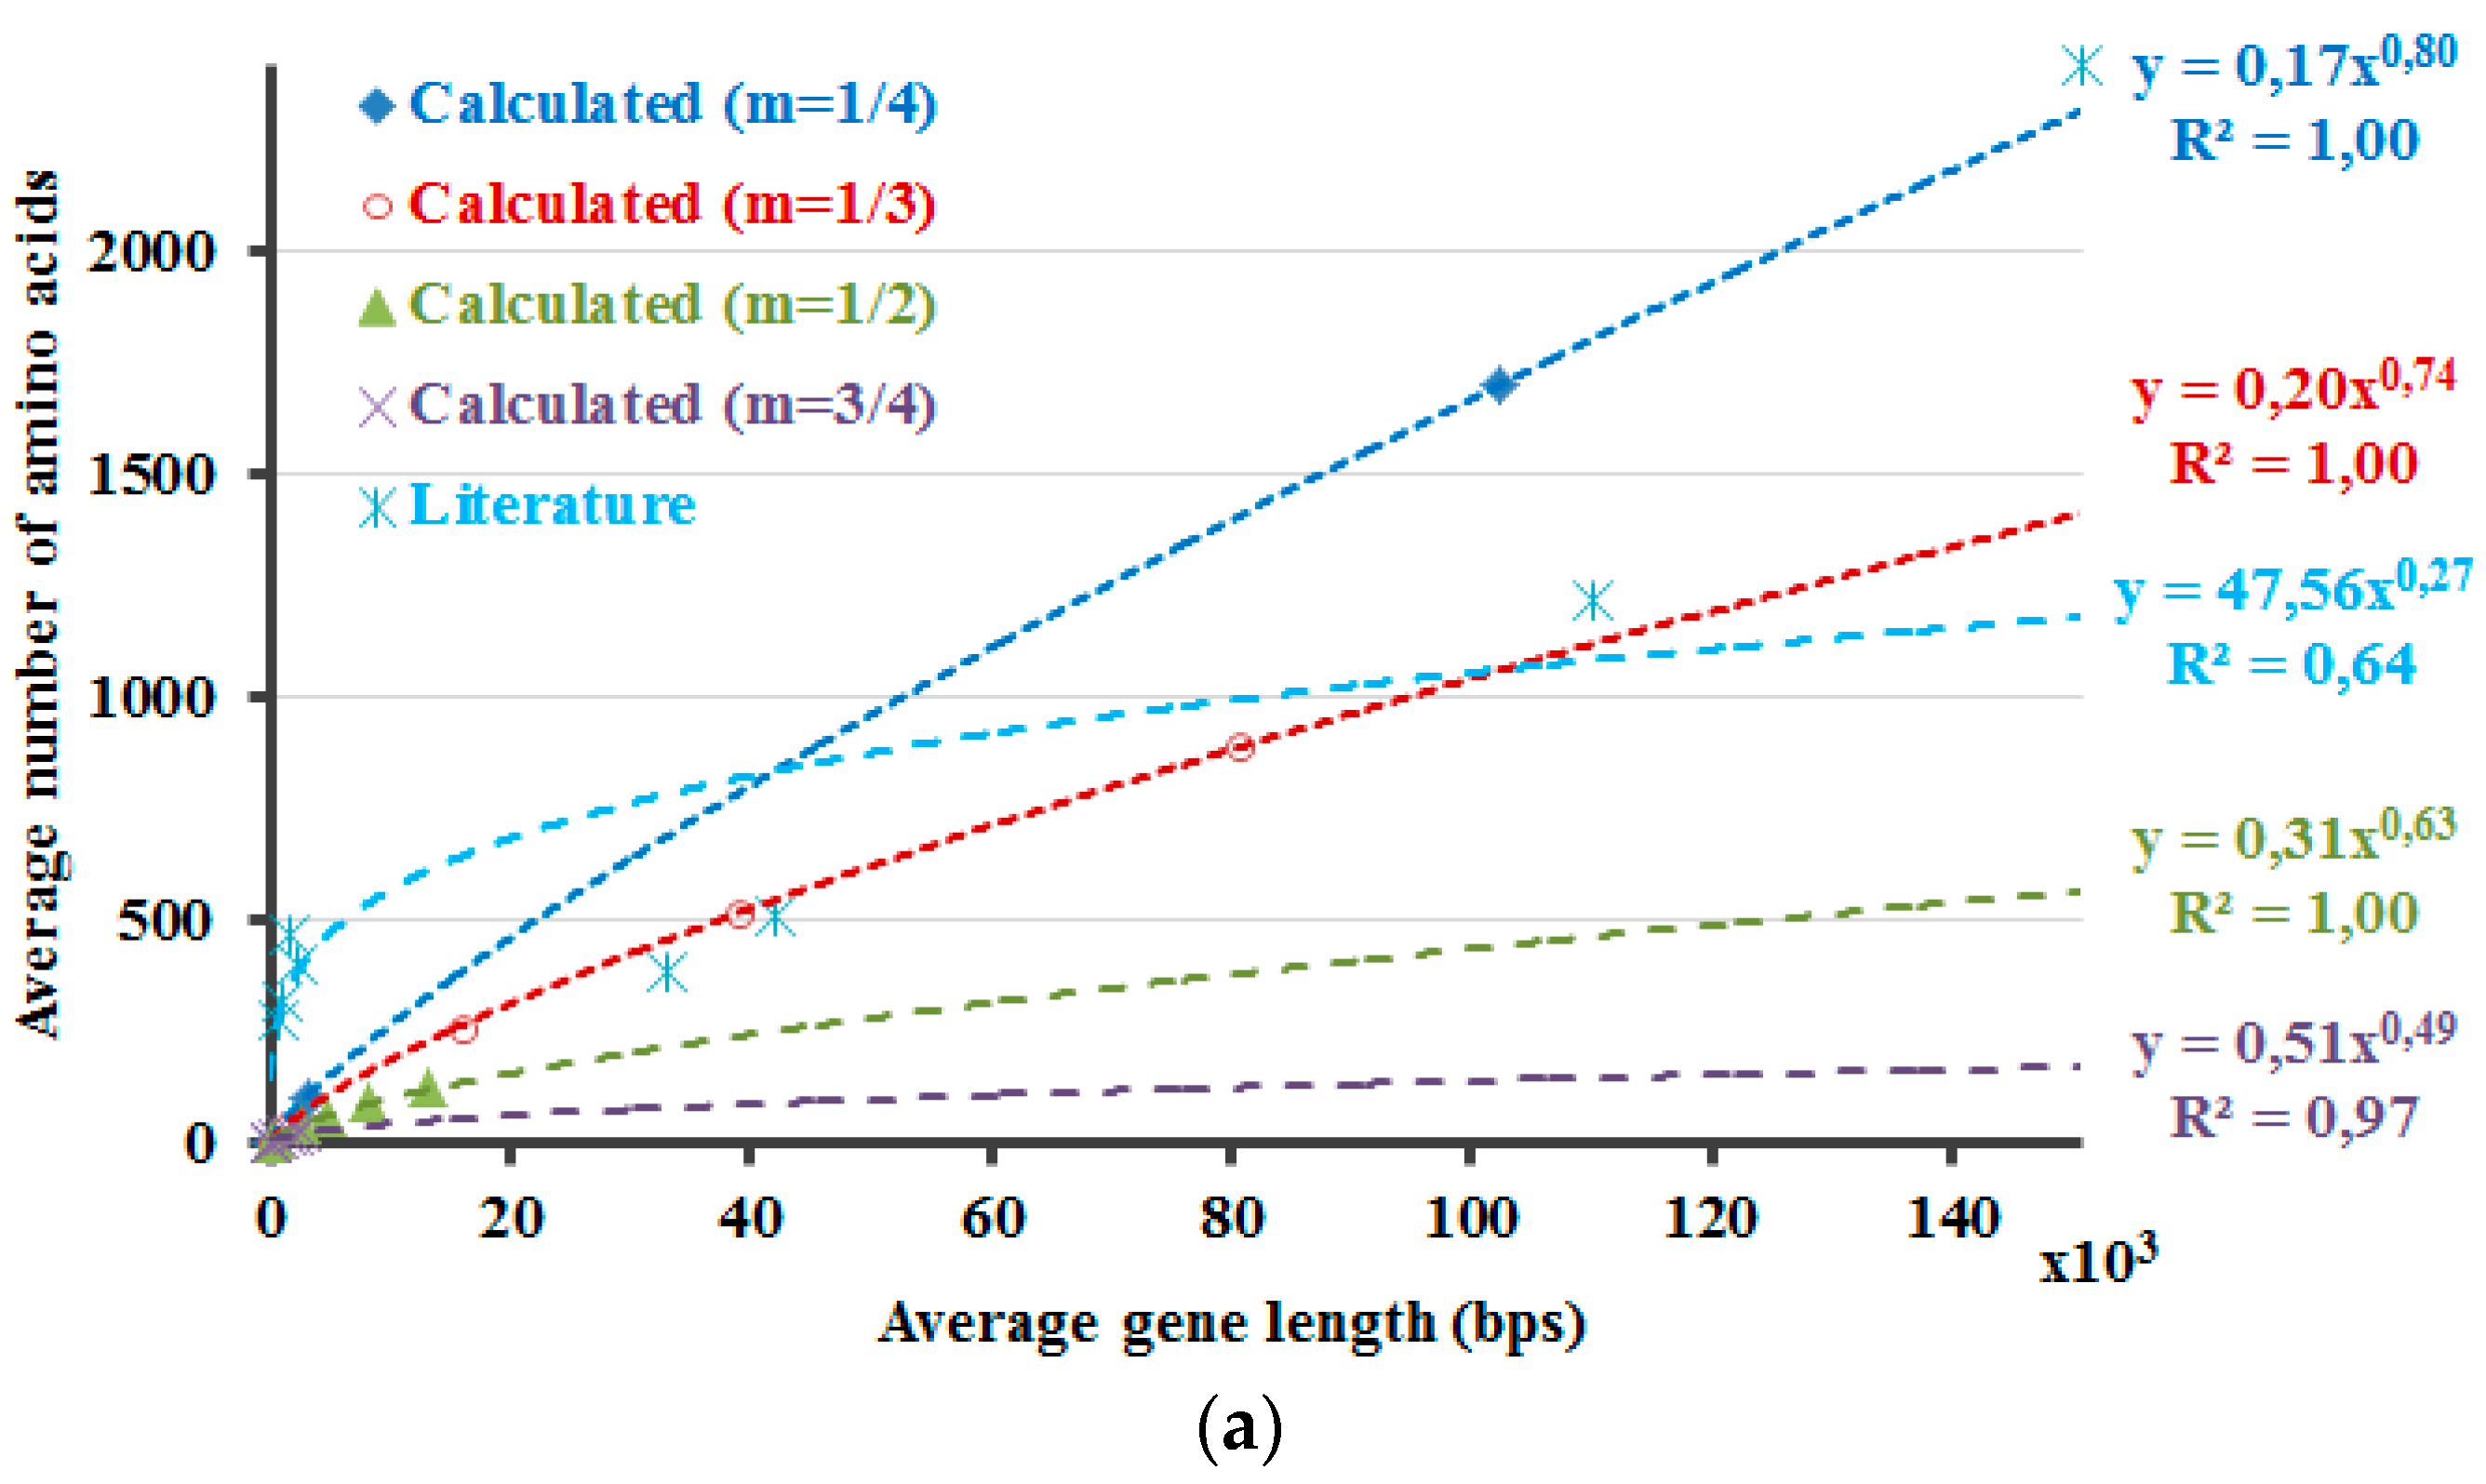
The protein lengths that reveal the minimum non-negative ΔH values that are calculated by Equation (5) are compared with the average protein and gene sizes in the literature (Figure 2). Accordingly, this method envisages the requirement of introns and the higher dissimilarity in the lengths of the proteins in the eukaryotic genome due to the occurrence of introns. If 5% of the DNA is composed of exons, with the rest part introns, the non-coding DNA, ΔH will attain the minimum non-negative value in case of a protein with 266 amino acids (Figure 1, purple curve, Hp′—20 × Hdna). The number 266 is about the point where the graph crosses the x-axis. If ~3.3% of the DNA is comprised of exons, the differences of the calculated information amounts would be zero or close to zero at about 900 amino acids (Figure 2, m = 1/3). These results are in line with the amplification of the length discrepancies in the eukaryotic proteins. Based on the same observations, it can be expected that the prokaryotic proteins would be smaller and less varied in length. Moreover, the values in the literature are correlated well with the calculated results when different sizes of the proteins in the human genome are included, as described in the last part of the methods section (Figure 2). This can also be interpreted in such a manner that the relation between the model that is proposed here and the literature-base data is noticeable when the variation of the intron amounts in different genes of the human genome and the respective proteins’ lengths are considered and included in the calculations. This relation is revealed better when 1/3 is rather used as the value of the exponential m in the calculations.
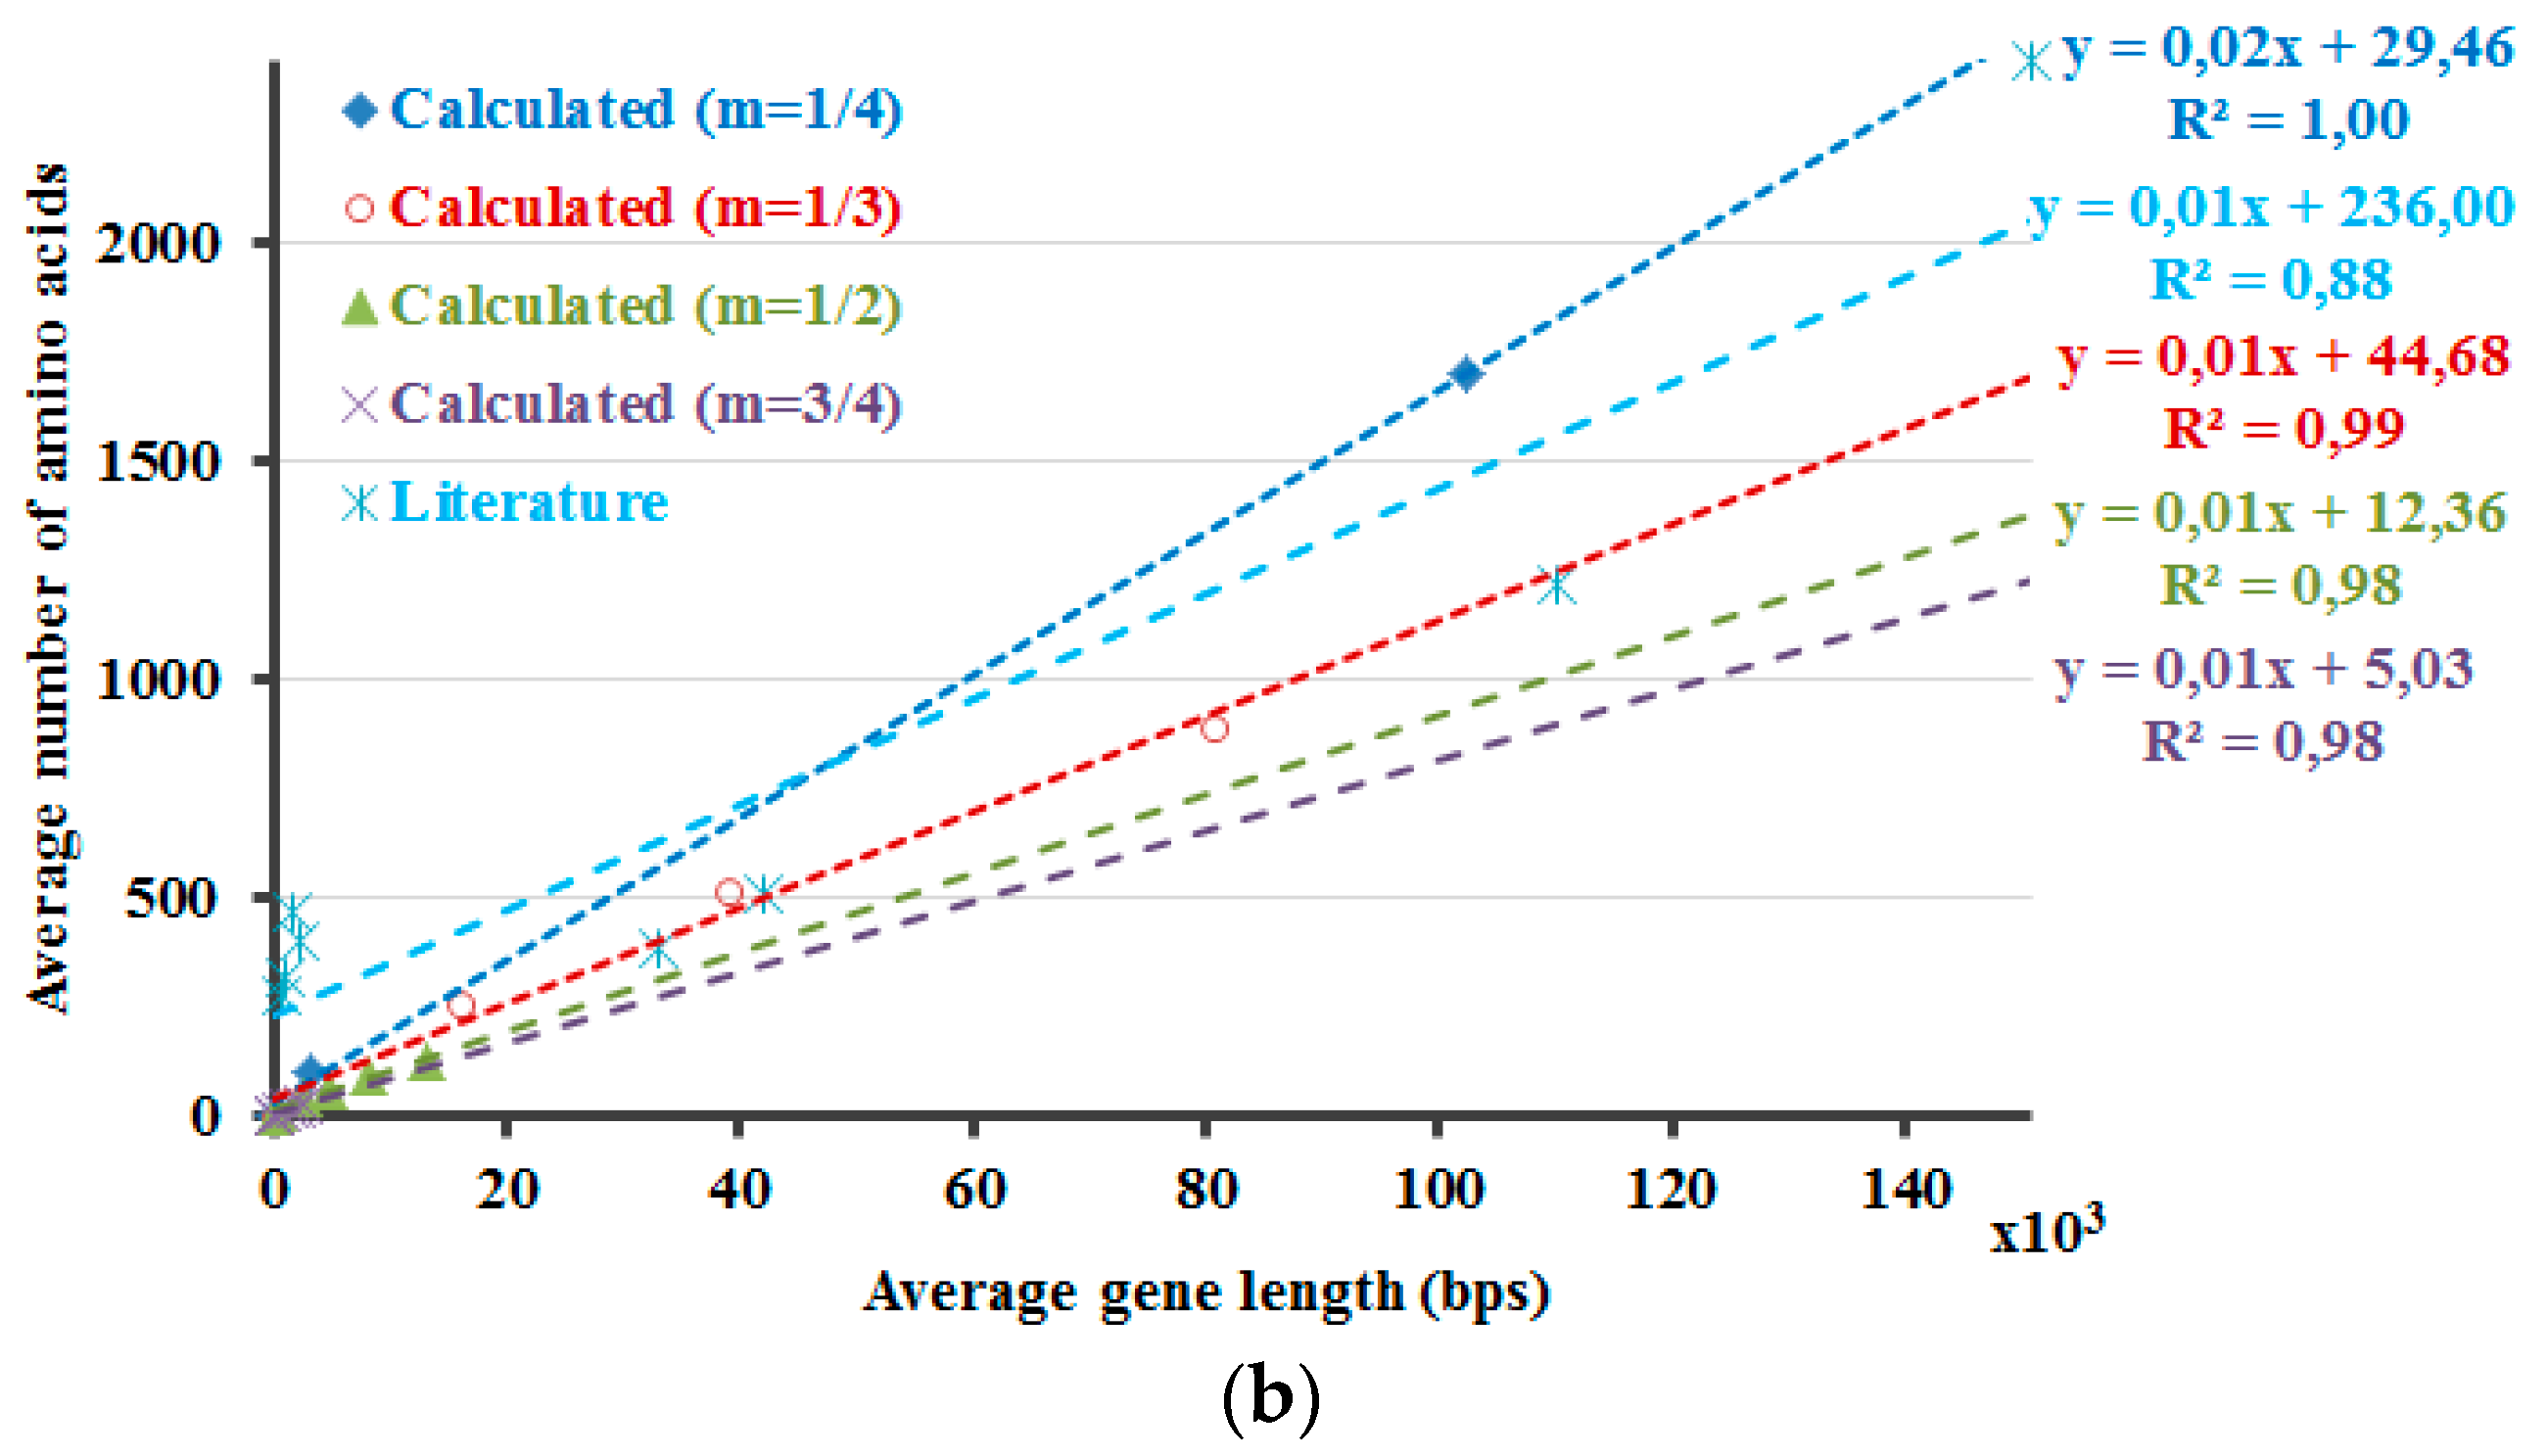
In Figure 2, the DNA and the protein lengths that reveal the minimum non-negative values as the result of the ΔH calculations are shown. First f all, the ΔH calculations are required for the determination of these values. These ΔH calculations are performed by using the Hp′ and by accounting for the presence of introns. So, in case of the Hdna calculations part, the Hdna is multiplied with distinct values of the multiplication factor A. For each distinct value of the exponential m that is used in the calculations of Hp′, separate Hdna calculations are also performed with dissimilar values of the multiplication factor A. ΔH′s are determined for all combinations of those calculations with distinct values of the exponential m and the multiplication factor A. Then, the minimum non-negative values of the respective ΔH calculations are determined to plot the graphs in Figure 2. Further, these values are compared with the average protein and gene sizes in the literature (Figure 2). At a first glance, the results that are presented in Figure 2 seem to indicate that the current approach requires further work to be improved and/or to be validated. This is because the literature values cannot be fitted with the linear or exponential models as good as the calculation results. However, this does not necessarily deteriorate the reliability of the calculations at this point. This is because the selection of the literature is critical in studies such as this one, regardless of the toughness of accessing the literature values, which are sometimes contradictory even among themselves. Therefore, the biological data that is presented here should better be considered as just a rough comparison rather than validation tool of the model, the presented-calculations. Actually, this is the major reason why the model for the equalization of the information amounts of the protein and the DNA was not derived initially simply through the literature-based data. Yet, the literature-based data is still actual, real, observed values, regardless of the properness of the data that is selected for comparison. So, the literature-based data is informative as well and one should consider, think about the possible reasons of the fact that the literature-based data is fitted better with a linear function. As a result, the prospected future work involves such considerations along with working on the improvement of the literature data set, on the model itself and also even on the development of a new and better parameter in Equation (4).
4. Summary and Conclusions
Information amounts of the proteins gradually decays as the protein length increases if only the residue variations are accounted for while comparing the information amounts of the proteins and the corresponding lengths of the genes that encode for the same sizes of the proteins. Here, it is assumed that there is no loss (and actually also no gain) of information amount, in bits, during the translation of a protein from its encoding gene, although the information in the genes that is eliminated during protein synthesis due to being untranslated is not known to be residing in the proteins. However, the assumption of this work is that the information amounts of the protein and the gene that would be coding the same length of a protein are equal. Accordingly, the aim here is to suggest a possible model to realize the condition of the equalization of the information amounts of the proteins and the corresponding sizes of the DNA molecules. With this purpose, to compare the information amounts, ΔH values are calculated through taking the difference of the information amounts of the proteins, (Hp or Hp′), and the information amounts of the DNA (Hdna). Hp is obtained by calculating the information amount in the protein by accounting only for the residue variation through the entire length of a protein. Likewise, Hdna is obtained by calculating the information amount in a gene, by accounting also only for the residue variation through the entire length of the gene. So, the ΔH value that would be calculated by taking the difference of the Hp and Hdna reveal a constant decay with increase in the protein size, as mentioned in the beginning. Hp is multiplied with a protein-length dependent parameter to end up in Hp′, as the actual information content of the proteins. This prevented the decay in the information content of the proteins. However, these ΔH calculations reveal that the protein and the corresponding DNA lengths that are estimated by this means would be present in certain ranges, which would not be representing the immense variation in life, or it would be representing maybe only one or a few species, or only certain protein and DNA sizes. This problem is resolved by itself upon considering the contribution of the untranslated regions in the genes that encode for the proteins. These regions are the introns and they increase and vary the corresponding lengths of the DNA molecules that encode for the proteins. So, the presence of different amounts of introns enable the observation of different, increasing sizes of the proteins, together with the corresponding DNA lengths that have equal information amounts with those proteins. This is in line with the notion that the protein sizes are elevated with the genomes of different organisms and the presence of introns. In this sense, this work can be considered to be presenting a novel means of evaluation of the protein length conservation and variation in species. New techniques can provide further insight to the existing discussions on the evolutionary forces that are shaping the protein sizes and distributions in the modern organisms. In the future, further implications of this work will be explored together with our recent study on the equalization of the information amounts in the messenger RNA molecules and the proteins [18]. The literature data set is also aimed to be improved, together with the model itself and the parameter that is implemented in the Hp calculation.
Conflicts of Interest
The authors declare no conflict of interest.
Appendix A
The general equation that is used instead of the Equations (2) and (3) in the text is as follows:
The subscript i in Equation (2) is the residues’ variation as the amino acid or the nucleotide type. The upper limit k is 20 when the amino acids are the variables and it is 4 when the nucleotides are the variables. The Pi stands for the probability distribution of the amino acid or the nucleotide types in the sequence, which is 0.05 for each of the 20 amino acids’ propensity of presence and is 0.25 for each of the 4 nucleotides’ propensity of presence. This is the case when there is no bias for any type of amino acid or nucleotide.
For a DNA nucleotide, as Pi is 0.25 for each 4 nucleotides and log2Pi is −2, the calculation would separately be −(0.25 × (−2)) at each time, in case of the presence of 4 nucleotides with equal presence/usage-propensities of the distinct nucleotides. This is resulting in the same information entropy as indicated in the main text, through the following calculation: (0.25 × 2) + (0.25 × 2) + (0.25 × 2) + (0.25 × 2) = 2 bits. A similar calculation would be required for the proteins, by using 0.05 for the Pi and considering that there are 20 distinct amino acids, which make 5 times more variation per each residue, compared to that of the DNA molecule. Although calculations are not preferred in this study to be computed with the equation that is given in this appendix for the sake of simplicity, it should be indicated that Equation (2) is the general form that can safely be used under different circumstances and it is also enabling the calculations to be performed by using varying occurrence-propensities of distinct nucleotides or amino acids. With Equation (2), information amount of a certain length of a polymeric macromolecular chain like DNA or protein would be calculated by summing up the entropies of each residue, as shown in Equation (3).
Wherein, H in Equation (3) is the information amount in bits, for a specific length l of the molecular chain. The subscript i is again the residues’ variation while Pi,j is the position j-specific Pi. As mentioned, the upper limit value k is 20 for amino acids and 4 for nucleotides, and Pi is 0.05 for each 20 amino acids and 0.25 for each 4 nucleotides, when there is no bias. One should take care that the length l is different in the respective DNA molecules (at least 3 folds more) than that of the proteins. So, the Equation (3) is more suitable for working with varying probabilities, when there would be bias among the usage/presence propensities of the amino acids or nucleotides.
References
- Wang, D.; Hsieh, M.; Li, W.-H. A general tendency for conservation of protein length across eukaryotic kingdoms. Mol. Biol. Evol. 2005, 22, 142–147. [Google Scholar] [CrossRef] [PubMed]
- Lipman, D.J.; Souvorov, A.; Koonin, E.V.; Panchenko, A.R.; Tatusova, T.A. The relationship of protein conservation and sequence length. BMC Evol. Biol. 2002, 2, 20. [Google Scholar] [CrossRef] [PubMed]
- Brocchieri, L.; Karlin, S. Protein length in eukaryotic and prokaryotic proteomes. Nucleic Acids Res. 2005, 33, 3390–3400. [Google Scholar] [CrossRef] [PubMed]
- Shannon, C.E. A mathematical theory of communication. Bell Syst. Tech. J. 1948, 27, 379–423. [Google Scholar] [CrossRef]
- Rontó, G. The elements of biocybernetics, communication and control. In An Introduction to Biophysics—With Medical Orientation; Rontó, G., Tarján, I., Eds.; Semmelweis Kiadó: Budapest, Hungary, 1999; pp. 369–388. [Google Scholar]
- Apter, M.J.; Wolpert, L. Cybernetics and development. I. Information theory. J. Theor. Biol. 1965, 8, 244–257. [Google Scholar] [CrossRef]
- Sullivan, D.C.; Aynechi, T.; Voelz, V.A.; Kuntz, I.D. Information content of molecular structures. Biophys. J. 2003, 85, 174–190. [Google Scholar] [CrossRef]
- Aynechi, T.; Kuntz, I.D. An information theoretic approach to macromolecular modeling. I. Sequence alignments. Biophys. J. 2005, 89, 2998–3007. [Google Scholar] [CrossRef] [PubMed]
- Aynechi, T.; Kuntz, I.D. An information theoretic approach to macromolecular modeling. II. Force fields. Biophys. J. 2005, 89, 3008–3016. [Google Scholar] [CrossRef] [PubMed]
- Sarkar, R.; Roy, A.B.; Sarkar, P.K. Topological Shannon’s entropy of genetic molecules—I. Math. Biosci. 1978, 39, 299–312. [Google Scholar] [CrossRef]
- Garrett, R.A.; Klenk, H.-P. Archaea: Evolution, Physiology, and Molecular Biology; John Wiley & Sons: Oxford, UK, 2008; p. 83. [Google Scholar]
- Tiessen, A.; Pérez-Rodríguez, P.; Delaye-Arredondo, L.J. Mathematical modeling and comparison of protein size distribution in different plant, animal, fungal and microbial species reveals a negative correlation between protein size and protein number, thus providing insight into the evolution of proteomes. BMC Res. Notes 2012, 5, 85. [Google Scholar] [CrossRef] [PubMed]
- Krebs, J.E.; Goldstein, E.S.; Kilpatrick, S.T. Lewin’s GENES XI; Jones & Bartlett Learning: Burlington, MA, USA, 2014; p. 122. [Google Scholar]
- Lewin, B. GENES VI; Oxford University Press: New York, NY, USA, 1998; p. 687. [Google Scholar]
- Lodish, H.; Berk, A.; Matsudaira, P.; Kaiser, C.A.; Krieger, M.; Scott, M.P.; Zipursky, L.; Darnell, J. Molecular Cell Biology, 5th ed.; W. H. Freeman: New York, NY, USA, 2004; p. 61. [Google Scholar]
- Zimmer, A.D.; Lang, D.; Buchta, K.; Rombauts, S.; Nishiyama, T.; Hasebe, M.; Van de Peer, Y.; Rensing, S.A.; Reski, R. Reannotation and extended community resources for the genome of the non-seed plant Physcomitrella patens provide insights into the evolution of plant gene structures and functions. BMC Genom. 2013, 14, 498. [Google Scholar] [CrossRef] [PubMed]
- Sakharkar, M.K.; Kangueane, P.; Sakharkar, K.R.; Zhong, Z. Huge proteins in the human proteins and their participation in hereditary diseases. Silico Biol. 2006, 6, 275–279. [Google Scholar]
- Adiguzel, Y. Equalizing the information amounts of protein and mRNA by information theory. BioSystems 2017, 159, 1–11. [Google Scholar] [CrossRef] [PubMed]
Figure 1.
Protein length versus ΔH values under the condition that the exponent m in the calculations is 1/3, wherever used. ΔH calculation is done individually by using the Hp calculation in Equation (2) (blue curve), by using the Hp′ calculation in Equation (4) (red curve), and by using the Hp′ calculation in Equation (4) together with the additional consideration of the presence of about 9% (green curve) and 5% (purple curve) exons, sequentially, in separate calculations. It is observed that the ΔH values that are calculated by taking the difference of Hp and Hdna (blue curve) decrease and become more negative, as the protein length increases. This decline is prevented by introducing a protein-length dependent parameter in the calculations, as described in the methods section (red curve). The minimum non-negative ΔH value relates to the equalization of the information amounts in the protein and the corresponding size of the DNA molecule. It is observed only at around certain length ranges of the protein and the DNA molecules, in case of each ΔH curve in the figure. This problem is overcome by the implementation of the presence of introns in the calculations of ΔH. The presence of introns is included in the ΔH calculations, by means of using a multiplication factor A for the Hdna term that is subtracted from Hp′. This varies the protein and the corresponding DNA lengths, where the equalization of the information amounts is observed. This multiplication factor A is 10 (green curve) and 20 (purple curve) in case of the graphs that are shown in the figure.

Figure 2.
Average gene and protein sizes of distinct species that are reported in different sources are checked for their comparability with the calculated values. The calculated values’ data of these graphs is the DNA and the protein lengths that reveal the minimum non-negative values of the ΔH results that are calculated through Equation (5). In line with the presented method, fitting of the data with exponential functions (a) leads as expected to very good results for the calculated data. However, this is not the case for the literature-based data. The situation improves for that literature-based data, through fitting the data with a linear function (b). The results of fitting the data with linear functions are plausible for the calculated data as well. For the data that is shown in (b), the least square fit analysis was performed for the closest result to the literature values according to the multiplier of the x-parameter in the linear-fit function, and the slope of the data were not statistically different at the 0.05 significance level.

Publisher’s Note: MDPI stays neutral with regard to jurisdictional claims in published maps and institutional affiliations. |
© 2017 by the author. Licensee MDPI, Basel, Switzerland. This article is an open access article distributed under the terms and conditions of the Creative Commons Attribution (CC BY) license (https://creativecommons.org/licenses/by/4.0/).
Share and Cite
MDPI and ACS Style
Adiguzel, Y. Information Theory for Equalizing the Residue-Wise Information Amounts of the Proteins and Protein-Coding DNA. Proceedings 2018, 2, 165. https://doi.org/10.3390/ecea-4-05017
AMA Style
Adiguzel Y. Information Theory for Equalizing the Residue-Wise Information Amounts of the Proteins and Protein-Coding DNA. Proceedings. 2018; 2(4):165. https://doi.org/10.3390/ecea-4-05017
Chicago/Turabian StyleAdiguzel, Yekbun. 2018. "Information Theory for Equalizing the Residue-Wise Information Amounts of the Proteins and Protein-Coding DNA" Proceedings 2, no. 4: 165. https://doi.org/10.3390/ecea-4-05017