Abstract
Water management has become a global priority in recent decades. The demand for water resources is increasing in cities due to the increase in population and the intensive use of water in economic activities and ornamentation. The problem is exacerbated when cities are built on desert regions, this is the case of Lima which is the second largest city built on a desert after Cairo. In this type of cities, it is necessary to minimize water consumption in activities that do not cover the priority needs of the population. For this reason, one of the most important tasks in the management of water resources in Lima is the optimization of water use in irrigation of parks, malls and other public green areas, necessary to offer a good quality of life to citizens. This research develops a smart decision support system to optimize irrigation in city parks. The proposed methodology takes 4 variables: land area, temperature, park humidity and weather forecast. First, strategic segmentation of the total area of the park is carried out, followed by the use of low-cost sensors to construct real-time humidity and temperature maps of the land area. Afterwards, a fuzzy inference system (FIS) that incorporates the knowledge of agronomists to process vague information in terms of computer interpretable language, together with the data collected from the variables and humidity and temperature maps is built, to assess the need for irrigation of each segment of the park. A dashboard is made to facilitate the visualization of results, including humidity and temperature maps, the weather forecast for the area and the recommendation of the FIS, which supports decision-making on irrigation needs in each segment of the park. The methodology was applied in a case study that corresponds to a San Isidro park in the city of Lima. Significant expected savings were obtained in terms of water resources and monetary units, which demonstrates the viability of the application of this smart system oriented at supporting decision-making on smart irrigation in the city’s parks.
1. Introduction
Water resources management has become a global priority in the last decades [1]. The Rio + 20 Declaration emphasizes the need to establish a green economy to achieve sustainable development and at the same time protect and improve the management of the world’s natural resources [2]. Thus, water resources are increasingly recognized as a central pillar of the green economy. In most cases, the preservation of water resources is an engine of economic growth and a prerequisite for commercial investment. However, in some localities, good water management comes as a result of growth [1]. The significance of water resources is justified by different factors. It is stated by the Water Problems Institution of the Russian Academy of Science that the demand for water has more than tripled in the last 50 years. Besides, over four billion people will experience water resource shortage by mid-21st-century [3]. Furthermore, studies prove that the domestic and industrial use of water resources is 30 times higher than the consumption of all other resources [4]. Hence, it is very important to make a responsible management of the water resources in the cities, not only in first world countries but also in the developing ones like Peru. This is because Peru has a strategic location for water resources. Its territory includes the Pacific Ocean coast; the origin of the Amazon River, the longest river in the world; and 71% of the tropical glaciers in South America. 25% of the aquatic ecosystems are in the Amazon region and its basins represent 5% of the world’s fresh water. Because of the availability of superficial, ground and atmospheric water, Peru has a large water supply accounting for 4.6% of the volume of the world’s runoff [1]. A major concern in Peru is that the most populated region has the lowest available water supply and the least populated has the highest available water supply. Most of the major cities in Peru are located near the coast. Therefore, the most developed region could have the most serious water supply problem [5]. In this sense, a study of the main water supplier for the districts of Lima, Sedapal, indicated in a press release that most districts in Lima far exceed the limit of litres per inhabitant per day suggested by the World Health Organization in 2005 (50 litres). More specifically, San Isidro district habitants consume the most litres of water per inhabitant per day (346 litres) [6]. The goal of this study is to develop a smart decision support system to optimize irrigation in city parks. The proposed methodology takes 4 variables: land area, the temperature of the surface, parkland humidity and weather forecast. First, strategic segmentation of the total area of the park is carried out, followed by the use of low-cost sensors to construct real-time humidity and temperature maps of the land area. Afterwards, a fuzzy inference system (FIS) that incorporates the knowledge of different agronomists together with the data collected from the variables and humidity and temperature maps is built, to assess the need for irrigation of each segment of the park. A dashboard is made to facilitate the visualization of results, including humidity and temperature maps, the weather forecast for the area and the recommendation of the FIS, which supports decision-making on irrigation needs in each segment of the park. The methodology was applied in a case study that corresponds to a San Isidro park in the city of Lima. Significant expected savings were obtained in terms of water resources and monetary units, which demonstrates the viability of the application of this smart system oriented at supporting decision-making on smart irrigation in the city’s parks. This paper is organized as follows: In Section 2, the background information and literature review is given. In Section 3, a detailed description of the proposed methodology and procedures is given. The experimental/numerical settings are presented in Section 4. Results are presented and discussed in Section 5. The paper is concluded in Section 6.
2. Literature Review
In the literature, there are several approaches to the water resources management problem. Most investigations are related to model and optimize large-scale farming crops irrigation systems using large wireless sensor networks and actuators based on Internet of Things (IoT). Nonetheless, there are investigations related to in-house garden irrigation systems based on low-cost sensors. A review of the state of the artworks is presented in this section.
Low-cost intelligent irrigation systems have recently grown in popularity due to the development of the IoT area in the last years. Kumar Sahu, C. & Behera, P. [7] developed an intelligent irrigation system affordable and easily accessible to India’s farmers. Due to the fact that farmers in India have different fields located in separate areas they spend a considerable amount of time managing the water flow valves. Low-cost sensors allow the implementation of the system to be affordable in economic terms for the average Indian farmer and automate the valves management. Basomingera, R. [8] demonstrates the functionalities of an intelligent irrigation system for farmers communities using low-cost communication and control systems. The authors proposed the use of Global System for Mobile (GSM) communications technology to transfer data between sensors, the microcontroller, the farmers and the online data storage. The proposed systems are easy to use and help to make decisions regarding when and how much to irrigate taking into account the availability of water. Namala, K.K., [9] proposed an intelligent irrigation system based in an Arduino UNO, a RaspberryPi, humidity sensors and a water flow controller to enable automatic watering considering three threshold soil values: wet, semi-wet and dry. The author indicates that the system is low-cost and the results show high effectiveness for floral plants irrigation, nonetheless it could not include the weather forecast variable.
There exist several investigations regarding the design, implementation and evaluation of large intelligent irrigation systems based on wireless communication protocols and robust sensing in the agricultural sector. Harun, et al. [10] present a Wireless Sensors Network approach to build a decision support system (DSS) capable of monitor temperature, humidity and moisture in a centralized way for resource optimization. The author states that his proposal will contribute to the Precision Agriculture field. Moreno, et al. [11] proposed a software tool to improve the design and development of pressurised irrigation systems considering water saving, CO2 emission reduction and field production. Pawlowski, et al. [12] presents an irrigation system for the optimization of tomato crops production in a controlled microenvironment. In the mentioned study a prediction algorithm was proposed to determine when to water the crops. Fernandez-Pastor, F.-J. [13] proposed a user-centred design of an intelligent irrigation system using IoT. Logical rules (if-then statements) determined by agronomists and sensors were used to measure soil temperature and humidity. The main conclusion was that co-designed systems allow integrating the new technologies with professional knowledge, adding flexibility and ease of use. Yang, et al. [14] presents a generic DSS for scheduling irrigation in farmer districts of China. This mentioned irrigation system is based on fuzzy interval programming, which allows it to be easily applied in different cases. Nguyen, et al. [15] propose a large-scale irrigation control system using mathematical modelling of a water channel and numerical optimization techniques. Izzudin, T.A [16] mentions that in order to obtain good harvests in agriculture, irrigation must use the necessary amount of water, not much or little, but an exact measure depending on the specific conditions of each harvest. To achieve this goal the author design a control system with fuzzy logic based on soil humidity, air temperature and light. The main objective of this paper is to control the water flow in agricultural fields.
The generic structures of the state of the art irrigation systems are analyzed and summarized in some academic research papers, such works serve as sources of knowledge for identifying investigation gaps in the area. Jayaraman, P.P, et al. [17] analyzed the effectiveness and applicability of the OpenIoT platform applied in the area of Digital Agriculture. This platform uses ontologies to organize and efficiently represent the data collected by soil moisture and temperature sensors. The use of ontologies in IoT applications allows better results in terms of interoperability between devices. Koprda, Š, et al. [18] indicates new trends in irrigation systems and presents the design, implementation and evaluation of a low-cost IoT solution for automatic irrigation systems. The goal of this prototype was to improve the people’s life quality by reducing human intervention in mechanical and/or heavy tasks. Difallah, W. [19] determines the most important characteristics of irrigation systems such as Climate-aware, real-time sensing, adaptability to different irrigation strategies. The author states that there is still a long way to go in the area of intelligent irrigation systems considering water scarcity.
The above-cited works present simulations that validate the significant environmental and economic benefits of using DSS or automated systems for irrigation control. Nevertheless, these investigations were mainly focused in agricultural fields, farming micro-environments or in-house gardens, thus practical applications of intelligent irrigation systems are tested and implemented mostly in private areas. In this paper, the main contribution is a smart proposal for improving water management in city public parks irrigation systems. On the other hand, the literature review showed a gap in the use of computational intelligence for determining the outputs and integrating expert knowledge into the system. Thus, this work proposes a support method for water management in urban green areas, using sensed land data, environmental variables and knowledge of specialists, with the use of low-cost sensors; hoping that this work will serve as a starting point to the further development of this type of systems in urban green areas.
3. Methodology and Procedures
The proposal of this work is to create an intelligent system that supports management of water resources in urban parks irrigation. To achieve this, a 3-stage methodology is proposed, this can be seen in the Figure 1.
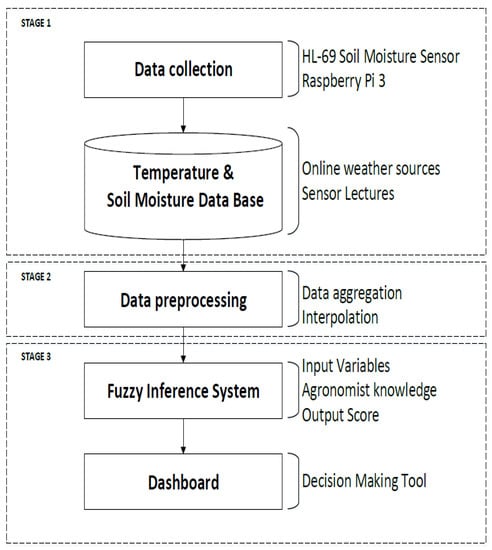
Figure 1.
Proposed methodology.
In the first stage of the proposed methodology, data collection is performed using soil moisture sensors and a Raspberry Pi 3. The Raspberry Pi 3 is a micro-computer that runs a Linux distribution operating system called “Raspbian”. This device is capable to communicate with several sensors and to online servers that store the database used in the system. In this study, the low-cost soil moisture sensor HL-69 is used to retrieve the humidity data to the Raspberry Pi 3.
The park area was divided in an 8-by-8 grid and there were collected 64 humidity values for each day of the week. Then, a database is created with the collected values and also with information about surface temperature in the area obtained from a reliable online source: The Weather Channel [20].
In the second stage, a data processing is performed, first, the park is divided into 4 quadrants, this is done in order to have a área dimension and to know the necessities of each part of the park, and then the minimum sample size is calculated based on following equation [21]:
where n is the minimum sample size, T is the value on the T-student table, because the means are being compared, S is the standard deviation of the sample and d is the error. The minimum sample size is determined in order to know how many sensors can describe the variables used in the model in order to have the most accurate information possible. Then, the n resulting values were interpolated to 64 humidity values in an 8 by 8 grid matching the dimensions of the original dataset to later make comparisons, this was done using the RBF interpolation with a Gaussian function, which is based on computing the distance of two points in the d-dimensional space and follows Equation (2) [22]:
where N is the number of observations, w are the weights to be computed, and gamma is the spread hyper-parameter of the Gaussian function. The results of this interpolation represent a real-time humidity and temperature maps of the land area since the initial sample size was of a minimum of 60 data points, an 8 by 8 grid is used to represent adequately the distribution of the variables along the park. The resulting values are used as input to the third stage of the proposed methodology. In the third stage, a fuzzy inference model based on rules of a team of local agronomists, that have worked in the municipality of San Isidro for 10 years, is applied to the input data in order to obtain scores of each sub-area, this is done in order to assess the need for irrigation of each segment of the park.
Fuzzy Inference Systems aims to process vague human concepts in terms of computer interpretable language and model input-output nonlinear relations. Fuzzy Inference Systems consists of three parts: the fuzzifier, the fuzzy inference engine, and the defuzzifier. The input variables enter into the system via the fuzzifier which evaluates a numerical value in the predefined fuzzy sets. The fuzzy sets determine membership functions that have values between zero and one. A fuzzy set A in a whole set U is defined as an ordered pair as follows (3):
where A is a fuzzy set, U is a whole set of ordered pairs of membership degrees for each point in the fuzzy set A.
The next step in the system is interpreting all fuzzified input variables in the fuzzy inference engine. This engine is based on rules given by human experts. The last step is the defuzzification of the inference result that produces an output that can be interpreted by the decision makers according to the given rules in the fuzzy sets. This defuzzification process is usually given by the centre of area (CoA) of the output membership function, this area is the representation of the established rules and the values of the inputs as shown in the following Equation (4) [23]:
where x is the value of the variables and CoA represents the consensus according to the established rules representing a score for that value. This method helps us as a way to unambiguously measure the variables associated with the performance of the areas of the parks and determine how good or how bad each part of the park is being irrigated.
Finally, a dashboard is used to show the values of humidity and temperature in real time for each zone using heatmaps, the scores for each zone and a recommendation of action for every case. This is done so that any person in charge of the irrigation of the park can make good decisions based not only on suppositions but on real-time information about the park using the proposed system.
In summary a methodological framework is proposed, this includes data collection (sensors and online sources), data storage (online database), data pre-processing (system input variables), interpolation of the land humidity and temperature values to minimize the amount of sensors needed for a good representation of the variables, a fuzzy inference system whose output is a score based on the variables, and finally a visual decision-making tool (dashboard) with recommendations to help those in charge of the irrigation to make better and more informed decisions.
4. Experimental/Numerical Setting
The data used in the model corresponds to those measured in the Tamayo Park. The measurement was made with the help of low-cost humidity sensors, a raspberry Pi 3 to connect remotely from the cell phone so the measurements are made easier and a portable cell phone charger to provide the necessary energy for sampling with the sensor. Although sensor measurements do not necessarily have the precision or accuracy of traditional instruments, they are versatile and economical enough to be used in acquiring soil moisture values, even critical points of soil moisture could be identified in real time in order to determine if there is an over-irrigation or under-irrigation at any point of the park.
A pilot sampling was done to calculate the minimum sample size, at each measurement point, 60 “A” samples were taken in an interval of approximately 2 min and those measurements were averaged to represent the average humidity of that “B” point, then 64 “B” points were obtained in the whole area per day. In order to determine the minimum sample, the preliminary data was divided into 3 blocks with different ranges of humidity, Low (0–30), Medium (30–70) and High (70–100). Then the minimum sample was calculated according to the literature, and the result was 18 data points [21]. After this, the relative frequency of each block was calculated and multiplied to the minimum sample size to determine how many data points of each block are going to be randomly sampled, this is the basic idea of a stratified sampling.
After obtaining the minimum sample size, the whole park was divided into 4 sub-areas, this was done to identify the corresponding treatment for each sub-area. After that, the average of each quadrant was calculated, which make a total of 28 averages (4 averages every day for 1 week), which are one of the input variables to the fuzzy model and the other variable is the average temperature of the park surface corresponding to each humidity average for each quadrant. Then, the scores per quadrant during the week were calculated and also the number of days of the week that are being over-irrigated or under irrigated based on the recommendations of the system. With that information it is possible to approximately estimate the number of days in the year in which the park needs irrigation (using the data of 1 week and extrapolating for the whole year) this is because the irrigation is done in the same way every day of the year, thus water and monetary savings are estimated.
5. Results and Discussion
In this section, the main results of the proposed methodology are presented as well as a brief discussion about these results. Table 1 shows the performance of the four tested interpolation functions, the idea behind testing different interpolation functions was to find the one that performs better with our dataset. The interpolation functions were chosen using the lowest MSE, RMSE and MAPE, these are a measure of the quality of an interpolation, the metrics are always non-negative and values closer to zero are better. The MAPE assigns a percentage value of error comparable between the interpolation functions while MSE and RMSE are expressed in terms of the quantity being estimated. This is useful in that it allows the error measured to be of the same magnitude as the quantity being interpolated. In addition, the MSE and RMSE exaggerate the presence of outliers, while the MAPE does not [24]. The Radial Basis Function (RBF) obtained the best performance in terms of mean absolute percentage error (MAPE), mean squared error (MSE) and root mean squared error (RMSE).

Table 1.
Comparison of the performance of interpolation functions.
Figure 2 shows the proposed Fuzzy inference system (FIS). The FIS has 2 inputs, humidity with values from 1 to 100 (this unit represents the output voltage converted into the sensor humidity scale) and temperature with values from 14 to 30 (Celsius) for each quadrant. It also has 9 rules validated with the local team of agronomists and responsible of the park and green areas of San Isidro and the output that is a score from 1 to 100. There are 3 fuzzy sets for each input and output representing low, medium and high, this way of separating the information was also validated with the agronomists.
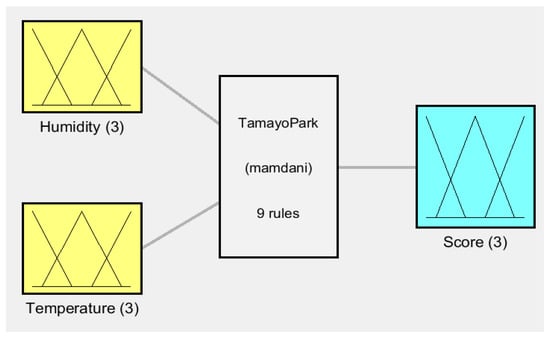
Figure 2.
Fuzzy inference system.
There are 9 rules in the FIS, these rules were validated with the local authorities and the local agronomists in charge of the irrigation of the park, these rules are presented as follows:
- If (Humidity is Low) and (Temperature is Low) then (Score is Low)
- If (Humidity is Low) and (Temperature is Medium) then (Score is Low)
- If (Humidity is Low) and (Temperature is High) then (Score is Low)
- If (Humidity is Medium) and (Temperature is Low) then (Score is High)
- If (Humidity is Medium) and (Temperature is Medium) then (Score is Medium)
- If (Humidity is Medium) and (Temperature is High) then (Score is Medium)
- If (Humidity is High) and (Temperature is Low) then (Score is High)
- If (Humidity is High) and (Temperature is Medium) then (Score is High)
- If (Humidity is High) and (Temperature is High) then (Score is Medium)
The maximum and the minimum water usage and the cost associated with the prices obtained from the district’s water supplier, sedapal were estimated in order to evaluate the performance of the proposed irrigation methodology [6]. Nowadays, the park is irrigated by sprinklers, each sprinkler expels between 1500 to 2000 litres of water per hour. With this information, the minimum and maximum water used by the 50 sprinklers for 15 minutes a day, is estimated for a year. This information is summarized in Table 2.
Table 2.
Expenditure on irrigation.
As shown in Table 2, the annual expenditure savings in terms of cubic decimeters is very high, with an averages savings of 3,303,125 cubic decimeters. Although the monetary saving is not so high, this is because the state currently subsidizes the water and makes the expenditure significantly less than in other Latin American countries [6]. Table 2 also shows how many resources are used in the current irrigation and how many resources are used by the proposed methodology of irrigation based on data, this can be seen in the row of “Current Irrigation” and “Irrigation based on data” respectively.
Figure 3 shows the proposed dashboard, there are 4 important figures: First, humidity and temperature maps for the park are presented to achieve real-time monitoring of the soil humidity and quadrant temperature. The humidity map of the park was constructed using the values obtained through the interpolation of the data collected by sensors, the temperature map was constructed using the average temperature from the total quadrant since the variations for the 18 points were not significant enough, this is because a variation of 1 or 2 units does not represent a big impact in the score calculated. Then, the hourly precipitation forecast for the day is presented, this forecast helps the agronomists in the decision of when to water the park. Finally, the dashboard also presents the fuzzy inference system output (scores) by quadrant with the recommendation interval given by the experts. The scores provide a clear measurement of the quality of the soil for each quadrant to the agronomists. In a real case scenario, the experts would combine the forecast, the maps and the score to take appropriate decisions for irrigation. For example, if the scores values of the quadrants are low but the precipitation forecast indicates that it is very likely to rain in the next hours the recommendation would be to not water the park. This is a very useful way of presenting the key performance indicators to the decision makers.
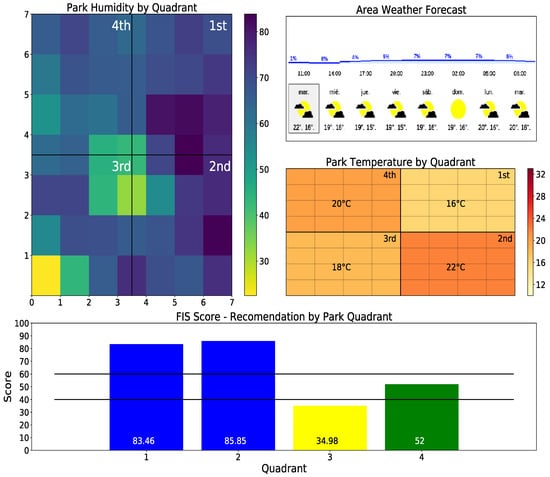
Figure 3.
Proposed dashboard.
6. Conclusions and Future Research
In summary, a methodological framework is proposed, this includes data collection (interviews, sensors and online sources), data storage (online database), data pre-processing (system input variables), interpolation of the land humidity and temperature values to minimize the amount of sensors needed for a good representation of the variables, a Fuzzy Inference System, and finally a visual decision-making tool (dashboard). The objective of this study is to build a tool based on data from humidity and temperature sensors to help those responsible for water resource management to make informed decisions regarding when, how much and where the irrigation must be made in city parks.
Our results yield a solid evidence that data-driven management helps to make informed decisions regarding when, how much and where the irrigation must be made in city parks. This translates into significant water savings, improving water management. Likewise, this methodological framework has proven to be sufficiently replicable and economical to be applied to any city park with some adjustments required by each specific park.
Also, the proposed dashboard contains relevant information about the park that is easily human interpretable. Thus, decision-makers do not need any prior knowledge of the algorithms and models used to take advantage of it.
In future work, more interpolation algorithms, as well as increase the minimum sample size to look for improvements in the interpolation of the points, is sought. Likewise, the testing of other measures of central tendency such as the median as an input of the FIS is sought.
Acknowledgments
The authors wish to thank the Engineering Department of the Universidad Del Pacífico for lending the necessary equipment to make the corresponding measures. Also, to the professor Jorge Toma for his constant advice in the statistical background.
Conflicts of Interest
The authors declare no conflict of interest.
References
- Global Water Partnership GWP, G.S. Hacia una GestióN Integrada De Recursos HíDricos en el Perú; Global Water Partnership GWP, G.S.: Stockholm, Sweden, 2013. [Google Scholar]
- Nations, U. Río +20: El futuro que queremos. In Proceedings of the Conferencia de las Naciones Unidas sobre el Desarrollo Sostenible, Rio de Janeiro, Brazil, 20–22 June 2012. [Google Scholar]
- Kosolapova, N.M. Modeling Resource Basis for Social and Economic Development Strategies: Water Resource Case. J. Hydrol. 2017, 553, 438–446. [Google Scholar] [CrossRef]
- Khranovich, I.L. Mechanism for open management of harmonizing water use strategies under stochastic conditions. Water Resour. 2010, 37, 411–423. [Google Scholar] [CrossRef]
- Eda, L.E.; Chena, W. Integrated Water Resources Management in Peru. In Proceedings of the International Society for Environmental Information Sciences 2010 Annual Conference (ISEIS), Beijing, China, 27–29 August 2010. [Google Scholar]
- Sedapal. Mayor Consumo De Agua Potable Por Habitante/día Se Registra en San Isidro; Sedapal: Lima, Peru, 2017. [Google Scholar]
- Kumar Sahu, C.; Behera, P. A low cost smart irrigation control system. In Proceedings of the 2nd International Conference on Electronics and Communication Systems, ICECS 2015, Coimbatore, Tamil Nadu, India, 26–27 February 2015. [Google Scholar]
- Basomingera, R.; Garba, A.A. Demonstrating Communications and Control Systems for Smart Irrigation. In Proceedings of the IST-Africa 2017 Conference, Windhoek, Namibia, 31 May–2 June 2017. [Google Scholar]
- Namala, K.K.; Krishna Kanth Prabhu, A.V.; Math, A.; Kumari, A.; Kulkarni, S. Smart irrigation with embedded system. In Proceedings of the IEEE Bombay Section Symposium 2016: Frontiers of Technology: Fuelling Prosperity of Planet and People, IBSS 2016, Baramati, Maharashtra, India, 20–22 December 2016. [Google Scholar]
- Harun, A.N.; Kassim, M.R.M.M.I.R.S.S. Precision Irrigation using Wireless Sensor Network. In Proceedings of the International Conference on Smart Sensors and Application, Selangor, Malaysia, 24–25 November 2015. [Google Scholar]
- Moreno, M.A.; del Castillo, A.M.J.T.J.M.B.R. Optimisation of the design of pressurised irrigation. Biosyst. Eng. 2016, 151, 361–373. [Google Scholar] [CrossRef]
- Pawlowskia, A.; Sánchez-Molina, J.G.J.R.F.D.S. Evaluation of event-based irrigation system control scheme for tomato crops in greenhouses. Agric. Water Manag. 2017, 183, 16–25. [Google Scholar] [CrossRef]
- Ferrández-Pastor, F.j.; García-Chamizo, J.M.; Nieto Hildalgo, M.; Mora-Martínez, J. User-Centered Design of Agriculture Automation Systems Using Internet of Things Paradigm Francisco-Javier. In Proceedings of the Ubiquitous Computing and Ambient Intelligence 11th International Conference, Philadelphia, PA, USA, 7–10 November 2017. [Google Scholar]
- Yang, G.; Liu, L.G.P.L.M. A flexible decision support system for irrigation scheduling in anirrigation district in China. Agric. Water Manag. 2016, 179, 378–389. [Google Scholar] [CrossRef]
- Nguyen, L.-D.-L.; Prodan, I.L.L.G.C.D. Distributed Model Predictive Control of Irrigation Systems using Cooperative Controllers. IFAC-PapersOnLine 2017, 50, 6564–6569. [Google Scholar] [CrossRef]
- Izzuddin, T.A.; Johari, M.A.; Rashid, M.Z.A.; Jali, M.H. Smart Irrigation Using Fuzzy Logic Method. ARPN J. Eng. Appl. Sci. 2018, 13, 517–522. [Google Scholar]
- Jayaraman, P.P.; Palmer, D.; Zaslavsky, A.; Georgakopoulos, D. Do-it-Yourself Digital Agriculture applications with semantically enhanced IoT platform. In Proceedings of the 2015 IEEE 10th International Conference on Intelligent Sensors, Sensor Networks and Information Processing, ISSNIP 2015, Singapore, 7–9 April 2015. [Google Scholar]
- Koprda, Š.; Magdin, M.; Vanek, E.; Balogh, Z. A Low Cost Irrigation System with Raspberry Pi—Own Design and Statistical Evaluation of Efficiency. Agris On-line Pap. Econ. Inform. 2017, 9, 79. [Google Scholar] [CrossRef][Green Version]
- Difallah, W.; Benahmed, K.; Draoui, B.; Bounaama, F. Implementing wireless sensor networks for smart irrigation. Taiwan Water Conserv. 2017, 9, 429–433. [Google Scholar]
- Channel, T.W. Available online: https://weather.com/es-PE/tiempo/hoy/l/PEXX0011:1:PE (accessed on 13 October 2017).
- Inafuko, J.T.; Donet, J.R. Estadística Aplicada: Segunda Parte; Centro de Investigación, Universidad del Pacífico: Lima, Perú, 2014. [Google Scholar]
- Skala, V. RBF Interpolation with CSRBF of Large Data Sets. Procedia Comput. Sci. 2017, 108, 2433–2437. [Google Scholar] [CrossRef]
- Mendel, J.M. Fuzzy logic systems for engineering: A tutorial. Proc. IEEE 1995, 83, 345–377. [Google Scholar] [CrossRef]
- Han, J.; Kamber, M. Data Mining: Concepts and Techniques (2nd ed.); Morgan Kauffmann Publishers Inc.: San Francisco, CA, USA, 2006; pp. 362–363. [Google Scholar]
Publisher’s Note: MDPI stays neutral with regard to jurisdictional claims in published maps and institutional affiliations. |
© 2018 by the authors. Licensee MDPI, Basel, Switzerland. This article is an open access article distributed under the terms and conditions of the Creative Commons Attribution (CC BY) license (https://creativecommons.org/licenses/by/4.0/).