1. Introduction
Water availability has been seriously undermined by human activities and their impact on the environment. In the last decades, the scientific community and public authorities have recognized this problem as a major concern and are trying to increase people awareness to contrast water wastefulness. Many studies have been done on residential water demand and various models have been proposed to generate water demand pulses at the scale of individual user [
1]. People bad habits in the domestic environment often lead to a huge waste of water and energy, which undoubtedly means higher costs and environmental impact. The present work is a part of the GST4water project, funded by the European Community through the financial support of the Emilia Romagna Region (POR-FESR 2014–2020). The general purpose and structure of GST4water are illustrated in [
2], while results related to rainwater management through green technologies are reported in [
3]. This paper describes the two models and suites of tools developed in the project for the assessment of the economic and environmental sustainability of solutions at household and urban scale.
At household scale, a tool able to easily show to the user the quantity of pollutants generated, energy wasted, or money saved, can help the decision-making process and push towards more sustainable choices. For this purpose, an analytic tool (WSC,
Water Sustainability Calculator) was developed to encourage social change by increasing awareness of wastes and costs on the water consumers part. By taking advantage of smart technologies, real time monitoring of domestic water consumption and data transfer to cloud platform [
2], the WSC tool analyses data and returns several easy-to-read indicators that describe water consumptionand environmental impact. WSC is conceived to work in symbiosis with outdoor water meters that record the volume of water consumed in real time; however an alternative version of the tool was developed to process even data coming from indoor water meters for real appliance water consumptions.
At the district and urban scale, suitable models and tools are required to evaluate and compare the impact of different measures and policies for water demand management and water reuse. To this purpose, a novel model based on urban metabolism (GSTMM, Green-Smart Technology Metabolic Model) has been developed to: (i) calculate mass and energy fluxes at multiple scales; (ii) evaluate related performance indicators for both sustainability assessment and benchmark; and (iii) design gray and meteoric water tanks.
The structure of the paper is as follows: a detailed description of the WSC Calculator used at the household scale is provided in
Section 2, while
Section 3 illustrates the WSC results and specific applications; a synthetic description of the GSTMM metabolic model is included in
Section 4; conclusions are reported in
Section 5.
2. Household Scale: Water Sustainability Calculator (WSC)
The Water Sustainability Calculator (WSC) provides several indicators on domestic water consumption for an aware use of water. The tool processes data measured by the water meters and offers an analysis onconsumptions sustainability. Resulting indicators inform the user on its performances related to: water consumption, costs, environmental impact, and energy consumption. The WSC outcomes may highlight an improper use of the resource that may leads to avoidable higher costs and wastes. Sustainability indices are obtained by means of three calculation modules (
Figure 1) that constitute the model: the Benchmark Module (BM), the Registration Module (RM), and the Water Module (WM).
The daily volumes measured by water meters are processed in the Benchmark Module to define reference volumes. The module handles data recorded from outdoor water meters, and even volumes flowing in single indoor appliances if measured. In parallel, the Registration Module collects data regarding user characteristics, by means of a questionnaire.
Later, the Water Module analyses observed data to compare consumptions with past recorded values or among similar households; moreover, it evaluates consumption performances to understand the historical trend. The reference volumes are derived from a floating average of volumes measured in the last 30-days, considering the water consumption history of the single user or a dataset including all users with the same household typology. If indoor water meters are installed, it is possible to evaluate benchmarks for the single appliance and provide an analysis for each single device.
The questionnaire filled in the Registration Module allows to determinethe user habits, the type of water appliances present in the house and their efficiency. This is crucial for indicators estimation in WM; in fact, it allows to distribute the global reference volume among different uses, and determine pulse intensity and duration.
According to [
4], the benchmark volume is allocated among different uses, depending on answers in the RM questionnaire, which define the scenario. Highly efficient devices (dishwasher and washing machine) allow energy and monetary saving with a considerable reduction of washing cycle duration. RM recognizes user bad habits that lead to water waste, such as letting the water flow while brushing teeth, or not using full load laundry.
Once all appliances are defined in the Registration Module, a scenario is selected among those available in the Water Module, and modifiers accounting for bad habits are introduced to better represent the reality.
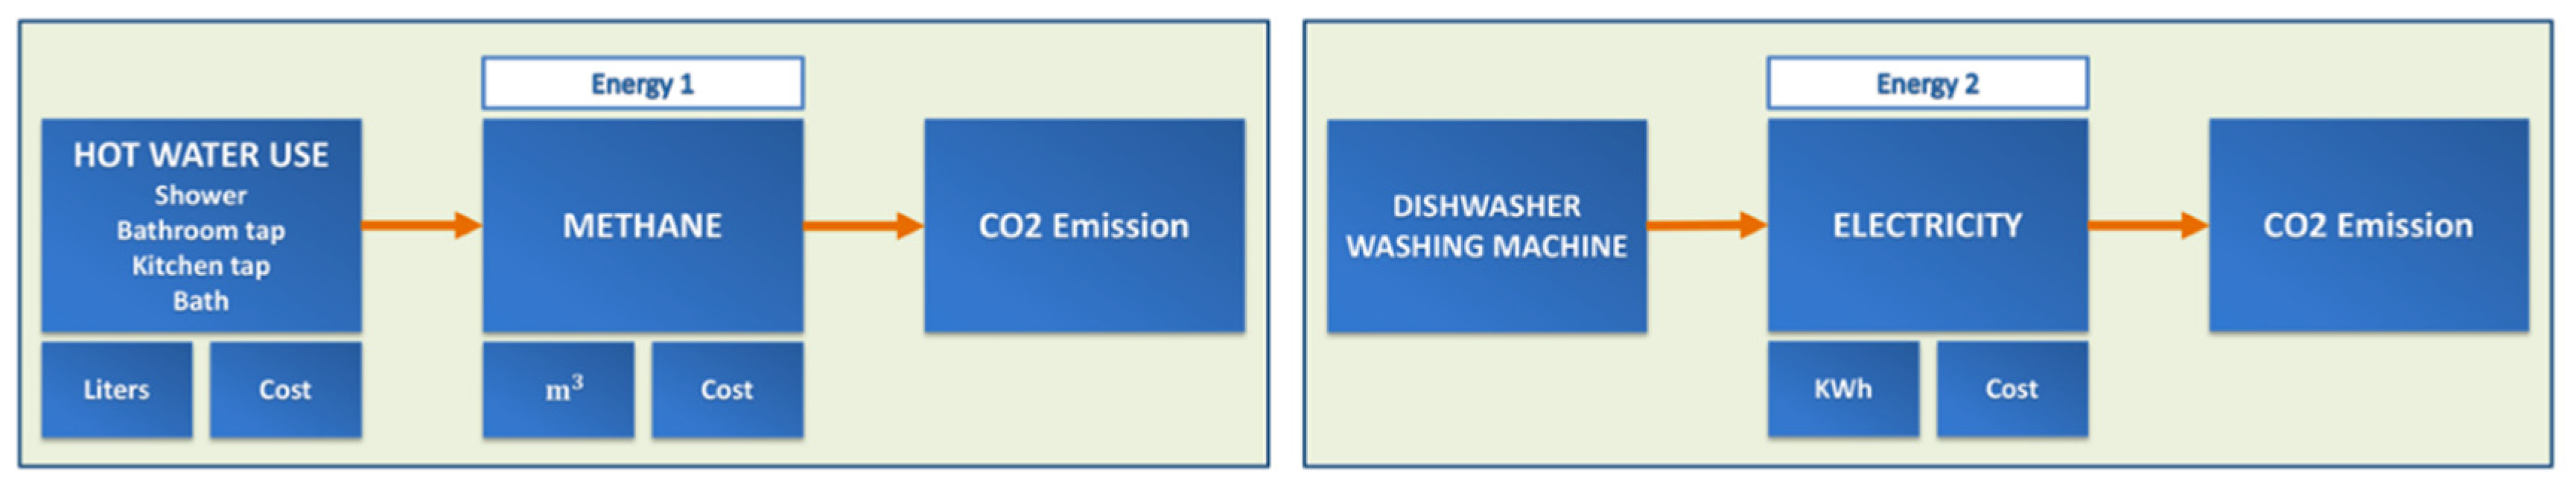
The water consumption involves the use of energy, which inevitably produces carbon dioxide. The electricity and the combustion of methane gas are the most common sources of energy used by domestic appliances. The volume of methane gas burnt to obtain a liter of warm water, and the carbon dioxide produced by such process are reported in
Table 1. Such values refer to a liter of water as a functional unit and are used in the Water Sustainability Calculator as Energy Multiplier Coefficients to evaluate environmental performance indicators and costs.
Instead of methane gas, many appliances, such as dishwashers and washing machines, use electricity to work. In Europe, EU Directive 92/75/EC established an energy consumption labelling scheme, which classifies refrigerating appliances, washing machine, tumble dryers and other, according to their energy efficiency. The energy class is a color code associated to a letter (e.g., A/A+ class) and which can be linked with water pulse duration, required electricity and costs of each washing cycle. Assuming pulse intensity and duration as constant for dishwasher and washing machine [
5], we may define multipliers associated with the use of energy in appliances that use electricity to work. Depending on the appliance efficiency, multipliers for electricity requested, cost and carbon production, are adopted to estimate user consumptions and carbon dioxide emissions. As already done for methane gas,
Table 2 reports multipliers for a non-efficient dishwasher, considering that a single washing cycle approximately requires 1.5 kWh, consumes 14 L of water, and that 1 KWh produces about 0.4 kg of CO
2.
3. Results and Discussion for WSC Application
The outputs of the WSC model derive from the Water Module elaborations. The tool objective is twofold, i.e., providing a
daily sustainability analysis both on a global scale (household) and a local scale (appliance or device scale). The tool provides a first indicator “I” designed at
household scale, that reflects the daily water consumption compared with the volume benchmark. The global indicator I is dimensionless and can take values ranging from 0 to 10 (
Table 3).
On the other hand, at the
device scale the WM indicators inform about consumption performance and environmental impact. Specifically, the tool gives information about (i) water performance indicators; (ii) economic indicators; (iii) environmental indicators (CO
2 emission); (iv) energy performance indicators (methane gas/electricity). The following are some examples of applications (
Figure 2,
Figure 3 and
Figure 4).
The calculation of the device indexes requires a precise knowledge of indoor ‘measured’ volumes. Indeed, for households devoid of indoor water meter we need to compute the repartition coefficient (%) considering an “equivalent appliance volume” (Equation (1)),
where
and
are pulse intensity and pulse duration respectively, and
is the number of uses per day of ith appliance. Since the Intensity and Duration values are subject to some degree of uncertainty, the sum of equivalent volumes (
) will exhibit a certain difference with respect to the volume measured by outdoor counter. Therefore, we need to introduce a correction term “
d” that contributes towards increasing/reducing the effective end-use volume
, that is the updated value of
(Equations(2) and (3)).
Consequently, the repartition coefficients of the total measured volume are obtained (Equation (4)).
where
is the outdoor water meter value.
Knowledge of effective end-use volumes enables to calculate indicators quantifying daily water consumption linked to each appliance. In this way, the consumer can pinpoint any over-consumption on a specific day. For example,
Figure 3 shows the outcome of a specific simulation for a two-people household. Water consumption is in line with the benchmarks except for the shower, which shows an excessive consumption.
Another important aspect concerns the economic impact due to the water consumption and its misuse. In this context, the tool provides the user with economic indicators on the costs of drinking water, electricity and methane gas.Obviously, the energy aspect is linked with water consumption only (shower, taps, washing machine and dishwasher use).
Furthermore, the tool is able to quantify how this energy is used, in terms of kWh consumed and cubic meter of methane gas.
Finally, one of the strategic aspects of this work regards environmental sustainability. In particular, the aim is to supply the consumer with Environmental Indicatorscapable of quantifying the CO
2emissions deriving from each device use. In this way, the consumer can monitor his environmental awareness compared to reference impact.
Figure 4 shows that environmental impacts are linked to (i) the hot water consumption and (ii) the usage of dishwasher and washing machine.
In the first case study of this project, a 50–50% split between hot and cold water was supposed (no indoor metering); in a second case, the hot water percentage was known.
Figure 5 shows graphically the results of a generic simulation, illustrating environmental indicators linked to CO
2 emissions; note the difference between the reference and actual release. The effective carbon emissions are linked to the real water use in a specific household. Overall,
Figure 5 shows a virtuous behavior of the household; however, an excess emission due to an improper use of washing machine is pointed out by the analysis. Other devices, such as wc and outside tap, do not entail any consequence in this regard.
4. Urban Scale: Green-Smart Technology Metabolic Model (GSTMM)
The Green-Smart Technology Metabolic Model (GSTMM) extends the concepts already utilized in [
6,
7], accounting for the specificity of Italian water systems. It takes into account hourly variability of water demand inside/outside household at water appliance level and the direct relation with recycled water from previous usages and meteoric water from roofs and green roofs. The model is driven by water demand by each appliance inside the household, and evaluates material fluxes and performance indicators related to water, chemicals, and energy. Furthermore, the model extends the same approach, methods and indicators to urban area. The model can use as input either the measured water consumption, in order to evaluate actual system performance in real time usage, or synthetic data from stochastic models as described in [
5]. The outputs are performance indicators and/or time series of the calculated fluxes at several time and space aggregations.
To describe water fluxes in a real building, possibly including several households, some elements are needed in the GSTMM model (
Figure 6): (i) at least some water appliances (S1, S2, S3, S4), each representing a particular type of water demanding device; (ii) a roof and/or green roof (GR); (iii) a gray water tank and a meteoric water tank (MW); (iv) some filters/treatment devices/pumps (F/T/P). Water sources (S) from water distribution systems (extra modeled) and water outlets (O) to sewer systems (extra modeled) may be shared among several buildings, while the elements GR, MW, GR are shared among households belonging to the same building. All elements are associated to a specific flag to neutralize their effects in the model.
The water appliances (Si) are the driving forces of the system, each must be associated to: (i) a timeseries of water demand; (ii) a given water type, e.g., fresh, meteoric or gray; (iii) a given fate for used water (reuse or sewer).
Outputs from the model includethe timeseries for different types of water used to satisfy water demand, energy and chemicals utilized.Such series can be produced at the appliance, building or urban scale and with different time scales.
Produced time series coupled with concentration of chemicals and national energetic mix are used to calculate performance indicators (PI) such as the ratio between the generic water flux and the water demand in order to assess how much fresh, gray or meteoric water is used to satisfy total demand. An example of such calculation is given in
Figure 7.
5. Conclusions
This paper presents findings from Work Package 4 (WP4) of the GST4Water project. The general project goal is to develop hardware and software solutions that allow a conscious use of water resources at the individual user level and the reuse of rainwater and grey water inside buildings. To this end, the characterization and reduction of residential water consumption is essential, and implies focusing on the consumer behavior, housing type and the characteristics of the household. We reported on two methodologies and associated tools allowing the assessment of the economic and environmental sustainability of the GST4Water solutions: WSC and GSTMM.
WSC operates at the household scale and is geared towards consumers, while GSTMM can operate at multiple scales and is directed to water companies and city managers. Both models can adjust to different scenarios, with and without indoor water metering.
WSC allows the user to monitor his daily water consumption, identifying the most expensive end-uses in terms of water and energy. The relatively simple indexes supplied by the tool stimulate the consumers awareness of water scarcity and encourage water and energy savings inbuildings.
An important aspect of both tools was not discussed in detail for lack of space, i.e., the design of suitable green solutions for water savings and reuse (grey water and rain water tanks) employing additional indicators based on Life Cycle Assessment techniques. These solutions, in fact, can help householders not only achieve significant water/energy savings and reductions of the domestic water bills and emissions [
8], but also provide an environmental benefit linked to less demand for the water resource.


