1. Introduction
Over time, scientific progress has transformed intersubjective dynamics; the media pervasiveness weaves the threads of each person on everyday life. Particularly, the dissemination of Social Media has changed significantly the way in which information, feelings, opinions are made and shared. Social platforms or Social Networking Sites promote a more active debate between users [
1], turning them from a passive consumer to prosumer. As is known, prosumer derives from the crasis of terms “producer” and “consumer”, which means a user that is able to create and modify contents of any kind. Already used by McLuhan [
2], the dissemination of the term can be attributed to Alvin Toffler, who used the term for the first time in his text The Third Wave [
3], to indicate the renewed protagonist of consumers of the named generation X. The improvement of technology devices causes the unceasing redefinition of the modalities to share one’s own experiences, configuring as a composite and intricate relationship network. For this reason, in the past few years, group work and collaboration using online environments has become one of the most significant research topic because of the interconnectivity enabled by the Internet. As has already been said, information has progressively moved from “official” sources (online newspapers, institutional websites, etc.) to UGG [
4]. While on the one hand the decline of traditional sources lowered the qualitative level of information exchanged [
5] on the other, Social Media led to a new, more interactive, way of enjoying information. Social platforms promote a more active debate between users [
1]. This issue is the starting point of this work. UGGs are an interesting opportunity for a multidisciplinary investigation. From a linguistic point of view, user’s comments and posts—data spontaneously generated by users involved in discussed topics—very often contain their own opinions about a certain topic, so they are composed by a high subjective content. In addition, Social Media Analysis allow to collect “ecological” textual data from their habitat, to overcome a big shortcoming of several previous approaches. We propose a multidisciplinary approach: starting from a large textual dataset created using web mining techniques; we build an interactive visual tool to explore and navigate topics extracted from data mined from Facebook conversations. We choose to use Facebook for several reasons. Primarily, there is a lack of studies based on it, especially concerning Italian language. In addition, Facebook has become one of the most popular online social network in the world and it offers the possibility to collect heterogeneous data. Online conversations can carry out various functions and contemporary people live an enlargement of the space dedicated to the social communication. This involve a substantial change in the way of conceiving and realizing interpersonal relationships. This communication process, inter alia, is always unfinished because it is continuous the research around the technological innovation and always more developed are its applications. The improvement of technology involves the continuous redefinition of the modalities to share one’s own experiences, configuring as a complex and intricate network that has reshaped the contemporary users’ habit. In addition to this, the latest generation of digital devices and the irrepressible spread of Web 2.0 has changed the way we access, process, organize and store our knowledge.
These significant changes cause unavoidable, and extremely obvious, repercussions in the definition and articulation of the typical activities: for this reason, online conversation may be used to build of a cohesive group, which are defined in specialist literature as learning community to achieve a common goal. Furthermore, this kind of group have many others purposes: fostering the elaboration of ideas; creating positive feedback for individual problem-solving strategies [
6,
7]. To depict what happens in every conversations that take place in a digital environment, we can refer to Pea [
8], which distinguishes between ritual communication and transformative communication. Ritual communication offers emphasis on participation, sharing and continuous interaction between the members of the community, as well as on the sense of belonging.
Transformative communication, on the other hand, focuses on the transmission of learning messages. Online virtual communities have some distinctive features:
Chism [
6], as has already been said, reports that online conversations can carry out several educational functions: they allow building learning community; each actor is responsible for achieving a common goal; they favour the elaboration of ideas; they offer support or tutoring; they generate positive feedback for individual and/or collective problem-solving strategies. More specifically, Jenlink and Carr [
7] identified three crucial functions of online conversation:
transactional function, if the conversation is directed at negotiating and exchanging and/or sharing of knowledge and points of view;
transformative function, if interlocutors suspend their own opinions and judgment on what is said by others;
transcend function, if the conversation leads to the overcoming of personal convictions, in order to advance collective knowledge.
Communities of practice hint their heritages from constructivist theory [
10] whose main principle moves focus from instructors to learners. Knowles et al. report the relevance of constructivism into adult and professional experience; in fact, adults learn fine in every situations in which they can readily apply previous knowledge and experience.
The interaction between members of the Knowledge Building Community is therefore the essential element of the social process of knowledge building, and makes every participants become a Knowledge Builders rather than a passive interpreter of the learning process. According to Scardamalia and Bereiter, “one important advantage of knowledge building as an educational approach is that it provides a straightforward way to address the contemporary emphasis on knowledge creation and innovation. These lie outside the scope of most constructivist approaches whereas they are at the heart of knowledge building” [
11] (p. 3).
In fact, a key concept of communities of practice is community knowledge, in which the sum of this public knowledge is greater than sum of individual participant knowledge [
10]. From a linguistic point of view, user’s comments and posts—data spontaneously generated by users involved in discussed topics—very often contain their own opinions about a certain topic, so they are composed by a high subjective content. Social Media Analysis allow to collect “ecological” textual data from their habitat, to overcome a big drawback of several previous approaches. Our case study are seven years of conversations of the largest and longest running Italian Facebook group named ROARS, acronym of Return on Academic Research.
2. Materials and Methods
This research is based on a former study in which starting from a large textual dataset that we have analysed the topics in a Facebook Group conversation, about educational and research field and visualized the hierarchy in a line graph.
For a better exploration of the phenomenon, we have decided to analyse and to visualise the topics, proposed in the status that people responded, with the same methodology. Since the group has the name and is managed by an Association (ROARS), we assumed that it is very important to analyse the issues that stimulate and influence the conversation analysed before.
The large text corpora, built with techniques of data mining, pertain seven years of conversation on the largest and the longest-running Italian Facebook group on research topics, with an increasing number of members, more than sixteen thousand: ROARS (available at
www.roars.it). ROARS (Return on Academic Research) is one the most important Italian forums for discussion concerning research and higher education policies. ROARS blog brings together several academics and researchers, active both in the field of natural sciences and in social sciences and humanities. The distinctive feature of ROARS is its strict adherence to an evidence-based approach to the discussion of policies in higher education and research. Governmental interventions are analysed in the context of the international debate and methodologies.
The original dataset contains 183,762 rows, starting since the first day 30 September 2011 until the day of data collection: 5 April 2017.
The data collection has been possible with multiple queries to the Facebook Public API, because the group is public and then all the data are available and accessible. In this work, we focus our attention on the textual status and comments in Italian language.
The first published by the members are 18,891, the latter in respond to are 164,871. For each of them we have collected even the metrics of interaction as like both of them typology and reactions, only for the status, such as like, love, wow, sad and angry. In the following
Table 1 it is possible to check also the number of authors for each type of publication.
For the efficient Topic Modeling analysis, it has been necessary to convert the dataset in a
plain text format, by removing links, stop words and the entire non-textual format, used by the users as gif, images, videos, memes and emoji. Furthermore for a better interpretation of the results about the status’ topics, we decided to focus the analysis only on the Italian language texts, detecting all the content in other languages with an automatic google algorithm provided by Google Drive Suite (Google Inc., Menlo Park, California, United States of America.) (drive.google.com). Then, we removed all the not-Italian texts. After this procedure of data refine, the dataset for the analysis of the status contains 13,130 posts. Our goal is to explore latent topics and relations, so we choose to analyze data borrowing techniques from Natural Language Processing (NLP). In particular we start with the pre-processing step according to the “classical” NLP pipeline widely known in the literature [
12]. We address the problem proposing an approach based on topic modeling. As shown by several recent studies, topic modeling offers an interesting machine learning-based solution [
7] to manage large textual data and discover a hidden thematic structure in a collection of documents: they allow to find salient and most debated themes using latent semantic analysis and, in a second step, to perform an interactive time analysis about a particular topic. Topic models uncover the salient patterns of a collection under the mixed-membership assumption: each document can exhibit multiple patterns to different extents. When analyzing text, these patterns are represented as distributions over words, called topics. Combining NLP with Data Visualization methods and a pedagogical interpretative framework, we propose an interdisciplinary approach to translate data into an interactive visual system in order to explore the collection and to define issues and contexts in this field of research. As shown from the first analysis, extracted texts are of extreme variety. In order to organize the corpus extracted from Facebook into thematically related clusters, we use Probabilistic topic models such as Latent Dirichlet Allocation (LDA) [
13]. LDA are Bayesian latent variable models that have been adapted to model a diverse range of document genres. We consider the application of LDA to Facebook content, which poses unique challenges different to much of standard NLP content. Posts are short, mixed with contextual clues (URLs, tags …) and usually use informal language with misspelling, acronyms and nonstandard abbreviations. Hence, effectively modeling content on Facebook requires techniques that can readily adapt to this “raw” data requiring a supervision. Unfortunately, topic modeling techniques like LDA do not work well with “dirty” data. Topics extracted from LDA are formally a multinomial distribution over words, and by convention the top-10 words are used to identify the subject area or give an interpretation of a topic. A naïve application of LDA to Facebook content produce ineffective and meaningless topics.
In order to extract better topics using LDA we need to combine the algorithm with a linguistic cleaning step of texts. Cleaned data have been analyzed using a particular implementation of LDA, provided by Mallet software, in order to discover semantically relevant topics. The algorithm represents documents as random mixtures over latent topics, where each topic is characterized by a distribution over words. These random mixtures express a document semantic content, and document similarity can be estimated by looking at how similar the corresponding topic mixtures are.
The dataset has been separated and organized in 5 different files in a machine-readable format in order to make better analysis of topics concerning each year according to the pipeline to use Mallet algorithm.
We have excluded data about the years 2011 and 2017 since them are not recovering the entire year.
Table 2 displays the growth of the participation in the community during all the years.
3. Results
In order to achieve the main goal of this research, we have decided to build an interactive dashboard in which it is possible to explore all the topic trends. Trends give the chance to compare the relevance of the issues between the source (people that publish status in the group) and the community in general (all the people that comment the posts). In the first phase of our study, we have made the following static visualization (
Figure 1), in which we focused our attention on the comments published from 1 January 2012 to 31 December 2016 in order to avoid partial results on the first and the last years.
After the data processing made with the MALLET algorithm, we detected in the comments and in the status datasets the top five topics for each year in exam. By interpreting the results, seven topics for different fields were identified in the comments dataset and six ones in the status dataset. However, they were not all the topics that had been presented for each year. To give an example, the comments about topic which is concerning the theme of research funding started to be in the top five from the 2014 and the topic included the information about the school and the Italian Ministry of Education seemed disappear in the 2015.
Further to be placed at the third in 2012, the topic which deals with politics arguments, named Policy Making, stayed stationary at the second position until 2016. Meanwhile the topic Evaluation / National Academic Qualification (NAQ), that will be mentioned in the further parts of this paper, is included in the top five topics for all years examined.
Table 3 shows some examples of the topics labelled:
The data of large text corpora’s and the visualization of topic hierarchies are one of the main issues of many researches with the goal for exploring the words that composes the topic visually, even in networks format [
14]. In this paper, we aim to understand the relevance of the topics during a long period, such as six years. For this necessity, there exists some visual strategies in literature. Bar, lines and area charts are better format for this aim. In the project ThemeRiver [
15] was adopted the “stacked graph”; the approach of TIARA [
15] focused on the possibility to visualize the single words in the graph; and TextFlow [
16] makes it possible to explore the topics relationship (“splitting and merging”).
In this study, the main goal is to identify and to verify the process of hierarchy evolution among a brief set of topics emerged in the status and in the comments, with the possibility to evaluate correlations and influences.
The authors purposed to choose a line chart to visualize the data about the comments and a bar chart for the status ones.
There includes a time series for the topic-comment’s line chart (named “conversational topics”) on the ordinates. Furthermore, the values are not quantitative, but they are displayed as categorical on an inverted scale top-down from 0 to 6. Consequently, the main topic of the year is positioned with a point of the line on top. Those topics are defined by different colour lines, so the one can explore the trends during the years, as can be seen in the
Figure 1. If the topic might not be able to be detected for the top five year on the graph and if it returns on the following year, then the point disappears on its line. When the opposite situation evolves, then the line terminates its movement.
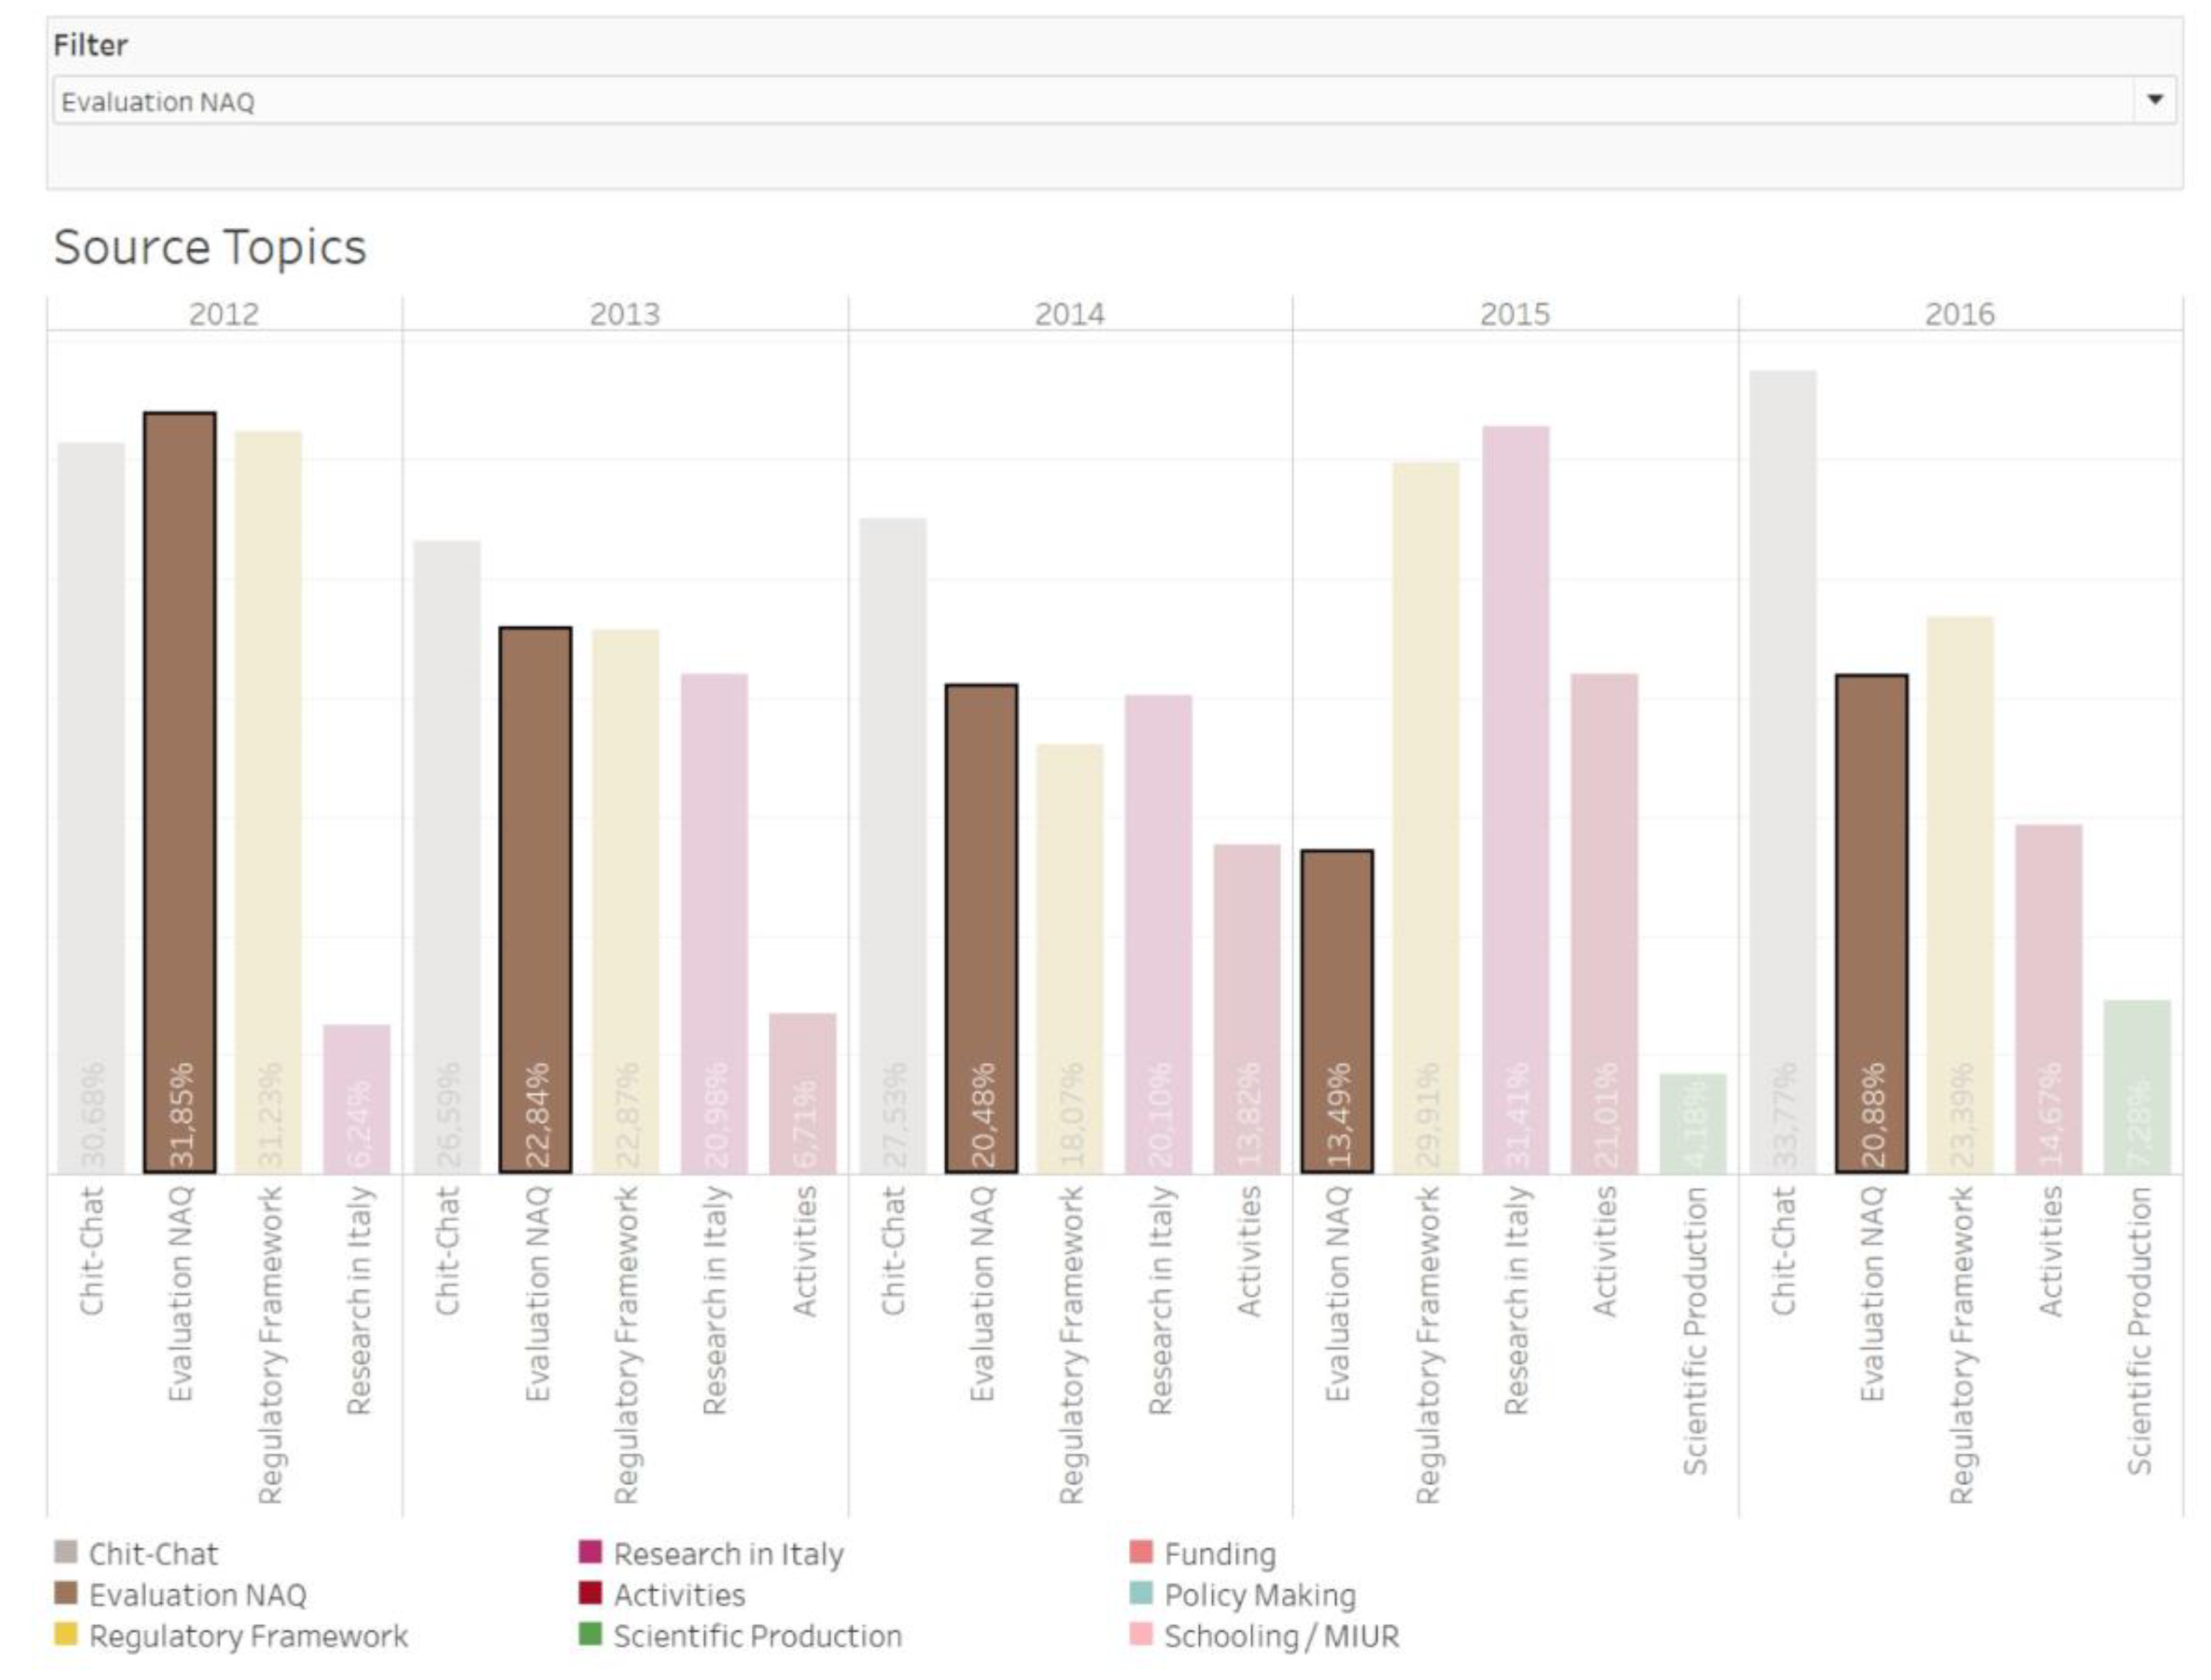
In the topic-statuses, bar chart (named source topics), positioned upon a time series, we can see the relevance of the topics on a 0–100 scale for each year. In the users’ topic graph, the filter highlights a specific topic that you want to explore in detail. Each topic is associated with the percentage of relevance in the reference year.
Bar chart refers to topics are presented in the topic-status dataset, and also, those ones are presented here. In the line chart, they have same colours such as it was before. Moreover, according to the classical approach “zoom and filter” [
17], it is possible to select a single topic with an interactive filter to visualize the trend on the line chart of the comments and on the bar chart of the statuses. It is a good solution to discover if the relevance in the second case could be reflected in the conversation topics. The dashboard is combined in a single interface, in which is possible to visualize both the graphs at the same time. Therefore, we will explain some aspects for a better understanding of the graphs and a deepening about the meaning of the topics.
For the situation of Regulatory Framework, the only point as the topic appears only in the 2016. Rather than the topic Chit-chat, the rest of them are detected under the definition of educational topics. This topic is named regarding to this way as none of particular themes are existed. On the other hand, whole daily conversations occur among those members.
Research in Italy, in the status corpus, is the topic of the generally speaking about the “system” of research in Italy.
The label activities identifies, generically, all those actions or complex of information that are part of the university system: for example, research and development, framework agreement, functioning of university system, quality, etc.
The topic Scientific Production concerns all the conversation about journals, review, citation and other words about academic publishing.
Evaluation NAQ (National Academic Qualification) is the topic that the one may talk about the evaluation criteria for entitling in order to level the title of Academic professor in Italy or to qualifying one’s own academic position.
Policy Making is the cluster of conversation about the work of the Italian presidents and ministers.
The topic Regulatory Framework involves slight difference that people talk more specifically about the laws in the field of school and research.
In Schooling/MIUR, members usually talk about school and relation between the academic career and the quality for professor title in the compulsory education.
Finally, the topic Funding contains all the comments about provision and management fund.
4. Discussion
These authors focused the attention on the comments and status published in ROARS Facebook group from 1 January 2012 to 31 December 2016. As has already being said, this choice has been made in order to elude potential partial results in the first year 2011 and in this last year 2017. MALLET algorithm allows the detection of the top five topics for each year from 2012 to 2016. In interpreting the results, seven topics for different fields were recognised in the comments dataset; vice versa, in the status dataset were identified six area of interest. However, MALLET algorithm had not presented all the topics subject of conversation for each year. At this point of our research study, these author propose a descriptive analysis of the topics returned by the algorithm.
There are seven topics identified in the conversations: these are, as already mentioned,
Chit-Chat,
Evaluation/NAQ,
Policy Making,
Schooling/MIUR,
Scientific Production,
Funding and
Regulatory Framework. How to show the
Figure 2,
Chit-Chat is a stable topic in the top of the five topics between 2012 and 2016
. Evaluation/NAQ has a waxed trend from 2012 to 2014, then progressively descends until 2016 in the ranking of the five topic of conversation. The topic
Policy Making topic following an upward trend from 2012 to 2013, remains stable and unchanged from 2013 until the end of 2016.
Schooling/MIUR has an varying trend until 2015; then in 2016 it does not appear in the five topic of conversation of the year 2016. This evidence cannot be attributed to a loss of relevance to the issues we identified as being inherent in the label
Schooling/MIUR. Probably, we hypothesize it could right outside the ranking of the five most relevant topics. The topic labelled
Scientific Production remains constant from 2012 to 2015 and disappears in 2016. In 2014 comes into the top five of topic
Founding, but as represented by the graph (
Figure 2), it is descending in 2015 and remains stationary in 2016. In 2016, comes into ranking list
Regulatory Framework. With regard to the topic
Founding, it is possible to deduce that this theme, or similar arguments, have been the subject of Facebook conversation even before 2014. Nevertheless, in 2014, European Researcher wrote an open letter contrary to vicious budget cuts that were wrecking scientific base research and will be threatening the European economic future. Obviously, the attentiveness of a community of researcher ROARS, in that period, has increased. Visualization of data shows (
Figure 2) that only the topic labelled as
Evaluation/NAQ results every year of analysis, but had its ups and grave downs. It is important to refer that also, the topic
Chit-Chat is present every year, but this topic does not signify any specific theme. It follows that the evaluation of the scientific path and relative NAQ are arguments predominantly for Italian Research members.
As regards the bar chart, that refers to topics that are accessible in the topic-status dataset. As has already been stated, the classical approach “zoom and filter” [
17] we have been able to choice a single topic with an interactive filter, to visualize the trend on the line chart of the comments and on the bar chart of the statuses. That key is very useful in discovering the eventual relevance of the topic, and in the in the second case, could be reflected in the conversation topics.
The bar char (
Figure 2) shows that
Chit-Chat is a stable topic in the top of the five topics between 2012 and 2016. Generic chats, or as we had reference it
Chit-Chat, are always very frequent; but in the year 2015, they are not recognizable in the top five. In that year, the status of the Facebook user pointed the conversation much more to relevant topics such as: Evaluation/NAQ, Regulatory Framework, Research in Italy, Activities, Scientific Production. Precisely the topic Evaluation/NAQ and Regulatory Framework are present at all the year that has been analysed. It is interesting to note that in the conversations the theme
Schooling/MIUR is particularly relevant (in the top 5); conversely, such a topic is obviously not too much listed in the users’ status. In addition, it seems that although ROARS uses Facebook to promote its activities within the territory, these are not directly subjects in the conversation, but can be evaluated and/or interpreted as a factor that stimulates conversation in a broad sense.


