Proceeding Paper

Optical Imaging of Intrinsic Neural Signals and Simultaneous MicroECoG Recording Using Polyimide Implants †

1
MTA EK NAP B Research Group for Implantable Microsystems, H-1121 Budapest, Hungary
2
ELTE NAP B Opto-Neuropharmacology Group, H-1121 Budapest, Hungary
3
Computational Neuroscience Group, Wigner Research Centre for Physics, HAS, H-1121 Budapest, Hungary
4
MTA-DE Neuroscience Research Group, University of Debrecen, Debrecen, Hungary
5
MTA EK MFA, Konkoly-Thege ut 29-33, H-1121 Budapest, Hungary
*
Author to whom correspondence should be addressed.
Presented at the Eurosensors 2017 Conference, Paris, France, 3–6 September 2017.
Proceedings 2017, 1(4), 610; https://doi.org/10.3390/proceedings1040610
Published: 29 August 2017
(This article belongs to the Proceedings of Proceedings of Eurosensors 2017, Paris, France, 3–6 September 2017)

Abstract

:
This paper presents the simultaneous use of intrinsic optical signal imaging (iOS) and micro-electrocorticography (μECoG) techniques by introducing a transparent polymer based microelectrode array into the optical recording chamber used in vivo functional mapping experiments in anaesthetized cat. The robustness of its site impedance was proven in electrochemical impedance spectroscopy. To demonstrate the feasibility of the combined optical-electrical recording, we have run several stimulus protocols and measured the evoked optical and electrical responses of the visual cortex.

1. Introduction

Multimodal data integration can yield important insights into brain processes and structures in addition to spatiotemporal resolution complementarity. In our work, the high spatial resolution of intrinsic optical signal imaging (iOS) and the outstanding temporal resolution of micro-electrocorticography (μECoG) is combined in visual stimulus experiments in anaesthetized cat. iOS records tiny changes in optical reflection of the exposed cortical surface due to local hemodynamic changes. iOS has been demonstrated to study the function of the neuronal circuitry of the visual cortex evoked by retinal stimuli [1]. Due to the advancement in neurotechnology, transparent arrays of recording electrodes can be fabricated and can fit cranial window imaging techniques to facilitate the parallel acquisition of electrical and optical signals from the exposed cortical surface [2]. In our work, a polyimide/ITO/polyimide based ECoG array is fabricated and tested in iOS experiment on the visual cortex of cat subjects.

2. Materials and Methods

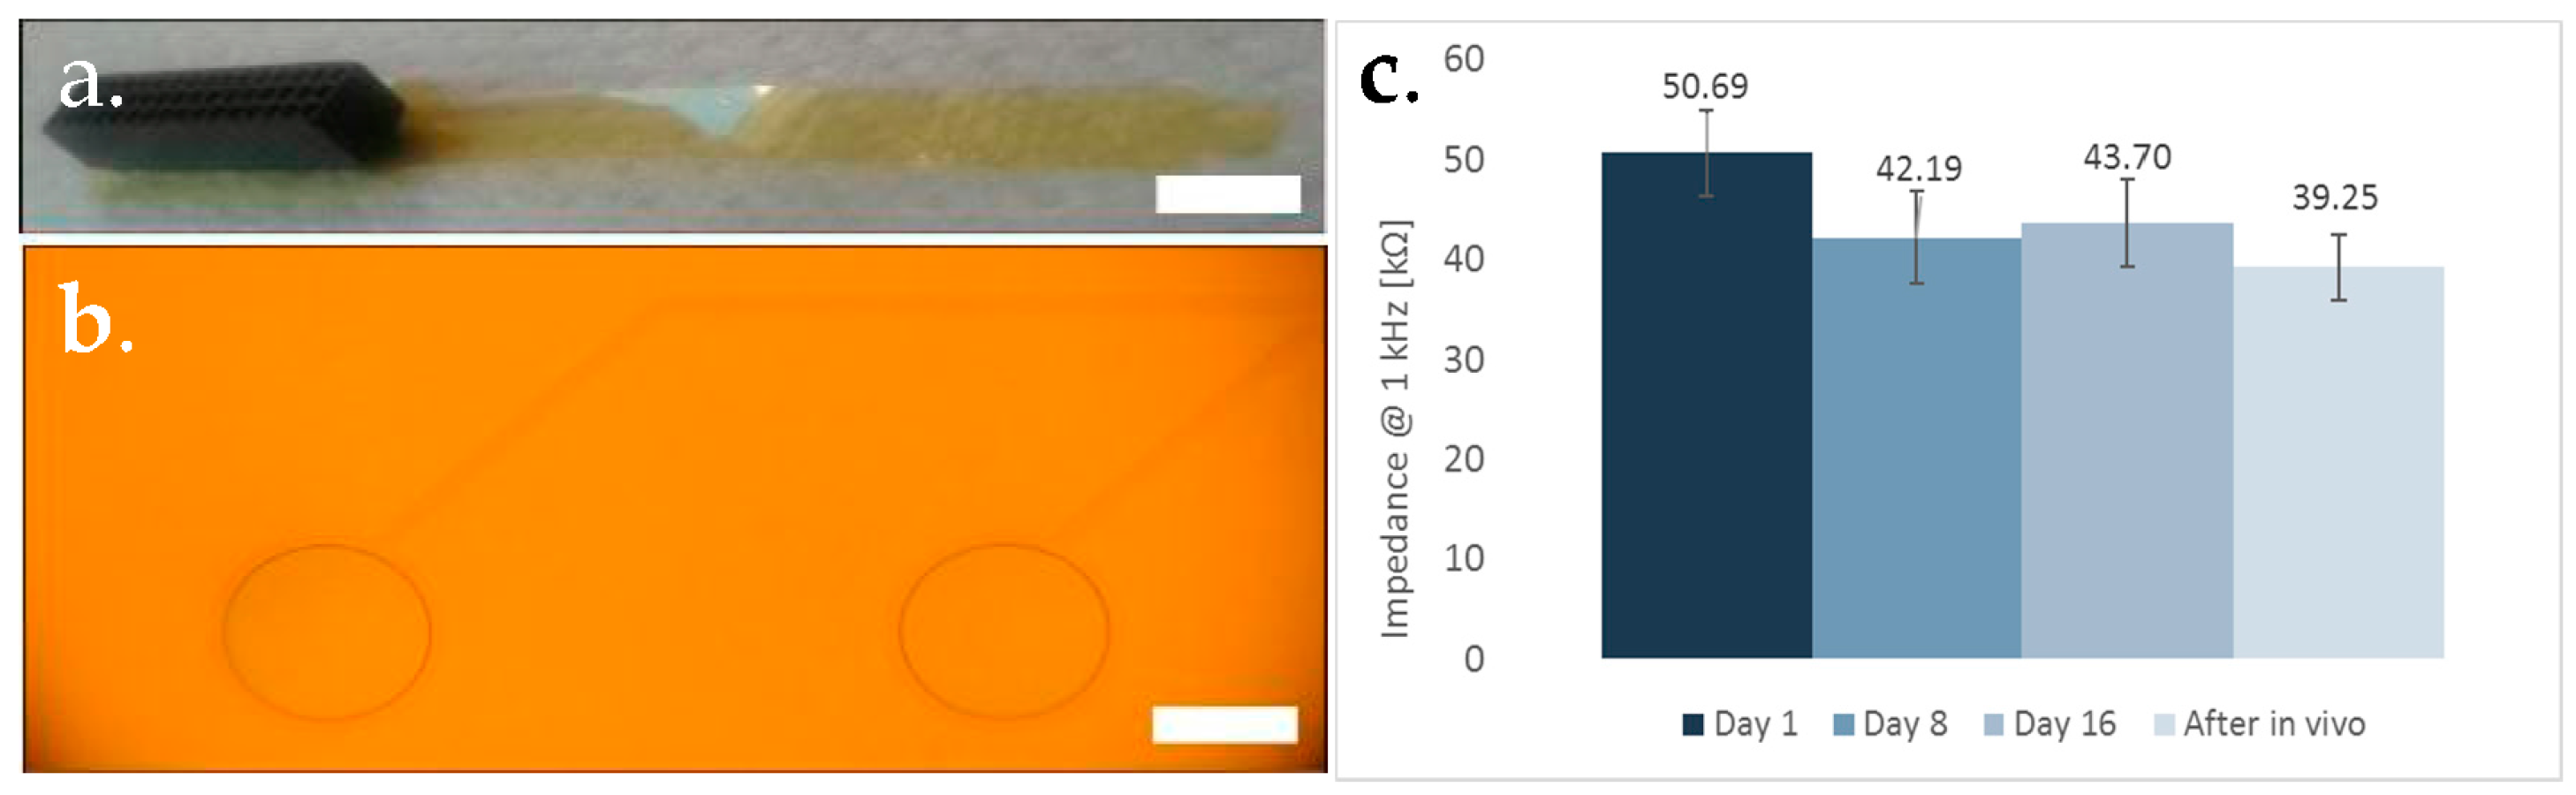
2.1. ECoG Design, Fabrication and Packaging

8 micron thick, 32-channel microelectrode array is composed of polyimide (PI) substrate and indium-tin-oxide (ITO) metallization (Figure 1a,b). Its technology relies on MEMS processes. Polyimide (PI2611, HD Microsystems GmbH, Heidelberg, Germany) is spin-coated on a 4” silicon wafer. Hardbake of the layer was performed at 300 °C for 60 min on a hotplate after a softbake process at 130 °C for 3 min Ti35 Image reversal resist was used to form the lift-off pattern for metallization (step 2). Indium-tin-oxide was deposited in an RF sputtering equipment. Lift-off process was finished by soaking the wafers in acetone. A second layer of polyimide as a top passivation layer was spin-coated at 6000 rpm for 45 s. Softbake and hardbake process is the same as used for the bottom passivation layer. 100 nm aluminium thin film as a hard mask for RIE etching was deposited in an e-beam evaporator equipment. The aluminium layer was selectively opened above the recording sites and electrode contour by aluminium etchant, through a photoresist mask patterned by photolithography. After Al etching the exposed polyimide surfaces were removed in CF4/O2 plasma. After RIE step, the aluminium masking layer is removed completely and the released electrode structures are peeled off the wafer by tweezers. Pads in the backbone of the electrode are mounted on a 2 × 16 channel PreciDiP electrical connector using silver epoxy glue baked at 100 °C.

2.2. Electrochemical and Optical Characterization

The impedance of electrophysiological recording sites was measured by electrochemical impedance spectroscopy (EIS) both before and after implantation in physiological saline solution. The EIS recordings were performed in a three compartment electrochemical cell. Ag/AgCl electrode and a platinum wire were used as reference and counter electrode respectively. Experiments were performed in a Faraday cage. The results are presented by Figure 1b.

2.3. Animal Experiment

Adult cat was anaesthetized by ketamine/xylazine mixture and anaesthesia was maintained through stable ventillation of N2O/O2 mixture including halothane by a respirator. To prevent the corneas from drying out, eye drops of Isopto-Max (Alcon Pharma GmbH, Breisgau, Germany) were applied. Blood pressure, expired CO2, and body temperature were continuously monitored and controlled throughout the experiments. First, craniotomy was performed in the posterior part of both hemispheres to expose area 18 of the visual cortex. A custom designed PEEK chamber was affixed to the skull with dental cement. Correction lenses were applied to maintain eye focus on a monitor screen placed at a viewing distance of 28.5 cm.
Optical imaging of intrinsic signals was performed to map orientation columns in the area. First, dura mater was removed and the chamber filled with artificial cerebrospinal fluid. During imaging of intrinsic signals, the cortex was illuminated with orange light (λ = 605) using fiber-optic cables fitted with a fiber-optic ring fixed to the objective. Intrinsic signals were recorded with a CCD camera focused slightly below the cortical surface. Images were acquired by a computer using the Imager 2001 and VDAQ software (Optical Imaging Inc., New York, NY, USA). Generation of the visual stimuli was carried out using the VSG Series Three (Cambridge Research System, Oxford, UK) system. B/W monitor (SONY, GDM-F520, 100 HZ, non-interlaced mode) placed at 28.5 cm in front of the cat’s eye presented the stimuli, which contained full field square wave gratings with high contrast at eight equally spaced orientations that moved forth and back (bi-directional drift) along the orthogonal axis of the orientation.
The 32 channel EEG recording was carried out by amplyfing and digitizing the signal with an Amplipex 256 channel multiplexed biosignal amplifier system (KJE-1001, Amplipex LTD, Szeged, Hungary) with a sampling rate of 20 kHz. An additional channel was used to record visual synchronycity signal. The binary files were imported and downsampled to 5 kHz via Spike 2 software (Cambridge Electronic Design Limited, Cambridge, UK). Exploration of the recordings was also carried out in this software and selected sections of the recordings were further analysed by custom made softwer in R environment.
A 1st order bandpass butterworth filter was applied on the recorded potentials to observe activities in the frequency regime of interest. By using 2D color coded visualisation of the signal intensity at various timesteps intensity supports the monitoring of the emerging spatio-temporal patterns.

3. Results & Discussion

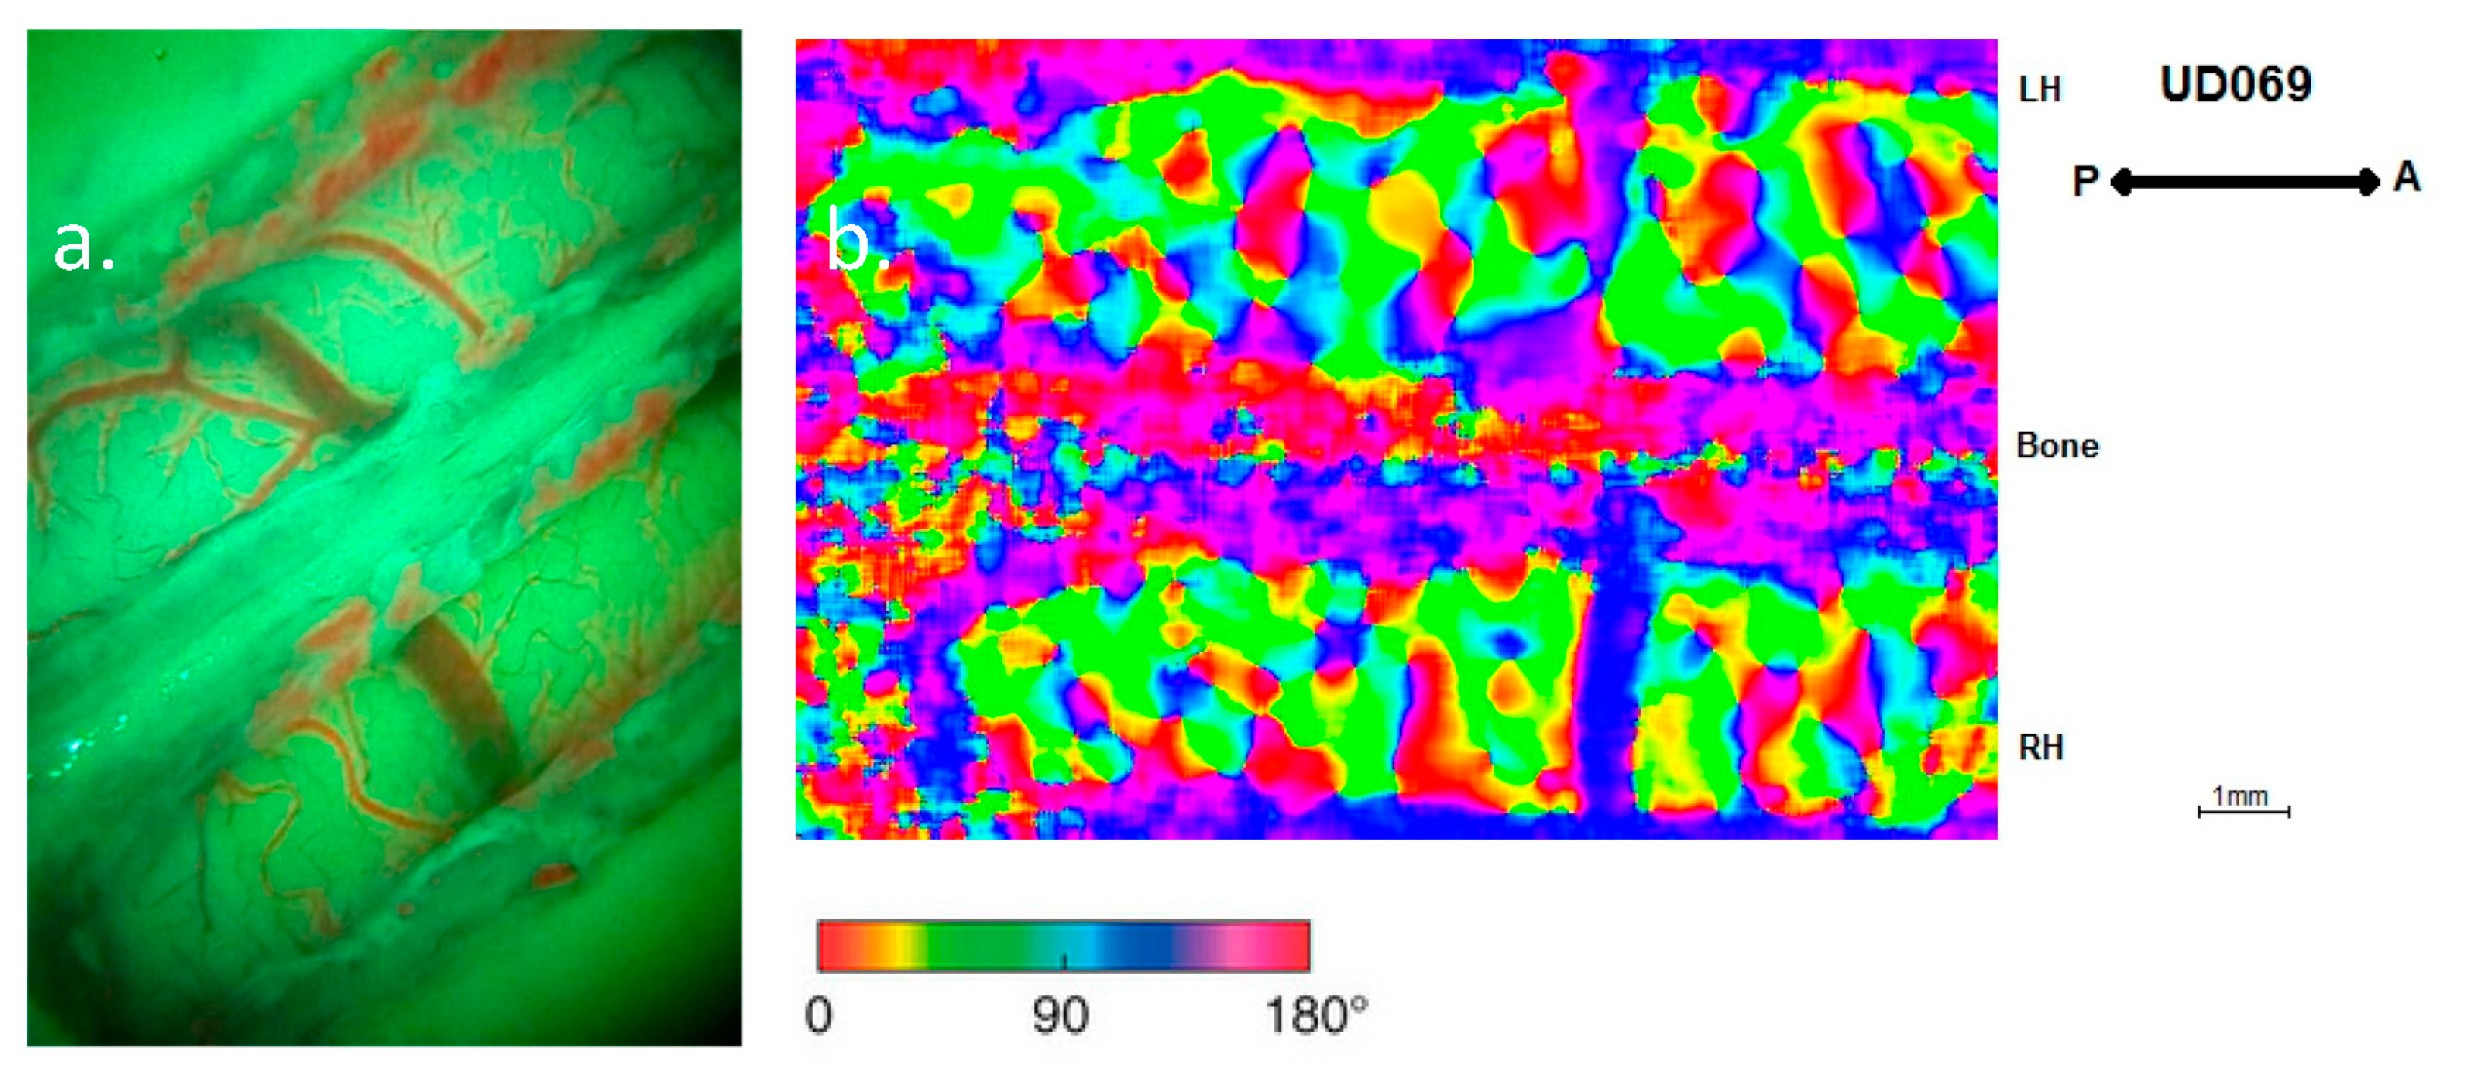
3.1. Optical Imaging

A representative orientation map recorded without (LH: left hemisphere) and with (RH: right hemisphere) ECoG electrode positioned on the visual cortex is shown in Figure 2. Functional domains can be identified in the presence of the polyimide/ITO/polyimide electrode array.

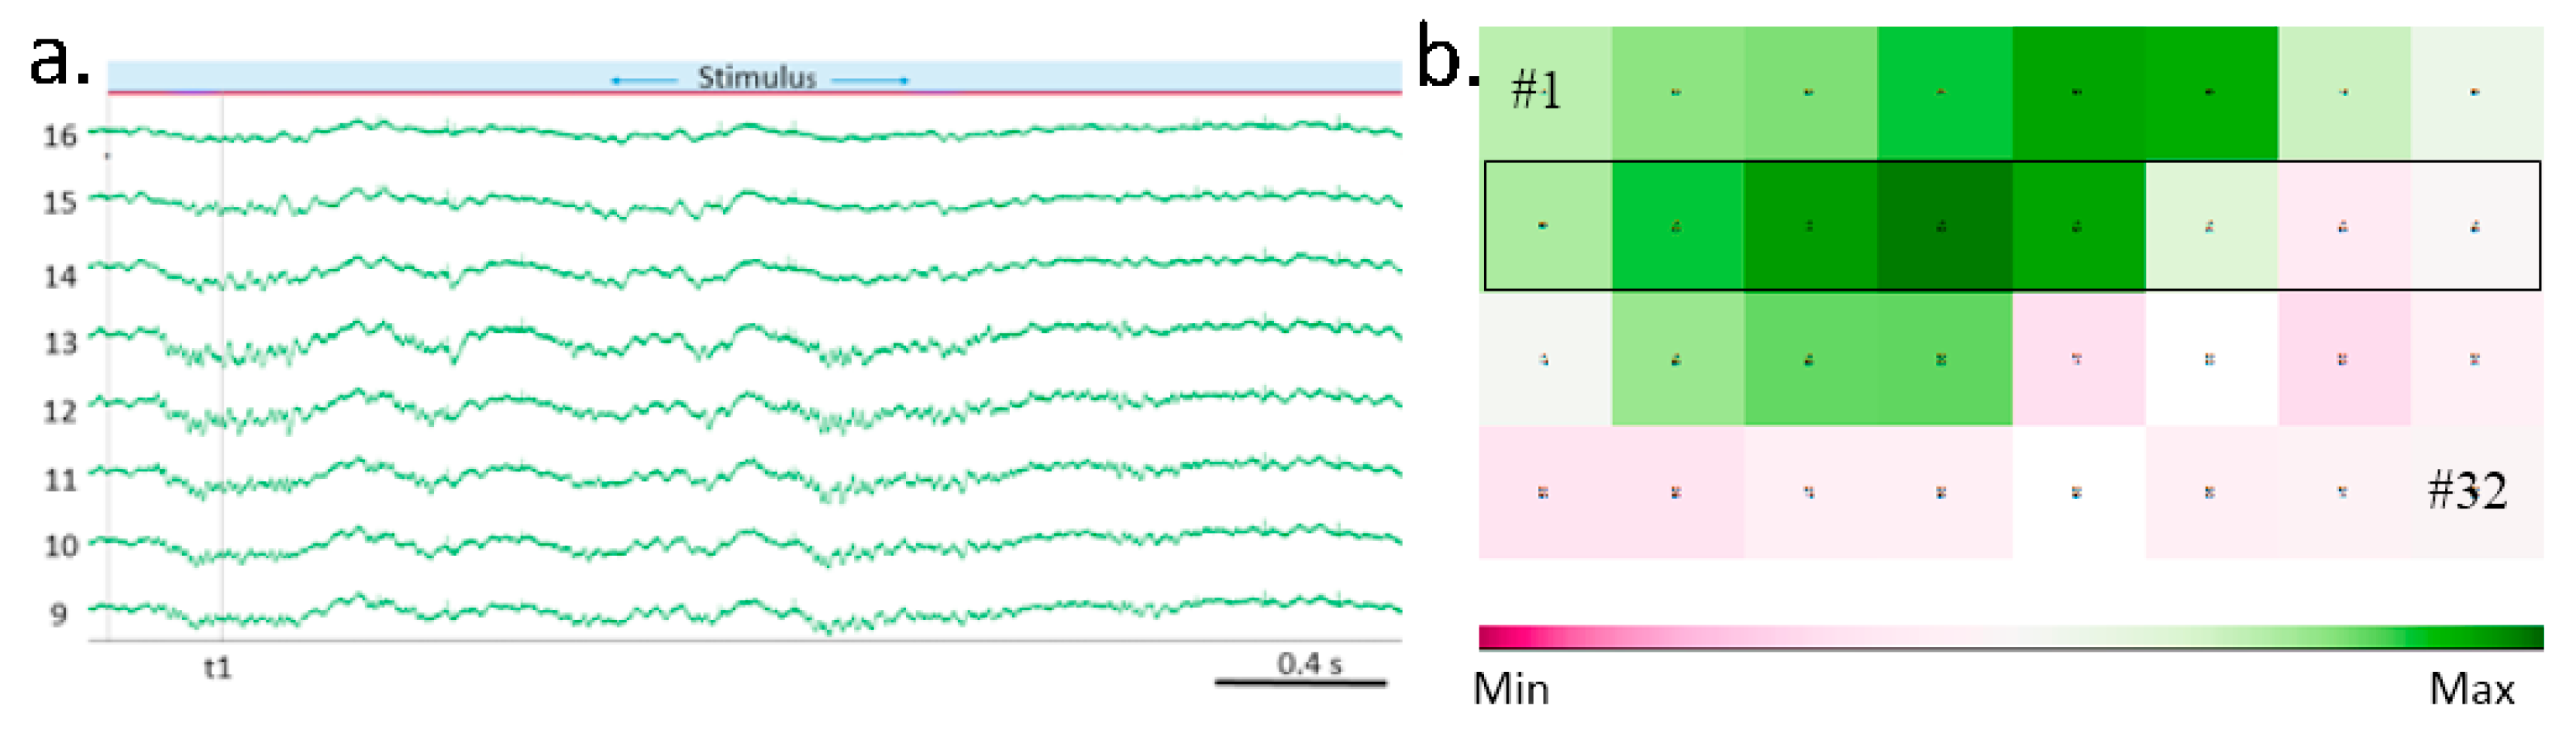
3.2. Electrical Recording

Cortical EEG signals were successfully recorded with the 32-channel polymer device during the stimuli. Robustness of the combined technology is proved analysis of slow-wave oscillation signals. Local Field Potential (LFP) map belonging to a specific orientation stimulus is shown in Figure 3. According to our measurements elevated gamma waves appear at the stimulus onset.

4. Conclusions

To demonstrate the feasibility of the combined optical-electrical recording, we have run several stimulus protocol to excite retinal cells of an anaesthetized cat and measured the evoked optical and electrical responses of the visual cortex (area A18) in a synchronized manner with the μECoG sheet. Optical quality of iOS signals (605 nm) was sufficient to identify functional features of the investigated area while local field potential map recorded by a 32-channel flexible, transparent ECoG array provided a detailed insight into connectivity patterns.

Acknowledgments

The supportive work of the cleanroom staff of MTA EK MFA in micromachining and packaging is highly appreciated. The authors are also thankful to the Hungarian Brain Research Program (grant: KTIA NAP 13-2-2015-0004) and the National Research, Development and Innovation Office (grant: NKFIH K 120143).

Conflicts of Interest

The authors declare no conflict of interest.

References

  1. Grinvald, A.; Lieke, E.; Frostig, R.D.; Gilbert, C.D.; Wiesel, T.N. Functional architecture of cortex revealed by optical imaging of intrinsic signals. Nature 1986, 324, 361–364. [Google Scholar] [CrossRef] [PubMed]
  2. Fekete, Z.; Pongrácz, A. Multifunctional soft implants to monitor and control neural activity in the central and peripheral nervous system: A review. Sens. Actuators B Chem. 2017, 243, 1214–1223. [Google Scholar] [CrossRef]
Figure 1. (a) Ready-to-use polyimide/ITO/polyimide based ECoG electrode with (b) 300 μm diameter recording sites (c) Average site impedance measured in soaking test (up to 16 days) and after in vivo.
Proceedings 01 00610 g001
Figure 2. (a) Microscopy view of the ECoG electrode positioned on the cortical surface. (b) Orientation map from the right hemisphere (RH—covered by the ECoG foil) and the left helisphere (LH—intact).
Proceedings 01 00610 g002
Figure 3. (a) Local Field Potential (LFP) data of specific channels (marked by rectangle on LFP map) during one orientation stimulus, and (b) 2D Local Field Potential map recorded in at t1 during the stimulus in the frequency range of 77-83 Hz. Color bar represents the signal intensity normalized to the highest value.
Proceedings 01 00610 g003
Publisher’s Note: MDPI stays neutral with regard to jurisdictional claims in published maps and institutional affiliations.

