Oxyhydrogen and Hydrogen Detection by Gasochromic Coloration of Highly Porous Tungsten Oxide with Fractal-Like Pd Nanoparticles †

1
Department of Physics, Isfahan University of Technology, Isfahan 8415683111, Iran
2
SENSOR Laboratory, Università di Brescia, 25121 Brescia, Italy
3
CNR-INFM, Universitá di Brescia, 25121 Brescia, Italy
4
Dipartimento di Chimica e Fisica, Università di Brescia, 25121 Brescia, Italy
*
Author to whom correspondence should be addressed.
†
Presented at the Eurosensors 2017 Conference, Paris, France, 3–6 September 2017.
Proceedings 2017, 1(4), 487; https://doi.org/10.3390/proceedings1040487
Published: 28 August 2017
(This article belongs to the Proceedings of Proceedings of Eurosensors 2017, Paris, France, 3–6 September 2017)
Abstract
:WO3 thin films were deposited by pulsed laser deposition (PLD) on glass substrates at 100 mTorr oxygen pressure. Monodispersed palladium nanoparticles (50 nm) were synthesized by hydrogen reduction of PdCl2 drop-casted on the surface of the films. For oxyhydrogen detection, first a saturated coloration by 10%H2/Ar was prepared. Then different oxygen flow with certain O2:H2 ratios were exposed to the colored samples. Depending on this ratio, the optical density of samples was observed to drop into certain new values until vanishes for a ratio about 20. A desirable fast coloration with linear dependency on hydrogen concentration was also observed.
1. Introduction
One of the most promising gasochromic materials are the nanostructured WO3 thin films. WO3 thin films belong to transparent wide band gap semiconductor group that in contact with a thin (few nanometers) Pt or Pd surface layer, their optical absorption transforms from the transparent to a dark blue state whenever are illuminated with hydrogen [1,2,3]. This optical switching is directly related to the double insertion/extraction of H+ ions and electrons according to the following reaction [4]:
xH+ + xe− + WO3→HxWO3
Then W oxidation states decrease from W6+ to W5+ even to W4+. It is also a completely reversible coloring-bleaching mechanism by alternatively exposing to hydrogen or oxygen gas. These properties have made it possible to use them as safe optical hydrogen sensors [5,6,7,8]. In the gasochromic process, hydrogen and oxygen have revers effects; hydrogen is a coloring and oxygen is a bleaching gas. So it is expected that competition between coloring and bleaching in the presence of an oxyhydrogen gas leads to color changes with a mixing ratio dependency. Therefore, the main contribution of this work is to use these opposite effects of hydrogen and oxygen in gasochromic coloration to investigate the sensing potential of gasochromic films for detection of the oxyhydrogen gas. We have fabricated highly porous tungsten oxide films by PLD. Palladium nanoparticles with 50 nm diameter were synthesized by a hydrogen reduction of palladium chloride. SEM, XPS, UV-vis spectroscopy were used for characterization of films.
2. Materials and Methods
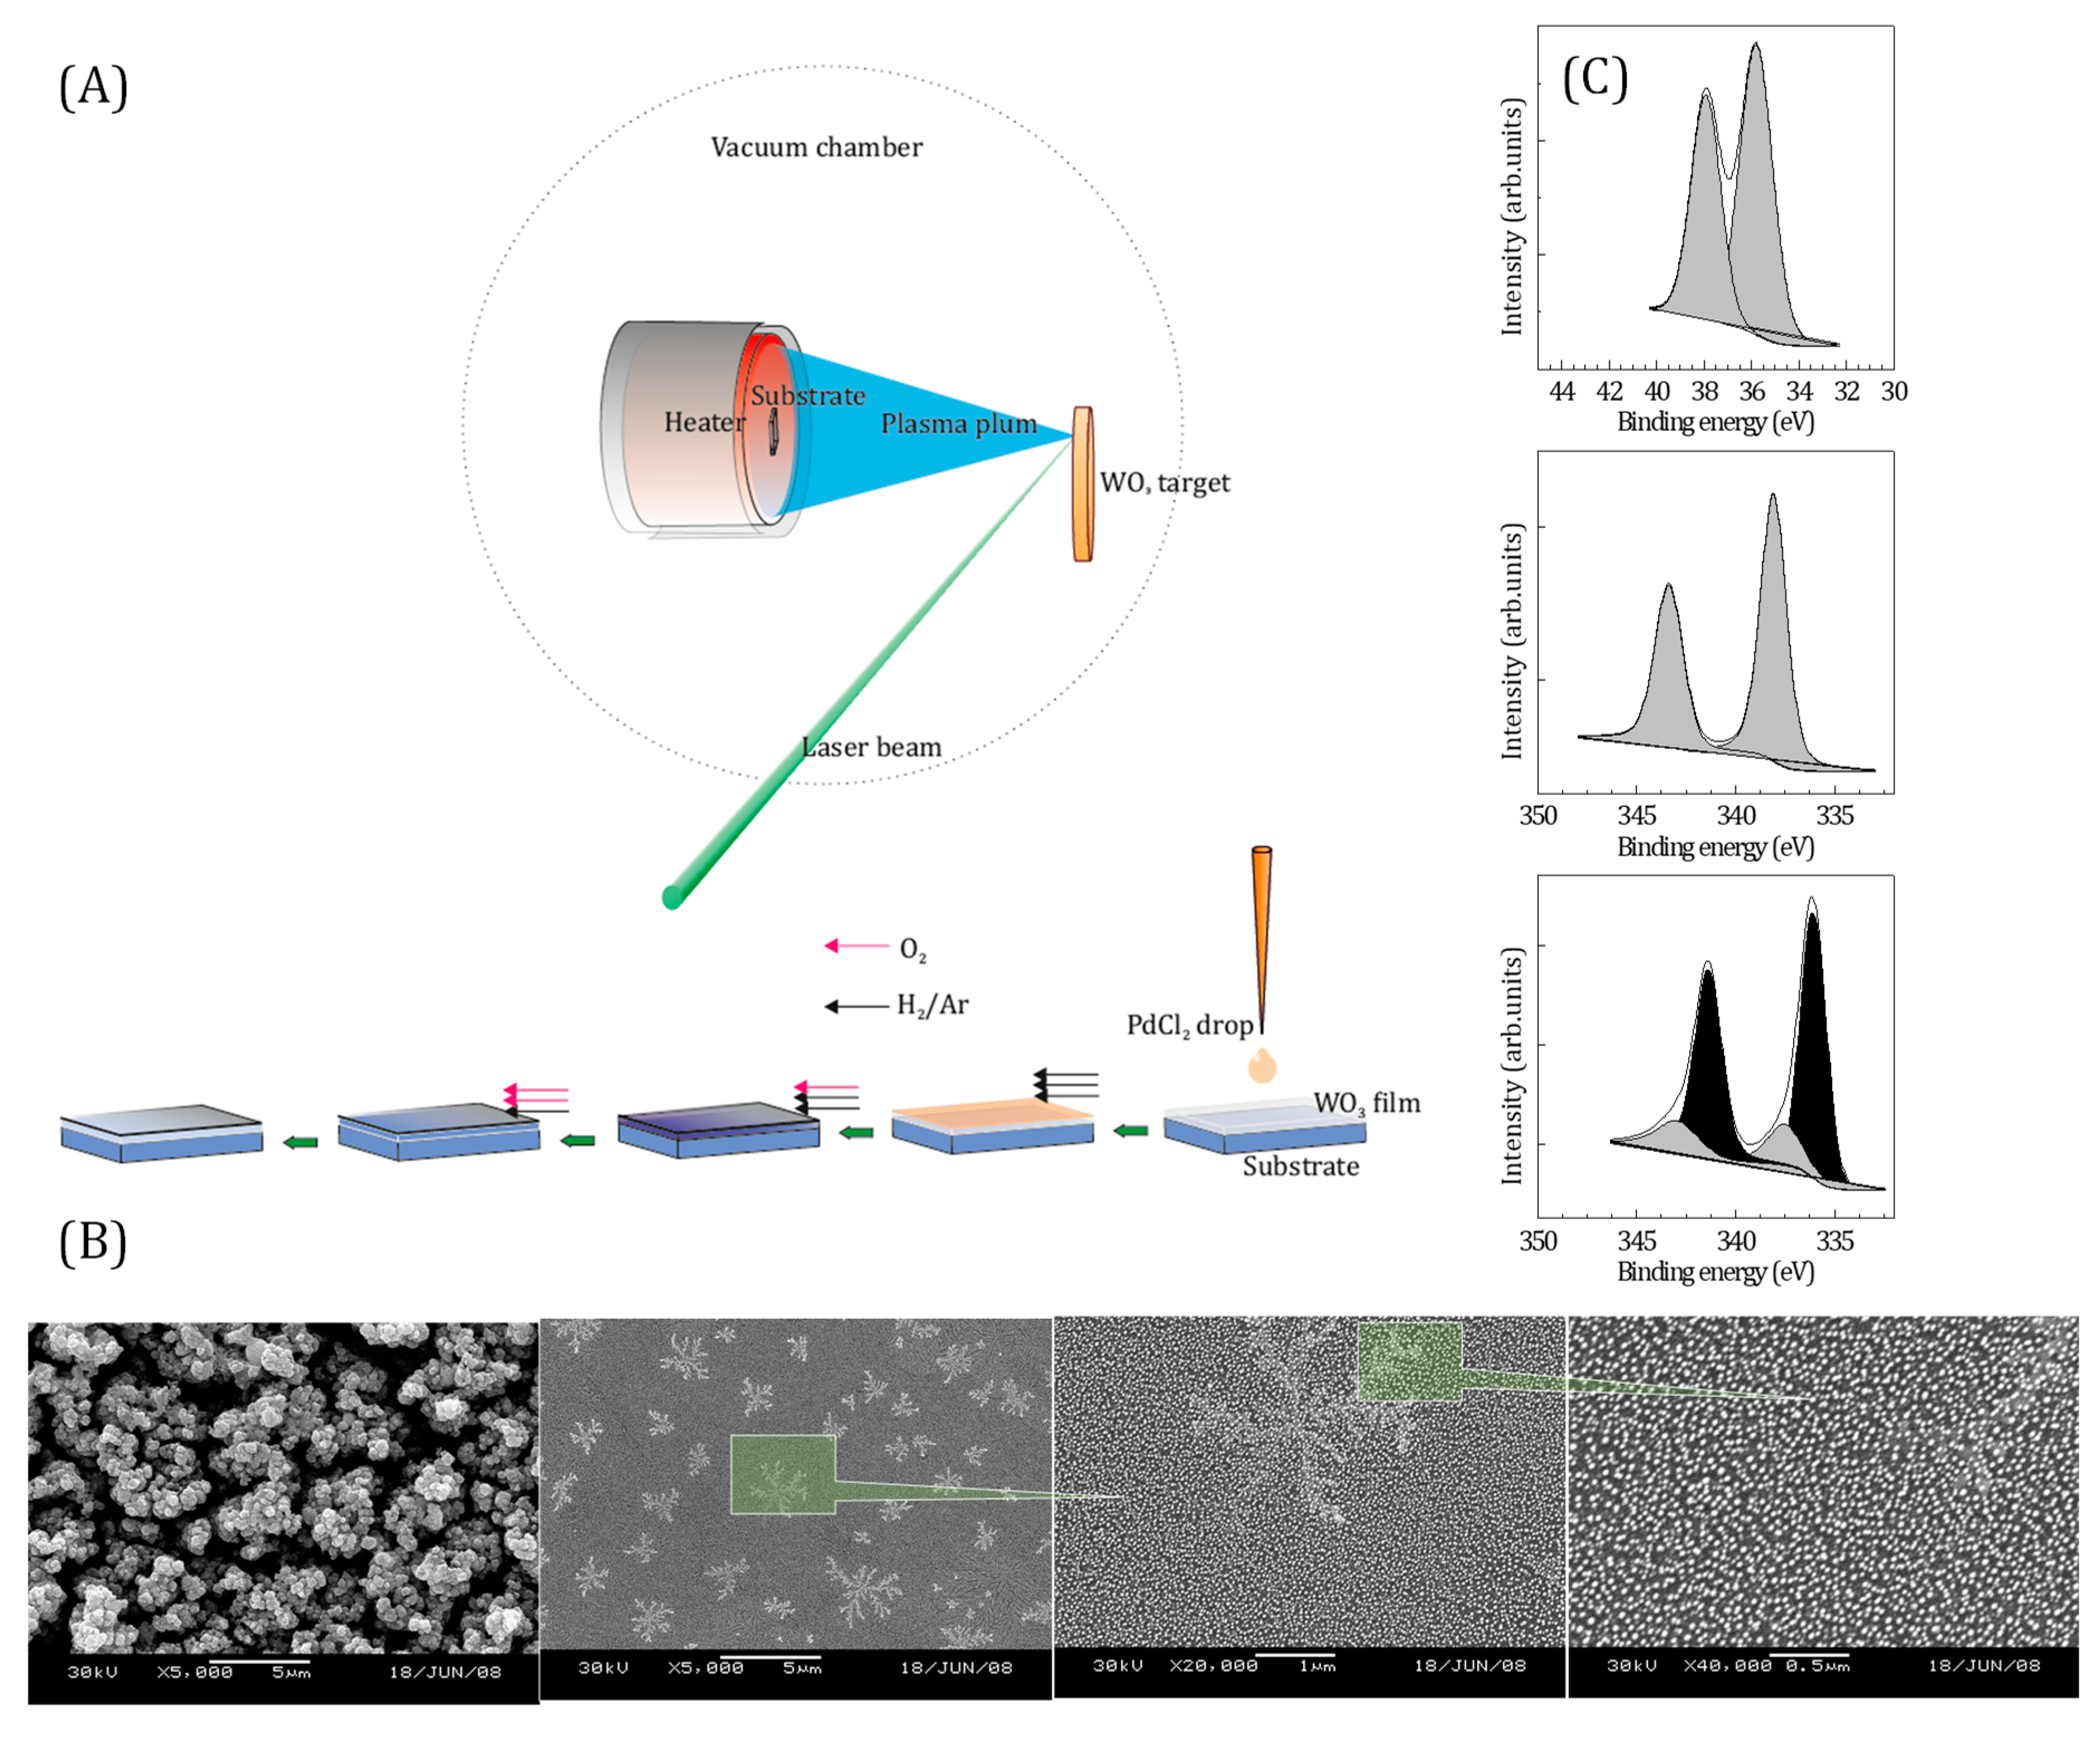
The schematic representation of preparation of Pd/WO3 samples is shown in Figure 1. Tungsten oxide nanostructured films were fabricated by reactive PLD method from tungsten oxide pressed powder (5 N) onto glass substrates at 200 °C. For reactive deposition, O2 gas with purity of 99.999% was used at 100 mTorr. Beam of a Nd: YAG Q-switched laser at wavelength of 1064 nm, energy density of 4 J·cm−2 and repetition rate of 5 Hz was used. For deposition of Pd, a 0.2 g/L PdCl2 solution was prepared and then several drops were delivered over the deposited films. After a drying step at 75 °C, a layer of PdCl2 was remained upon the surface. Then a slight flow of hydrogen diluted gas was exposed to the surface. For XPS, a concentric hemispherical analyzer (CHA) (Specs model EA10 plus) was used and to excite the X-ray photoelectrons, an Al Ka line at 1486.6 eV was employed. The SEM images have been achieved using a Philips XL30 electron microscope. A He-Ne laser (632.8 nm) was exposed to the samples placed inside a test cell and the optical transmission was measured by a photodiode.
3. Results and Discussion
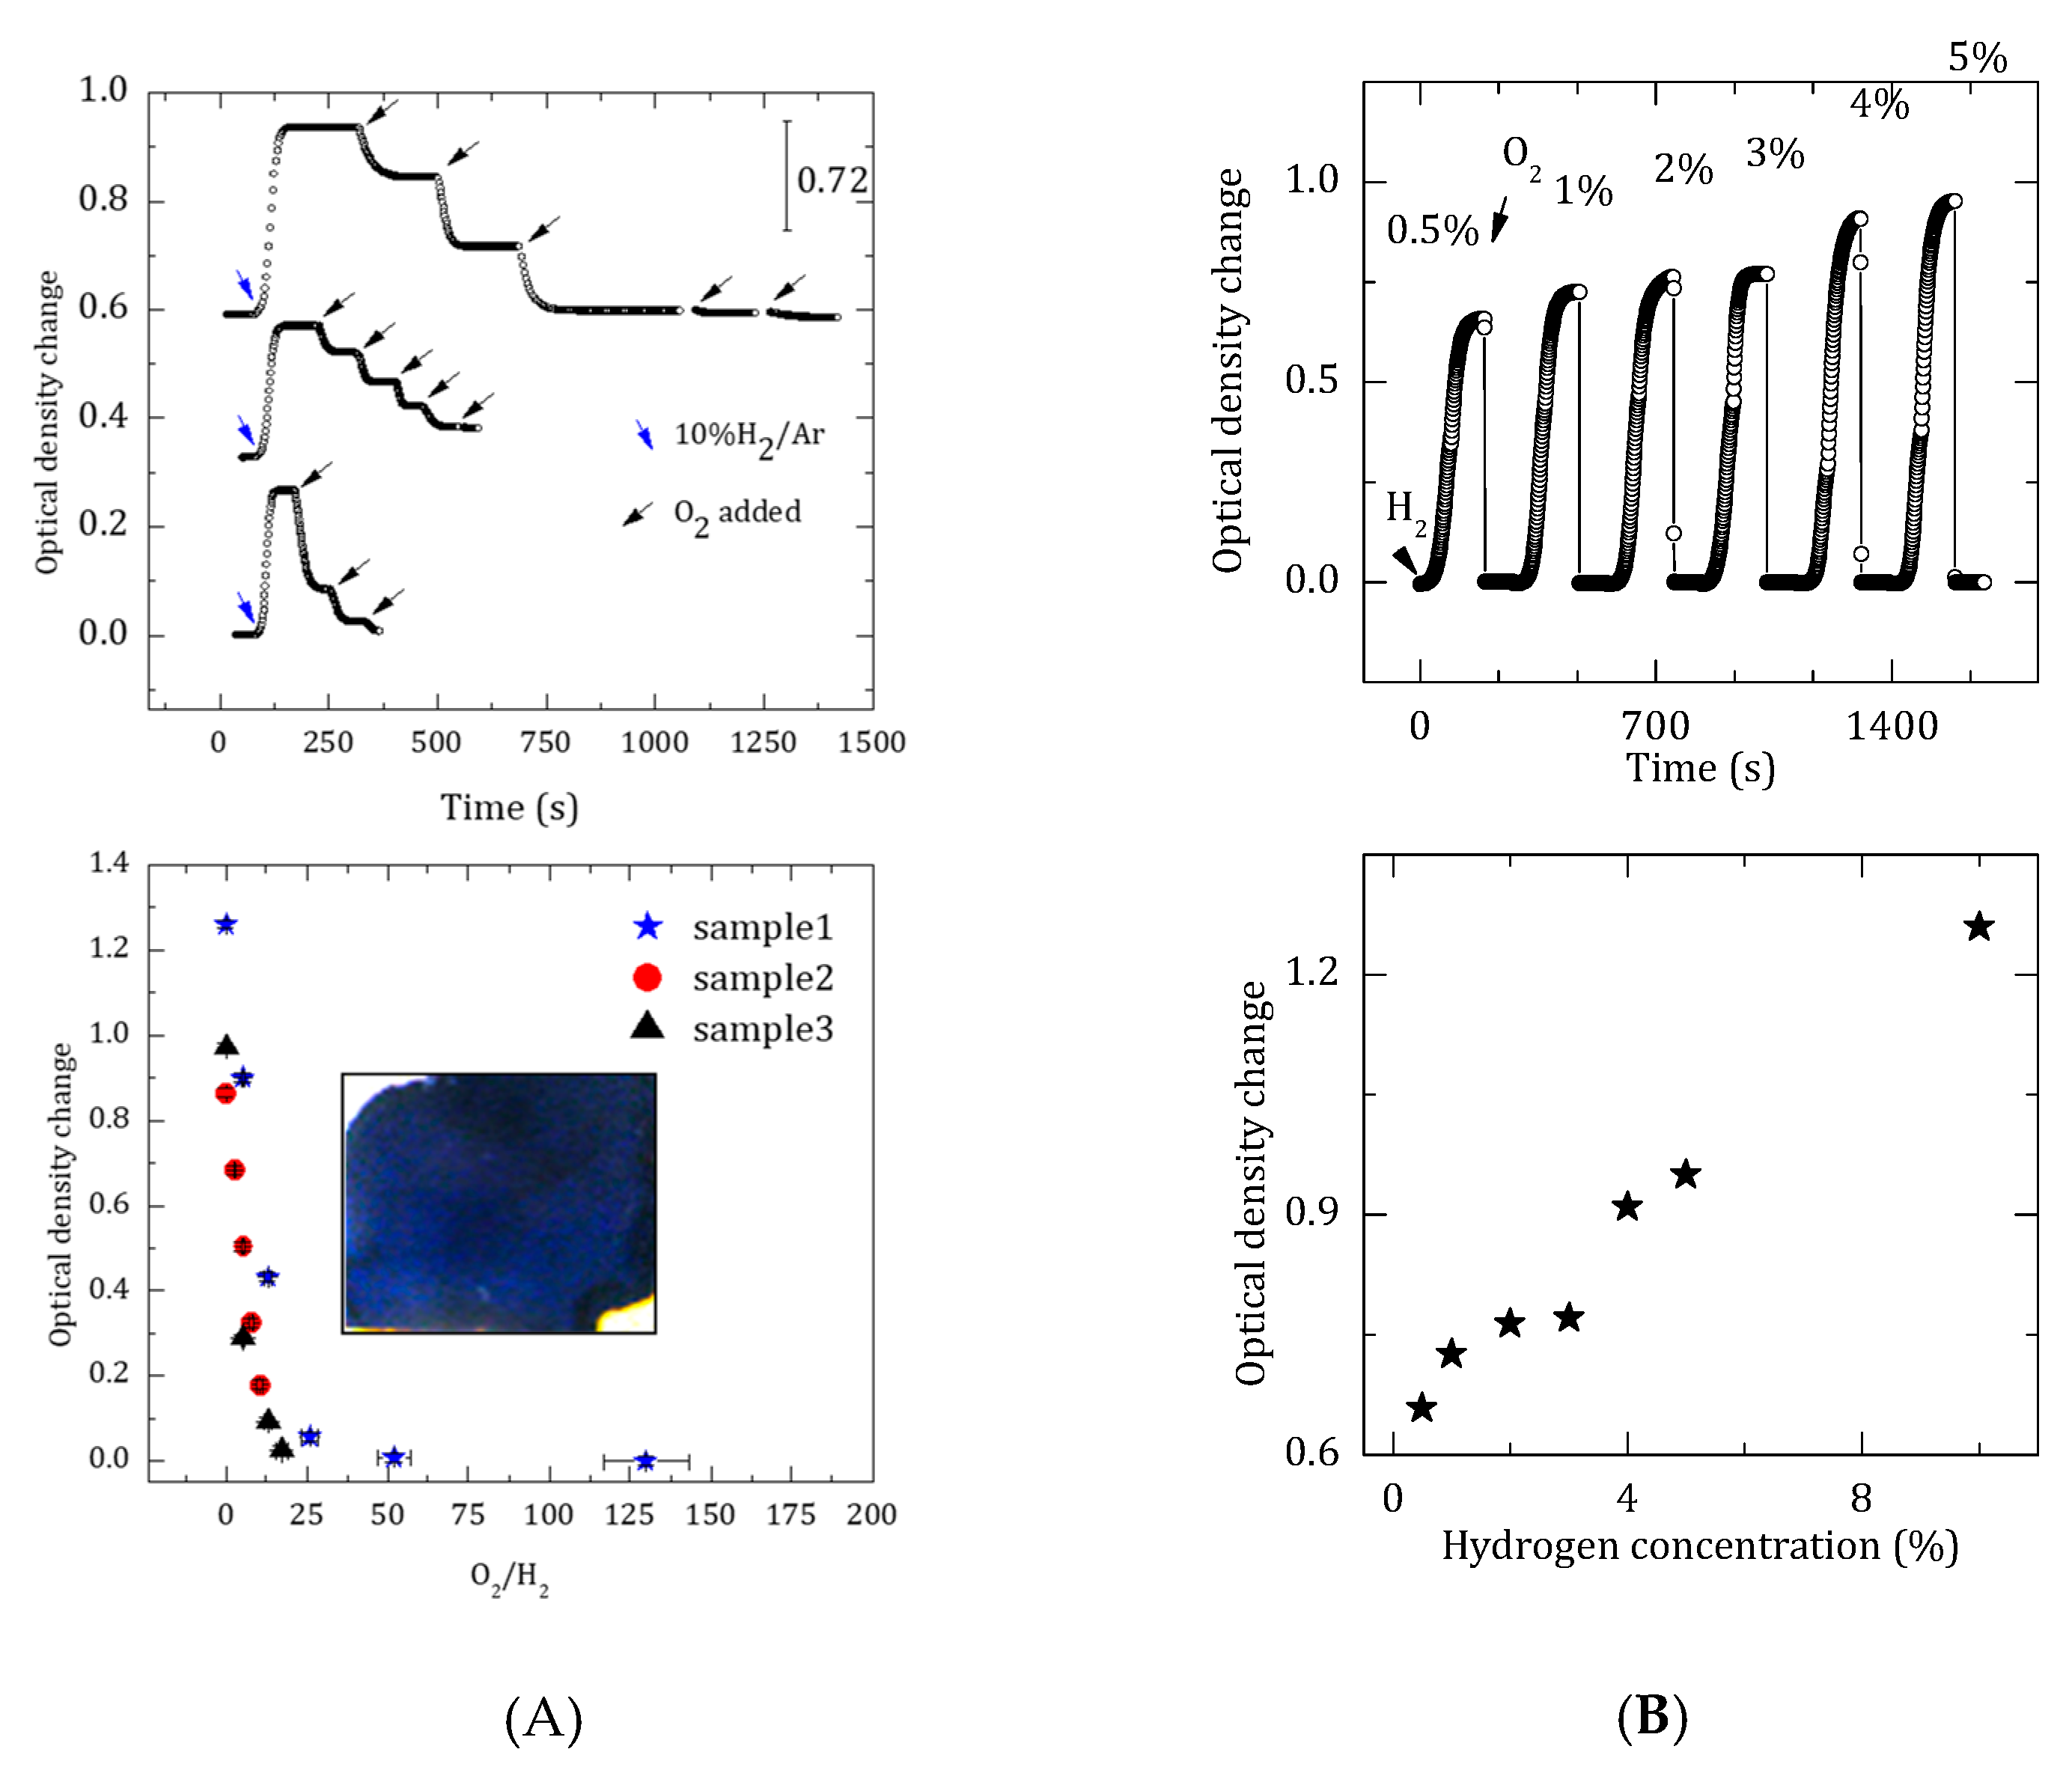
In Figure 1B SEM images of tungsten oxide films are illustrated for as deposited film and after reduction process of palladium chloride to metallic Pd by hydrogen, respectively. WO3 surface deposited by PLD show a highly porous nanostructure with a large number of voids between various cauliflower-like islands. This kind of growth provides an open morphology with a high effective surface area suitable for an enhanced gas-surface interaction in sensor devices. For the surface of Pd (NPs)/WO3 after hydrogen reduction process, it seems that the Pd particles grown through hydrogen reduction approach can be divided into two distinct types; fractal-like aggregates, better shown in corner and spherical dots with about 50 nm dimension distributed uniformly over the surface. W4f XPS spectrum of as-prepared WO3/glass sample is presented in Figure 1C. The doubled is fitted well with W6+ oxidation state in WO3 composition. Part (d & c) show the Pd3d spectrum of PdCl2/WO3 before and after hydrogen-reduction process. For spectrum of before reduction, one doublet with peak positions at 337.9 eV (Pd3d3/2) and 343.5 eV (Pd3d5/2) could be fitted to the curve. The peak positions are in consistent with core level spectra of Pd2+ in palladium chloride composition. For after reduction, the Pd3d doublet could be fitted with four peaks, two of them with higher majority (black fill) are shifted to lower binding energies of 336.0 eV and 314.4 eV close to those reported for metallic palladium. Two peaks with lower intensity (gray fill) are related to Pd2+ that can be originated from remains of some palladium chloride counterpart or from partial oxidation of palladium nanoparticles surface. The Pd/WO3 samples obtained by PLD and reduction reaction are examined for detection of oxyhydrogen gas. In the first step of experiment, samples color was saturated by injection %10H2/Ar mixture (30 L/h) gas to about 1.26. Then a variant of Ar/O2/H2 mixtures were alternatively injected in steps of different concentrations into the test box. To do this an oxygen flow was mixed with the existing flow of the H2/Ar. Figure 2A top shows the time variation of optical density change. By injecting the oxyhydrogen gas, depending on mixing ration, ΔOD reduces then being fixed at constant levels. In bottom panel, these constant values for all samples are shown versus the ratio of O2/H2. One can see that by increasing O2/H2 ratio, the optical density of the sample exponentially reduces to the zero. Although due to the presence of partial oxygen gas, this result is predictable, but the data show that for the gas sensing application of a gasochromic device in the ambient conditions, the role of oxygen must be consider in the total coloring dynamics. On the other hand, for gas detection in an oxygen-hydrogen containing reactors, it is possible to use the gasochromic properties of tungsten oxide films to measure the gas concentration. One can see that a greater content of palladium chloride solution in the hydrogen reduction process (sample S1) leads to detection ability of higher O2:H2 ratio. In order to study the gasochromic response against different hydrogen concentration, the switching kinetics of Pd(NPs)/WO3 were examined under exposure of different, 0.5–10% H2/Ar, mixtures at constant flow of 60 L/h. We chose sample S1, as the more proper sample, for concentration detection experiment. Time variation curves of optical density change is plotted in Figure 2A. Optical density changes are defined as:
∆OD = −ln[T(t)/T0]
where T0 and T are initial transmittance and transmittance at time t, respectively. The optical density change increases rapidly with time to a saturated amount. The saturation density change depends on hydrogen concentration. As Hydrogen atoms being injected into the WO3 pores coloring begins and optical density starts to rise. Current dynamical gasochromic theories predict the exponential time dependence of ∆OD for sputtered Pt/WO3 thin films when flushed with H2. In such a model a step function is assumed for H2 pressure, but in reality hydrogen is gradually incorporate into the catalyst lattice. Therefore the time delay is mainly attributed to gradually diffusion and dissociation of hydrogen in palladium clusters. The open surface distribution nature of Pd nanoparticles and fractals In Figure 1B,C provide an enhanced effective surface area for hydrogen absorption. For Electroless Pd covered gasochromic layers, we observed an immediately rise in coloring by exposing to hydrogen containing gas but the sensitivity and maximum optical density is better for hydrogen-reduced Pd cover WO3. Figure 2 shows the optical density as a function of hydrogen concentration in which the ΔOD increases linearly with hydrogen concentration. Since the fitted line dose not predicted the zero values, a different behavior of optical density may be possible for smaller values of hydrogen concentration.
4. Conclusions
In this paper highly porous tungsten oxide films were prepared by PLD method. Then they are covered by nanoparticles of metallic palladium through hydrogen reduction of PdCl2. The obtained Pd/WO3 samples showed a rapid coloring against hydrogen gas with saturated optical density depended on hydrogen concentration. As another application in gas sensing, our samples showed a good ability to detect the mixture of hydrogen and oxygen (as oxyhydrogen gas). It was shown that for a colored sample, the optical density precisely reduces to new constant levels as oxygen concentration increases.
Conflicts of Interest
The authors declare no conflict of interest.
References
- Deb, S.K. Opportunities and challenges in science and technology of WO3 for electrochromic and related applications. Solar Energy Mater. Solar Cells 2008, 92, 245–258. [Google Scholar] [CrossRef]
- Georg, A.; Graf, W.; Neumann, R.; Wittwer, V. Mechanism of the gasochromic coloration of porous WO3 films. Solid State Ion. 2000, 127, 319–328. [Google Scholar] [CrossRef]
- Wittwer, V.; Datz, M.; Ell, J.; Georg, A.; Graf, W.; Walze, G. Gasochromic windows. Solar Energy Mater. Solar Cells 2004, 84, 305–314. [Google Scholar] [CrossRef]
- Orel, B.; Krašovec, U.O.; Grošelj, N.; Kosec, M.; Dražič, G.; Reisfeld, R. Gasochromic behavior of sol-gel derived Pd doped peroxopolytungstic acid (W-PTA) nano-composite films. J. Sol-Gel Sci. Technol. 1999, 14, 291–308. [Google Scholar] [CrossRef]
- Chan, C.C.; Hsu, W.C.; Chang, C.C.; Hsu, C.S. Preparation and characterization of gasochromic Pt/WO3 hydrogen sensor by using the Taguchi design method. Sens. Actuators B Chem. 2010, 145, 691–697. [Google Scholar] [CrossRef]
- Kalanur, S.S.; Lee, Y.A.; Seo, H. Eye-readable gasochromic and optical hydrogen gas sensor based on CuS-Pd. RSC Adv. 2015, 5, 9028–9034. [Google Scholar] [CrossRef]
- Ranjbar, M.; Zad, A.I.; Mahdavi, S.M. Gasochromic tungsten oxide thin films for optical hydrogen sensors. J. Phys. D Appl. Phys. 2008, 41, 055405. [Google Scholar] [CrossRef]
- Sanger, A.; Kumar, A.; Jaiswal, J.; Chandra, R. A fast response/recovery of hydrophobic Pd/V2O5 thin films for hydrogen gas sensing. Sens. Actuators B Chem. 2016, 236, 16–26. [Google Scholar] [CrossRef]
Figure 1.
(A) Schematic representation of preparation Pd/WO3 samples, coloration by diluted hydrogen gas and revers steps by adding oxygen flow to examine detection of oxyhydrogen gas. (B) typical FESEM images of WO3 (top-left) and Pd/WO3 sample and (C) high resolution XPS spectra of W4f (top), and Pd3d before (middle) and after hydrogen reduction process.
Figure 2.
(A) Top: time variation of optical density change for oxyhydrogen gas for different samples of low, medium and high Pd content. Bottom: optical density change versus O2/H2 ratio and a photographic image of colored sample; (B) Top: time variation curves of optical density change bottom the optical density as a function of hydrogen concentration.
Publisher’s Note: MDPI stays neutral with regard to jurisdictional claims in published maps and institutional affiliations. |
© 2017 by the authors. Licensee MDPI, Basel, Switzerland. This article is an open access article distributed under the terms and conditions of the Creative Commons Attribution (CC BY) license (https://creativecommons.org/licenses/by/4.0/).
Share and Cite
MDPI and ACS Style
Ranjbar, M.; Sberveglieri, G. Oxyhydrogen and Hydrogen Detection by Gasochromic Coloration of Highly Porous Tungsten Oxide with Fractal-Like Pd Nanoparticles. Proceedings 2017, 1, 487. https://doi.org/10.3390/proceedings1040487
AMA Style
Ranjbar M, Sberveglieri G. Oxyhydrogen and Hydrogen Detection by Gasochromic Coloration of Highly Porous Tungsten Oxide with Fractal-Like Pd Nanoparticles. Proceedings. 2017; 1(4):487. https://doi.org/10.3390/proceedings1040487
Chicago/Turabian StyleRanjbar, Mehdi, and Giorgio Sberveglieri. 2017. "Oxyhydrogen and Hydrogen Detection by Gasochromic Coloration of Highly Porous Tungsten Oxide with Fractal-Like Pd Nanoparticles" Proceedings 1, no. 4: 487. https://doi.org/10.3390/proceedings1040487