Detection of Trend Change-Point in Passive Microwave and Optical Time Series Using Bayesian Inference over the Dry Chaco Forest †

Instituto de Astronomía y Física del Espacio (IAFE, CONICET-UBA), CABA, Buenos Aires C1428ZAA, Argentina
†
Presented at the 3rd International Electronic Conference on Sensors and Applications, 15–30 November 2016; Available online: https://sciforum.net/conference/ecsa-3.
Proceedings 2017, 1(2), 45; https://doi.org/10.3390/ecsa-3-E012
Published: 14 November 2016
(This article belongs to the Proceedings of Proceedings of the 3rd International Electronic Conference on Sensors and Applications, 15–30 November 2016; Available online: https://sciforum.net/conference/ecsa-3.)
Abstract
:The objective of this article was to compare the performance of two vegetation indices (MODIS EVI (optical) and AMSR-E/ and TMI/TRMM LPRM VOD (microwave)) using an offline Bayesian change-point algorithm to monitor vegetation dynamics (retrospective analysis). We tested this model by simulating 8-day EVI and VOD time series with varying amounts of seasonality, noise, length of the time series and by adding abrupt changes with different magnitudes. This model was applied over real time series (optical and microwave) over a dry forest area in Argentina, Dry Chaco Forest (DCF), where deforestation was common. A comparison with common model used over this region was made (visual inspection). The results compared favorably with Redaf dataset, based on Landsat images. These results show the potential to combine optical and passive microwave indices to identify disturb event. Furthermore, the results obtained in this manuscript were relevant for the DCF region, since they provide a fast and alternative model to the traditional visual analysis made by the national forest service and Redaf.
1. Introduction
Monitoring forest disturbances is critical for addressing its impact on carbon storage and fluxes, biodiversity, and other socio-ecological processes. Satellite remote sensing enables cost-effective and accurate monitoring at regular time steps over large areas. There is a critical need for methods that enable analysis of satellite image time series to detect forest disturbances, especially in developing countries (e.g., Argentina).
The region addressed in this paper is the Argentine part of the Chaco Region that covers 675.000 km2. Over the Chaco region we focused in the Dry Chaco Forest (DCF). This region presents large homogeneous sites covered by deciduous forest with moderate biomass (70–110 Tn·ha−1) and relatively low wood volume (~114 m3·ha−1 per 100 Tn·ha−1). The DCF is considered a hot spot by international organizations, such as the World Rainforest Institute. The vegetation is dominated by dry forest trees and shrubs, but natural grasslands occur in areas with sandy soils and frequent fires. There are several native forest species, but the dominating ones are “Quebracho colorado santiagueño” (Schinopsis quebracho colorado) and “Quebracho Blanco” (Aspidosperma quebracho blanco). Nowadays one of the most important threat to this forest is the fast expansion of agriculture (mainly soybean). Moreover, the expansion of livestock has also been documented as a major driver of deforestation in recent years, especially in north-west Argentina around the Chaco area, due the international demand of those products. The Chaco region has the highest absolute deforestation rates [1,2] of the country. The most recent report indicates a current deforestation rate for the Chaco region of 200,000 ha year−1 (that included also the Humid Chaco) [2].
Nowadays there is interest in studying forest ecosystem using microwave and optical indexes [3] since both are able to generate complementary information about vegetation condition [4,5,6,7,8]. Although characterized by coarser spatial resolutions, passive microwave sensors present shorter revisit times and are less affected than optical systems by atmospheric conditions [9]. Analyzed Vegetation Optical Depth (VOD) time series over South America to estimate annual forest loss using a change detection algorithm. The main hypothesis is that the microwave time series changes is related to the VOD sensitivity to above ground biomass [6,9]. In this context, the objectives of this work is to evaluate the ability of the Bayesian models to detect the timing of abrupt phenological changes in the VOD and Enhanced Vegetation Index (EVI) time series over the DCF, Argentina.
2. Materials and Methods
2.1. Offline Bayesian Change Detection
Change point detection is the identification of abrupt changes in the generative parameters of sequential data. The methodology used was based on [10,11]. The offline model works in batch mode. It first recourses backward, then simulates change points forward. Using Bayes’ theorem, the posterior probability of having terrain condition m change point and order at τ position given remote sensing time series can be expressed as follows:
where there are n observations y1:n = (y1, …, yn). Given m segments, defined by the ordered change points τ0, τ1, …, τm, with τ0 = 0 and τm = n. We assume independent priors for the parameters associated with each segment and also assume that the change points occur at discrete time points, and consider two priors for the change point. The first prior is based on a prior for the number of change points, and then a conditional prior on their positions. For more details see [10,11].
2.2. Reference Dataset
We processed microwave derived VOD data from the Advanced Microwave Scanning Radiometer—Earth Observing System Sensor (AMSR-E) and Microwave Imager/Tropical Rainfall Measuring Mission (TMI/TRMM) Land Parameter Retrieval Model (LPRM) product with 25 km of spatial resolution and optical data of the MODIS land surface reflectance product (MOD09A1) and Vegetation Indices 16-Day L3 (MOD13Q1) from 2000 to 2015. MOD09A1 and MOD13Q1 presents a spatial resolution of 500 m and 250 m, respectively. We calculated 8-day composition period of microwave products based on MODIS time series composition criteria.
We compare the results with other dataset called Redaf [12]. The Redaf dataset, which is available online at http://monitoreodesmonte.com.ar/, characterize the spatial and temporal dynamics of the transformation of the natural cover in the Dry Chaco ecoregion from 1976 to 2014 using Landsat images. This dataset was based on a manually digitalized analysis. We calculated the descriptive statistic inside the microwave pixels (25 km resolution) to compare with the model results.
2.3. Validation of the Method
In order to validate the performance of the algorithm we simulated optical and microwave time series. The objective was to discuss the sensitivity of the model to different characteristic of the time series. We simulated 8-day EVI and VOD time series with different noise, seasonality, and change magnitudes in order to robustly test the model in a controlled environment. Remote sensing time series were simulated by extracting key characteristics from MODIS 8-day EVI and AMRS-E and TMI/TRMM VOD time series. We selected time series representing a dry forest. The accuracy of the method for estimating the number, timing and magnitude of abrupt changes was assessed by adding disturbances with specific magnitude to the simulated time series. A simple disturbance was simulated by combining a step function with a specific magnitude. Then, we evaluated this algorithm using real time series (VOD and EVI) from multiple platform (microwave: AMSR-E and TMI/TRMM and optical. EVI MODIS at 250 m). We analyzed the year of the maximum value of posterior probability (PDF) over a subarea in the DCF using optical and microwave time series, and compare the result with the Redaf dataset.
3. Results and Discussion
3.1. Simulated EVI and VOD Time Series
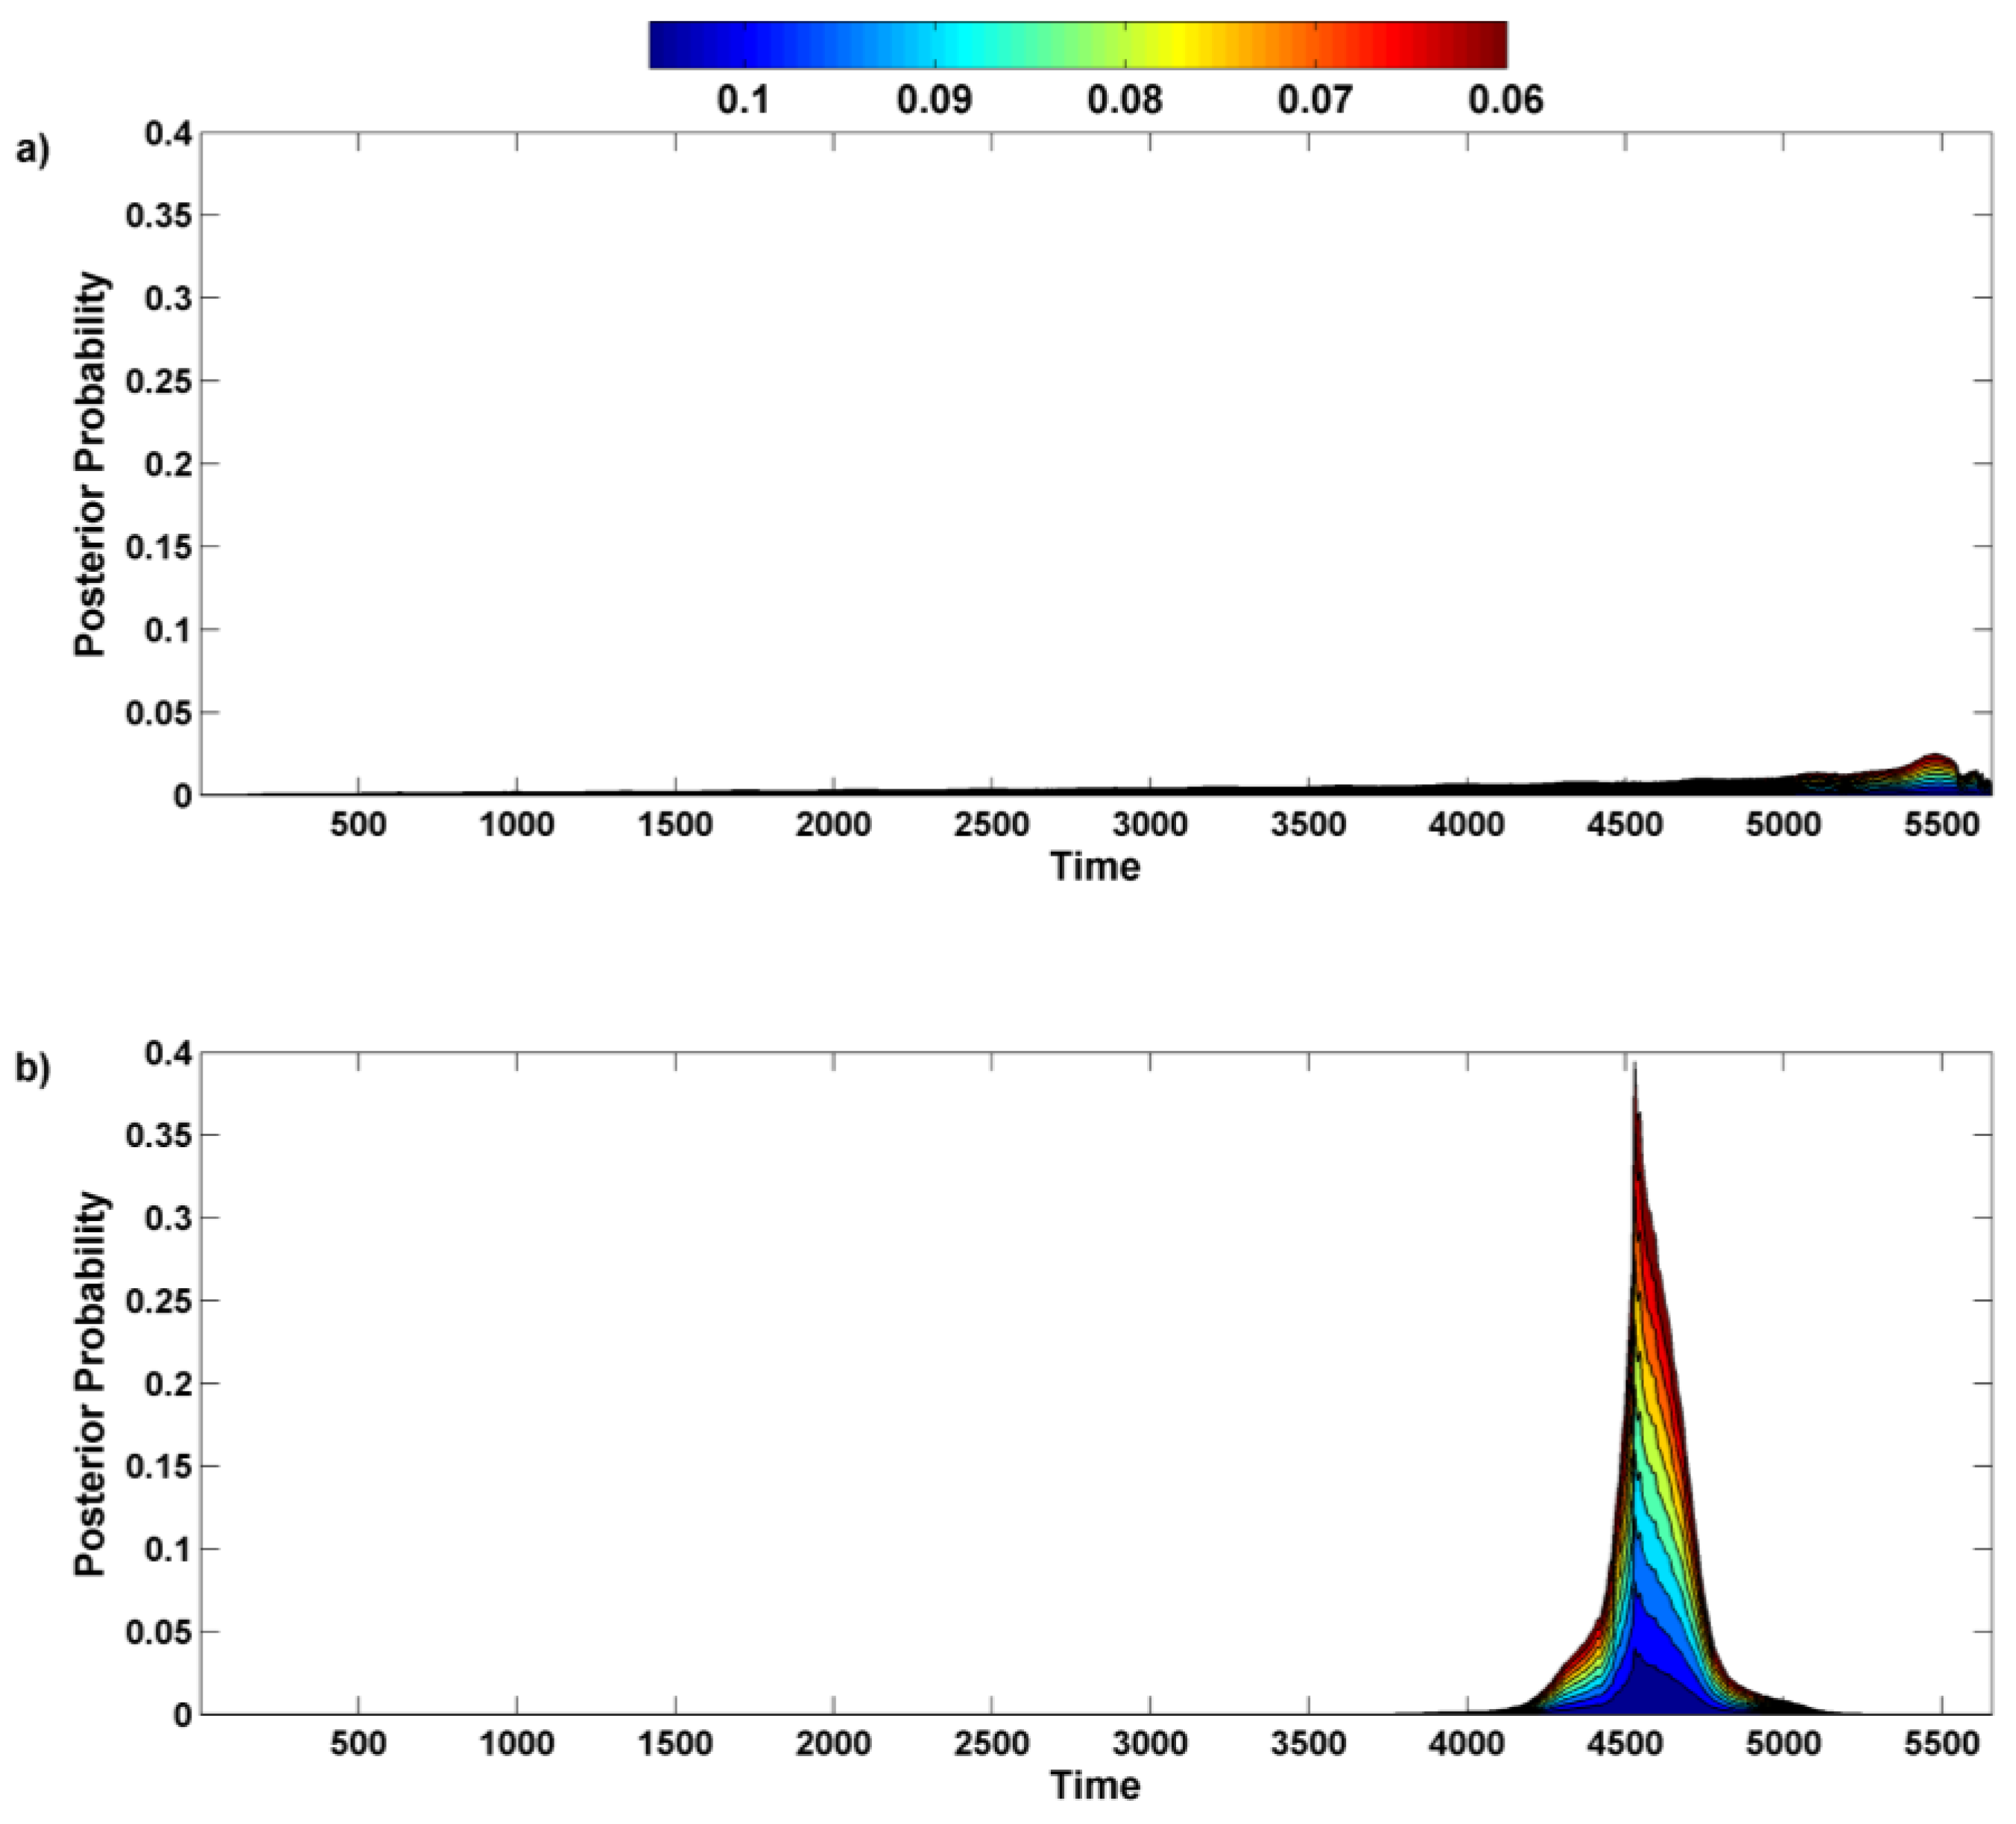
Three properties of the method were analyzed (magnitude, noise and amplitude). The accuracy of the model was evaluated using the posterior probability (PDF). Only a subset of the results are shown in Figure 1, however similar results were obtained for the rest of noise, magnitude and amplitude combinations. The results shows (Figure 1a) that the probability of detect a change point increase with the magnitude of that change. Figure 1b shows that there was a relation between the amplitude and the magnitude of change, which increase the probability of change point detection. However, when no change were simulated (magnitude = 0), changes in amplitude did not influence the detection of breakpoint. Similarly, the noise level did not influence the PDF when magnitude = 0 indicating a low commission error independent of the noise level (Figure 2a). The noise level only had an influence on the change point detection when the magnitude of the change was higher than 0.3, and was smaller than the overall noise level (Figure 2b). Results of VOD were similar to the ones founded by EVI simulations (result not shown).
3.2. Real EVI and VOD Time Series
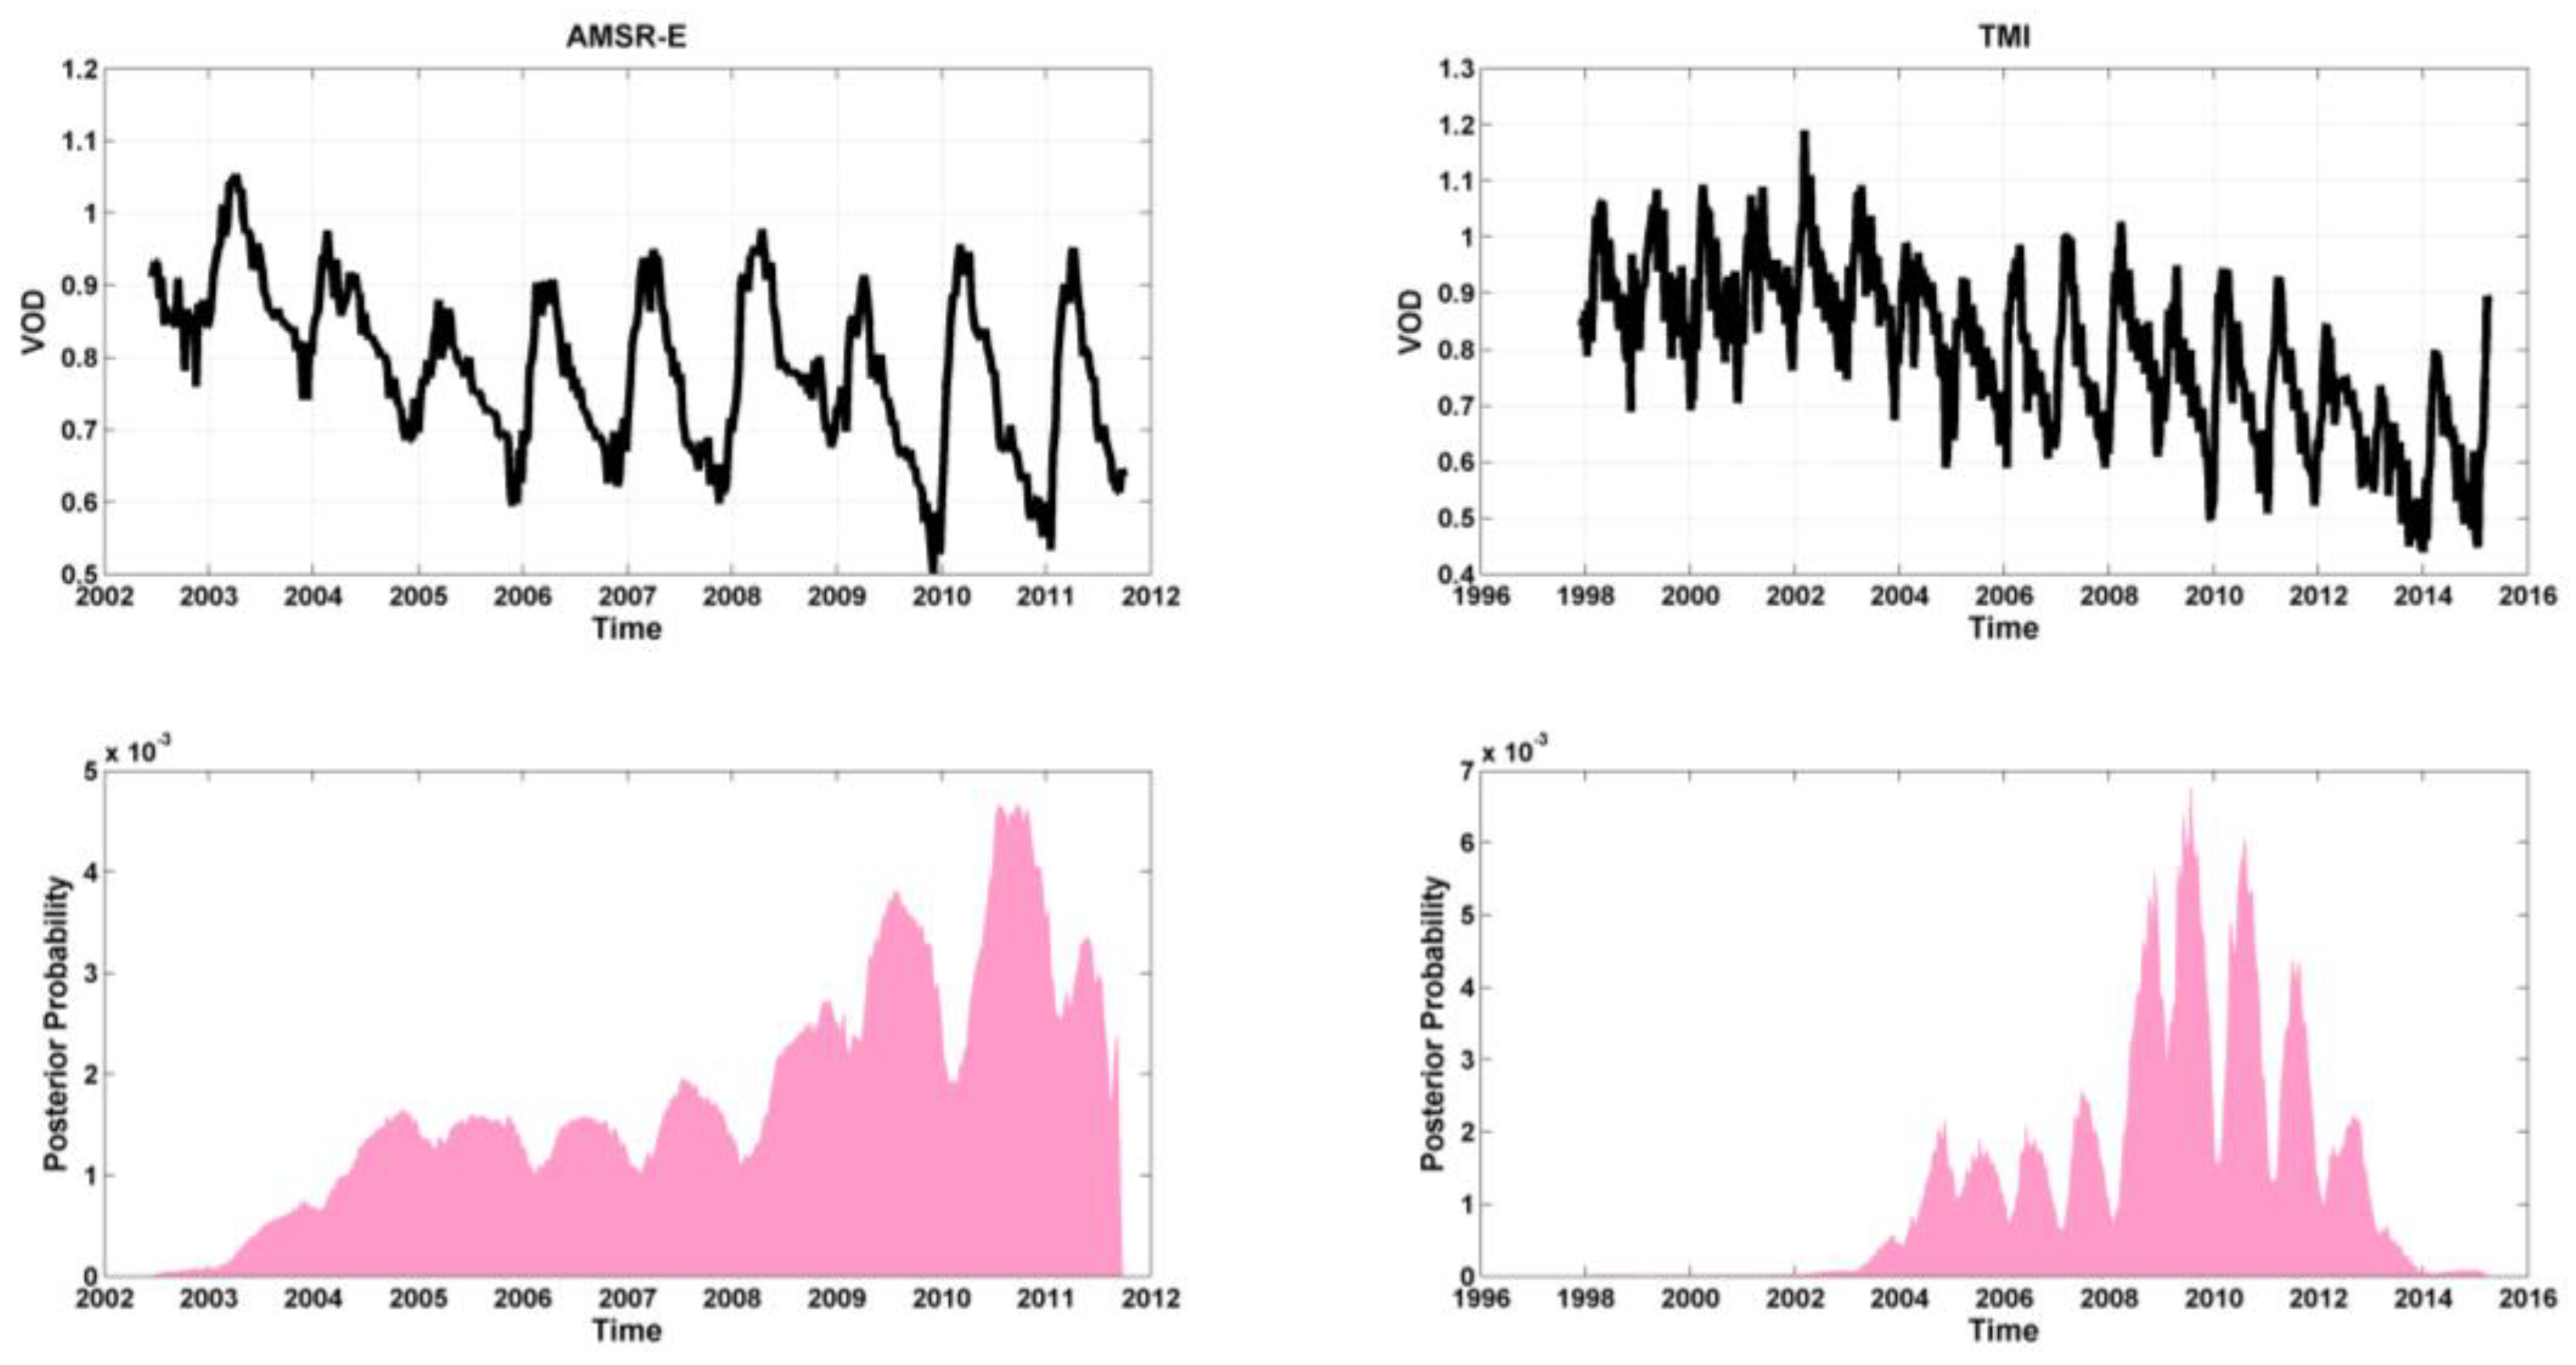
An example of changes detected by the offline Bayesian model in a forest area affected by deforestation was analyzed (Figure 3). In 2003–2004 the study area experienced a severe deforestation, which has been increasing the following years based on Redaf dataset [12]. We compared the possibility to detect a disturbs using time series with different length and noise (VOD from TMI and AMSRE) for the area presented in Figure 3. The results shows that a disturbs could be detected by both time series; however using the longer time series it was possible to identify a non-disturbed period (Figure 3).
A full analysis of this area was made (Figure 4) using 16-days MODIS EVI at 250 m showing that the transformed area presented a posterior probability higher than 0.1. There was an agreement in the spatial distribution of the transformed area showed by [12] and Figure 4. However, if we compared the year of the maximum posterior probably with Redaf results, we found that there were disagreement between them. Since this is a time series analysis, it was evident that more information was presented using the time series model rather than the visual analysis proposed by [12].
4. Conclusions
In this manuscript, we show that the offline Bayesian model for change point detection is applicable to optical and microwave time series. In particular, the results shows the advantages of using an automatic model to detect a changepoint (faster, describe the changes processes, etc.) than using only visual inspections. Furthermore, we analyzed the possibility to combine this model using two types of data series. Simulating time series with varying amounts of seasonality and noise, and by adding abrupt changes at different times and magnitudes, revealed that this model is robust against noise, and is not influenced by changes in amplitude of the seasonal component. The result obtained in this manuscript are relevant for the DCF region, since provide a fast and alternative model to the traditional visual analysis made by the forest service.
Author Contributions
Veronica Barraza and Francisco Grings conceived and designed the analysis over the dry Chaco Forest, Veronica Barraza processed the data and performer the model, Francisco Grings and Veronica Barraza analyzed the data and wrote the paper.
Acknowledgments
PICTO-2014-0099 manejo sustentable de los bosques nativos.
Conflicts of Interest
The authors declare no conflict of interest.
References
- Gasparri, N.I.; de Waroux, Y.L.P. The coupling of South American soybean and cattle production frontiers: New challenges for conservation policy and land change science. Conserv. Lett. 2014, 8, 290–298. [Google Scholar] [CrossRef]
- Gasparri, N.I.; Grau, H.R. Forest Ecology and Management Deforestation and fragmentation of Chaco dry forest in NW Argentina (1972–2007). For. Ecol. Manag. 2009, 258, 913–921. [Google Scholar] [CrossRef]
- Shi, J.; Jackson, T.; Tao, J.; Du, J.; Bindlish, R.; Lu, L.; Chen, K.S. Remote Sensing of Environment Microwave vegetation indices for short vegetation covers from satellite passive microwave sensor AMSR-E. Remote Sens. Environ. 2008, 112, 4285–4300. [Google Scholar] [CrossRef]
- Barraza, V.; Grings, F.; Ferrazzoli, P.; Huete, A.; Restrepo-Coupe, N.; Beringer, J.; Van Gorsel, E.; Karszenbaum, H. Behavior of multitemporal and multisensor passive microwave indices in Southern Hemisphere ecosystems. J. Geophys. Res. Biogeosci. 2014, 119, 2231–2244. [Google Scholar] [CrossRef]
- Barraza, V.; Restrepo-Coupe, N.; Huete, A.; Grings, F.; Van Gorsel, E. Passive microwave and optical index approaches for estimating surface conductance and evapotranspiration in forest ecosystems. Agric. For. Meteorol. 2015, 213, 126–137. [Google Scholar] [CrossRef]
- Liu, Y.Y.; Dijk, A.I.; McCabe, M.F.; Evans, J.P.; Jeu, R.A. Global vegetation biomass change (1988–2008) and attribution to environmental and human drivers. Glob. Ecol. Biogeogr. 2013, 22, 692–705. [Google Scholar] [CrossRef]
- Andela, N.; Liu, Y.Y.; van Dijk, A.I.; de Jeu, R.A.M.; McVicar, T.R. Global changes in dryland vegetation dynamics (1988–2008) assessed by satellite remote sensing: Comparing a new passive microwave vegetation density record with reflective greenness data. Biogeosciences 2013, 10, 6657–6676. [Google Scholar] [CrossRef]
- Jones, M.O.; Kimball, J.S.; Jones, L.A.; McDonald, K.C. Satellite passive microwave detection of North America start of season. Remote Sens. Environ. 2012, 123, 324–333. [Google Scholar] [CrossRef]
- Van Marle, M.J.E.; van der Werf, G.R.; de Jeu, R.A.M.; Liu, Y.Y. Annual South American forest loss estimates based on passive microwave remote sensing (1990–2010). Biogeosciences 2016, 13, 609–624. [Google Scholar] [CrossRef]
- Fearnhead, P. Exact and efficient Bayesian inference for multiple changepoint problems. Stat. Comput. 2006, 16, 203–213. [Google Scholar] [CrossRef]
- Xuan, X.; Murphy, K. Modeling changing dependency structure in multivariate time series. In Proceedings of the 24th International Conference on Machine Learning, Corvalis, OR, USA, 20–24 June 2007; ACM: New York, NY, USA, 2007; pp. 1055–1062. [Google Scholar]
- Vallejos, M.; Volante, J.N.; Mosciaro, M.J.; Vale, L.M.; Bustamante, M.L.; Paruelo, J.M. Transformation dynamics of the natural cover in the Dry Chaco ecoregion: A plot level geo-database from 1976 to 2012. J. Arid Environ. 2015, 123, 3–11. [Google Scholar] [CrossRef]
Figure 1.
Posterior probability as a function of time and change magnitude (noise = 0.08 and amplitude = 0.1) (a) and with different amplitude (magnitude = 0.2 and noise = 0.08) (b) for simulated 8-days EVI.
Figure 1.
Posterior probability as a function of time and change magnitude (noise = 0.08 and amplitude = 0.1) (a) and with different amplitude (magnitude = 0.2 and noise = 0.08) (b) for simulated 8-days EVI.

Figure 2.
Posterior probability as a function of time and noise level: with magnitude = 0 (a) and with magnitude = 0.3 (b) for simulated 8-days EVI.
Figure 2.
Posterior probability as a function of time and noise level: with magnitude = 0 (a) and with magnitude = 0.3 (b) for simulated 8-days EVI.

Figure 3.
8-days VOD time series from AMSR-E (left column) and TMI/TRMM (right column) and the posterior probability for each series derived from the Offline Bayesian change detection model.
Figure 3.
8-days VOD time series from AMSR-E (left column) and TMI/TRMM (right column) and the posterior probability for each series derived from the Offline Bayesian change detection model.

Figure 4.
Offline Bayesian change detection results using 8-days MODIS EVI time series over a subarea in the Dry Chaco Forest. (a) The year of the maximum value of posterior probability (PDF); (b) the PDF and (c) the year of the transformed forest area from Redaf dataset [12].
Figure 4.
Offline Bayesian change detection results using 8-days MODIS EVI time series over a subarea in the Dry Chaco Forest. (a) The year of the maximum value of posterior probability (PDF); (b) the PDF and (c) the year of the transformed forest area from Redaf dataset [12].

Publisher’s Note: MDPI stays neutral with regard to jurisdictional claims in published maps and institutional affiliations. |
© 2016 by the authors. Licensee MDPI, Basel, Switzerland. This article is an open access article distributed under the terms and conditions of the Creative Commons Attribution (CC BY) license (https://creativecommons.org/licenses/by/4.0/).
Share and Cite
MDPI and ACS Style
Barraza, V. Detection of Trend Change-Point in Passive Microwave and Optical Time Series Using Bayesian Inference over the Dry Chaco Forest. Proceedings 2017, 1, 45. https://doi.org/10.3390/ecsa-3-E012
AMA Style
Barraza V. Detection of Trend Change-Point in Passive Microwave and Optical Time Series Using Bayesian Inference over the Dry Chaco Forest. Proceedings. 2017; 1(2):45. https://doi.org/10.3390/ecsa-3-E012
Chicago/Turabian StyleBarraza, Veronica. 2017. "Detection of Trend Change-Point in Passive Microwave and Optical Time Series Using Bayesian Inference over the Dry Chaco Forest" Proceedings 1, no. 2: 45. https://doi.org/10.3390/ecsa-3-E012