Proceeding Paper

Design and Development of a Nearable Wireless System to Control Indoor Air Quality and Indoor Lighting Quality †

by
Francesco Salamone
ITC-CNR, Construction Technologies Institute- National Research Council of Italy, Lombardia Str., 49-20098 San Giuliano M.se, Italy
Presented at the 3rd International Electronic Conference on Sensors and Applications, 15–30 November 2016; Available online: https://sciforum.net/conference/ecsa-3.
Proceedings 2017, 1(2), 11; https://doi.org/10.3390/ecsa-3-E002
Published: 14 November 2016

Abstract

:
The article describes the results of the project “open source Smart lamp” aimed at designing and developing a smart object able to manage and control the Indoor Environmental Quality (IEQ) of the built environment. A first version of this smart object, built following a DIY approach using a microcontroller, an integrated temperature and relative humidity sensor and techniques of Additive Manufacturing, allows for the adjustment of the Indoor thermal Comfort Quality (ICQ), by interacting directly with the air conditioner. An experimental test in a real office showed how the use of the Smart Lamp effectively reduced energy consumption for air conditioning, optimizing the thermal comfort of the workers. As it is well known, the IEQ is a holistic concept including the Indoor Air Quality (IAQ), the Indoor Lighting Quality (ILQ) and Acoustic comfort, besides the thermal comfort. The upgrade of the Smart Lamp bridges this gap providing the possibility to interact with the air exchange unit and lighting system, in order to get an overview of the potential of a nearable device in the management of the IEQ. The upgraded version was tested in an office equipped with a mechanical ventilation and air conditioning system and occupied by 4 workers. The experiment was compared with a baseline scenario and the results showed how the application of the nearable device effectively optimizes both IAQ and ILQ.

1. Introduction

The term “Nearable” (or nearable technology), used for the first time in 2014 as part of a marketing campaign, is now used to uniquely identify the idea of smart objects that can be equipped with a variety of sensors and can work as transmitters to broadcast digital data [1]. This technology finds application in serveral fields; the present article describes the potential in building automation. The motivation arises from an open source project aimed at designing and developing a smart object for the assessment and management of the Indoor Environmental Quality (IEQ) of the built environment. The result of this project was the Smart Lamp [2] implemented by ITC-CNR [3] following the principles of the “maker movement” philosophy and the Do It Yourself (DIY) approach [4,5,6] more and more applied in different contexts: from monitoring systems [7,8] to control systems of RES installations [9,10] to applications in the biomedical field in order to make the equipment less expensive and, consequently, more accessible [11,12]. Such a device, built using a microcontroller, an integrated temperature and relative humidity sensor, some other modules and Additive Manufacturing (AM) techniques, was applied in an office normally occupied by 4 workers, equipped with an air conditionning system and naturally ventilated. The analysis of the thermal variables and the energy consumption demonstrated how it is possible to optimally manage the Indoor thermal Comfort Quality (ICQ) and the energy performance of the air conditioning system through the use of the Smart lamp. The assessment of the other paramenters of the IEQ is the natural upgrade of the Smart Lamp. In particular, the device provides the possibility to control and optimize the illuminance level and the CO2 concentration starting up the lighting equipment and the air exchanger. The new version of the Smart Lamp was tested in the same office by monitoring the environmental variables for 14 days, divided in two periods with different control configurations: the former with manual control (23 May 2016–29 May 2016) and the latter with automatic control (30 May 2016–5 June 2016).

2. Hardware

The hardware and software elements of the system are defined using typical concepts of the DIY philosophy: wireless communication, low cost hardware and 3D printed parts. The system is splitted in two parts (Figure 1): a monitoring station placed near the workstation (nearable monitoring station) able to assess the exact level of illuminance and air quality and a receiving station (actuation station) wireless connected to the nearable monitoring station that manages the actuation of both the air exchange system and the lamp. Both parts have small dimensions and weight, in order to be adjustable and to minimize their impact on human activity, especially in workplaces.

2.1. Nearable Monitoring and Coordination Station

The nearable monitoring station consists of the following elements:
  • Arduino UNO r3 with “sandwich connected” wireless shield;
  • XBee S2 module;
  • RTC module based on DS1307 chip;
  • K30 CO2 concentration sensor;
  • A photoresistor and a 10 KΩ resistor.
In this specific case, the desk lamp is located on the desktop at about 0.8 m from the floor. It is equipped with a non-dimmable LED bulb type with a power consumption of 8 W, a light output of 810 lm and a cold white light (4200 K).

2.2. Receiving Actuation Station

The receiving actuation station consists of the following elements:
  • XBee S2 module;
  • 2-Channel relay module;
  • 5 V/3.3 V power supply module.
The XBee S2 module is the core of the actuation station. It receives information from the coordinator module connected to the monitoring station, and sets the digital pin 18 (D2) and 17 (D3) to High or Low value depending on the received information enabling the actuation of the air exchange and illumination systems by means of the two relays.

2.3. Data Connection

The overall configuration system provides for the use of two S2 XBee modules (Table 1), that support the ZigBee protocol [13], based on 802.15.4 standard [14,15]. The XBee module, set as API coordinator, is connected to the Arduino UNO r3 of the nearable monitoring unit through a specific shield. The XBee module, set as End Device AT, is the core of the actuation unit.

3. Case Study and Method of Evaluation of Comfort
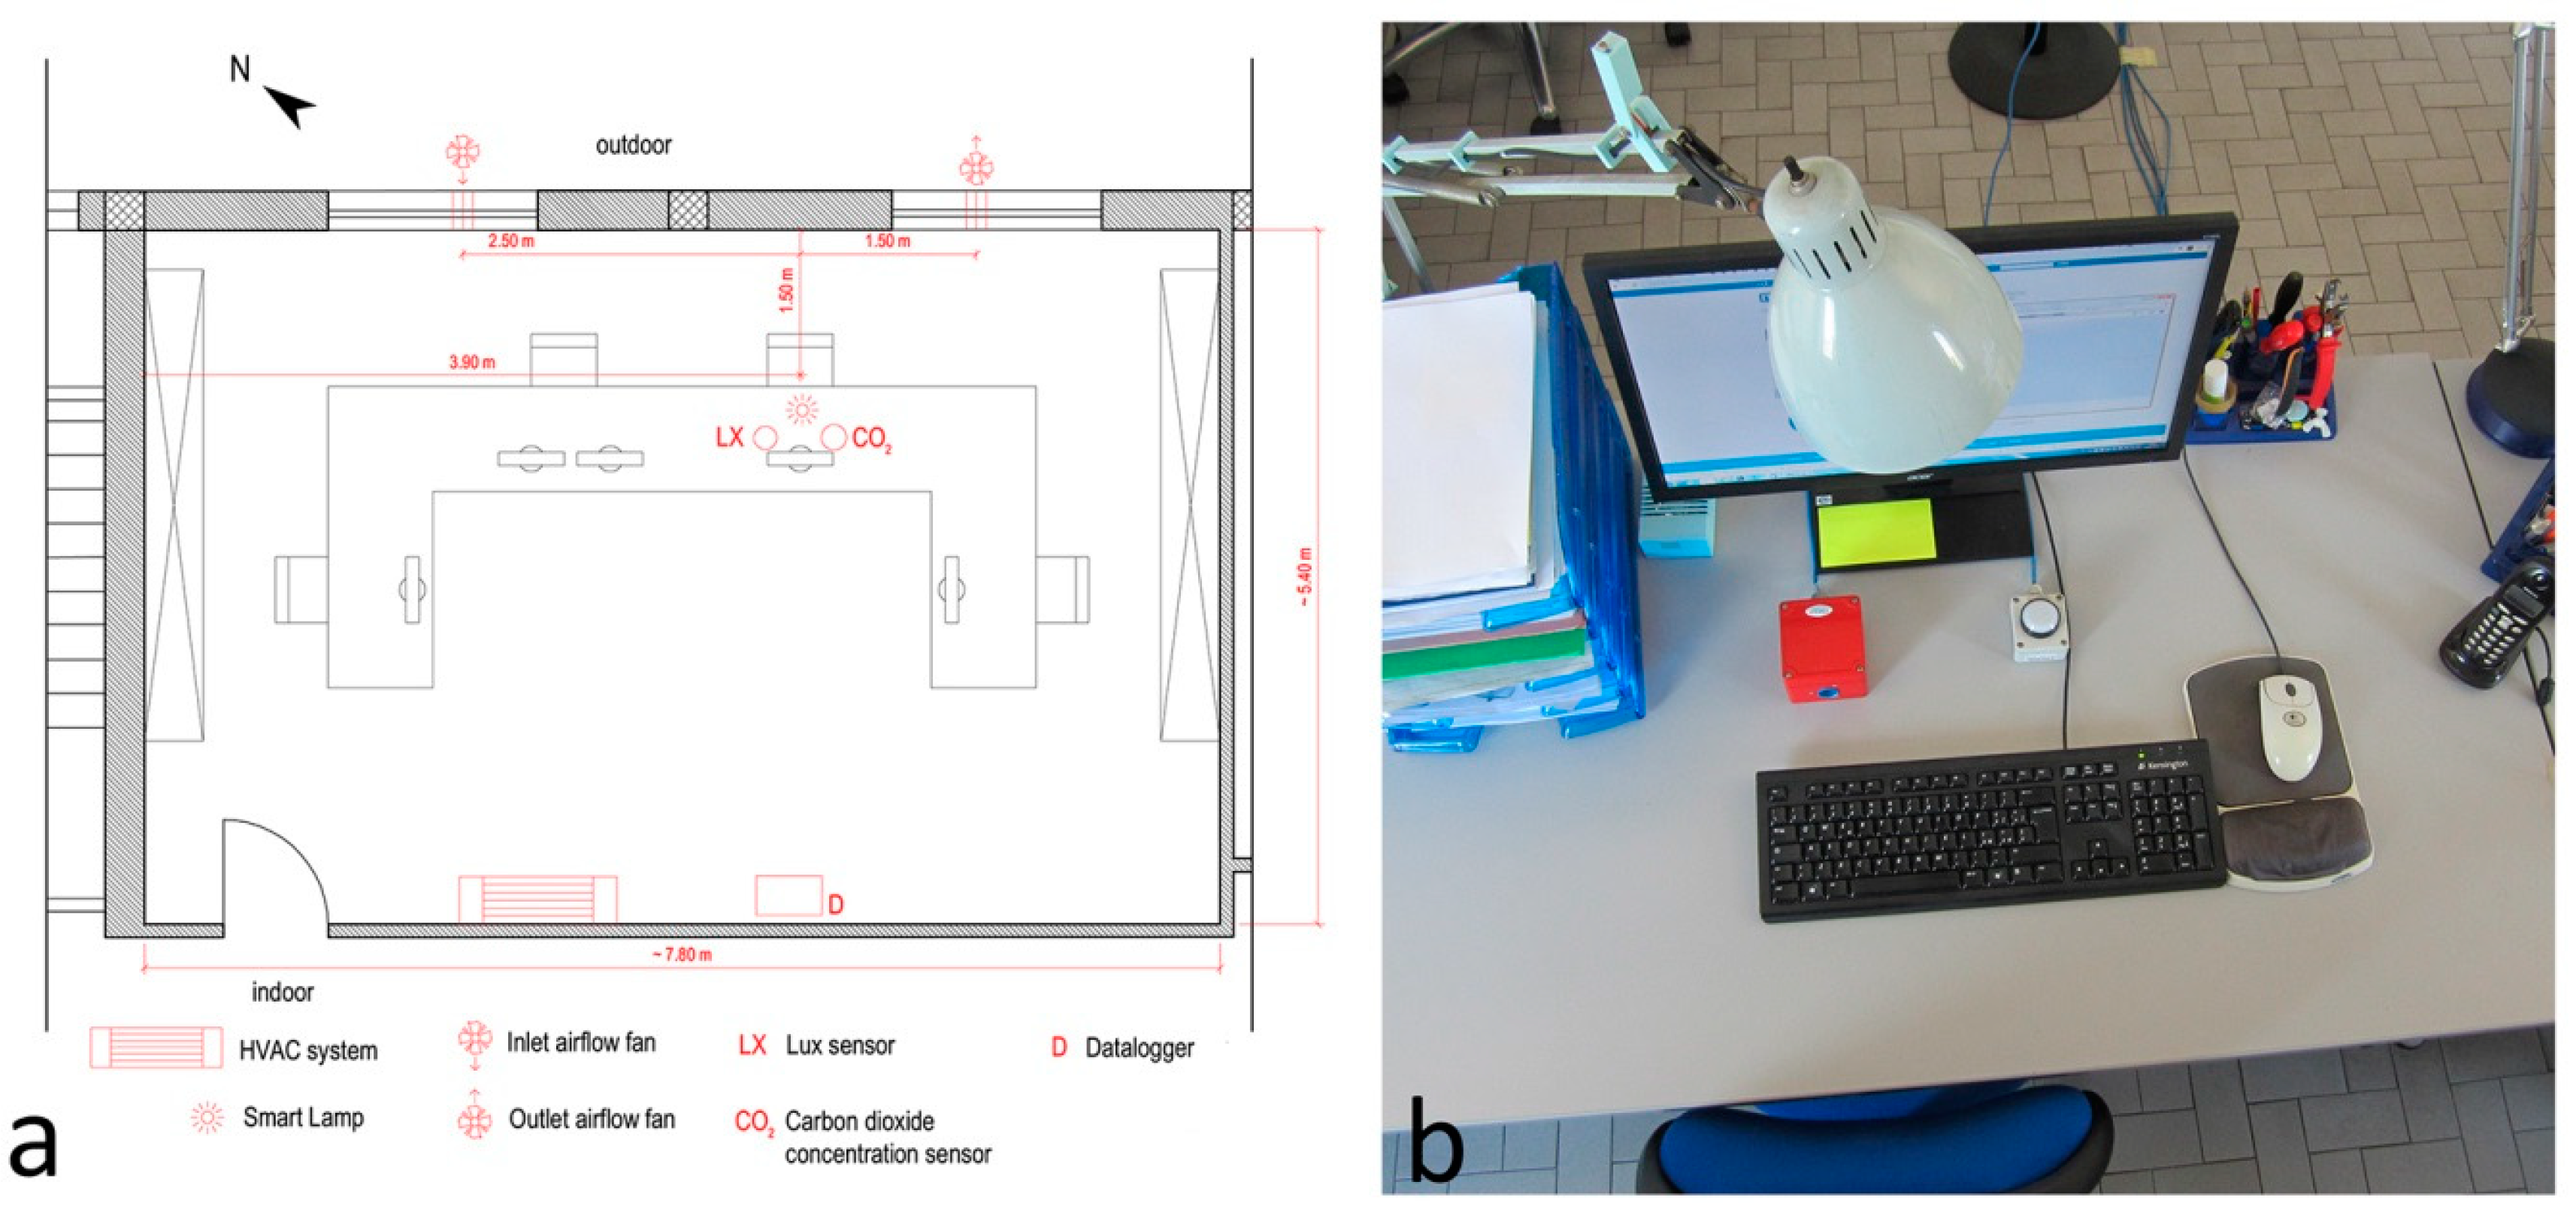
3.1. Case Study

The system was installed in an office, located on the first and top floor, with an area of about 42 m2 (7.81 m × 5.37 m) normally occupied by four users (Figure 2a). The air exchange system used in the second test period consists of 2 Orieme OA 15 A fans: one introduces fresh air into the office, the other discharges the exhaust air. Both units have no filter or heat recovery system and are connected to the same relay of the receiving actuation station. The average intake/discharge speed is equal to 2.5 m/s. Considering the diameter of the duct, equal to 0.15 m, its hourly flow rate results to be equal to 159 m3/h. This value is greater than that defined by the Italian Standard UNI 10339:1995 which for “single or open space” offices, indicates a specific flow rate of air exchange equal to 11 l/s person (equal to 39.6 m3/h person). By multiplying this value by the number of people in the office, a flow rate of 158.4 m3/h is obtained, fulfilling the requirement.
A carbon dioxide concentration sensor (CO2) and a lux meter (LX) were installed (Figure 2a,b) close to the work place where the air and lighting quality are analyzed. Both sensors are placed on the desktop next to the nearable and are connected to a data logger (D). The data of the environmental variables are recorded every 10 s and then averaged every minute and stored on the memory card.

3.2. ILQ and IAQ Method of Evaluation

The air and lighting quality are assessed using the methodologies provided by the technical regulations. In the first case, the level of IAQ is determined considering the concentration of CO2 [16]. In this case, the main technical standard is EN 15251:2008 that identifies the optimal values of air exchange for different types and classes of pollution of the buildings, in addition to the concentration threshold values of pollutants in air and in building materials. In particular, the difference in CO2 concentration between indoor (CO2,i) and outdoor air (CO2,o) (Table 2) highlights whether the ventilation strategies of the rooms are correct and whether the air is sufficiently pure.
The standard also defines the typical values of CO2 concentration in the outdoor air:
  • 350 [ppm] for rural areas;
  • 400 [ppm] for small towns;
  • 450 [ppm] for urban centers.
  • 400 [ppm] as CO2,o reference value and at least a level II of air quality are considered. Consequently, the CO2 concentration limit is fixed at 900 [ppm].
For ILQ evaluation, the main standard is EN 12464-1:2011 which defines the minimum required levels of illuminance (lux minimum) to carry out specific indoor activities. For writing, reading and data processing, the main activities performed in the office where the experimentation was conducted, the minimum illuminance value admitted is 500 lx. (tagged as “Limit” in Figure 3).

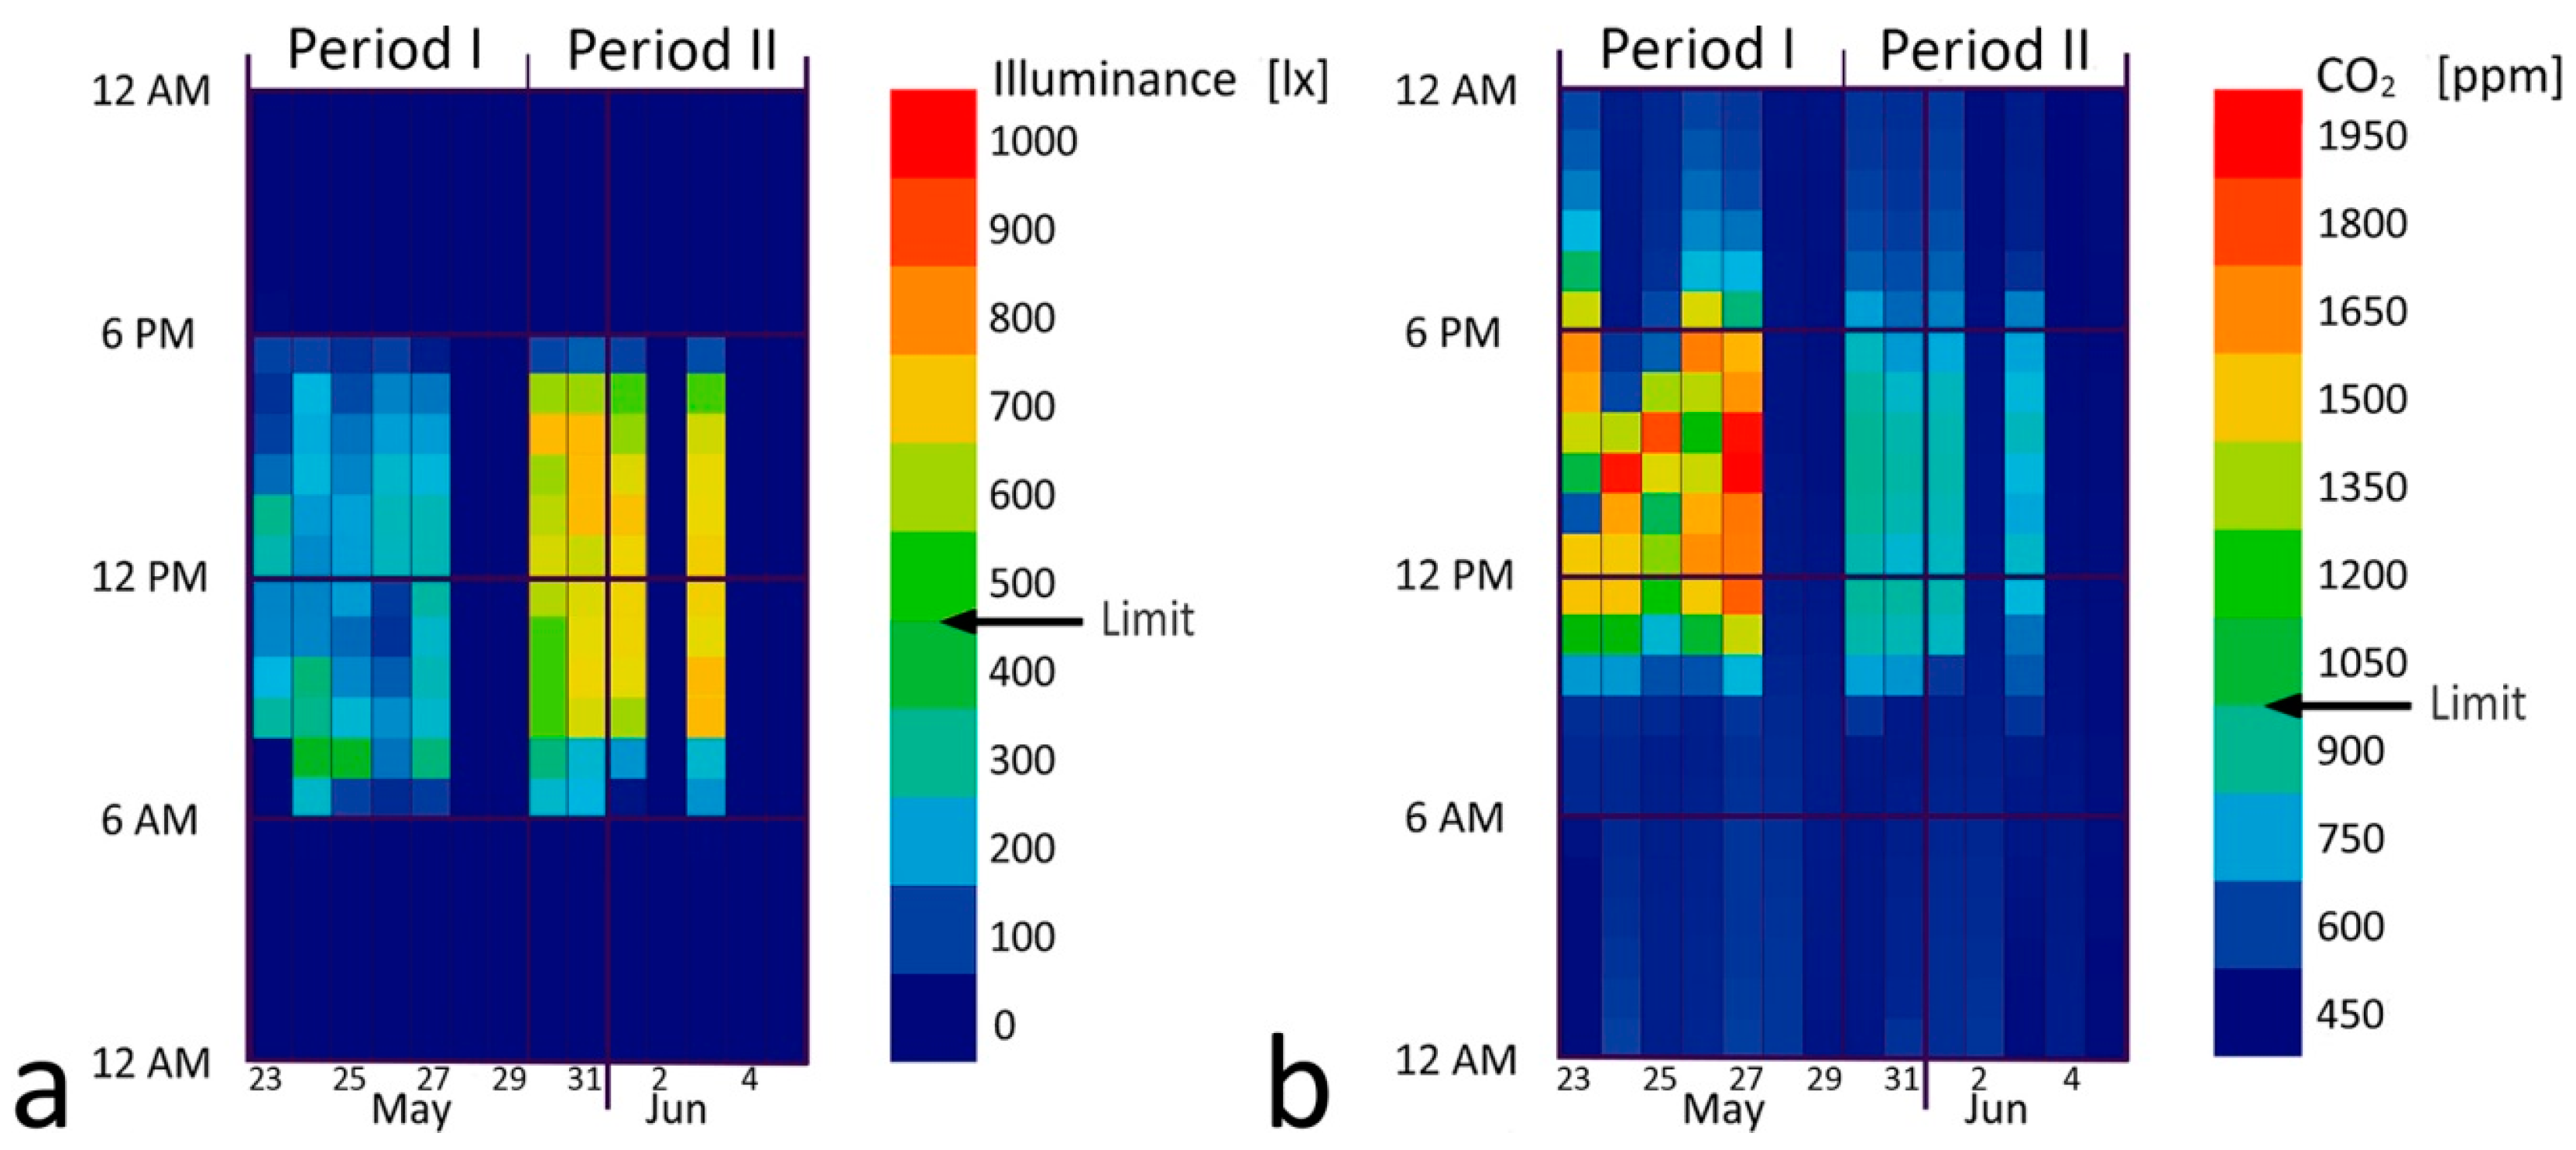
4. Experimentation Results

The levels of ILQ and IAQ for the considered workplaces were assessed. The experimentation lasted 2 weeks and was divided into two periods: period I between 23 May and 27 May 2016, with manual control of lighting system and air exchange and period II between 30 May and 3 June 2016 with automatic control provided by the developed system.
Figure 3a graphically represents the hourly average values of illuminance while Figure 3b shows the hourly average values of the CO2 concentration. The 28–29 May and 4–5 June (periods) correspond to Saturday and Sunday, while 2 June is an Italian national holiday (Italian Republic Day). It can be noted that the levels of illumination for the first 5 days of the first period are below the minimum level (500 lux, “limit” in Figure 3a) required by the national standard for activities related to writing, reading, typing and data processing. In the second case, the situation changes and on all the days when the station was occupied the daily average value is above the minimum value.
In the first period, on the left, 0% of the hourly average values is higher than the limit of 500 lx between 9 a.m. and 5 p.m. In the second period, on the right, 100% of the values is greater than the minimum value (Figure 3a).
The analysis of CO2 concentration (Figure 3b) shows a marked improvement after the adoption of the nearable control system: in period I, during working hours, hourly average values with maximum values close to 2000 ppm were recorded, in any case higher than the 900 ppm limit, with high range of excursion; in period II, the level of CO2 concentration in the air was maintained below the threshold value with small variations over the time.

5. Conclusions

The developed system demonstrates that a nearable system designed and implemented starting from the maker movement philosophy and DIY approach is suitable to ensure good levels of both IAQ and ILQ. The analysis conducted so far demonstrates how it is possible to optimally manage the indoor environmental comfort using some electronic components and a 3D printer. The potential of this basic device is confirmed by tests in real working conditions. The characteristics so far described and analysed allow for a wide field of application aimed at improving users’ satisfaction in indoor environments.

Author Contributions

The work presented in this paper is a collaborative development by all of the authors.

Acknowledgments

This work has been supported within the Framework Agreement between the Lombardy Region and National Research Council of Italy (CNR).

Conflicts of Interest

The authors declare no conflict of interest.

References

  1. Nearable Definition. Available online: https://en.wikipedia.org/wiki/Nearables#cite_note-1 (accessed on 24 August 2015).
  2. Salamone, F.; Belussi, L.; Danza, L.; Ghellere, M.; Meroni, I. An Open Source “Smart Lamp” for the Optimization of Plant Systems and Thermal Comfort of Offices. Sensors 2016, 16, 338. [Google Scholar] [CrossRef] [PubMed]
  3. Construction Technologies Institute of the National Research Council of Italy (ITC-CNR). Available online: http://www.itc.cnr.it/ (accessed on 24 August 2015).
  4. Anderson, C. The New Industrial Revolution; Crown Business: New York, NY, USA, 2010. [Google Scholar]
  5. Gershenfeld, N. How to make almost anything. Foreign Aff. 2012, 91, 43–57. [Google Scholar]
  6. Hatch, M. The Maker Movement Manifesto; McGraw-Hill Education: Columbus, OH, USA, 2014. [Google Scholar]
  7. Salamone, F.; Belussi, L.; Danza, L.; Ghellere, M.; Meroni, I. Design and Development of nEMoS, an All-in-One, Low-Cost, Web-Connected and 3D-Printed Device for Environmental Analysis. Sensors 2015, 15, 13012–13027. [Google Scholar] [CrossRef] [PubMed]
  8. Ray, P.P. Internet of Things Cloud Enabled MISSENARD Index Measurement for Indoor Occupants. Measurement 2016, 92, 157–165. [Google Scholar] [CrossRef]
  9. Salamone, F.; Belussi, L.; Danza, L.; Ghellere, M.; Meroni, I. An Open Source Low-Cost Wireless Control System for a Forced Circulation Solar Plant. Sensors 2015, 15, 27990–28004. [Google Scholar] [CrossRef] [PubMed]
  10. Morón, C.; Díaz, J.P.; Ferrández, D.; Ramos, M.P. Mechatronic Prototype of Parabolic Solar Tracker. Sensors 2016, 16, 882. [Google Scholar] [CrossRef] [PubMed]
  11. ODocs Eye Care. Available online: http://www.odocs-tech.com/ (accessed on 24 August 2015).
  12. Open Biomediacl Initiative. Available online: http://www.openbiomedical.org/ (accessed on 24 August 2015).
  13. Faludi, R. Building Wireless Sensor Networks: With ZigBee, XBee, Arduino, and Processing; O’Reilly Media, Inc.: Sebastopol, CA, USA, 2010. [Google Scholar]
  14. Alliance, Z. IEEE 802.15. 4, ZigBee Standard. 2009. Available online: http://www.zigbee.Org (accessed on 4 August 2016).
  15. Liu, X.; Chen, H.; Wang, M.; Chen, S. An XBee-Pro Based Energy Monitoring System. In Proceedings of the 2012 Australasian Telecommunication Networks and Applications Conference (ATNAC), Brisbane, Australia, 7–9 November 2012; pp. 1–6. [Google Scholar]
  16. Ai, Z.; Mak, C.; Cui, D. On-site measurements of ventilation performance and indoor air quality in naturally ventilated high-rise residential buildings in Hong Kong. Indoor Built Environ. 2013, 24, 214–224. [Google Scholar] [CrossRef]
Figure 1. Hardware layout in a real case study.
Proceedings 01 00011 g001
Figure 2. Installation in working conditions: (a) plan of the office; (b) workstation with smart lamp and sensors.
Proceedings 01 00011 g002
Figure 3. Hourly average data for manual control (period I, 23–29 May) and automatic control (period II, 30 May–5 June): (a) illuminance level; (b) CO2 concentration.
Proceedings 01 00011 g003
Table 1. XBee modules configuration.
ZigBee End Device ATZigBee API Coordinator
SH: 0013A200SH: 0013A200
SL: 40BF9952SL: 40C143E8
PAN ID 1984PAN ID 1984
MY: 5ECAMY: 5ECA
BAUD rate 9600BAUD rate 9600
DH: 13A200DH: 0013A200
DL:40C143E8DL: 40BF9952
D3(17) Digital out, low [4]
D2(18) Digital out, low [4]
Table 2. Levels of air quality as a function of the indoor-outdoor difference in CO2 concentration.
LevelCO2,i–CO2,o [ppm]
I350
II500
III800
IV>800
Publisher’s Note: MDPI stays neutral with regard to jurisdictional claims in published maps and institutional affiliations.

