


Quantification of Blade Vibration Amplitude in Turbomachinery †

Univ Lyon, Ecole Centrale de Lyon, CNRS, Univ. Claude Bernard Lyon 1, INSA Lyon, LMFA, UMR 5509, 69134 Ecully, France
*
Author to whom correspondence should be addressed.
†
This paper is an extended version of our paper published in the conference proceedings of the XXVI Biennial Symposium on Measuring Techniques in Turbomachinery held in Pisa, Italy, 28–30 September 2022.
Int. J. Turbomach. Propuls. Power 2024, 9(1), 10; https://doi.org/10.3390/ijtpp9010010
Submission received: 4 July 2023
/
Revised: 24 October 2023
/
Accepted: 9 February 2024
/
Published: 4 March 2024
(This article belongs to the Special Issue Selected Papers from the XXVI Biennial Symposium on Measuring Techniques in Turbomachinery)
Abstract
:Experimental monitoring of blade vibration in turbomachinery is typically based on blade-mounted strain gauges. Their signals are used to derive vibration amplitudes which are compared to modal scope limits, including a safety factor. According to industrial guidelines, this factor is chosen conservatively to ensure safe operation of the machine. Within the experimental campaign with the open-test-case composite fan ECL5/CATANA, which is representative for modern lightweight Ultra High Bypass Ratio (UHBR) architectures, measurements close to the stability limit have been conducted. Investigation of phenomena like non-synchronous vibrations (NSV) and rotating stall require a close approach to the stability limit and hence demand for accurate (real-time) quantification of vibration amplitudes to ensure secure operation without exhaustive safety margins. Historically, short-time Fourier transforms of vibration sensors are used, but the complex nature of the mentioned coupled phenomena has an influence on amplitude accuracy, depending on evaluation parameters, as presented in a previous study using fast-response wall-pressure transducers. The present study investigates the sensitivity of blade vibration data to evaluation parameters for different spectral analysis methods and provides guidelines for fast and robust surveillance of critical vibration modes.

1. Introduction
Within the European project CATANA, experiments with the open-test-case fan ECL5 (see [1,2]) close to its stability limit are conducted to investigate aerodynamic and aeroelastic phenomena like flutter, non-synchronous vibration (NSV), and stall. In modern fan designs, these phenomena lead to rapidly rising blade vibration and blade failure entailing that operation close to those regions is extremely safety critical.
The established testing procedures for such measurements follow industrial guidelines, which result in conservative safety limits. These limits ensure the structural integrity of the machinery during operation and account for potential inaccuracies in measurement and evaluation methods. However, extensive safety margins prevent anticipated measurements like Particle Image Velocimetry (PIV) since they require machine stabilization close to the stability limit. Thus, established procedures need to be revised.
To prevent blade failure during operation, it is crucial to experimentally monitor blade vibration. This has been a common practice since the early 1950s, involving the use of blade-mounted strain gauges [3,4,5]. Signals from the gauges are transmitted to the stationary reference frame via slip rings or telemetry and spectral analysis methods are applied to allow for real-time monitoring of vibration frequencies and amplitudes as well as their comparison to predefined scope limits.
These scope limits are determined for all relevant eigenmodes (typically for the first six eigenmodes as their frequencies are relatively low) based on a Goodman diagram for the used carbon-fiber composite material. The Goodman diagram is defined by two points, the maximum static stress (only midrange stress, no alternating stress) and the high cycle fatigue (HCF) limit (no mean/static stress, only alternating stress), which are connected linearly to cover each loading case of superposed static and alternating stresses. Values for both of these points are material, i.e., component-related parameters and are provided by the manufacturer. To determine the HCF limit, constant amplitude fatigue tests with 107 loading cycles (without static loading) are performed with fabricated blades. Using Finite Element Method (FEM) calculations, it is possible to determine the maximum allowed stress for each blade eigenmode based on the Goodman diagram with the static loading at design conditions [6]. Based on modal solutions (displacement, strain, stress) from FEM calculations described in [2], blade vibration amplitudes given in micro-strain (m) can be related to blade stresses and presented relative to the critical stress (maximum allowed stress divided by safety factor), i.e., in percent scope limit.
For ECL5 experiments, it is necessary to minimize the safety factor typically considered during scope limit calculation. At the same time, it has to be ensured that calculated spectral amplitudes are independent from chosen method parameters to allow for correct assessment of blade stresses and safe operation.
An experimental investigation of a composite transonic fan, similar to the ECL5 rotor conducted by Brandstetter et al. [7], revealed that spectral pressure amplitude decreases up to 50% if the short-time fast Fourier transform (ST-FFT) window size is increased from 5 to 25 rotor revolutions when approaching the stability limit. This behavior is related to non-harmonic disturbances and their impact on spectral analysis methods. While the results presented in [7] were mainly focusing on physical interpretation, such a dependency can lead to safety-critical underestimation of vibration levels in the case of vibration monitoring.
It is well known that Fourier transform (FT) has limitations when dealing with fluctuating signals with unsteady frequency content. Extant literature proposes the use of power spectral density (PSD) since its results are more robust against evaluation parameters such as window size (and hence frequency resolution) [8]. However, resulting spectra in the unit of Hz can not directly be compared to material scope limits. As demonstrated in this study, the advantage of PSD over FT disappears when spectra are converted into scope limit amplitudes.
This study presents the development of a robust spectral surveillance method for turbomachinery vibrations. It is based on the investigation of spectral analysis methods using real-engine test data and artificial signals to analyze sensitivity. The initial methodology was developed before the start of the ECL5 measurement campaign using experimental data of a similar transonic UHBR fan. In the present study, this methodology is applied to the newly available ECL5 measurement data, hence proving that configuration-specific amplitude correction approaches are useful and can be generalized (calibrated) for specific architectures.
This paper contains the following sections:
- brief introduction of experimental setup and test procedure
- summary of the mathematical description of spectral analysis methods
- review of the influence of frequency resolution on FT and PSD and problem formulation
- sensitivity analysis based on artificial signals
- derivation and application of correction approach
- summary and propositon of guideline for vibration monitoring
This manuscript is an extended version of the paper published in the conference proceedings of the XXVI Biennial Symposium on Measuring Techniques in Turbomachinery held in Pisa, Italy, 28–30 September 2022 [9].
2. Test Facility ECL-B3
The test facility ECL-B3 depicted in Figure 1 was collaboratively designed and constructed by Ecole Centrale de Lyon (ECL) and Safran Aircraft Engines (Safran AE) as part of the ANR- EQUIPEX program. The facility serves as a platform for investigations of fan architectures that are representative of modern UHBR stages at scales around 1:4.
The measurements discussed in this study were conducted within the CATANA project (http://catana.ec-lyon.fr/, accessed on 8 February 2024). The stage under consideration consists of a 16-bladed composite low-speed transonic fan with a relative design tip Mach number of 1.02 and 31 conventionally manufactured aluminum outlet guide vanes (OGV), designed at ECL [1,2]. The machine is placed in an anechoic chamber and operated in an open cycle. The intake is located on the roof of the building. Air enters the facility chamber through multiple rows of silencers before passing the single stream fan section (Figure 2) and the axisymmetric coned-shaped throttle, which is used to control the mass-flow rate. Through additional rows of silencers in the exhaust system, the air exits to atmosphere. A turbulence control screen (TCS) is installed in front of the fan section to ensure homogeneous inflow conditions and reduces turbulence [10].
2.1. Instrumentation
The machine core, hosting the single-stream fan stage as schematically shown in Figure 2, is instrumented with pressure and temperature sensors, distributed in various axial positions on hub, casing, and in rakes allowing for detailed performance quantification.
In addition to flush-mounted static pressure probes, miniature high-frequency-response wall pressure transducers (WPT, Kulite XCS-062) are placed in various axial and circumferential positions for the investigation of unsteady aerodynamics of the fan stage. Observation of structural vibrations, analyzed in detail in this study, is based on blade-mounted strain gauges on each rotor blade. Their signals are transferred from the rotating to the stationary frame of reference via telemetry. Within the CATANA project, strain gauge analysis was supported by a commercial capacitive tip timing system with sensors, acquisition, and evaluation provided by MTU [11].
2.2. Test Procedure
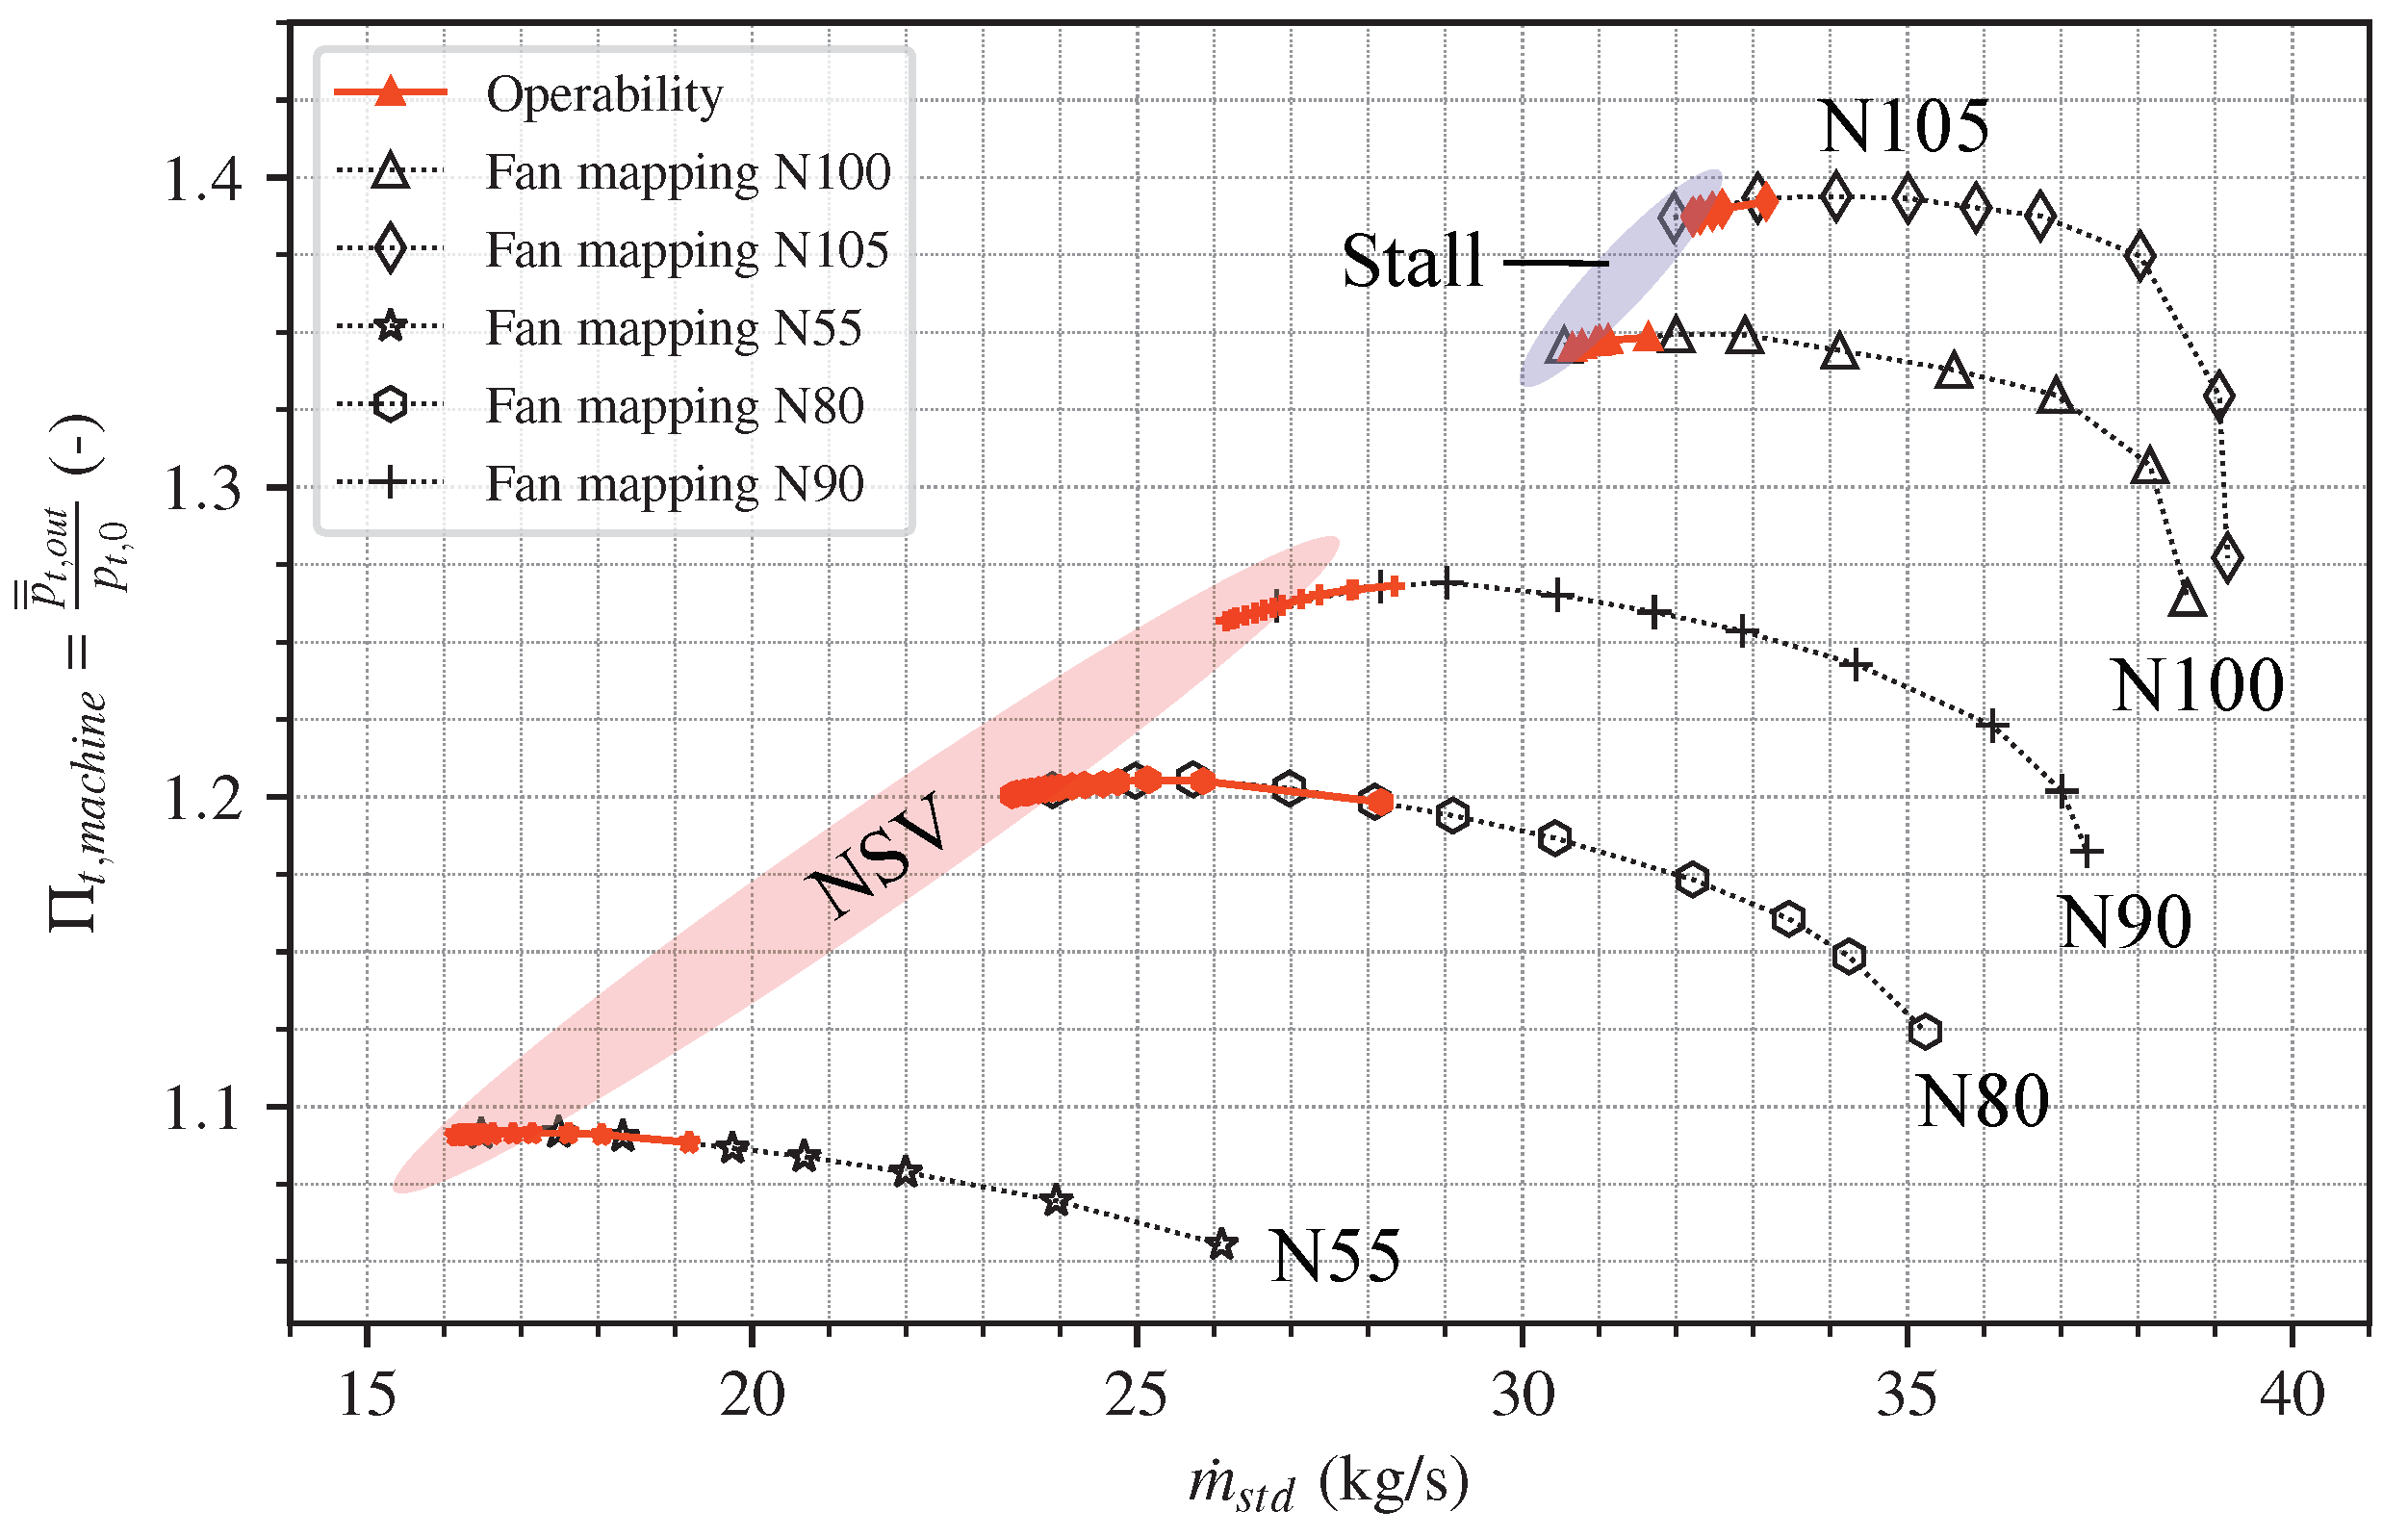
The first ECL5/CATANA test campaign with the tuned reference configuration consisted of two major procedures: the fan mapping measurements, with full traversals of rakes in the stage exit plane at stable operating conditions (black symbols in Figure 3), and so-called operability measurements during which the machine was continuously throttled towards/beyond the stability limit (red symbols in Figure 3), see [6,13] for details. Since rakes are not present during operability measurements to avoid pertubation of the downstream flow, machine performance is determined using total pressure measurements in the machine exit (out) and the facility chamber (0) for both maneuvers to allow for an adequate comparison.
For the present study, only operating points close to the stability limit and transient throttling maneuvers are of interest as vibration amplitudes are negligible for higher mass-flow rates. Operability measurements at 80% design speed (marked by red hexagons in Figure 3) have been chosen exemplarily to illustrate the developed methodology within this study. However, the presented methodology is transferable to all other operating conditions with significant vibration amplitudes.
At the 80% speed line, non-synchronous vibrations with continuously rising amplitudes have been encountered in experiments as the rotor was throttled towards low mass-flow rates [6]. To avoid blade failure, measurements need to be aborted when vibration levels reach critical values expressed by Finite Element Method (FEM) calculation-based modal scope limits requiring accurate amplitude determination for each interesting eigenmode.
3. Spectral Analysis Methodology
This section offers a brief review of spectral analysis methods utilized within this study to derive vibration signal frequency content and corresponding amplitudes. As demonstrated in subsequent sections, well-established procedures are not robust to specific parameters concerning calculated amplitudes.
The Fourier Transform (FT) of a continuous signal
is defined as
and provides information on the amplitude of each (positive and negative) frequency. Accordingly, the FT of a discrete time series with samples
is represented by
The total power of a signal can be calculated with
Applying Parseval’s Theorem
allows to express Equation (5) as a function of
The integrand of this equation is defined as the power spectral density
In analogy to the FT, the PSD is used to derive the energy distribution of a signal, i.e., the energy amount in a distinct frequency range. In contrast to FT amplitude, which conserves the unit of , PSD has a unit of Hz. As above, PSD can be defined for discrete time series according to
with the measurement sample number M going to infinity.
From Equation (7) and Parseval’s theorem Equation (6), the relation of total power and the root mean square value (RMS) of the original signal can be expressed as
This relation allows to calculate an RMS with the original unit based on the PSD method [14,15,16], which can be compared to the RMS value of the raw signal:
For pure sinusoidal signals, the ratio between the RMS amplitude and the actual amplitude of the signal is .
In practice, the analyzed measurement period T is always finite. Even for perfectly periodic functions like , this leads to spectra with non-zero values at frequencies other than , a phenomenon called spectral leakage. To mitigate this effect, a window function can be applied to the signal before calculation FT or PSD. Commonly used window functions have a value of 1 in the center of the time period of interest and decay towards the borders. In this study, a Hamming window in the discrete formulation given as
is used.
Window functions are additionally used to divide the entire measurement signal into multiple segments for individual analysis. This allows for the investigation of the frequency content of a signal and its evolution with time. It is hence more suitable for processes with non-stationary frequencies and amplitudes. One main characteristic of short-time FT (ST-FT and ST-PSD, respectively) is the uncertainty principle, stating that time and frequency resolution cannot be narrow at the same time. This relation becomes visible in the equations which are used to calculate the window size (in seconds) for a chosen bin width depending on the underlying sampling frequency
If a short time window is used, the resulting bin width is large and consequently, the frequency resolution of the corresponding spectrum is low [17,18].
4. Problem Statement
Window length is a parameter for ST-FFT calculation, which is used to divide the signal into equal segments before the transformation is applied. When utilized windows are longer, any stochastic or systematic variation of harmonic signal content leads to decreasing spectral amplitudes. This is illustrated in Figure 4, which presents the amplitudes of the first three eigenmodes based on ST-FFT calculation as a function of time of one representative blade-mounted strain gauge at 80% speed during NSV (shortly before measurement abortion). During the presented time period of 38 s mass-flow rate, i.e., throttle positions have been kept constant. However, ST-FFT-based eigenmode amplitudes corresponding to distinct frequencies present high fluctuations which are attributed to the underlying non-stationary excitation mechanism.
Two different window sizes, s and s are compared in Figure 4. According to Equation (13), they correspond to 16 and 4 Hz bin width, respectively. In both presented cases, an FFT window overlap of 75% together with a Hamming window was used (note, that overlap and window function have been varied systematically without significant changes of calculated amplitudes). The Fourier transformed signal of each 0.25 s period for the lower bin width of Hz presents a significantly reduced amplitude for all investigated blade eigenmodes. The ratio varies slightly for the investigated eigenmodes, from 1.7 for mode 1 and 3 to 2.1 for mode 2. A comparable ratio applies to the average value. This discrepancy is caused by vibration signals with varying frequencies and amplitudes.
This is obviously a severe problem, as the comparison to modal scope limits yields completely different levels of criticality. Especially for mode 2, a window size of 0.25 s results in approximately a 10% scope limit maximum while for quartered window size amplitudes, a criticality of up to 22% are observed.
However, these elevated amplitudes occur only sporadically during the presented measurement time. As constant amplitude loading is considered during HCF determination and within the Goodman approach it is quite difficult to compare those values to the variable amplitude blade vibration. A fair comparison would require the calculation of an equivalent criticality for example based on damage accumulation models such as Miner’s rule [19] or equivalent residual strength assumption models such as those summarized in [20]. For all these models, the exact shape of the fatigue-life curve (maximum stress over loading cycles, so-called S-N curve) has to be known and in most cases additional empirically determined model parameters are necessary to account for the complex nature of composite failure [21]. As material parameters are determined by the manufacturer, this data is not available and described methods are not practicable. Thus, the maximum blade amplitude observed during the analyzed time period is assumed to occur constantly in each vibration cycle. This assumption can be seen as a worst case scenario and is hence a conservative approximation of the real loading situation and can be interpreted as an additional safety factor.
Until today, industrial best practices are followed for the experimental surveillance of blade vibration, including window size of the ST-FFT. To enable the reduction in safety factors included in scope limits while ensuring safe machine operation, the sensitivity of such method parameters needs to be understood. Furthermore, this allows for transferability of the developed methodology to scaled geometries, novel architectures, etc.
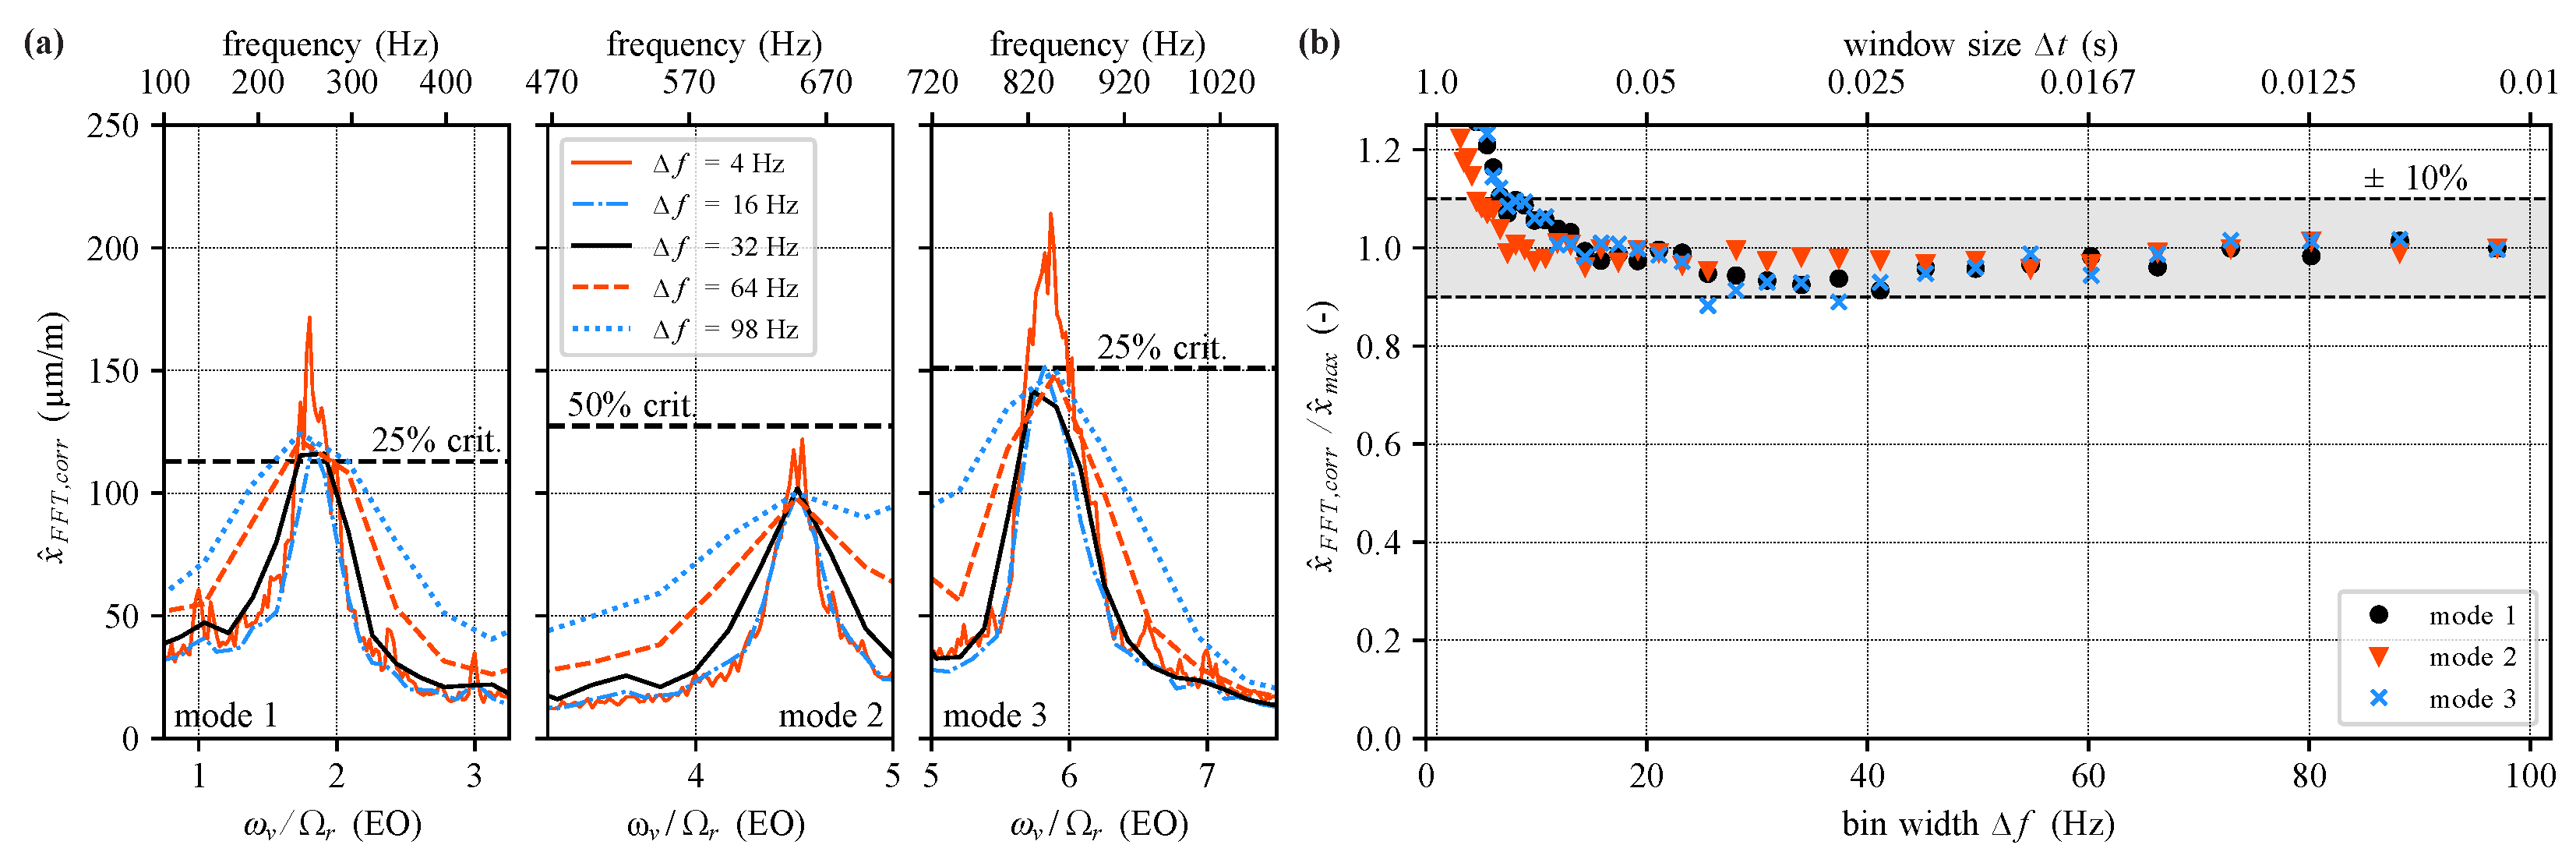
To analyze the influence of the window size on spectral amplitude estimation in more detail, Figure 5a shows the peak-spectrum for the measurement presented above, i.e., the maximum amplitude for each frequency bin in a total measurement time of 38 s, separated into windows with different lengths .
As described above, a strong dependency of spectral amplitude on chosen window length is recognized for the whole frequency range. As already mentioned, eigenmode vibration is highly unsteady even at stable operating conditions, resulting in temporally fluctuating vibration frequencies and amplitudes, thus preventing accurate calculation of spectral amplitudes.
For a small bin width of Hz (i.e., a high frequency resolution), multiple small peaks at integer engine order (EO) frequencies are visible in addition to the dominant peaks of the first three eigenmodes, which result from synchronous forcing as discussed in [10]. Additionally, all eigenmodes are subject to off-resonant excitation due to the presence of inlet distortions (see [10]), identifiable in the 4 Hz bin width spectrum by enlarged peak widths and the occurrence of multiple small peaks around the exact eigenfrequencies. The presence of such disturbances near the actual eigenmodes indicates the necessity of high frequency resolutions for proper physical interpretation of the analyzed spectra.
In contrast to 4 and 16 Hz bin width, higher bin widths provide only a coarse approximation of the spectrum. Amplitudes of narrowly spaced peaks are smudged and frequencies corresponding to maximum eigenmode amplitudes are shifted compared to the value obtained by high frequency resolution (i.e., low values of bin width ). So far, the real maximum amplitude is unknown, but as will be shown later in this study, spectral amplitude converges towards the real maximum amplitude for large bin widths.
Therefore, it is obviously impossible to determine a general window size, which allows for clear identification of phenomena and correct vibration amplitude at the same time.
To quantify the influence of frequency resolution on spectral amplitude, Figure 5b shows the evolution of peak amplitude for the first three eigenmodes as a function of spectral bin width . The peak amplitude of each eigenmode of each spectrum from bin width Hz to 98 Hz has been normalized with the respective maximum value for each eigenmode corresponding to a bin width of 98 Hz. In Figure 5b, a continuous evolution is visible, showing that for low bin widths the spectral amplitude drops significantly, but in a comparable way for all modes. For higher values, spectral amplitudes converge towards an asymptotic value. The similarity of the three curves indicates that amplitude correction is possible for a chosen window size and investigated eigenmode. This allows to combine the possibility of phenomenological interpretation (low bin width) with an accurate value of vibration amplitudes and hence to avoid exceeding the scope limits.
The results presented so far do not provide any information on whether the asymptotic value corresponds to the real maximum amplitude of the respective mode. This will be discussed in detail in Section 5.
According to the literature, the influence of window size is eliminated by the use of PSD instead of FFT. For the identical signal of 38 s as above, Figure 6a shows PSD spectra obtained with the same window sizes as before.
It is evident that maximum power densities and PSD peak widths are less dependent from chosen window size compared to FFT amplitudes, especially for presented intermediate bin widths 16, 32, and 64 Hz. Nevertheless, PSD still changes with frequency resolution of up to 60% within the analyzed bin width range. In agreement with the observations in Figure 5a for FFT, phenomenological interpretation of calculated PSD spectra is difficult for large bin widths due to peak smudging. Furthermore, power density is given in m2/m2Hz and can hence not directly be compared to modal scope limits given in the unit micro-strain (m/m).
Based on Equation (10), RMS values in micro-strain are obtained from PSD power densities (in micro-strain2/Hz) by integrating PSD over the frequency range and taking the square root of the result. In discrete cases, this is achieved by multiplying each density spectrum in Figure 6a with the corresponding frequency bin width to receive the RMS value for each frequency . To facilitate comparison with FFT spectra shown in Figure 5a, calculated RMS values are multiplied with to derive an approximation of peak amplitudes under the assumption of perfectly harmonic oscillation
The result of this procedure, i.e., PSD amplitude in micro-strain, is shown in Figure 6b for the same bin widths as before. It reveals the same dependence of spectral amplitude on bin width as observed for FFT amplitudes in Figure 5a. Thus, peak spectra calculation using PSD is not beneficial for vibration monitoring if comparison with material- and eigenmode-dependent scope limits is required.
5. Analysis of Artificial Signals
Figure 5b shows spectral peak amplitudes, which reach an asymptotic value for high values of , i.e., low frequency resolution . As stated in the previous section, it is unclear if the asymptotic value corresponds to the real maximum amplitude of the respective eigenmode. To allow for systematic parameter analysis, artificial signals with known amplitudes are studied in the following section.
5.1. Mass-Oscillator Model and System Identification
To approximate the vibratory behavior of the rotor blades, a forced single degree of freedom (SDOF) mass oscillator is used as presented in Figure 7 was simulated, using its differential equation
with stiffness k and viscous damping ratio d. Equation (15) can be expressed by means of natural frequency and damping ratio [22] using
Excitation of the system is applied through the force F
with amplitude and excitation frequency varying stochastically around their mean value according to a Gaussian normal distribution with standard deviation to represent the physical excitation mechanisms.
Model parameters are based on a system identification of the real blade vibration process. Frequency, amplitude, and modal damping of each interesting eigenmode have been determined using the transfer function for the SDOF system
which describes the system response to a given excitation in the frequency domain, where is the normalized stiffness of the system. This is possible because overall damping (comprised of material, i.e., within blades, mechanical, i.e., blade/disc contact, etc. and aerodynamic damping) is low for UHBR fan architectures as analyzed within this study, resulting in
Fitting Equation (18) to the 4 Hz bin width spectra (which are used as system response here) allows to determine and . As exemplarily shown in Figure 8a for the operating point used above, a peak spectrum from 10 successive FFT windows of s length each was used for the fit. This procedure was performed for each interval of s (FFT windows have an overlap of 75%) within a total of approximately 38 s measurement time at each operating point of the operability measurements at 80% design speed. This enables to determine averaged values as well as temporal standard deviation of eigenfrequency, maximum vibration amplitude (of the fit), and damping ratio from at least 60 intervals at each mass-flow rate.
Figure 8b provides exemplarily the evolution of these values over mass flow obtained for mode 2 for which the highest criticality was observed in Figure 4.
To simulate the vibration behavior close to the stability limit, values from the last six operating points, i.e., kg/s are averaged and used as input parameters for the SDOF model as summarized in Table 1. For those operating points, only marginal changes of averaged values and standard deviation of eigenfrequency f and damping ratio are observed in Figure 8b for mode 2, indicating constant system parameters despite constantly rising vibrations amplitudes. The same observation was made for mode 1 and mode 3.
The mean forcing frequency was chosen to be equal to the eigenfrequency of the system and its standard deviation was set to the measured standard deviation of the eigenfrequency in Figure 8b. In addition, forcing amplitude was varied by %, 5%, and 8%, respectively, according to the observed amplitude variation (i.e., temporal standard deviation of calculated FFT amplitude) close to the stability limit. Damping of the system is considered by mean value and corresponding standard deviation .
5.2. Influence of Bin Width
Integrating Equation (16) yields the displacement of the mass m (see Figure 9) for each of the simulated eigenmodes, which has been normalized with the respective maximum amplitude observed during the simulation time of 7 s. The histograms presented on the right-hand side of each signal show the normalized amplitude as a function of normalized counts , providing a Gauss distribution with a ratio of peak amplitude to RMS of approximately 4 in all cases. This ratio has been found to be independent from the simulation time of the SDOF model if at least 1800 oscillation cycles are covered, corresponding to 6.8 s for the mode 1 model with the lowest eigenfrequency. From the presented histrograms, it is evident that the forced vibration of the SDOF system is far from a perfectly harmonic signal (for which RMS is equal to ) and that only in % of all vibration periods the amplitude exceeds RMS . Note that the observed normalized amplitude distribution and the ratio /RMS of the SDOF model in Figure 9 is similar to those which can be obtained by bandpass filtering the strain gauge (raw) signals around the respective frequency for a given time period, confirming the utilization of a simple SDOF model to represent the blade vibration behavior. However, absolute RMS and peak amplitude values of bandpass filtered signals are (in contrast to the ratio of both values) strongly dependent on chosen filter parameters (i.e., bandpass width and filter order) and can thus not be used directly for peak amplitude quantification.
The signals generated with the SDOF model as shown on the left-hand side in Figure 9 can be treated in the same way as the signals of rotor strain gauges in the previous section to analyze the influence of bin width .
Figure 10a shows peak spectra (maximum amplitude for each frequency bin during a simulation time of 7 s) obtained by applying an FFT with varying window size to the signal of each mode. As the maximum vibration amplitude of the SDOF system is known from Figure 9, FFT spectra of each eigenmode are normalized with the individual respective maximum displacement .
In accordance with Figure 5, a strong dependence of calculated FFT amplitude on chosen bin width is observed in Figure 10a, resulting in increased spectral amplitudes for decreased window sizes . Figure 10a proves that spectral amplitudes calculated with short windows, i.e., large bin widths, are close to the real maximum vibration amplitude, while they are more than 65% too low if a bin width of 4 Hz is used. This influence of window size on calculated spectral amplitude is quite similar for the three simulated eigenmodes despite varying system parameters. Minor differences observed for intermediate bin widths are caused by different positions of the frequency bin centers compared to the exact eigenfrequency of the system. If the center of a frequency bin coincides with the exact eigenfrequency, the amplitude of the frequency is well represented, while a center that is located next to the exact eigenfrequency results in a distribution of peak amplitude into two bins and hence reduced spectral amplitude.
Note that PSD application to the SDOF signals (not shown here) gives similar results to those presented in Figure 6a,b for the real-engine strain gauge data. For the reasons discussed above, the PSD method is hence unsuitable for desired vibration monitoring.
To study the relation of window size and FFT amplitude in more detail, Figure 10b presents the FFT amplitude of the SDOF model as a function of bin width similar to Figure 5b. Here, spectral amplitude has been normalized with the individual real maximum displacement amplitude of the signal of each simulated mode (black/red cross in Figure 9). This normalization allows for direct assessment of the error of calculated spectral amplitude depending on the utilized FFT window size. From Figure 10b, it is clearly visible that the amplitude error decreases for increased bin width, yielding a minimum error of approximately 14% for a bin width of Hz. As asymptotic behavior of the relation spectral amplitude versus bin width is observed for all three simulated eigenmodes, further decreased window sizes do not result in a better amplitude estimation. In accordance with Figure 10a, Figure 10b proves the nearly identical influence of the FFT bin width on the spectral amplitudes despite varying SDOF model parameters.
5.3. Influence of Modal Damping and Excitation
In the case of the real-engine signals shown in Figure 5b, the influence of bin width seems to vary slightly depending on the investigated eigenmode. As the SDOF model allows to modify system parameters individually, the influence of the damping ratio and the excitation of the system F have been analyzed in detail to find an explanation for this variation.
It was observed that increasing the mean modal damping ratio results in spectral amplitude curves with reduced slope and decreased maximum spectral amplitudes for high bin widths. Hence, the error of calculated spectral amplitude compared to the correct maximum displacement increases with increased damping. Varying the standard deviation of modal damping from 50% to 200% of the values given in Table 1 indicates only marginal influence of this parameter on the system response.
An equivalent variation of system excitation parameters, namely standard deviation of forcing amplitude and standard deviation of forcing frequency , was performed with the result that their influence is smaller compared to . In addition, description of the effect of these parameters is more complicated as ambiguous results have been obtained for several variations. This might be a result of the underlying stochastic nature of the created signals.
The differences in estimated spectral amplitude between different eigenmodes observed in Figure 5b and Figure 10b must hence be considered as the result of the distinct combination of system parameters and cannot be attributed to a single system property.
However, Figure 10b confirms the assumption that a single parameter function might be useful to model the observed influence to allow for a correction of the calculated spectral amplitude depending on the chosen FFT window size.
6. Correction Approach
The results presented in the previous sections provide an identical trend (strong drop of calculated spectral amplitude for small and asymptotic behavior for large bin widths) for all investigated real-engine and SDOF cases, indicating that window size dependent correction of spectral amplitudes is a promising concept for dealing with the stated problem.
The function used to approximate the behavior shown in Figure 5b and Figure 10b
is based on a single curve-shape (correction) parameter a. The term b in front of the brackets is only necessary to ensure that the asymptotic value of is reached for Hz.
The shape parameter a is determined by fitting Equation (20) to the points shown in Figure 5b for each eigenmode (Figure 11a). As a similar asymptotic value of approximately 86% was observed for all three simulated eigenmodes in the SDOF case in Figure 10b, it is assumed that maximum spectral amplitudes in Figure 5b (used for normalization and thus equal to 1) correspond to 86% of the real maximum amplitude. Hence, real engine signal curves are scaled down to a value of 0.86 before application of the curve fit.
This procedure is repeated for all operating points of the operability measurements of the 80% speed line to analyze the evolution of correction parameter a over mass-flow rate as shown in Figure 11b. Due to stochastically varying vibration amplitudes, the relation between estimated spectral amplitude and chosen FFT window size changes slightly from one operating point to another resulting in different optimal shape parameters a for each mass-flow rate and eigenmode.
The approximation shown in Figure 11a is used to correct spectral amplitudes for a given bin width according to
for the eigenmodes under investigation.
7. Results and Discussion
Applying the correction Equations (20) and (21) with correction parameters a from Figure 11b to the three eigenmodes presented in Figure 5 yields the graphs shown in Figure 12. As correction parameters can only be determined for blade eigenfrequencies, the frequency ranges around each eigenmode have been corrected individually with the corresponding value for a, resulting in separated spectra for each eigenmode. Figure 12a provides consistent estimation of peak amplitude for all three eigenmodes independently from chosen FFT window size for all bin widths Hz. Amplitude is over-corrected only for the smallest bin width of Hz.
The real maximum vibration amplitude , which is necessary to evaluate spectral amplitude estimation after correction, is estimated using
based on the assumption that in accordance with the observations made in Figure 10b for the simulated SDOF system. The estimated maximum amplitude is used to normalize corrected spectral amplitudes in Figure 12b. This normalization confirms over-estimation of vibration amplitude by FFT for bin widths smaller than approximately 10 Hz, while they are robustly well-estimated within a range of ±10% for all greater bin widths. Especially for mode 2, which was the most critical during experiments, errors are lower than 5% for Hz. The over-correction of spectral amplitudes in the small bin width region results in a conservative amplitude estimation, which is much less dangerous during machine operation.
Figure 12 proves the applicability of the correction approach derived in this study. For all three eigenmodes, the error of estimated amplitude can be significantly reduced within the bin width range of interest 16 Hz 32 Hz from up to 55% in the uncorrected case to less than 10% after correction.
As correction parameter a remains in a distinct range over a wide range of mass-flow rates, an operating point far away from the stability limit might be chosen to determine the relation of spectral amplitude and window size and thus the value of a. Even if this might increase the error of corrected spectral amplitude estimation, the error with correction remains still small compared to the case without correction.
This allows to derive a clear guideline for correcting spectral amplitudes depending on desired frequency resolution and analyzed eigenmode, which can be summarized as follows:
- 1.
- Perform initial measurement at stable operating conditions, i.e., far away from the (expected) stability limit.
- 2.
- Determine amplitude evolution with different bin widths in post-processing and perform curve fit of Equation (20) to derive correction parameter a for each eigenmode of interest.
- 3.
- Apply correction according to Equation (21) with correction parameter a to correct spectral amplitude estimation depending on desired bin width and investigated eigenmode.
This correction approach allows for robust use of FFT window sizes in a range, which is suitable for online turbomachinery surveillance, but very sensitive due to the sharp slope in Figure 5b (Hz) and the absolute value which is underestimated by the order of 40–55% if uncorrected.
The dangerous implications of such an under-estimation of vibration amplitudes with the commonly used window sizes during operation becomes clear by comparing Figure 4 and Figure 12a. While uncorrected spectral amplitudes result in a criticality of maximum 22% for mode 2 (Hz), the corrected spectra reveal a maximum vibration amplitude of approximately 100 micro-strain corresponding to 41% of the previously determined modal scope limit. Hence, criticality is underestimated by nearly factor 2 if a bin width of 16 Hz is used for ST-FFT calculation and no amplitude correction is performed.
The guideline presented above enables determination of the correction parameter a far from the stability limit and thus the correction factor for the respectively chosen window size. This factor, once calculated at stable operating conditions using a post-processing routine, can then also be used for vibration online monitoring to ensure correct and real-time amplitude estimation. This allows to abort the experiments when vibration amplitude reaches critical values (for the experiments presented in this study, 50% criticality have been chosen as red limit for example) and therefore to avoid blade failure. Since the variable loading case with a given maximum amplitude is assumed as constant amplitude loading resulting in a conservative estimation of criticality, the value of 50% could be reduced in future measurements allowing for detailed investigation closer to the stability limit.
8. Conclusions
Blade vibration monitoring is mandatory during measurements to ensure structural integrity of the rotor and hence safe operation of the machine. During different measurement campaigns on the transonic fan test facility, a strong dependence of calculated spectral amplitudes (using FFT and PSD methods) on window length has been identified. This is related to vibration signals, which contain dominant frequencies related to eigenmodes, but are disturbed by temporal fluctuations caused by different phenomena (forced response, lock-in, etc.). For large window sizes , a high frequency resolution (i.e., small bin width) is achieved, but estimated vibrational amplitude is up to 90% lower compared to small window sizes for different eigenmodes. The exact relation between window size and spectral amplitude has shown to vary slightly depending on operating conditions and analyzed eigenmode.
Using a SDOF model, it was possible to show that the correct maximum amplitude of the signal is only captured by spectral methods if very short windows are used. Due to the uncertainty principle, they result in coarse spectra which prevent differentiation of narrowly spaced peaks and accurate determination of eigenfrequencies.
Therefore, a correction approach has been developed, which corrects calculated spectral amplitudes based on pre-selected window size and investigated eigenmode. This allows to use longer windows with the benefit of highly resolved spectra and reliable amplitude estimation at the same time, within a suitable range for transient turbomachinery experiments.
The proposed method allows for a more purposeful determination of safety factors, evaluation parameters, and a robust implementation. It has proven to be applicable to different machine configurations and operating conditions following the guidelines presented in this study.
Author Contributions
Conceptualization, A.P.S. and C.B.; methodology, A.P.S. and C.B.; software, A.P.S. and B.P.; validation, A.P.S. and C.B.; formal analysis, A.P.S.; investigation, A.P.S.; resources, B.P.; data curation, B.P.; writing—original draft preparation, A.P.S. and C.B.; writing—review and editing, A.P.S. and C.B.; visualization, A.P.S.; supervision, C.B. and X.O.; project administration, C.B. and X.O.; funding acquisition, C.B. and X.O. All authors have read and agreed to the published version of the manuscript.
Funding
The presented research was financed through the European Union’s Clean Sky 2 Joint Undertaking (JU) under grant agreement N864719, CATANA. The JU receives support from the European Union’s Horizon 2020 research and innovation program and the Clean Sky 2 JU members other than the Union. This paper reflects only the author’s view and the JU is not responsible for any use that may be made of the information it contains. Assessment of the test facility was enabled through financial support from Agence Nationale de la Recherche (ANR, Project d’EqupEx PHARE) and Conseil pour la Recherche Aeronautique Civile (CORAC—Programme CUMIN). Buildings and infrastructure were supported by ECL and instrumentation was supported by Institut Carnot (INGENIERIE@LYON—Project MERIT) and SAFRAN Aircraft Engines.
Institutional Review Board Statement
Not applicable.
Informed Consent Statement
Not applicable.
Data Availability Statement
The data presented in this study are available on request from the corresponding author.
Acknowledgments
The results presented in this paper rely on the contributions of a large research group and the authors gratefully acknowledge their excellent collaboration and support over the past five years. The authors particularly thank Pavel Teboul, Cedric Desbois, Sebastien Goguey, Gilbert Halter, Lionel Pierrard, Laurent Pouilloux, and Edouard Salze of LMFA, as well as Kevin Billon and Claude Gibert of LTDS for their support and contributions to the experiments. The authors recall that the development of the fan was conducted within the thesis of Valdo Pages and supervised by Stephane Aubert, Pascal Ferrand, and Pierre Duquesne from LMFA, as well as Laurent Blanc from LTDS. The final design was developed in close collaboration with Safran Aircraft Engines, and the authors particularly acknowledge the help of Laurent Jablonski. We are grateful for the continuous collaboration and financial support of SAFRAN Aircraft Engines since the beginning of this project and specifically for the present measurement campaign, for which the test module MARLYSA was provided by SAFRAN. For the tip-timing measurements, we received extensive support from Gerhard Ziller, Marco Hermann, and Simon Kytzia of MTU Aero Engines.
Conflicts of Interest
The authors declare no conflicts of interest.
References
- Brandstetter, C.; Pages, V.; Duquesne, P.; Ottavy, X.; Ferrand, P.; Aubert, S.; Blanc, L. UHBR open-test-case fan ECL5/CATANA, Part 1: Geometry and aerodynamic performance. In Proceedings of the 14th European Conference on Turbomachinery Fluid Dynamics & Thermodynamics, Virtual, 12–16 April 2021. [Google Scholar]
- Pages, V.; Duquesne, P.; Ottavy, X.; Ferrand, P.; Aubert, S.; Blanc, L.; Brandstetter, C. UHBR open-test-case fan ECL5/CATANA, Part 2: Mechanical and aeroelastic stability analysis. In Proceedings of the 14th European Conference on Turbomachinery Fluid Dynamics & Thermodynamics, Virtual, 12–16 April 2021. [Google Scholar]
- Russell, J.G. Wake Survey and Straingauge Measurements on an Inclined Propeller in the RAE 24 ft. Tunnel. Part 1: Wake Survey; The Stationery Office: London, UK, 1953; Available online: https://reports.aerade.cranfield.ac.uk/handle/1826.2/130 (accessed on 8 February 2024).
- Drew, D.A. Developments in methods of measuring stresses in compressor and turbine blades on test bed and in flight. Proc. Inst. Mech. Eng. 1958, 179, 320–359. [Google Scholar] [CrossRef]
- Hohenberg, R. Detection and study of compressor-blade vibration. Exp. Mech. 1967, 7, 19A–24A. [Google Scholar] [CrossRef]
- Fiquet, A.L.; Schneider, A.; Paoletti, B.; Ottavy, X.; Brandstetter, C. Experiments on Tuned UHBR Open-Test-Case Fan ECL5/CATANA: Stability Limit. J. Eng. Gas Turbines Power 2023, 1–2. [Google Scholar] [CrossRef]
- Brandstetter, C.; Ottavy, X.; Paoletti, B.; Stapelfeldt, S. Interpretation of stall precursor signatures. J. Turbomach. 2021, 143, 13. [Google Scholar] [CrossRef]
- Siemens. What is a Power Spectral Density (PSD)? 2020. Available online: https://community.sw.siemens.com/s/article/what-is-a-power-spectral-density-psd (accessed on 8 February 2024).
- Schneider, A.P.; Paoletti, B.; Ottavy, X.; Brandstetter, C. Experimental monitoring of vibrations and the problem of amplitude quantification. In Proceedings of the XXVI Biennial Symposium on Measuring Techniques in Turbomachinery, Pisa, Italy, 28–30 September 2022. [Google Scholar] [CrossRef]
- Schneider, A.; Paoletti, B.; Ottavy, X.; Brandstetter, C. Influence of a Turbulence Control Screen on the Aerodynamic and Aeroelastic Behavior of a UHBR Fan. In Proceedings of the ASME Turbo Expo 2022: Turbomachinery Technical Conference and Exposition, Rotterdam, The Netherlands, 13–17 June 2022. [Google Scholar]
- Zielinski, M.; Ziller, G. Noncontact Vibration Measurements on Compressor Rotor Blades. Meas. Sci. Technol. 2000, 11, 847–856. [Google Scholar] [CrossRef]
- Brandstetter, C.; Pages, V.; Duquesne, P.; Paoletti, B.; Aubert, S.; Ottavy, X. Project PHARE-2: A High-Speed UHBR Fan Test Facility for a New Open-Test Case. J. Turbomach. 2019, 141, 101004. [Google Scholar] [CrossRef]
- Schneider, A.; Fiquet, A.L.; Paoletti, B.; Ottavy, X.; Brandstetter, C. Experiments on Tuned UHBR Open-Test-Case Fan ECL5/CATANA: Performance and Aerodynamics. In Proceedings of the ASME Turbo Expo 2023: Turbomachinery Technical Conference and Exposition, Boston, MA, USA, 26–30 June 2023. [Google Scholar]
- Butz, T. Fourier Transformation for Pedestrians; Springer: Berlin/Heidelberg, Germany, 2015. [Google Scholar]
- Stoica, P.; Moses, R.; Randolph, L. Spectral Analysis of Signals; Pearson: Prentice Hall, NJ, USA, 2005. [Google Scholar]
- Alessio, S.M. Digital Signal Processing and Spectral Analysis for Scientists: Concepts and Applications; Springer: Berlin/Heidelberg, Germany, 2015. [Google Scholar]
- Cohen, L. Time-Frequency Analysis; Pearson: Prentice Hall, NJ, USA, 1995. [Google Scholar]
- Neubauer, A. DFT-Diskrete Fourier-Transformation: Elementare Einführung; Springer: Berlin/Heidelberg, Germany, 2012. [Google Scholar]
- Miner, M.A. Cumulative damage in fatigue. J. Appl. Mech. 1945, 12, A159–A164. [Google Scholar] [CrossRef]
- Post, N.L.; Case, S.W.; Lesko, J.J. Modeling the variable amplitude fatigue of composite materials: A review and evaluation of the state of the art for spectrum loading. Int. J. Fatigue 2008, 30, 2064–2086. [Google Scholar] [CrossRef]
- D’Amore, A.; Grassia, L. A method to predict the fatigue life and the residual strength of composite materials subjected to variable amplitude (VA) loadings. Compos. Struct. 2019, 228, 111338. [Google Scholar] [CrossRef]
- Mukhopadhyay, M. Structural Dynamics: Vibrations and Systems; Springer Nature: Berlin/Heidelberg, Germany, 2021. [Google Scholar]
Figure 1.
Schematic view of ECL-B3 test facility.
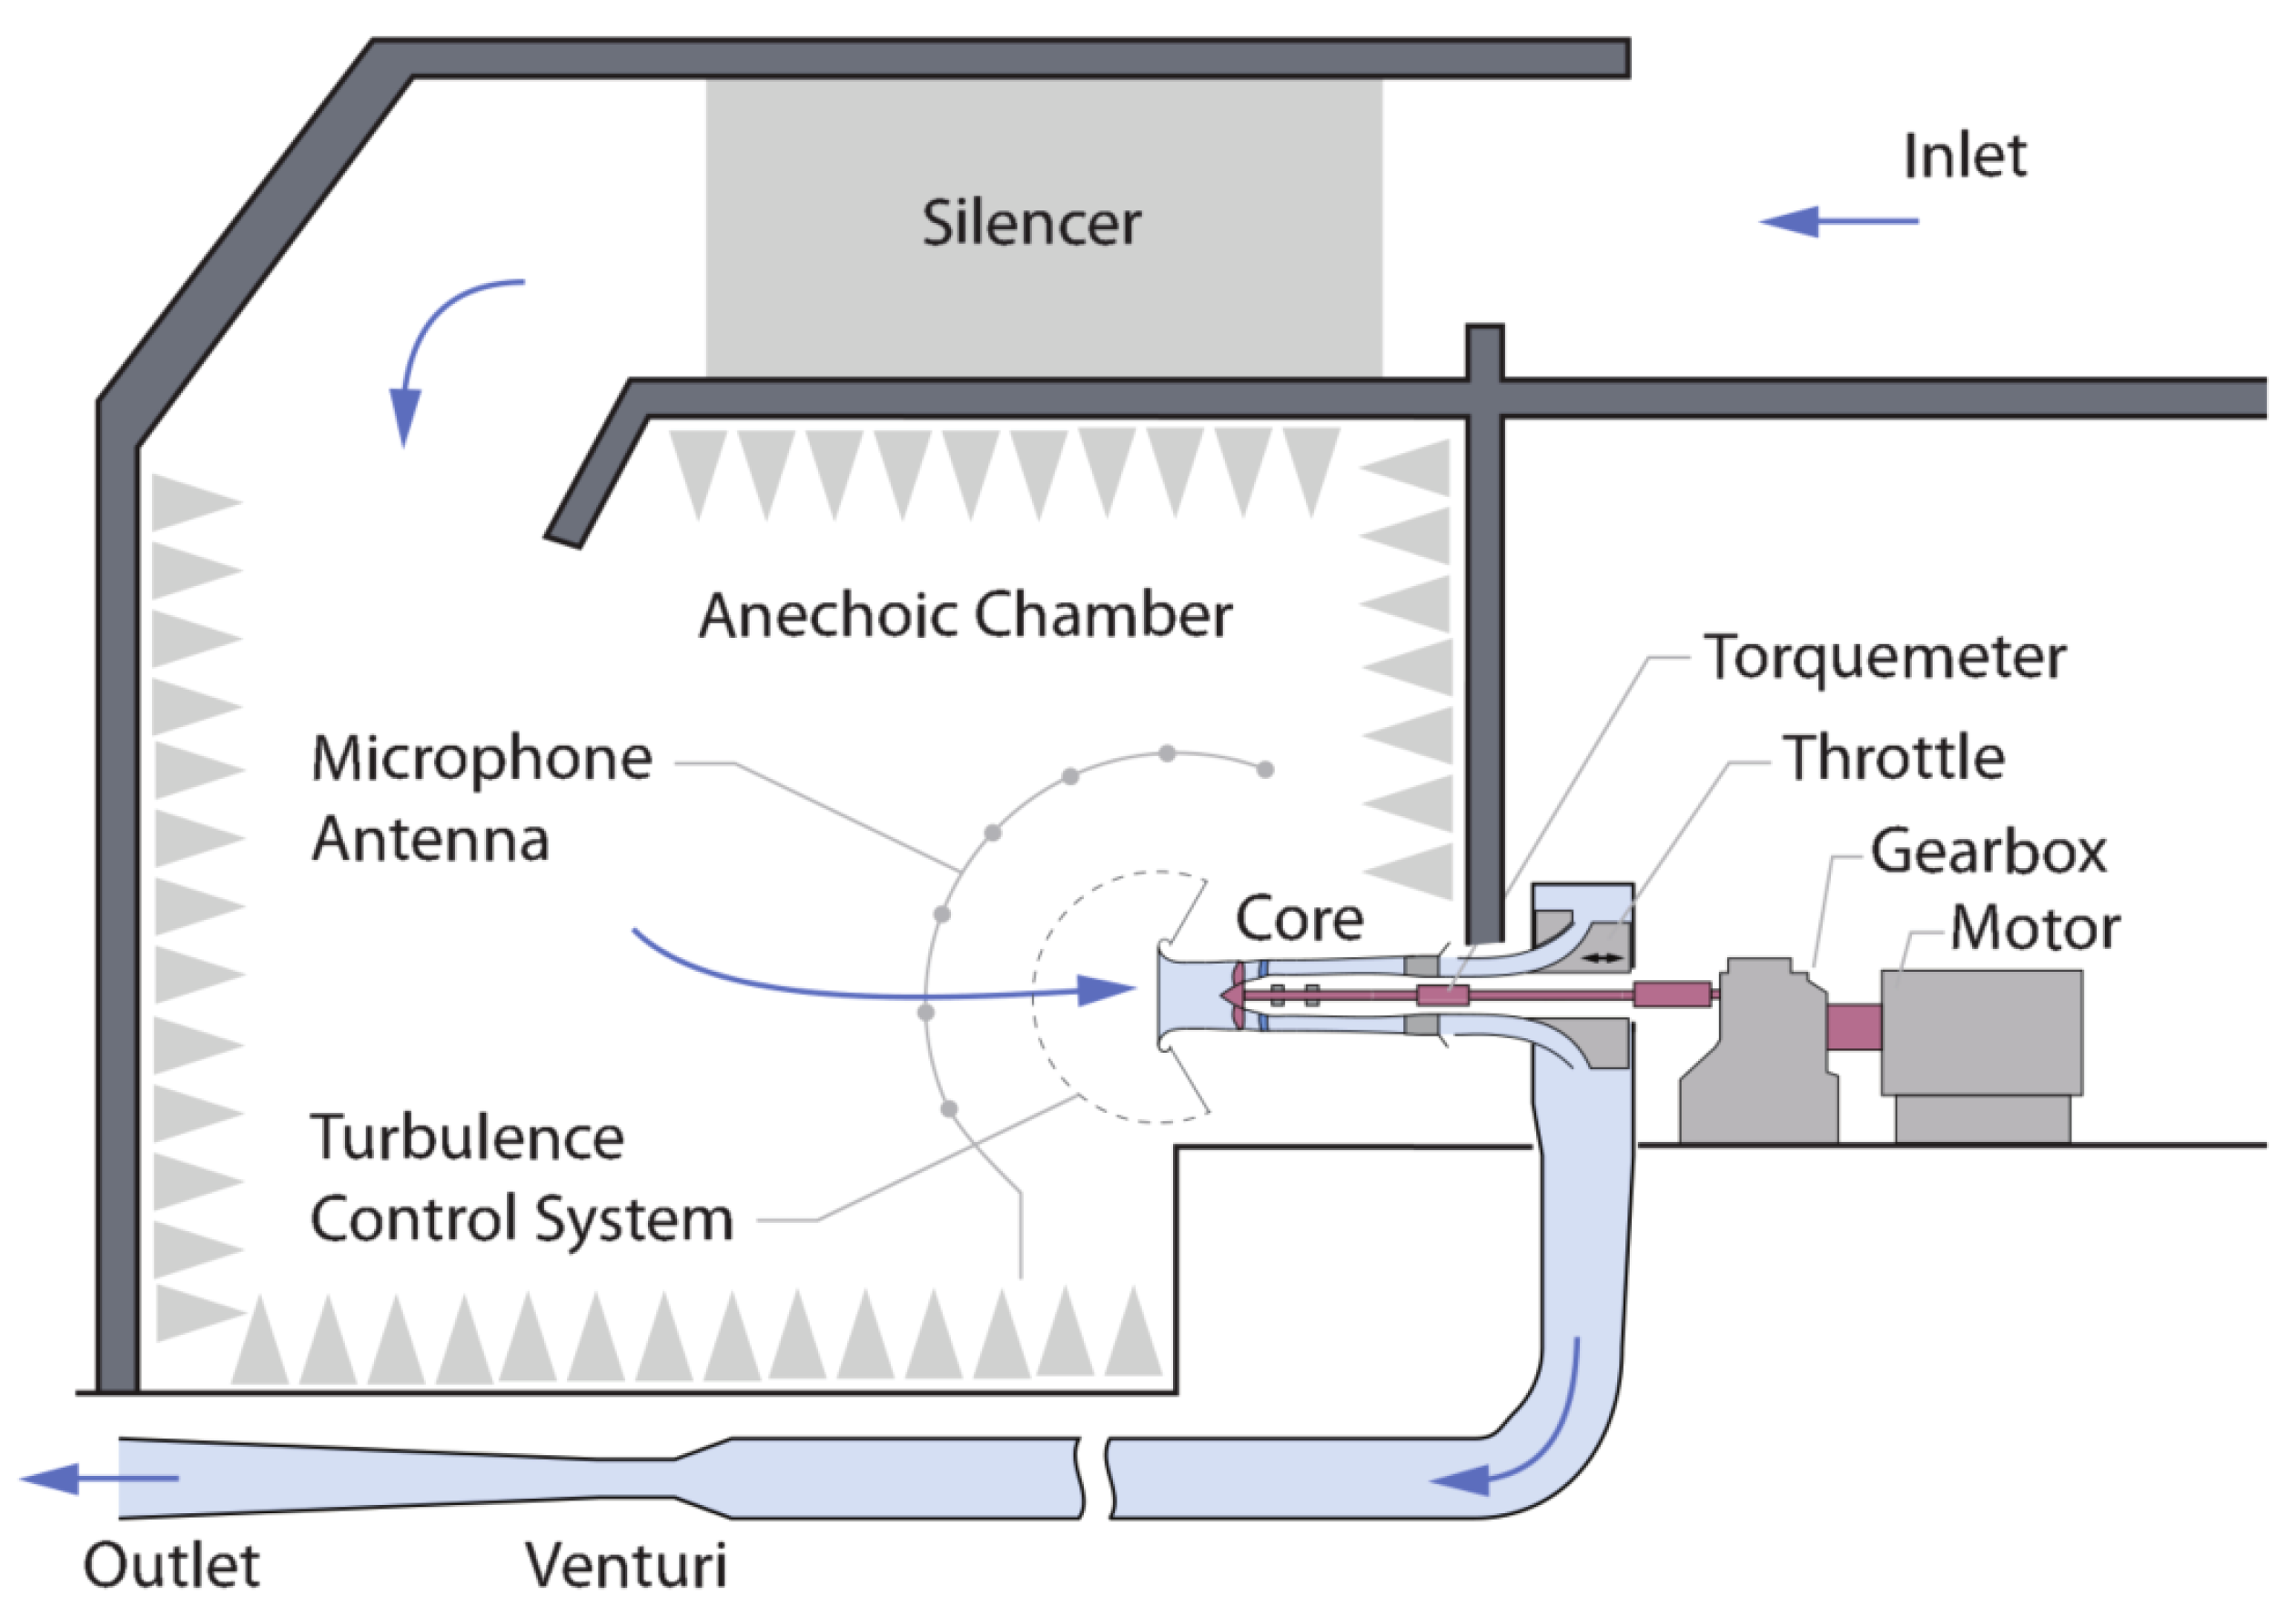
Figure 2.
Schematic view of the machine core and probe positions.
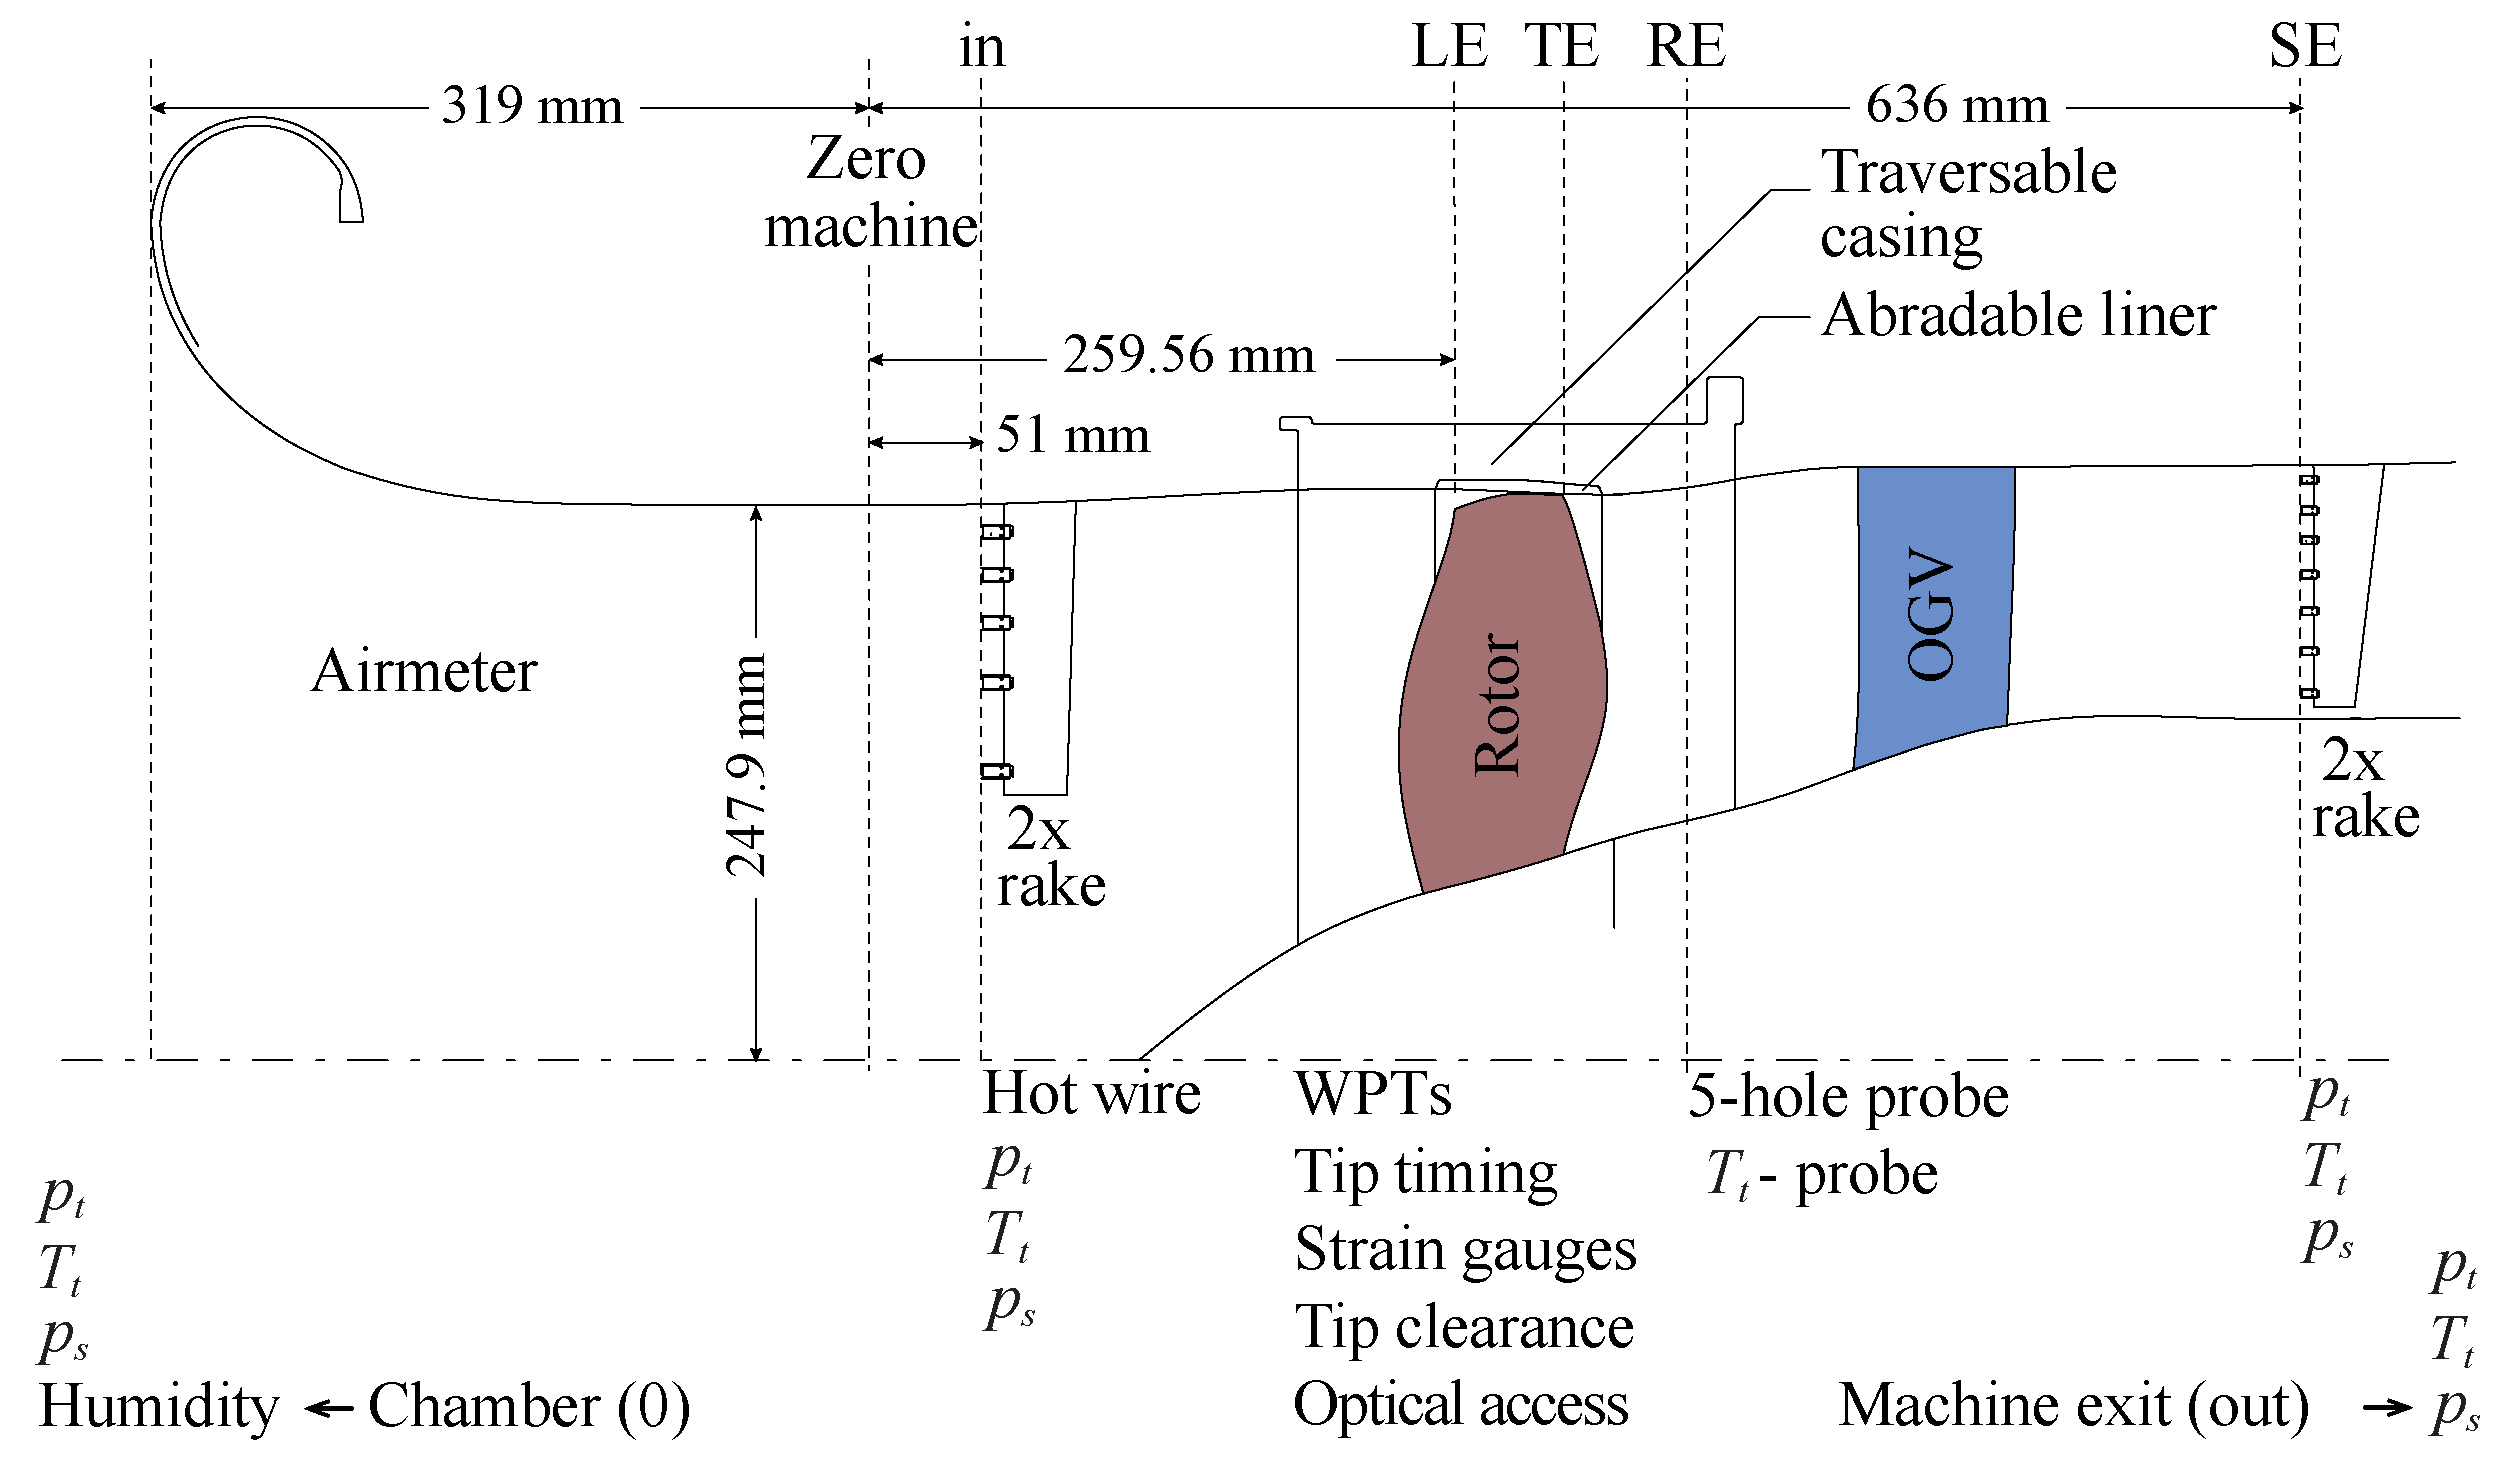
Figure 3.
Machine total pressure ratio from fan mapping (black) and operability measurements (red).

Figure 4.
ST-FFT-based amplitude of blade-mounted strain gauge of first three eigenmodes over time for different bin widths .
Figure 4.
ST-FFT-based amplitude of blade-mounted strain gauge of first three eigenmodes over time for different bin widths .

Figure 5.
(a) FFT spectra of blade-mounted strain gauge for different bin widths . (b) Maximum FFT amplitude as a function of bin width .
Figure 5.
(a) FFT spectra of blade-mounted strain gauge for different bin widths . (b) Maximum FFT amplitude as a function of bin width .
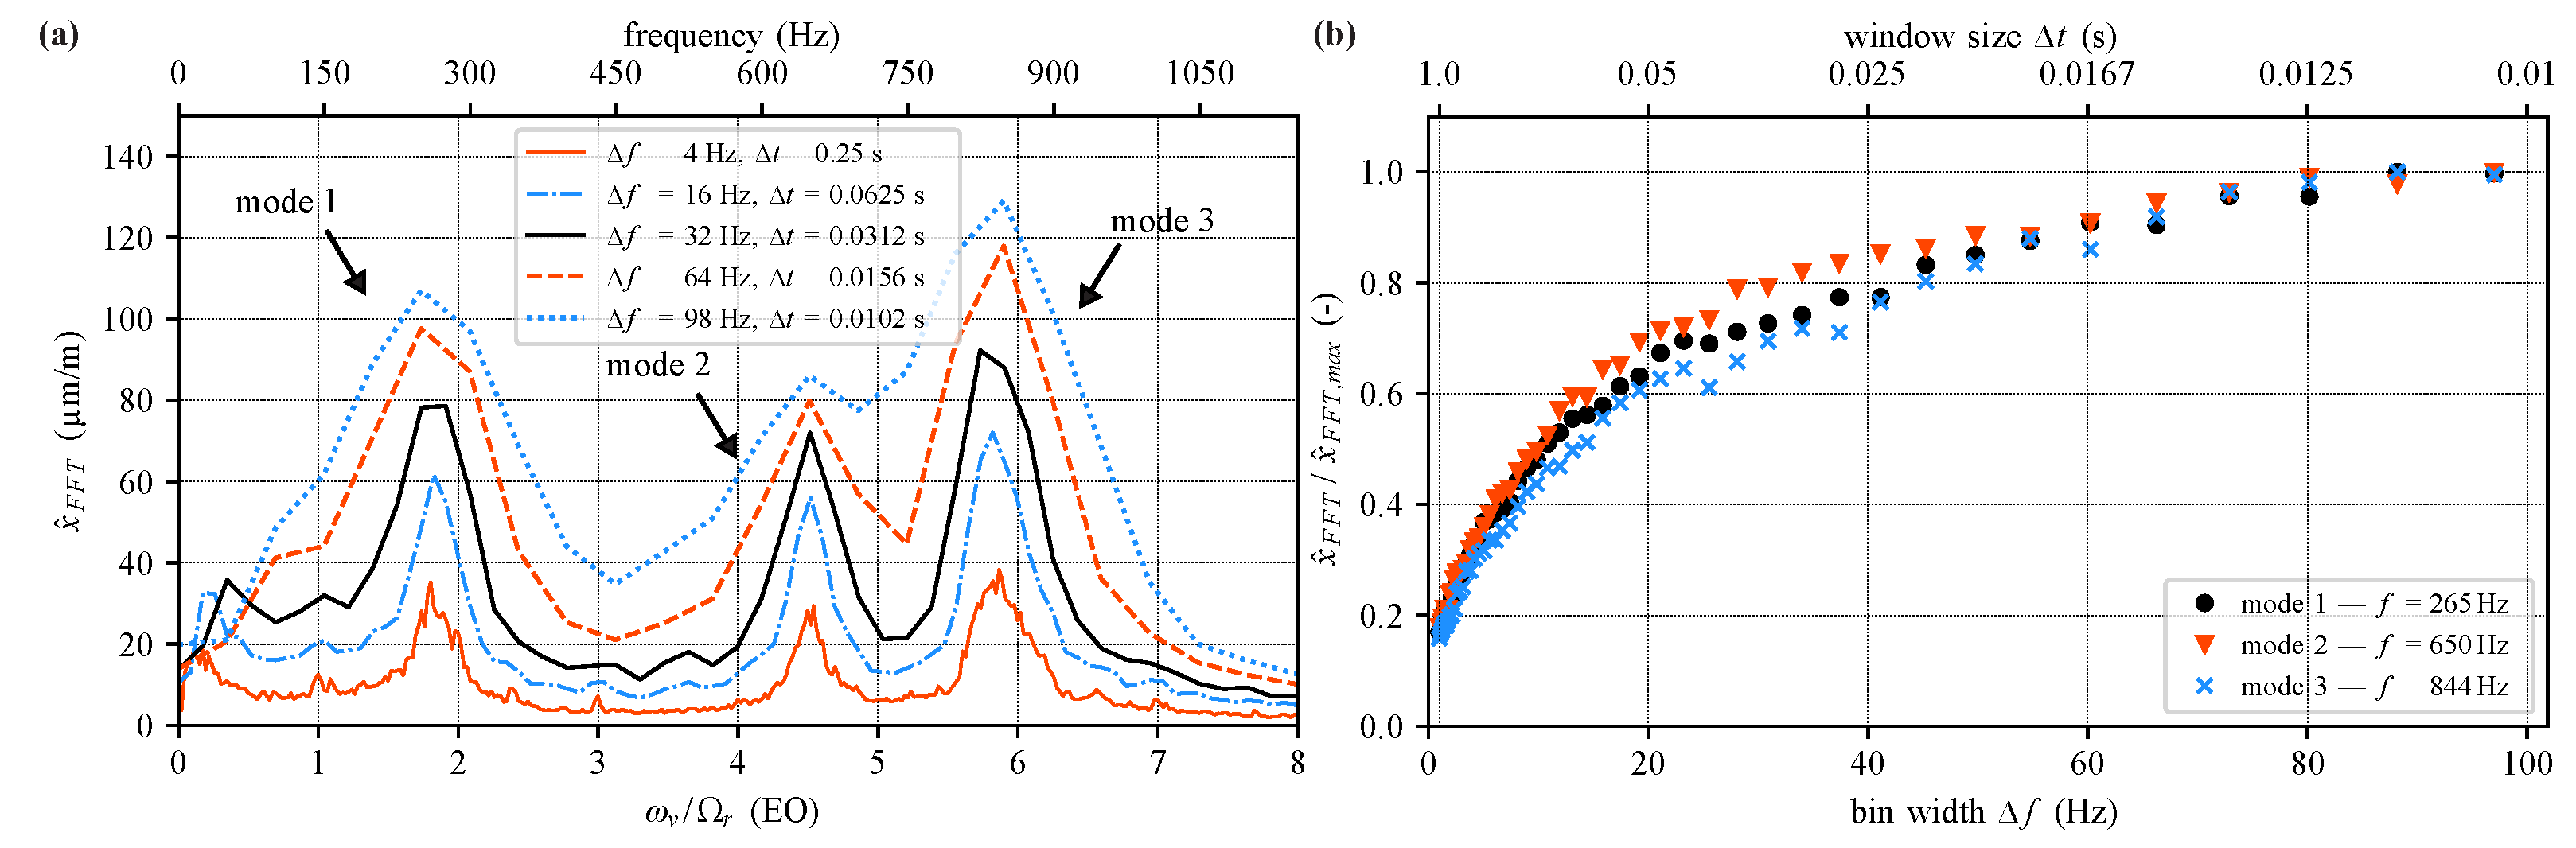
Figure 6.
(a) PSD spectrum for different bin widths . (b) RMS spectra based on PSD calculation for different bin widths .
Figure 6.
(a) PSD spectrum for different bin widths . (b) RMS spectra based on PSD calculation for different bin widths .
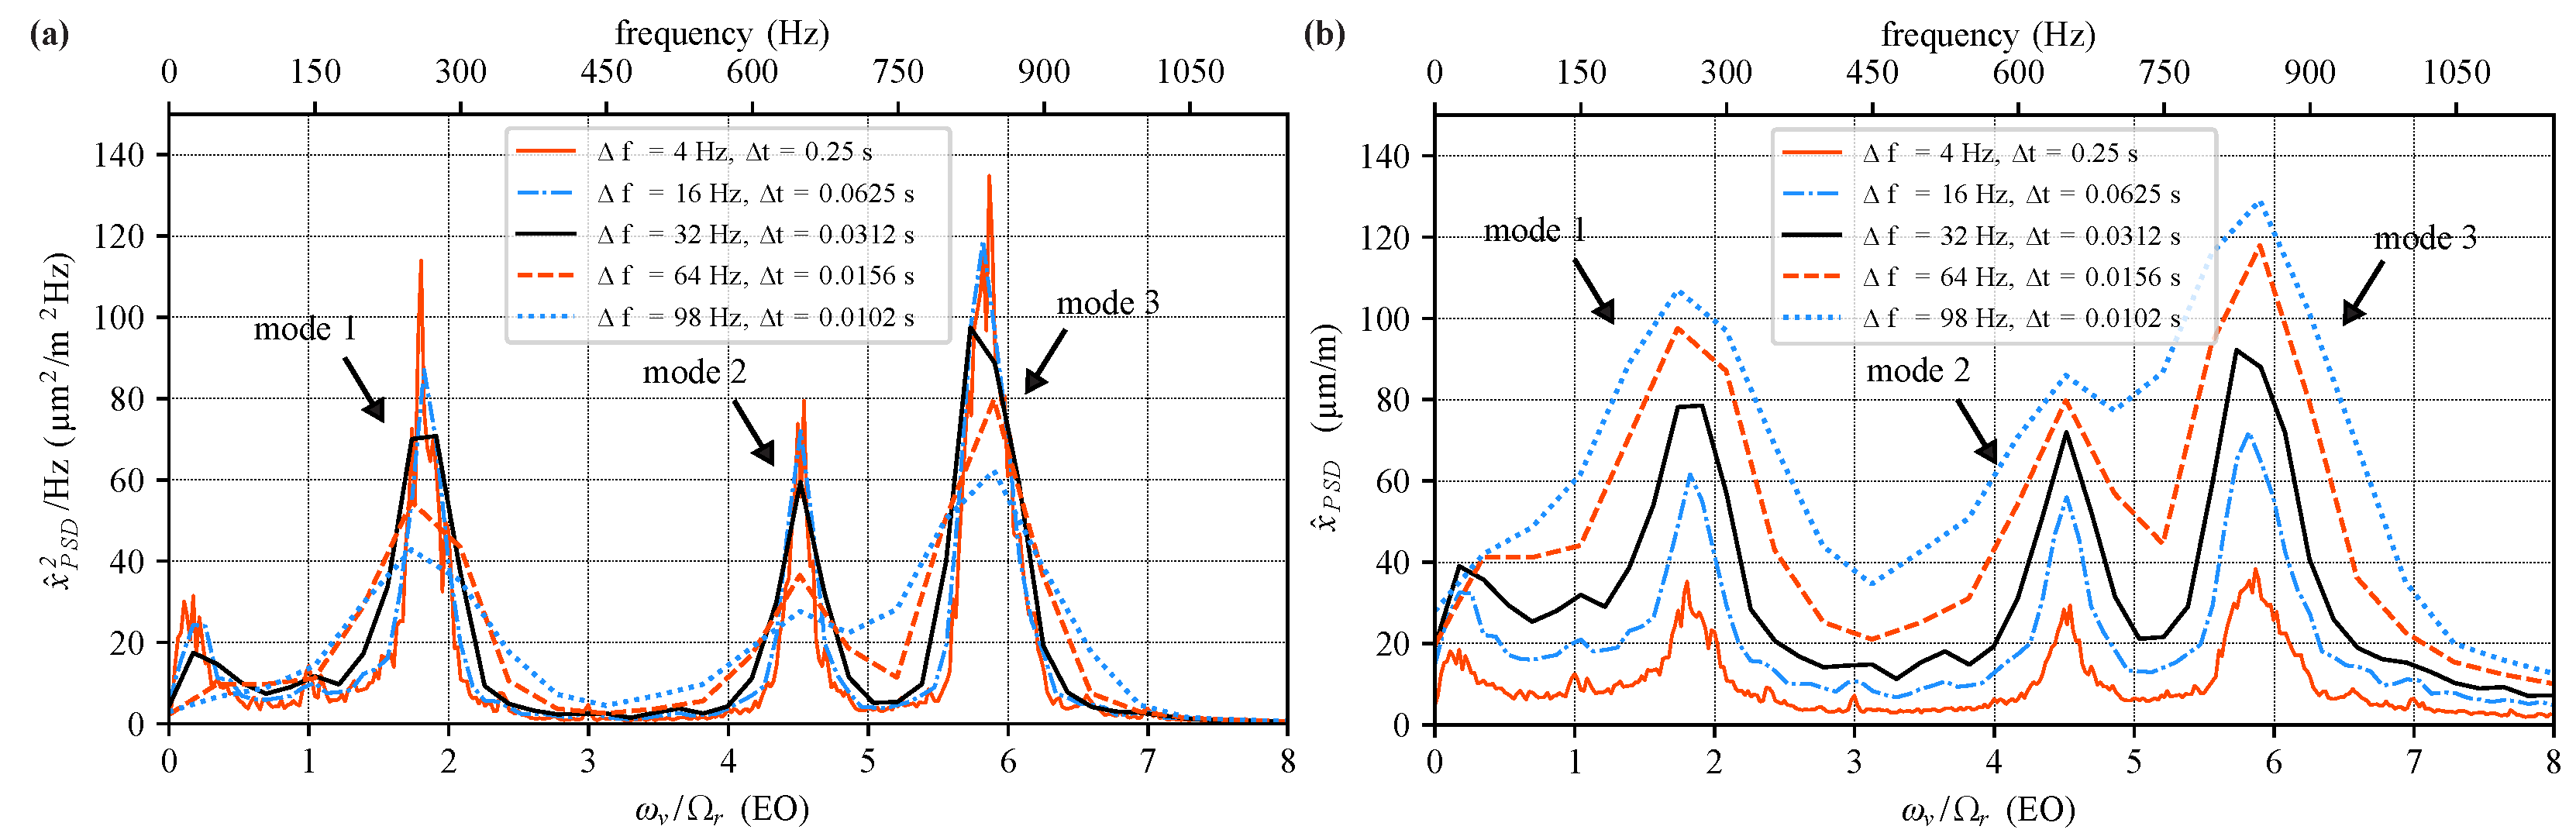
Figure 7.
SDOF mass oscillator.

Figure 8.
System identification: (a) FFT spectrum with Hz with peak fits for eigenmodes 1, 2, and 3. (b) Frequency, amplitude, and damping evolution over mass-flow rate from peak fits for eigenmode 2.
Figure 8.
System identification: (a) FFT spectrum with Hz with peak fits for eigenmodes 1, 2, and 3. (b) Frequency, amplitude, and damping evolution over mass-flow rate from peak fits for eigenmode 2.
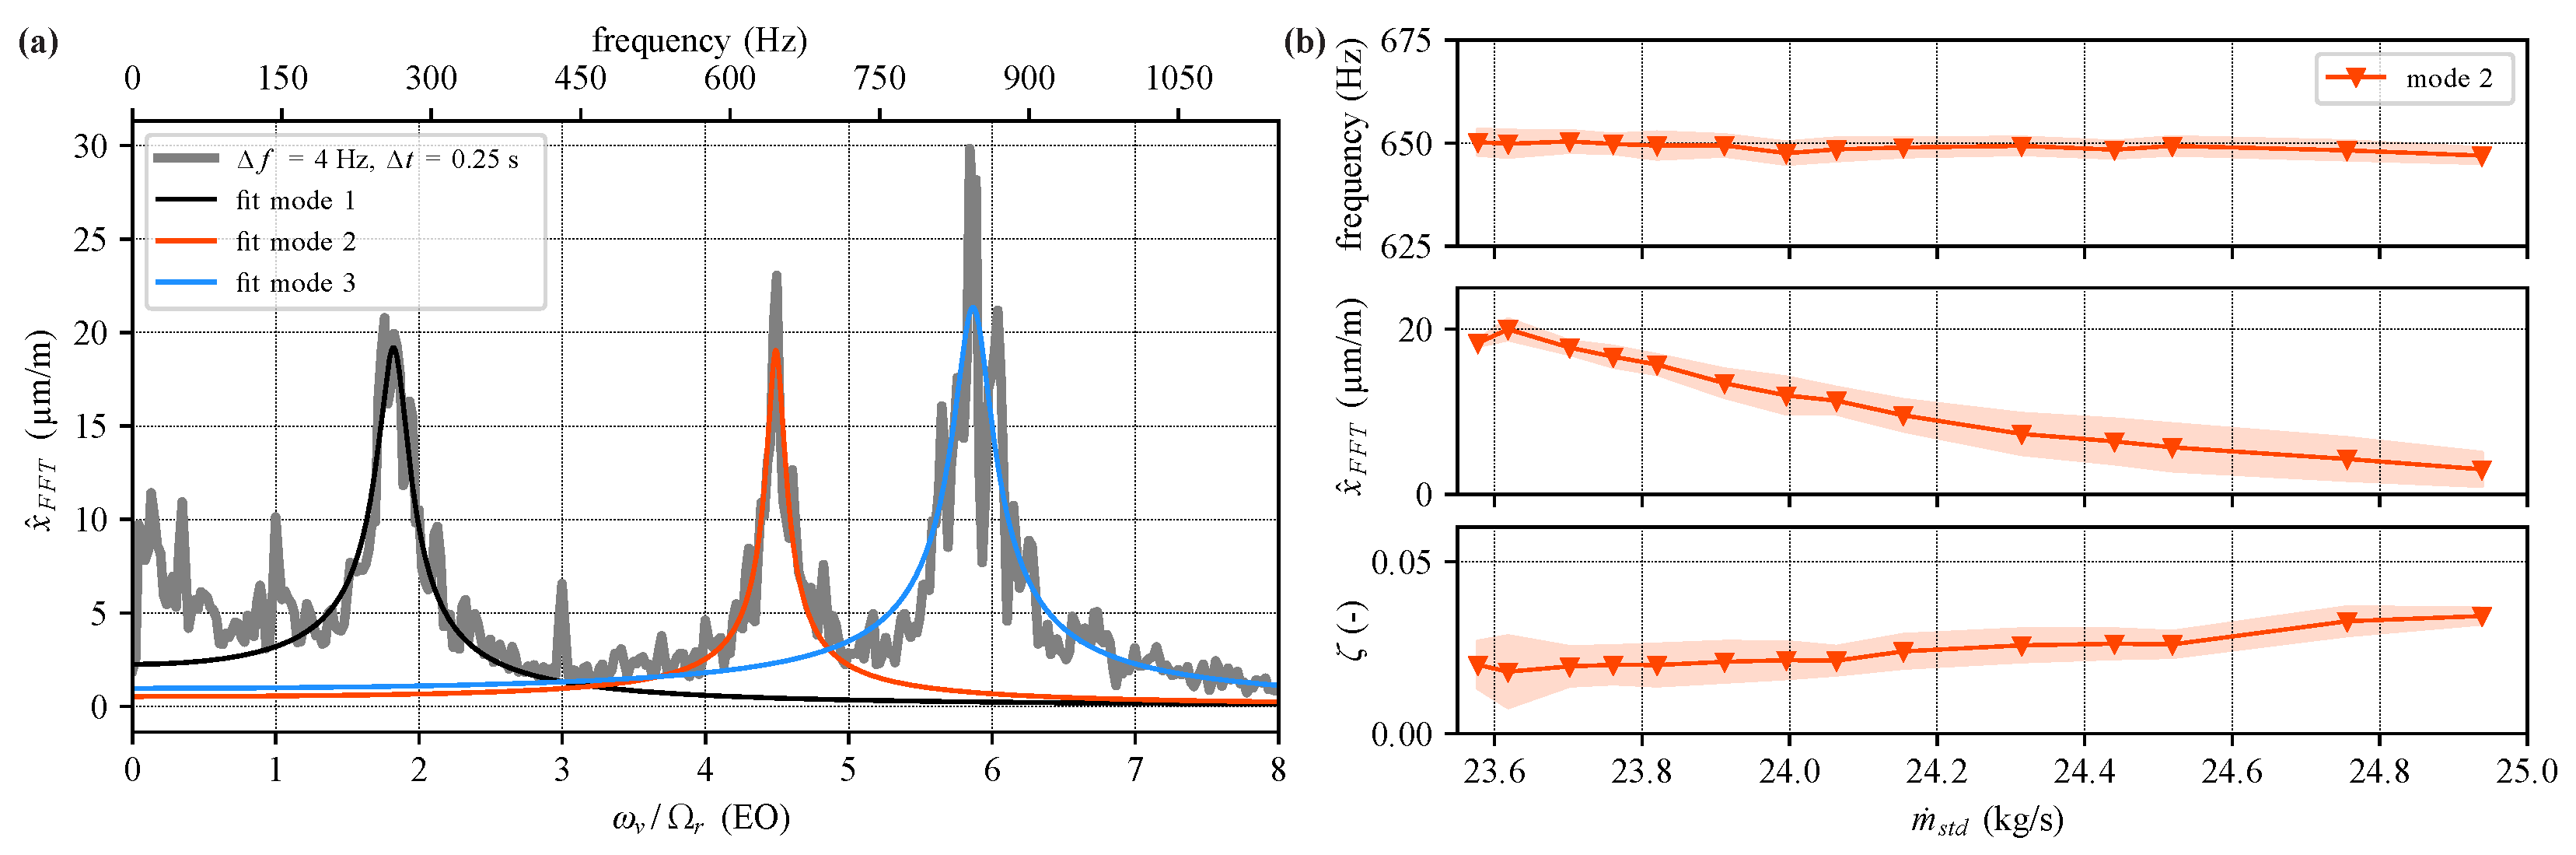
Figure 9.
Normalized displacement signal of SDOF mass oscillator for different simulated eigendmodes with parameters from Table 1.
Figure 9.
Normalized displacement signal of SDOF mass oscillator for different simulated eigendmodes with parameters from Table 1.
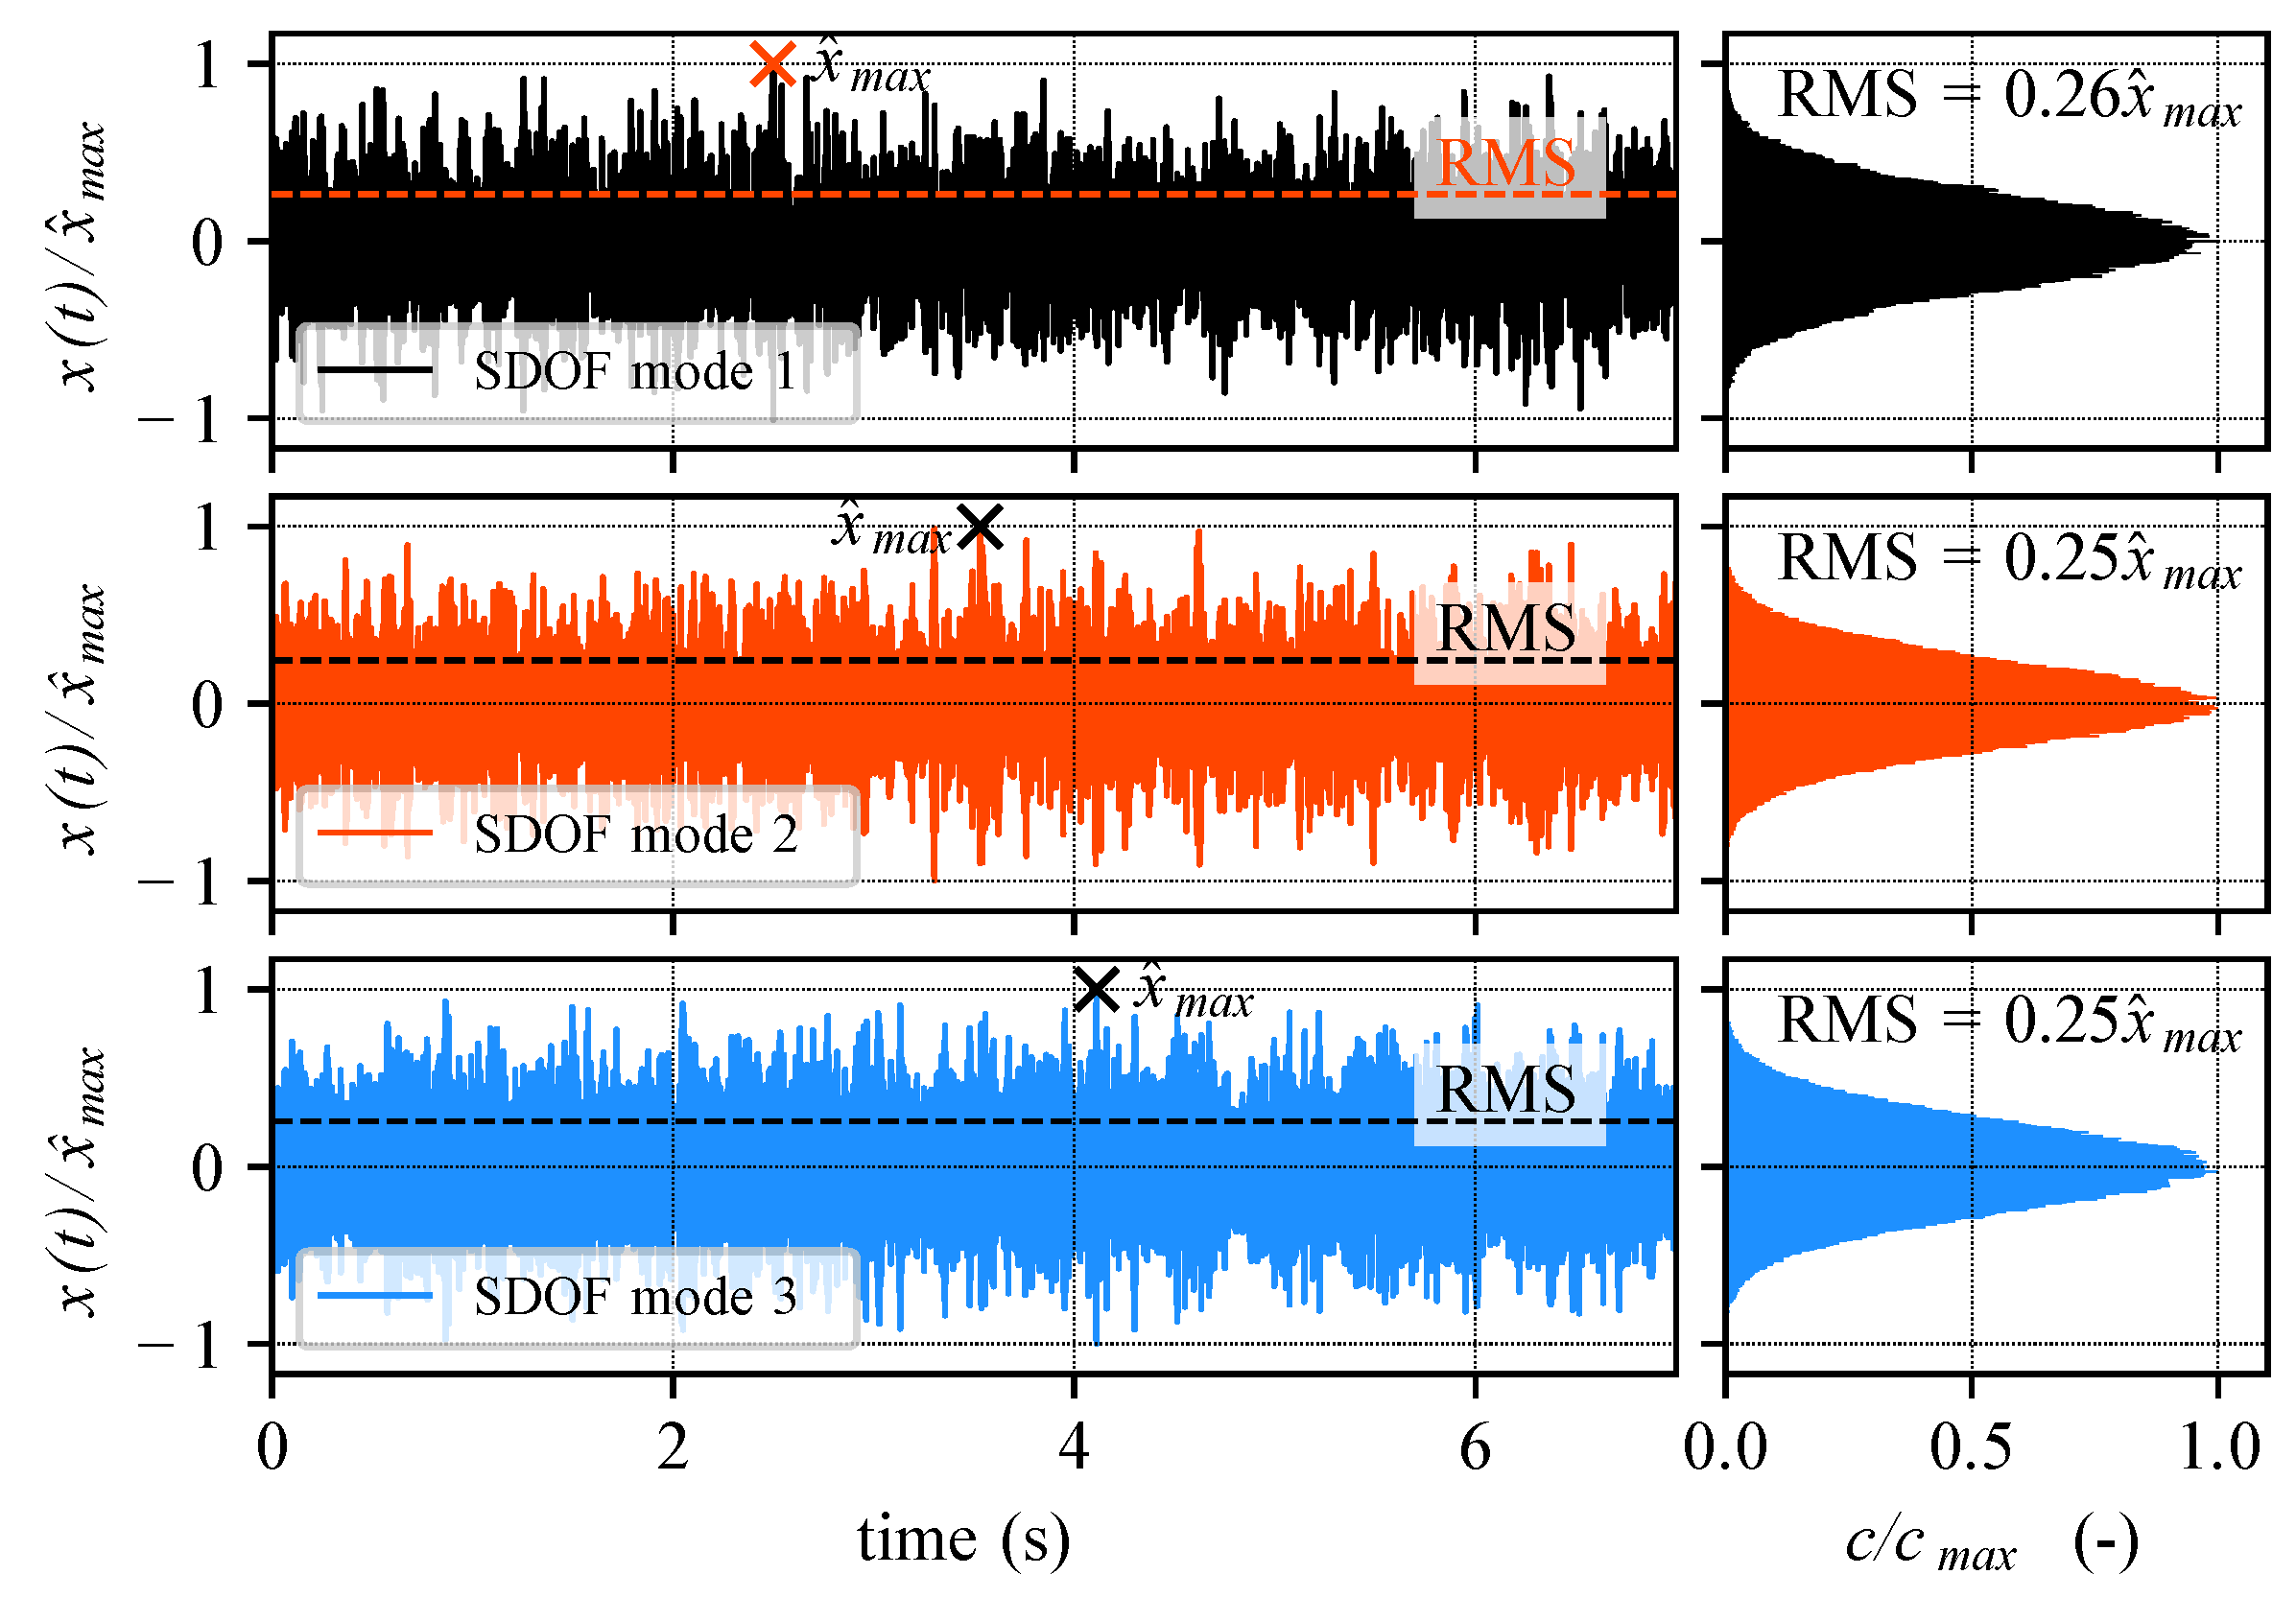
Figure 10.
FFT application to SDOF signal for different eigenmodes: (a) Peak spectra for different bin widths . (b) Evolution of maximum spectral amplitude over bin width .
Figure 10.
FFT application to SDOF signal for different eigenmodes: (a) Peak spectra for different bin widths . (b) Evolution of maximum spectral amplitude over bin width .
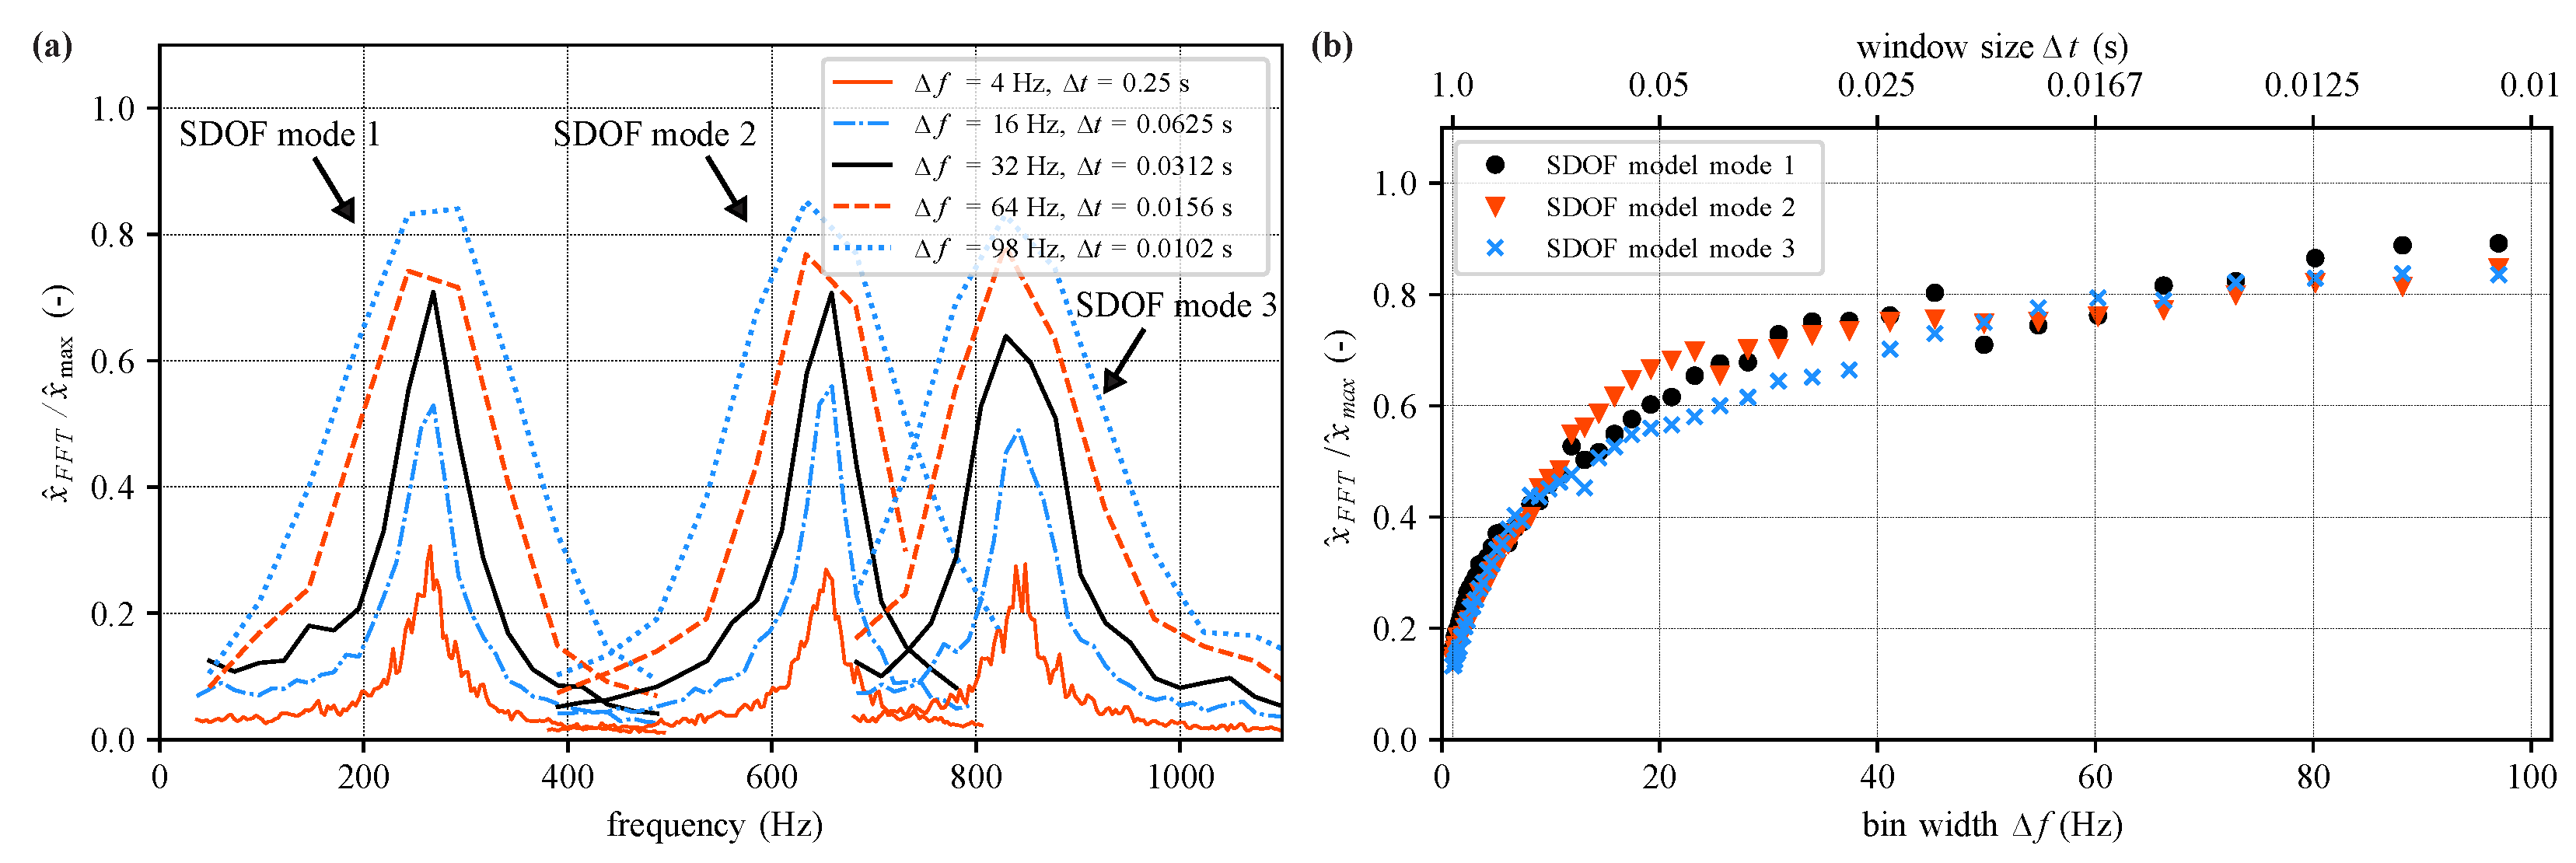
Figure 11.
Correction factor a: (a) Curve fit procedure. (b) Evolution over mass-flow rate .
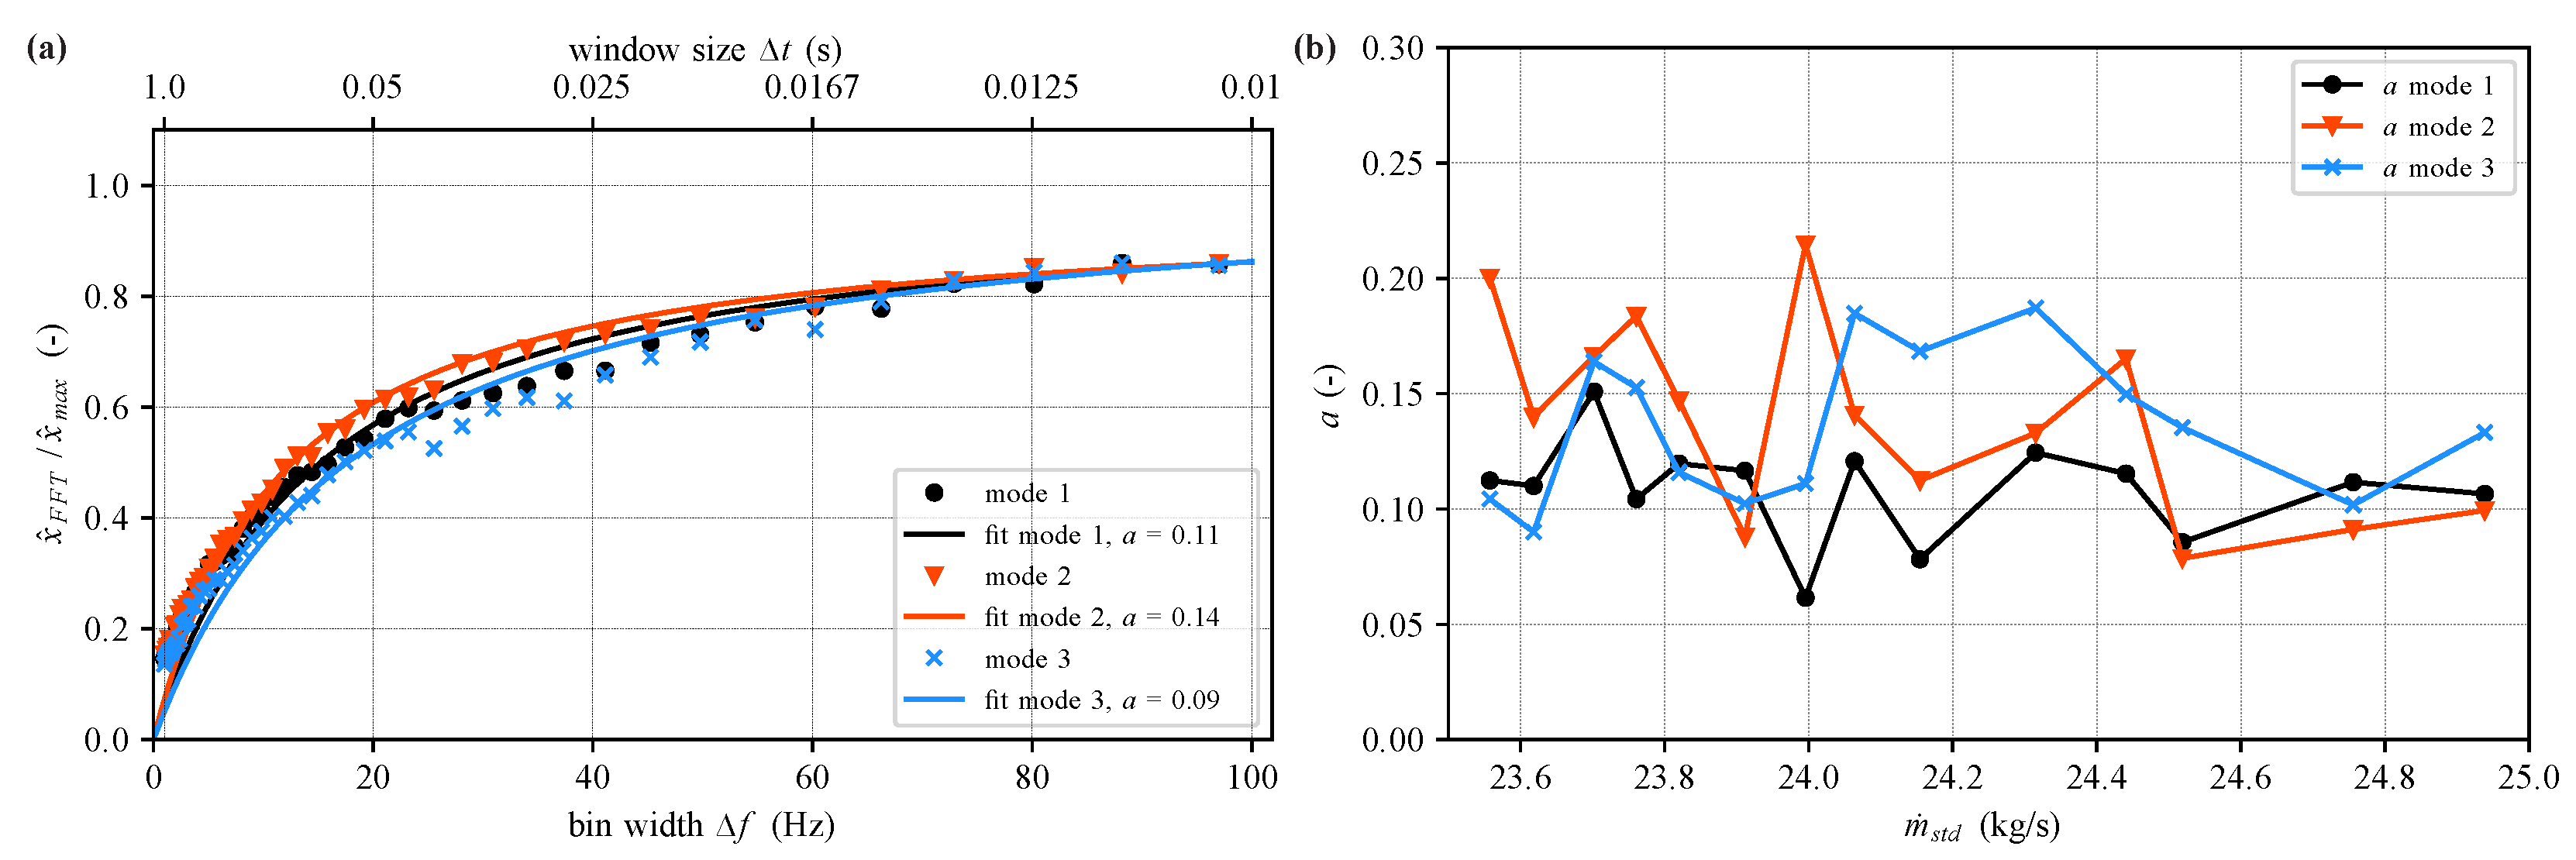
Figure 12.
Application of correction approach: (a) Corrected FFT spectra of blade-mounted strain gauge for different bin widths . (b) Corrected spectral amplitude evolution over bin width .
Figure 12.
Application of correction approach: (a) Corrected FFT spectra of blade-mounted strain gauge for different bin widths . (b) Corrected spectral amplitude evolution over bin width .

Table 1.
Parameter for the SDOF mass oscillator model.
| Parameter | Mode 1 | Mode 2 | Mode 3 |
|---|---|---|---|
| 2Hz | 2Hz | 2Hz | |
| 0.057 | 0.020 | 0.022 | |
| 0.017 | 0.007 | 0.005 | |
| 2Hz | 2Hz | 2Hz | |
| 2Hz | 2Hz | 2Hz | |
| 7% | 5% | 8% |
Disclaimer/Publisher’s Note: The statements, opinions and data contained in all publications are solely those of the individual author(s) and contributor(s) and not of MDPI and/or the editor(s). MDPI and/or the editor(s) disclaim responsibility for any injury to people or property resulting from any ideas, methods, instructions or products referred to in the content. |
© 2024 by the authors. Licensee MDPI, Basel, Switzerland. This article is an open access article distributed under the terms and conditions of the Creative Commons Attribution (CC BY-NC-ND) license (https://creativecommons.org/licenses/by-nc-nd/4.0/).
Share and Cite
MDPI and ACS Style
Schneider, A.P.; Paoletti, B.; Ottavy, X.; Brandstetter, C. Quantification of Blade Vibration Amplitude in Turbomachinery. Int. J. Turbomach. Propuls. Power 2024, 9, 10. https://doi.org/10.3390/ijtpp9010010
AMA Style
Schneider AP, Paoletti B, Ottavy X, Brandstetter C. Quantification of Blade Vibration Amplitude in Turbomachinery. International Journal of Turbomachinery, Propulsion and Power. 2024; 9(1):10. https://doi.org/10.3390/ijtpp9010010
Chicago/Turabian StyleSchneider, Alexandra P., Benoit Paoletti, Xavier Ottavy, and Christoph Brandstetter. 2024. "Quantification of Blade Vibration Amplitude in Turbomachinery" International Journal of Turbomachinery, Propulsion and Power 9, no. 1: 10. https://doi.org/10.3390/ijtpp9010010