A Review of New Experimental Technologies for the Development of Advanced Fans with High Bypass Ratio

Central Institute of Aviation Motors, 111116 Moscow, Russia
Int. J. Turbomach. Propuls. Power 2018, 3(3), 21; https://doi.org/10.3390/ijtpp3030021
Submission received: 15 June 2018
/
Revised: 8 August 2018
/
Accepted: 13 August 2018
/
Published: 21 August 2018
Abstract
:The paper reviews new experimental technologies for the development of advanced fans with high bypass ratios. Most of those developments are carried out in a highly specialized acoustic test facility available at the Central Institute of Aviation Motors (CIAM) in Moscow. The C-3A facility is equipped with an anechoic chamber specifically designed for acoustic, aerodynamic, and mechanical investigations of counter rotating fan models.
1. Introduction
Nearly 10 years have passed since the beginning of tests at the unique Central Institute of Aviation Motors (CIAM) acoustic test facility—the C-3A with an anechoic chamber. While the start was on 27 July 2006, it took a year to complete debugging work at the test bench and proceed with the scheduled scientific investigations. An international team cooperated at the C-3A test facility from 2007 to 2011 with the participation of leading specialists from Snecma (now Safran Aircraft Engines, France), Techspace Aero (now Safran Aero Boosters, Belgium), the German Aerospace Center (DLR, three divisions from Cologne, Berlin, and Stuttgart, Germany), and the National Research and Development Institute for Gas Turbines (COMOTI, Romania). The main task of the international collaboration was the investigations of the steady and unsteady gas dynamics, mechanical strength and acoustics fields in the process of designing and testing the counter rotating model fans within the European EnVIronmenTALly friendly aero engine (VITAL) research program [1,2,3,4,5,6,7,8,9,10,11].
From 2013 to 2017, the C-3A test facility was used as a key test bench for gasdynamic, strength, and acoustic tests of counter rotating fan models with an ultra-high bypass ratio (m = 18–20) under a new international research program—the Innovative Counter rOtating fan system for high Bypass Ratio Aircraft engine (COBRA) [12,13]. European participants in this international project (collaboration between Russia and Europe) were ONERA, Safran Aircraft Engines (France), DLR (Germany), and COMOTI (Romania). Partners in the COBRA project from the Russian party were CIAM, JSC Kuznetsov, Aerosila, and the Moscow Institute of Physics and Technology (MIPT). At that time, a counter rotating model fan designed by CIAM with m = 20 bypass ratio had been tested [13]. By the end of 2017, a European version of a counter rotating fan with m = 18 bypass ratio had to be manufactured and tested for gas dynamic and acoustic performance.
Today, the most widely used aircraft engine is a turbofan, a complex and high-end machine. In the process of its continuous development, improvements are foreseen in its reliability, noise level, efficiency and emissions. The major aviation industries did not cease to work on these tasks for a minute. As a result, more advanced engines and, consequently, more advanced aircrafts came into service [14,15,16,17].
In the early 1990’s, a new-type turbofan—the NK-93 was developed and manufactured in Russia under the leadership of the Academician N.D. Kuznetsov in Samara NTK (now JSC Kuznetsov) [18]. Its novelty relied on a new counter rotating ducted fan technology (CRTF) installed in the engine in place of the conventional single-row ducted fan as widely used today. CIAM also took part in the development of the NK-93 engine. A demonstrator of the NK-93 engine was flight tested in 2007 at the IL-76LL flying testbed (at the Gromov Flight Research Institute, Russia) (see Figure 1).
By means of the counter rotating fan technology (rotors rotating in the opposite direction), the required pressure ratio in the fan of the NK-93 engine is achieved at tip speeds ~30–40% lower than those of the single-row fan. Potentially, a noise reduction of the engine, an increase of the bypass ratio, and consequently an efficiency improvement is also achievable. Thus, a counter rotating fan is to be considered as one of the ways to develop a highly efficient low-noise aircraft engine of a new generation.
In the early 1990s, many attempts to develop a counter rotating fan were undertaken also in Europe and in the USA. One example is the well-known Counter Rotating Integrated Shrouded Propfan (CRISP) project developed by MTU Aero Engines and DLR in Germany. However, these developments were shelved due to insurmountable problems in the acoustics of the counter rotating fans [19,20,21,22].
This paper concentrates on new experimental technologies aimed at solving the key problem of counter rotating fans: noise. The first technology is based on the design of a special test facility—the C-3A—equipped with a long free-ended shaft line to ensure simultaneous noise measurements in the front and rear hemispheres, as well as tests of counter rotating and conventional single rotor model fans.
The C-3A test facility was used to test counter rotating fans in various configurations that made it possible to study the effects of the axial gap between rotors, distributions of loads between rotors, 3D profiling of rotor blades and stator vanes in a bypass duct, and a fan by-pass ratio on noise.
The second technology is based on the development of passive methods capable of influencing the fan gas dynamic and acoustic characteristics through the use of casing treatments (CT) installed over the counter rotating rotors fans. This paper shows examples of high-efficient CTs providing a noise reduction at three certification points in runway, flyover and approach conditions keeping high level of gas dynamic characteristics of counter rotating fans.
In addition to counter rotating fans, the C-3A test facility was used for the development of a new “green” engine concept. To this aim, extensive efforts were undertaken for the design and the operational development of conventional single-row fans installed in direct drive engines with tip speeds of Utip = 370–400 m/s and geared engines with Utip = 315–330 m/s with the aim of improving of their aerodynamic and acoustic characteristics.
To support the findings of the experimental investigations and to validate the computation procedures, gas dynamics and acoustic characteristics of the model fans as predicted by Reynolds Averaged Navier–Stokes (RANS), Unsteady Reynolds Averaged Navier–Stokes (URANS), and Computational Aero-Acoustic (CAA) procedures are presented.
2. Technical Requirements for the C-3A Test Facility to Measure the Fan Acoustic and Aerodynamic Performance
To investigate the acoustic problems of counter rotating fans and to exploit the CRTF potentialities due to lower tip speeds (decreased by ~30–40%), it is necessary to carry out a series of fundamental computational and experimental investigations. One of the most important complex and time-consuming task in this activity is the design and development of a test facility that could be used for CRTF experimental investigations in conditions of full aerodynamic and acoustics similarity of the model fan (scaled-down) with the full-scale fan. The complexity of this task is evidenced by the fact that, up to the present time, there was no test facility in the world that could meet the whole set of above-mentioned requirements. A very important issue for acoustic similarity is the stringent condition to make the simultaneous acoustic measurements in the front and rear hemispheres of the fan. Another factor that restrains the development of test facilities suitable for these acoustic measurements is the very complex design of a long-cantilevered shafting, especially in a counter rotating version. In the design process of this shafting, a number of difficult engineering and scientific tasks in the field of dynamic strength should be resolved (see patent [23]). This 9 m counter rotating shafting was developed for the C-3A test facility to operate at up to 12,500 rpm without critical speeds and resonances. An invaluable contribution to the C-3A test facility development was made by the following Russian scientists: A.G. Popovyan, V.A. Skibin, V.O. Bauer and V.P. Maksimov. Up to now the C-3A test rig remains the only facility with such a complex shafting module system of about 9 m length.
As the chamber of the C-3A test facility is anechoic, i.e., coated by sound-absorbing panels, and has approximately 1350 m3 in volume, it is necessary to pay attention to the uniformity of the aerodynamic and acoustic fields inside the chamber itself. Strict requirements are imposed on these fields. From a fluid mechanics point of view, uniform and constant inlet conditions should be granted at the inlet of the tested model fan. This means that acceptable temperature and pressure variations should be less than 0.2 °C and 0.2 kPa, respectively. It should be noted that higher temperature and pressure non-uniformities of the inlet flow will not only affect the gas-dynamic performance but distort its acoustic characteristics as well [15,16,17].
Physically, these non-uniformities can be caused by stray vortices that can be generated near the rear wall of the C-3A test facility chamber. The most dangerous are backflow streamlines that have already passed through the model fan and, therefore, have higher total pressure and temperature values. To get a better insight into the problem, CIAM developed a 3D RANS model of a cantilever fan with a long shafting that was used to estimate the levels of non-uniformity at the model fan inlet on account of the possible stray vortices generation.
The calculations revealed that suction of air passing through the model fan is not enough to meet the requirements of inlet flow uniformity at the model fan inlet; in these circumstances, the temperature non-uniformity may be higher than 10%. To reduce the non-uniformity of the gasdynamic parameters at the fan inlet under the technical specification requirements, it is necessary to exhaust a greater amount of air from the chamber. The experience gained in the operation of the C-3A test facility shows that, to attain the required flow non-uniformity at the model fan inlet, it is necessary to arrange a forced air suction from the C-3A test facility chamber; and this air flow should exceed the fan flow by 50–70%. For this reason, an ejector cone coated with a sound-absorbing material was designed and manufactured as shown in Figure 2 and Figure 3. Additional suction of air from the C-3A test facility chamber also induces a decrease in the air circulation around the microphones that would have a negative effect on noise measurements.
According to the Russian and international standards, one of the main criteria for “anechoicability” of an acoustic chamber is a deviation of the sound level drop from the inverse proportionality law. If the difference between measured and theoretical values of the sound level drop (for any direction and any frequency) of the operation range is smaller than ±1.5 dB, the chamber meets the requirements of the standard. In a fully anechoic chamber, the sound pressure level drop is 6 dB where the distance from the source is doubled. Checking of inverse law was performed at a distance 2, 4 and 6 m. Sound pressure level (SPL) was reduced by 6 dB and 9 dB accordingly.
In the anechoic chamber of the C-3A test facility, the pressure sound levels were measured by means of a microphone moved away from the sound source during the sound field generation. The latter was generated with the help of a jet broadband sound source (the airjet) and the OmniPower electrodynamic sound source manufactured by Brüel & Kjær (Nærum, Denmark). Additionally, reverberating time was measured. It is worth noting that the OmniPower transmitter can generate white, pink noise and harmonic (sinusoidal) signals.
The acoustic measurements show that in the anechoic chamber of the C-3A test facility, deviations from the inverse proportionality law are within 1–1.5 dB range at frequencies higher than 250 Hz for sound generated by a broadband source, at frequencies higher than 315 Hz for sound generated by pink noise, and at 400–500 Hz for sound generated by a harmonic signal. It follows that for fan noise measurements in the anechoic chamber of the C-3A test facility, the bottom boundary of the operating frequency range for the broadband component is equal to 250 Hz; and for tonal noise is 500 Hz. Acoustic measurements also revealed that within 100–10 kHz frequency range, the reverberating time in the chamber of the C-3A test facility is less than 0.3 s. For comparison, it is worth noting that an anechoic chamber with an acceptable sound absorption has typically ≤0.35–0.4 s reverberation time; therefore, the C-3A test facility meets this criterion.
Experimental verifications of the quality of the gas dynamic and acoustic characteristics of the field inside the chamber of the C-3A test facility give ground to state that the C-3A test facility can provide compliance with all requirements of gasdynamic and acoustic simulation and fulfill all tasks devoted to experimental investigations of gasdynamic and acoustic performances of model fans.
3. Detuning of the C-3A Test Facility Shafting from Critical Speeds and Resonances
The design and manufacturing of very long cantilever counter rotating shafting (up to 9 m in length) is a difficult task both from the engineering and scientific point of view. The first problem to be solved is the shifting the critical speeds of the shafting out of the operating range or to achieve conditions for operating near the rotor critical speed with an admissible vibration level. To this aim, the shaft is divided into multiple modules with a specific length (Figure 4) and supported by casings with a specified value of stiffness. Front modules of the test facility located directly near the model fan are assembled with elastic-damping supports (in the form of Alisson rings with unequally spaced flanges and a damper with an elastic “squirrel cage”).
An important task in the test facility design is conception of measures providing acceptable vibration levels. Taking into account the risk of vibrations with rotor speeds close to critical ones, these speeds are calculated and, if necessary, frequencies are tuned out. The application of units reducing the stiffness of the rotor supports is the most effective way to change the rotor critical speeds to enlarge the required margin for operating modes. For this purpose, elastic elements are installed in the rotor supports, and very often this is done in combination with chosen damping.
At the design stage, the calculations for the most parts are carried out with the help of programs developed by CIAM. Those programs rely on the use of a mathematical tool based on the rod bending theory accounting for the distributed mass and rigid characteristics of the rotor. The calculations also take into account the gyroscopic effect of the disks, the counter rotation of the rotors and their possible precession motions. The distinctive feature of these programs is the reduced computational cost.
To verify the calculated data, rotor eigenfrequencies were simultaneously computed with the use of the finite element analysis (FEA) carried out with the ANSYS v17.2 software (ANSYS, Inc., Canonsburg, PA, USA).
The compliance of the supports (including both ball and roll bearings) are estimated with a method accounting for non-linear dependences between the system elasticity and load acting on the roll bearing. Mode shapes for the rotor system and the casing are found as a result of these calculations.
The n1res = 5247 rpm, n1res = 5277 rpm resonance modes correspond to transient mode caused by shifting the cantilever ends of both rotors and casings. The n2res = 8780 rpm resonance mode during a direct synchronous precession of the front rotor is mainly caused by the vibrations of the casing. The n1res = 5247 rpm, n1res = 5277 rpm, n2res = 8780 rpm resonance modes will be damped installing the elastic-damping supports. The n2res = 11,453 rpm mode shape is detected only during the direct precession of the rear rotor and is out of the operating range. The n3res = 15,126 rpm, n3res = 15,256 rpm resonance modes are also out of the operating range.
Additionally, the rotors–casings system is calculated with the nacelle installed on the cantilever part of the casing (see Figure 5). Figure 5 shows the calculated data for two vibration modes with n1 = 5500 rpm and n2 = 12,180 rpm from the general spectrum of eigenfrequencies for the rotor–casing system found on the basis of the CIAM’s simplified beam model, that provides fast and accurate calculations. For comparison, Figure 5 also shows calculated data for these two vibration modes found on the basis of the ANSYS v17.2 software package that requires longer calculation time for the complex model under study. Comparison of the results in Figure 5 shows their good agreement. Therefore, the labor-intensive procedure for optimizing the dynamic characteristics of the C-3A test facility shafting and its detuning from resonant frequencies was mainly based on the simplified model.
4. European VITAL Project
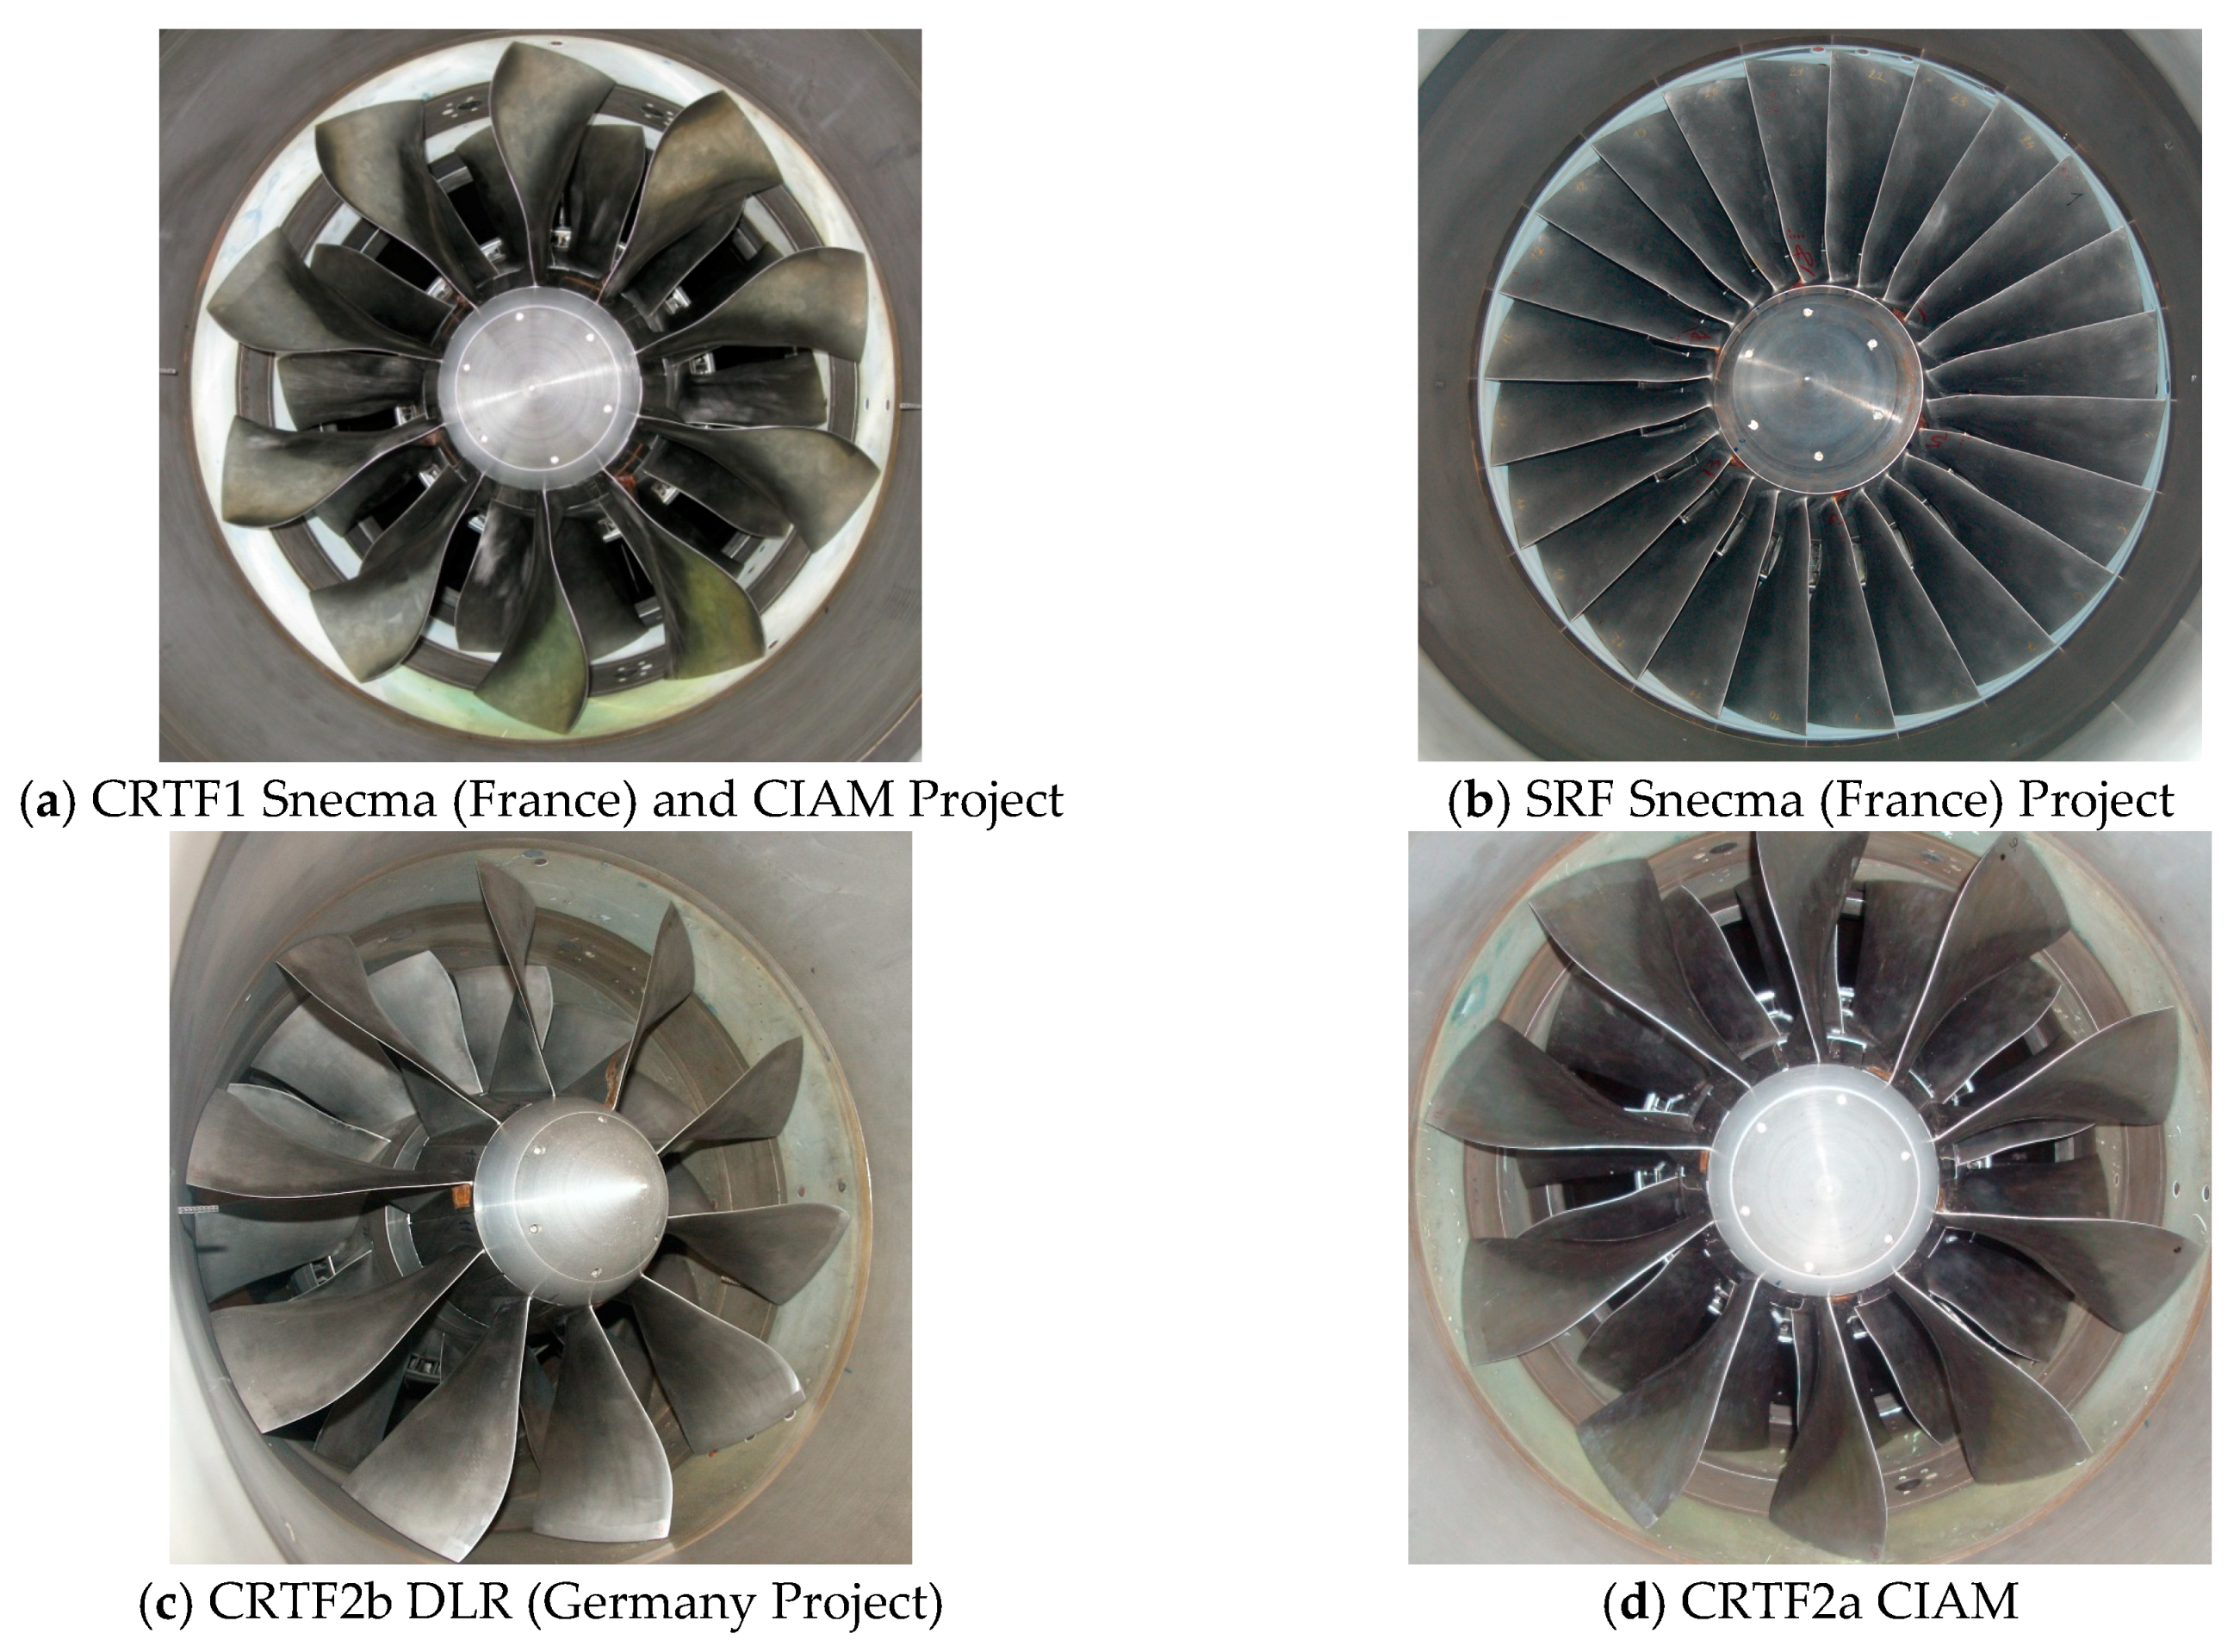
For six years, the C-3A test facility was involved in major efforts devoted to the development of three model versions of a counter rotating fan—CRTF1, CRTF2A, and CRTF2B—under the European VITAL program [1,2,3,4,5,6,7,8,9,10,11] (Figure 6).
At first stage of the European VITAL program [1,2,3], a counter rotating ducted fan with solid titanium blades—CRTF1—was designed (Figure 6). The CRTF1 design was based on advanced 3D analysis of steady and unsteady viscous flows using Navier–Stokes equations, including 3D acoustic calculations (3D-IMP-MULTI and 3D-INVERSE.EXBL, CIAM in-house solvers). Based on the obtained results, the tonal noise sources were decreased. After the gasdynamic optimization, the adiabatic efficiency was equal to η*ad > 0.92 at cor = 100%.
The 3D computational analysis of unsteady local and integral characteristics was completed at the CRTF1 design stage. However, the primary objective of these computations was the choice of an optimum axial clearance between rotors capable of providing acceptable CRTF1 acoustic characteristics. The same axial clearance value was chosen for the CRTF2A model fan manufactured with carbon composite blades.
However, the application of a carbon composite blade (CRTF2A) with 20–30% thicker leading and trailing edges along the whole blade height and a maximum profile thickness compared with the blades of CRTF1 first and second rotors resulted in lower efficiency (by ~1.5–2.0%, of the CRTF2A modified fan) under the same operating conditions [3].
To restore the efficiency of the CRTF2A modified fan with thickened blades, the 3D-inverse problem solver was used [3] in redesigning the CRTF2A blade rows on the basis of a specified aerodynamic load distribution along the blade chord and height. Today, the redesign of a counter rotating fan on the basis of 3D inverse problem solution becomes a reliable and powerful tool for improvement of fan performance. A real challenge in this case is a correct choice of the optimal aerodynamic load distribution on the blade surface.
The objective in the development of the above-mentioned models of counter rotating fans was to provide at least the same aerodynamic and acoustic characteristics of the fan of the CFM56-7B engine fan—the reference engine manufactured in 2000. This model fan—the single reference fan (SRF, Snecma, France)—was manufactured by COMOTI (Romania). As to aerodynamic targets, they were successfully reached: an increase in the efficiency of the CRTF1 modified fan was 2.5% as compared with the fan of the CFM56-7B reference engine [6].
As to the acoustic targets, a final answer has not yet been given. In any case, this is the subject of a forthcoming paper. CIAM believes that an improvement of the acoustic performance of the three model versions of the counter rotating fan has been achieved [7].
Figure 7 shows the noise levels of an advanced aircraft with different fan configurations developed under the VITAL project. CRTF tests were carried out with different axial clearances, blade shapes, radial load distributions, and blade numbers (10 × 14 and 9 × 11). With respect to the acoustics of the counter rotating fan, a definite conclusion cannot be made. However, Figure 7 shows that the CRTF1 model configuration generates 10 EPNdB lower noise (according to three test points), than the model fan of the reference engine [7]. It is an interesting result that calls for further investigations.
In addition:
- Calculations show that the cumulative noise level of a hypothetical A320NEO-type aircraft with the CRTF2A fan is higher by 2 EPNdB than for the one of an aircraft equipped with the CRTF1 fan.
- Computations and tests revealed that the cumulative noise level of a hypothetical A320NEO-type aircraft with the CRTF2B fan is higher by 15 EPNdB than for the one of an aircraft equipped with the CRTF1 fan. One of the reasons of this outcome seems to be the small relative axial clearance, x, between the two rotors of the CRTF2B model, which is equal to 0.81 as compared with the value of 1.5 of the CRTF1 model (the axial gap Δx is normalized with the chord, bm, in the Rotor 2 (R2) middle section—x = Δx/bm—see Figure 8). There is an increase in the intensity of the interaction between the Rotor 1 (R1) blade wakes and the R2 blades, as well as between the R2 blade detached shocks and the R1 blades at a decreased axial gap between the rotors that leads to an increase in the interaction noise.
5. Comparison of Numerical and Experimental Data for the CRTF1 Model
To provide aerodynamic and acoustic characterization of the CRTF1 fan, the initial version of an advanced counter rotating fan with total pressure ratio, π*~1.5 was tested in the C-3A anechoic chamber (CIAM). Mathematical models, 3D steady viscous flow computations, and integral characteristics of the fan model were also developed. The model fan diameter (D) was 0.5588 m (22”). Replaceable nozzles with different throat cross-sections (Dclose = 595 mm, Dn = 603 mm and Dopen = 618 mm) were installed at the bypass duct outlet for acoustic and aerodynamic tests along various operating lines. A throttling device was used in the bypass duct to measure of the fan pressure characteristics and the stall margins (Figure 8). The fan bypass ratio was controlled by a core duct throttle in the configuration with a bypass nozzle or a bypass valve.
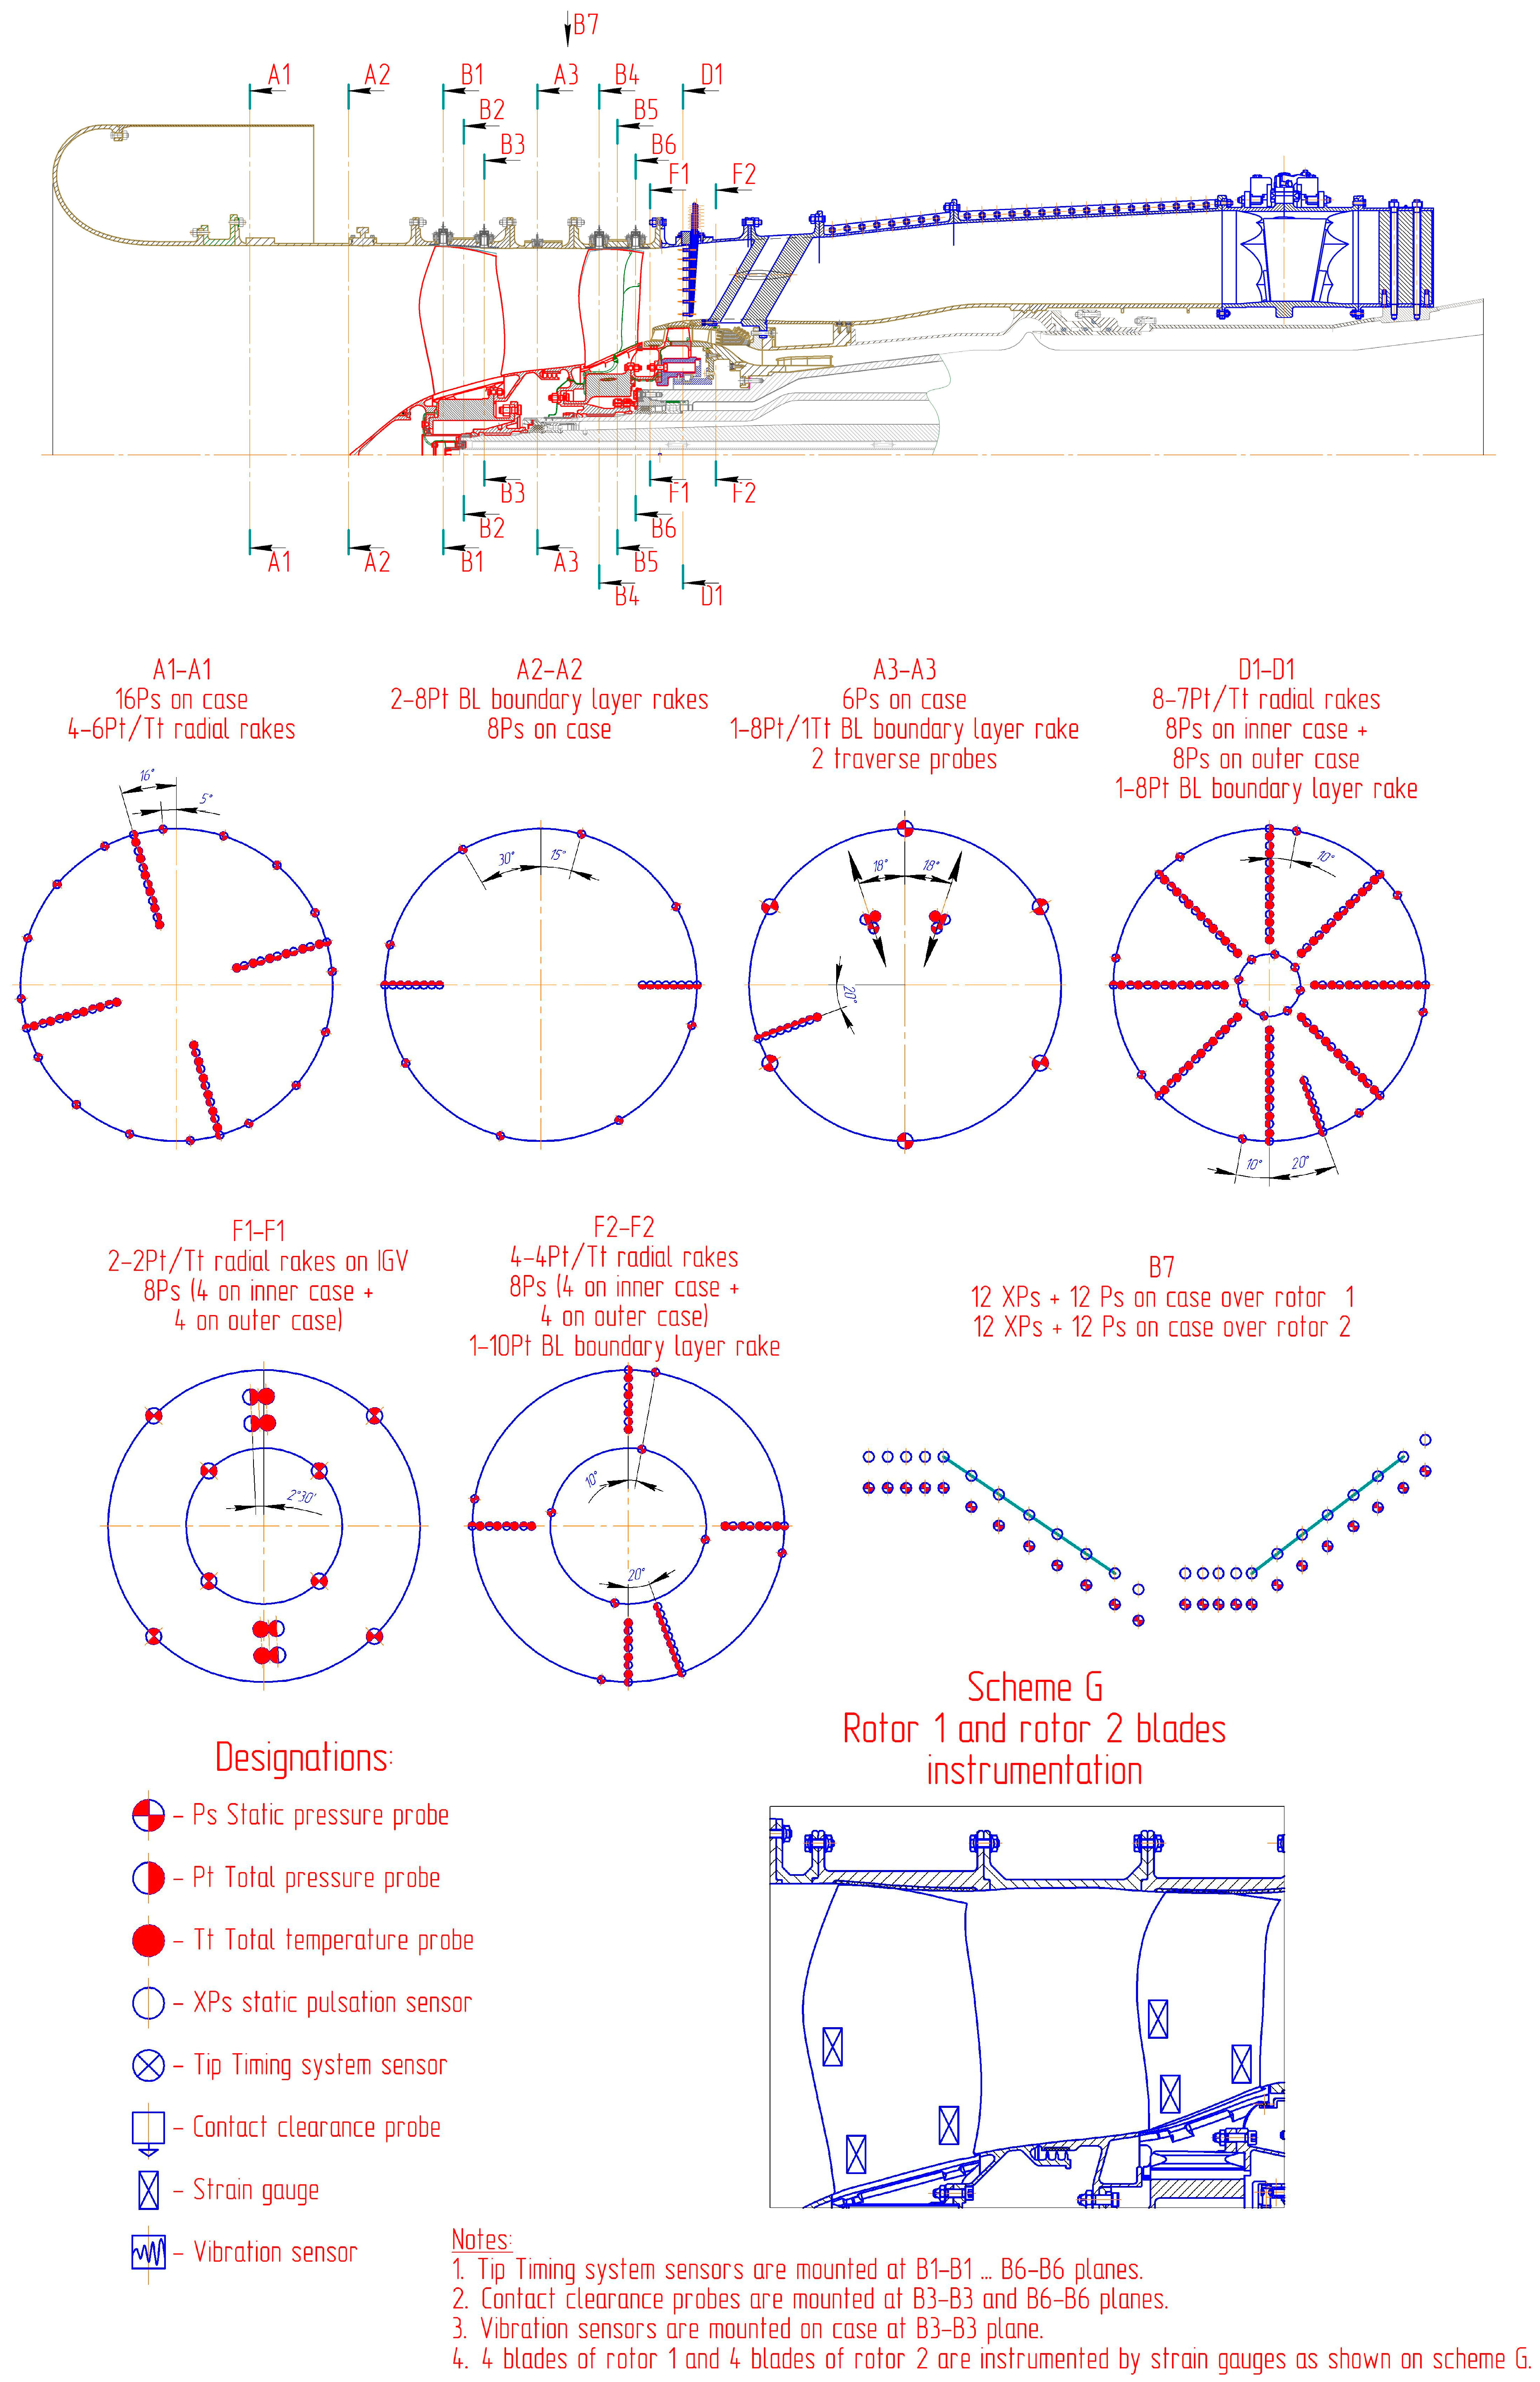
A large set of experimental data [3] was collected during the tests of the CRTF1 fan model. The fan model was heavily instrumented to gather data (total pressure, Pt; total temperature, Tt; static pressure, Pst; flow angle, α) in different sections, namely at the fan inlet, between R1 and R2 rotors, and at the fan outlet. Unsteady parameters and acoustic characteristics were carefully measured but their analysis is out of the scope of this paper. Figure 9 presents the instrumentation scheme of CRTF1 fan model and measuring sections.
The 3D viscous flow computations were carried out with the “3D-IMP-MULTI” software package developed at the CIAM compressor department. The code uses a modified S.K. Godunov’s scheme having 3rd order of approximation with respect to the 3D variables for the nonlinear conservative terms; it is conservative and monotone and enable through-flow computations of subsonic and supersonic flows [24,25,26].
Monotonicity is achieved through Total Variation Diminishing (TVD) procedures. The “3D-IMP-MULTI” software package allows flow calculations not only for the individual blade rows but also for a stage consisting of non-rotating and rotating rows as well as for a multistage compressor. For this latter application the flow along a surface which is located between the rotor and the stator is averaged in the circumferential direction in such a way that mass flow, three components of momentum and energy are conserved globally. In this case there is an increase in entropy that simulates losses caused by flow non-uniformities rectification at the rotor outlet due to mixing. This type of boundary conditions is known as «mixing plane». In this software package a non-reflecting version is implemented.
The present results were obtained using the algebraic turbulence model of Baldwin–Lomax.
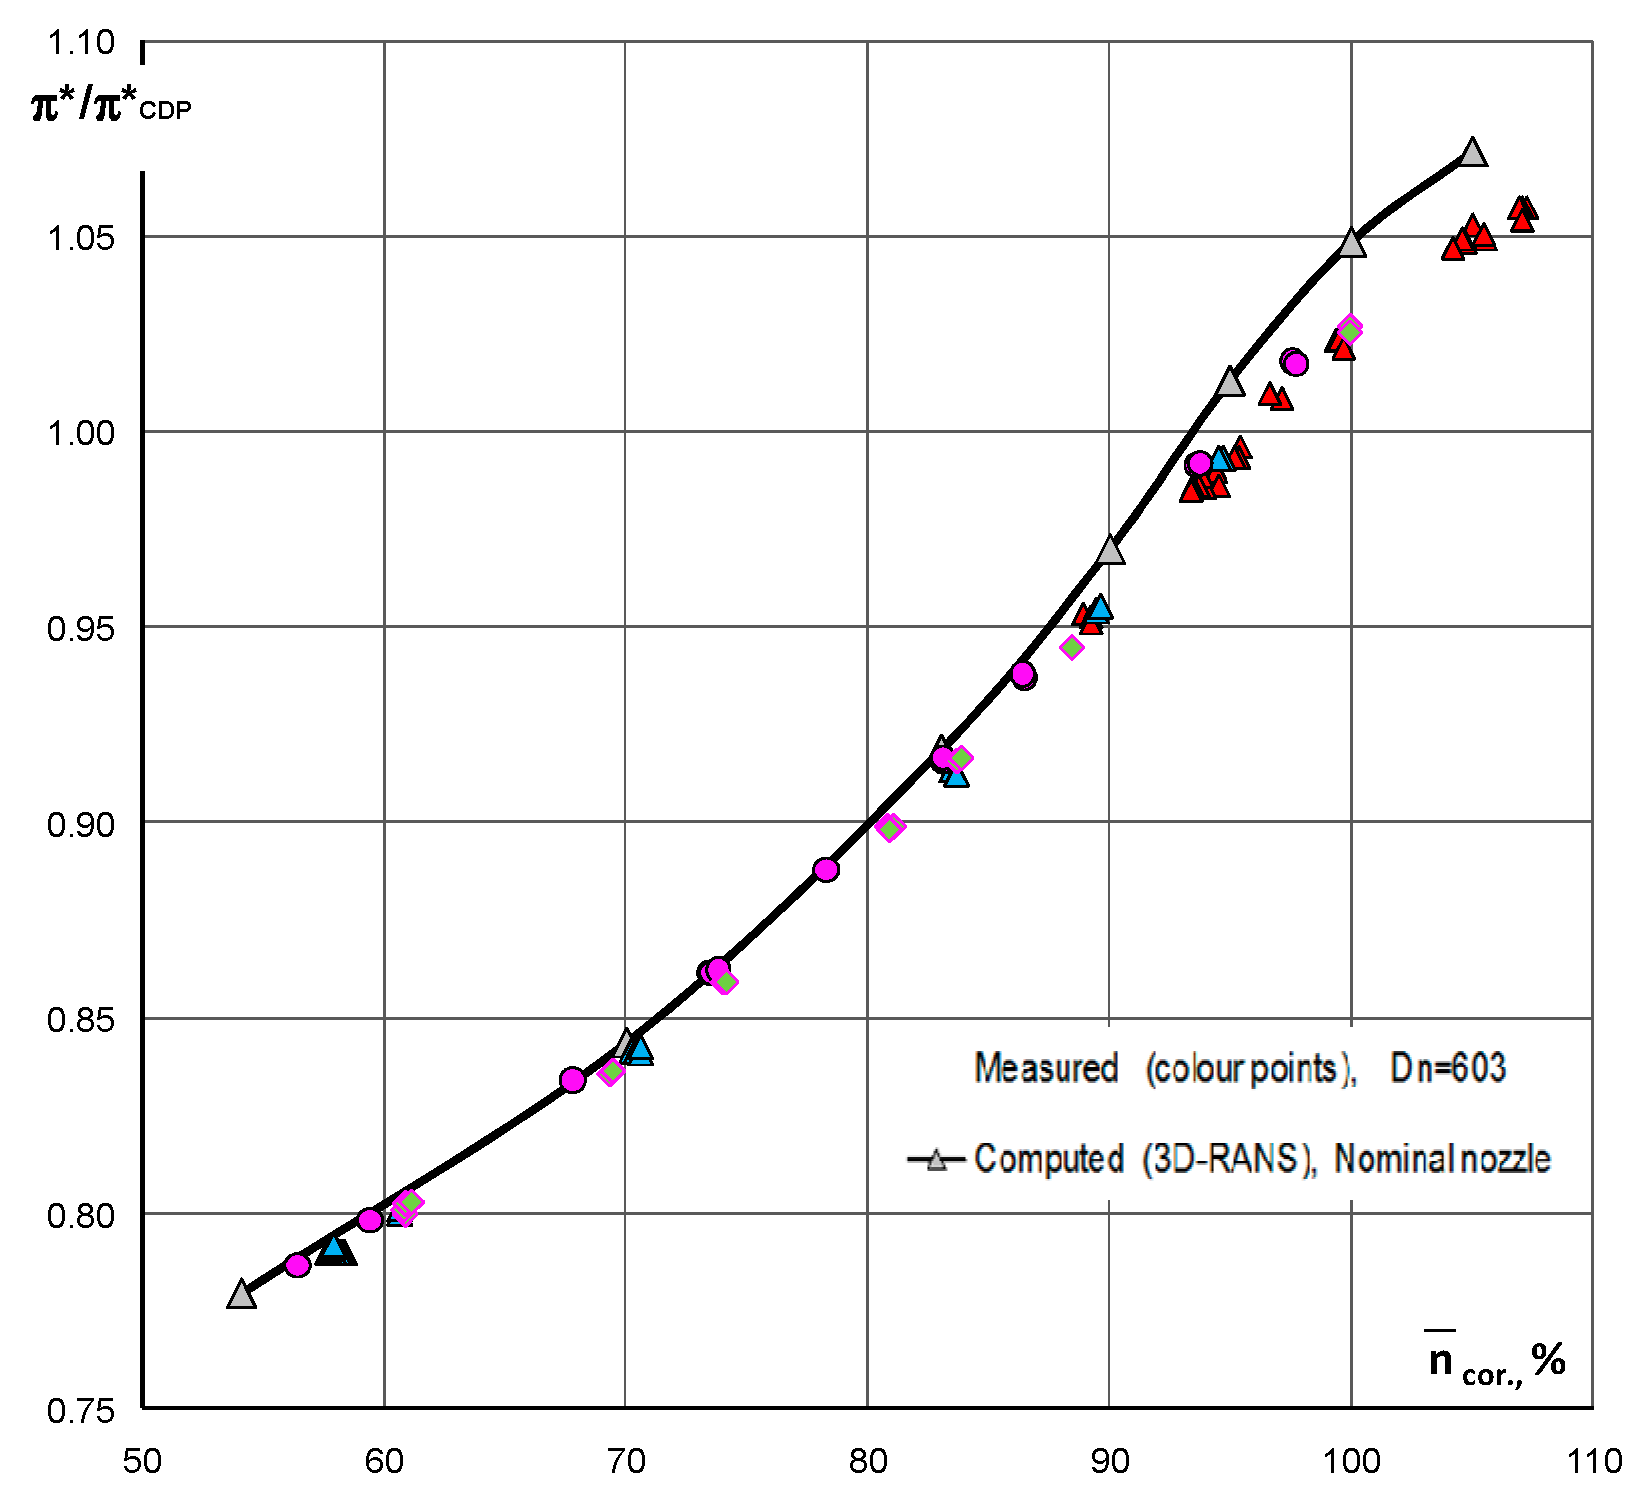
Spanwise distributions of total temperatures and total pressures and the two angles are specified at the inlet. At the outlet, the static pressure is specified from the radial equilibrium equation. No slip conditions are applied at the solid walls. Performance maps of the compressor are presented in dimensionless form in terms of pressure ratio (π*/π*CDP), adiabatic efficiency (η*ad/η*ad CDP), and corrected mass flow (Gcor/Gcor CDP) versus corrected speed ncor in Figure 10, Figure 11 and Figure 12. Computed and measured data are shown in Figure 10, Figure 11 and Figure 12 and give evidence of a good agreement at cor ≤ 92%. The comparison between computed and measured data at cor > 92% showed acceptable results (maximum error is lower than 2%). The different shaped and colored points (pink circles, blue triangles, etc.) on the graphs in Figure 10, Figure 11 and Figure 12 stand for different positions of bypass throttle device.
Figure 13, Figure 14 and Figure 15 show comparisons of local flow parameters. Figure 13a presents computed and measured spanwise distributions of pressure ratio, π*, at the R2 outlet at cor = 100% operating point along the flow passage height for three nozzles installed at the bypass duct outlet. Figure 13b shows distribution of adiabatic efficiency, η*ad, for the same operating point and nozzles.
The comparisons demonstrate a good agreement between computed and measured data for nominal and closed nozzle conditions (Dn = 603 mm and Dclose = 595 mm). For the open nozzle (Dopen = 618 mm), the agreement is acceptable (maximum error reaches 1.4%).
Figure 14 shows computed and measured flow angle distributions at R1 and R2 outlets along the flow passage height at decreased rpm (cor = 70%). These distributions also give evidence of a good agreement between computed and measured data.
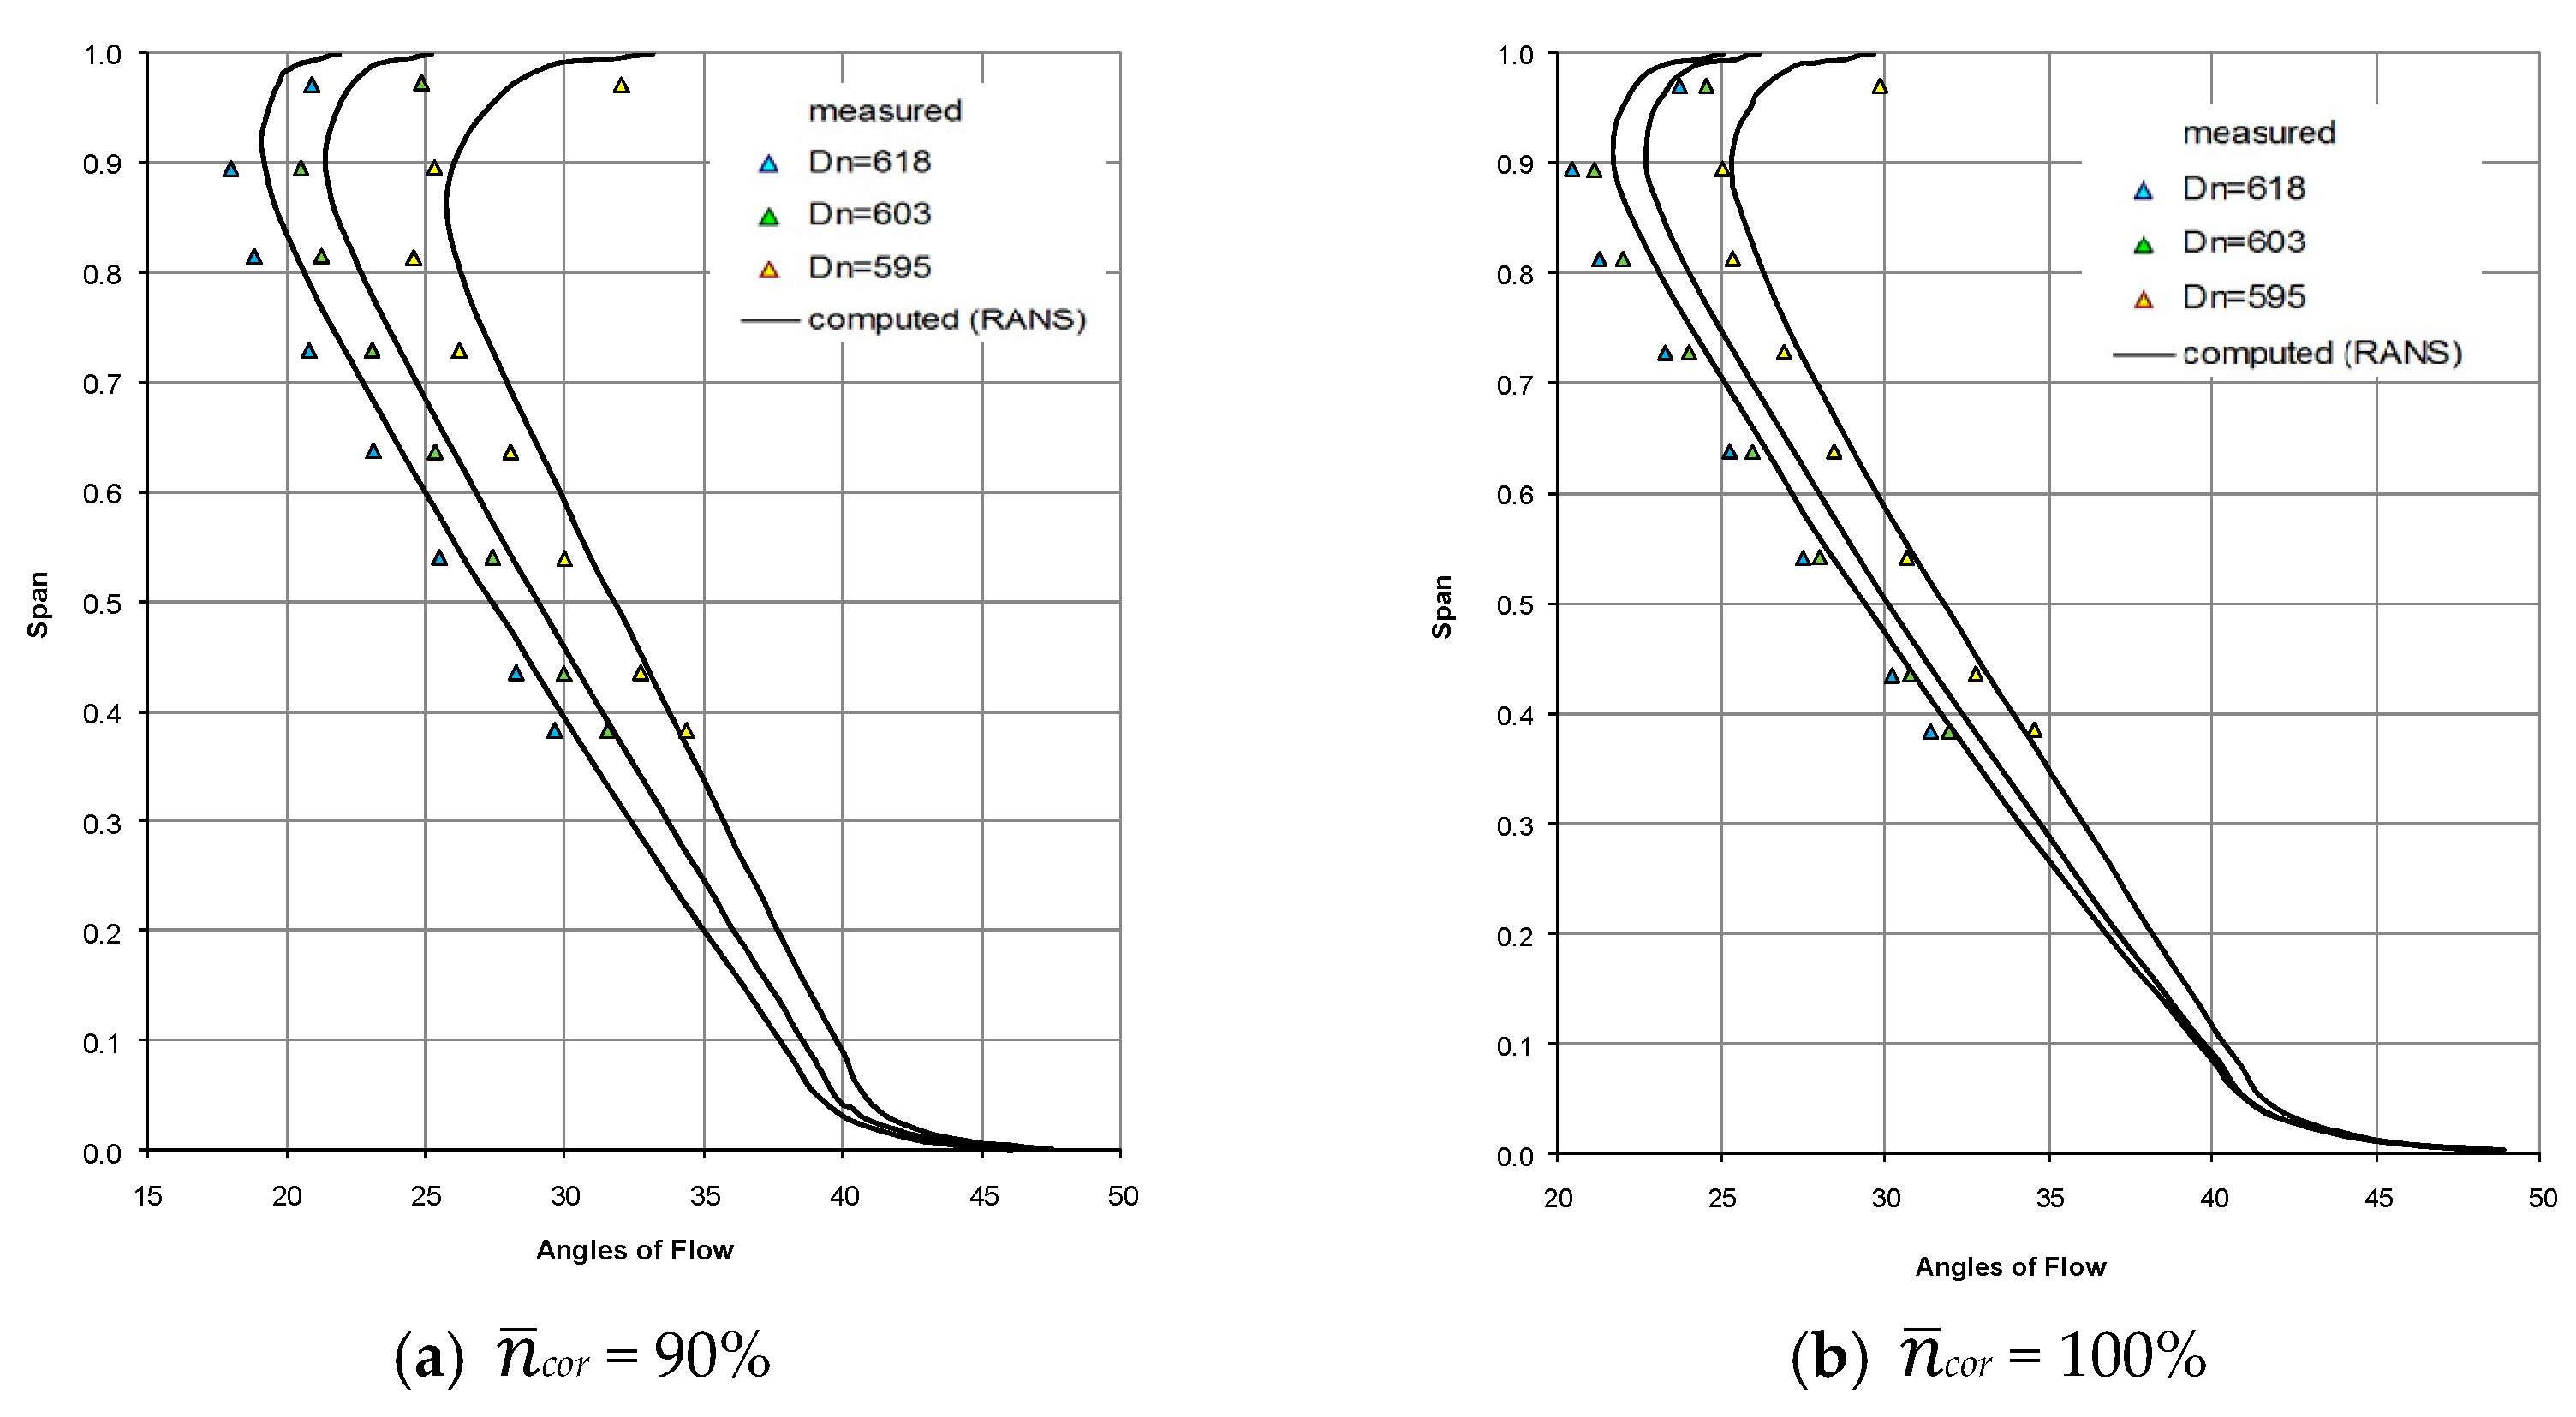
Figure 15a shows computed and measured distributions of flow angles at the R1 outlet along the flow passage height at the cor = 90% operating point for three nozzles of the CRTF1 bypass duct. Figure 15b presents the same dependences at cor = 100%. The analysis of these Figures shows a good agreement between computed and measured data for the closed nozzle (Dclose = 595 mm) at both rpms. The baseline nozzle (Dn = 603 mm) is characterized by a good agreement between measured and computed data only at cor = 90% and an acceptable one at cor = 100%. For the open nozzle (Dopen = 618 mm), the comparison shows an acceptable agreement between computed and measured data at both speeds (cor = 90% and cor = 100%). For this case, the maximum difference between computed and measured data was 2–3 degrees.
Since the design of the CRTF1 model and the computations of its characteristics were carried out with the mixing plane approximation, the comparisons gave some confidence in the validity of the mixing plane approximation to evaluate the CRTF performance and to design counter rotating fan rows. Unsteady effects caused by the interaction between R1 wake and R2, as well as the shock-wave interaction between R2 detached shock and R1, were not taken into account in the mixing plane approximation. Some differences between computed and measured data at cor > 92% are likely to be caused by nonlinear effects in definition of a hot-state blade geometry. Nonlinear effects are caused by spinning up the blades under the action of centrifugal and gas dynamic forces. Moreover, the effect of bypass ratio was not taken into account in the numerical model of the counter rotating fan due to the fact that the outlet boundary of the computational domain was located at the inlet of the divider between bypass and core ducts.
6. Simulation of an Inlet Distortion Influence on Fan Performance
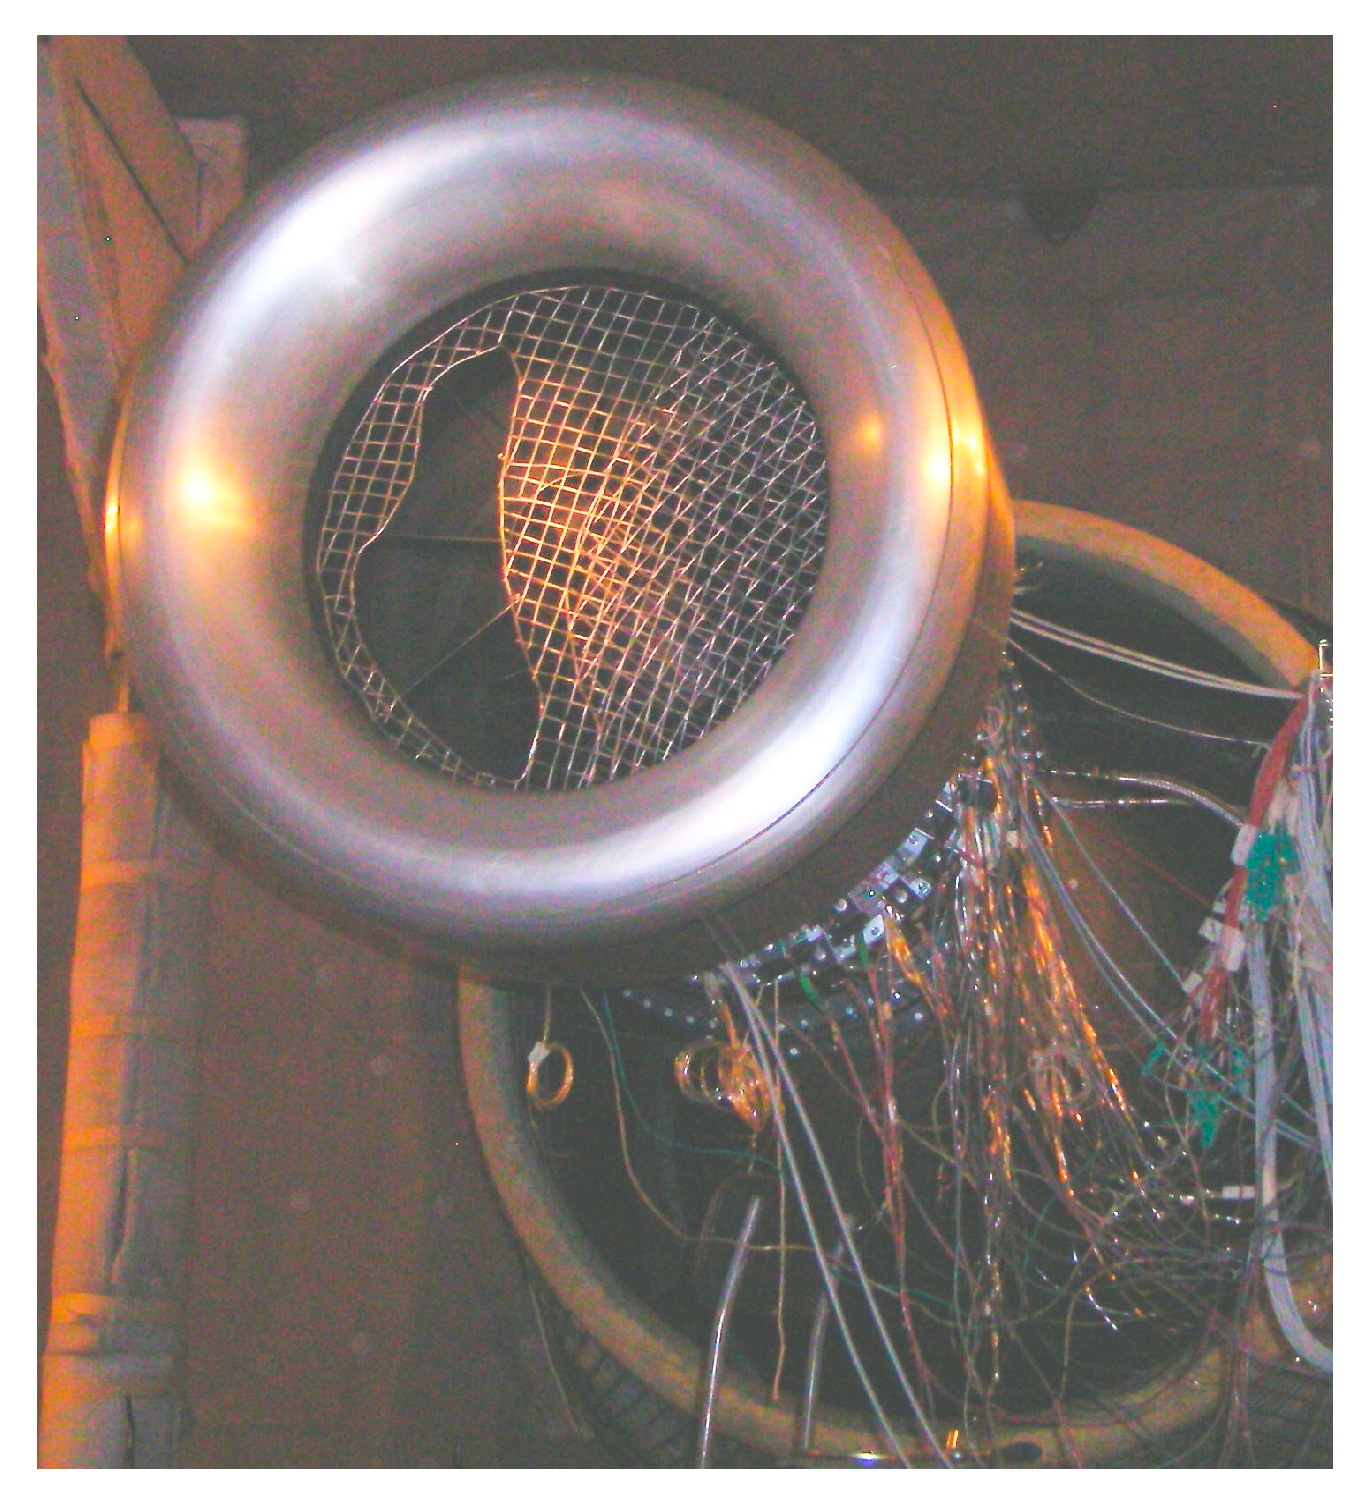
Upon completion of the VITAL program, CIAM continued to investigate in the C-3A test facility the influence of an inlet distortion on the CRTF performances. To simulate the flow distortion at the CRTF2A inlet with the help of screens, an intake duct with a special flow distortion simulator (the ring with fixed screens) was designed and manufactured [27]. Figure 16 shows a photo of the fan intake duct with the installed flow distortion device.
Total pressure fields were divided into zones, where changes in total pressure drop in the screen (σc) were not higher than 5%. To provide a required total pressure decrease in σc under preset fan operating conditions, the screen with an “effective” cross-section was selected for any zone.
Figure 17 shows a schematic diagram to illustrate the combinations of shading screens used to simulate an inlet flow distortion at take-off. The total pressure field was divided into three zones. The shading screen was not installed in Zone 1 characterized by σ = 0.99 and denoted with a red line boundary. The shading screens with the relative “effective” cross-section area equal to Sscreen = 0.86 were used in Zone 2 characterized by σ = 0.95 as well as in Zone 3 (σ = 0.92). In Zone 3, the screen with Sscreen = 0.86 was covered by the screen with the same “effective” cross-section (Sscreen = 0.86). As a result, the total area of the “effective” cross-section in Zone 3 was Sscreen = 0.72.
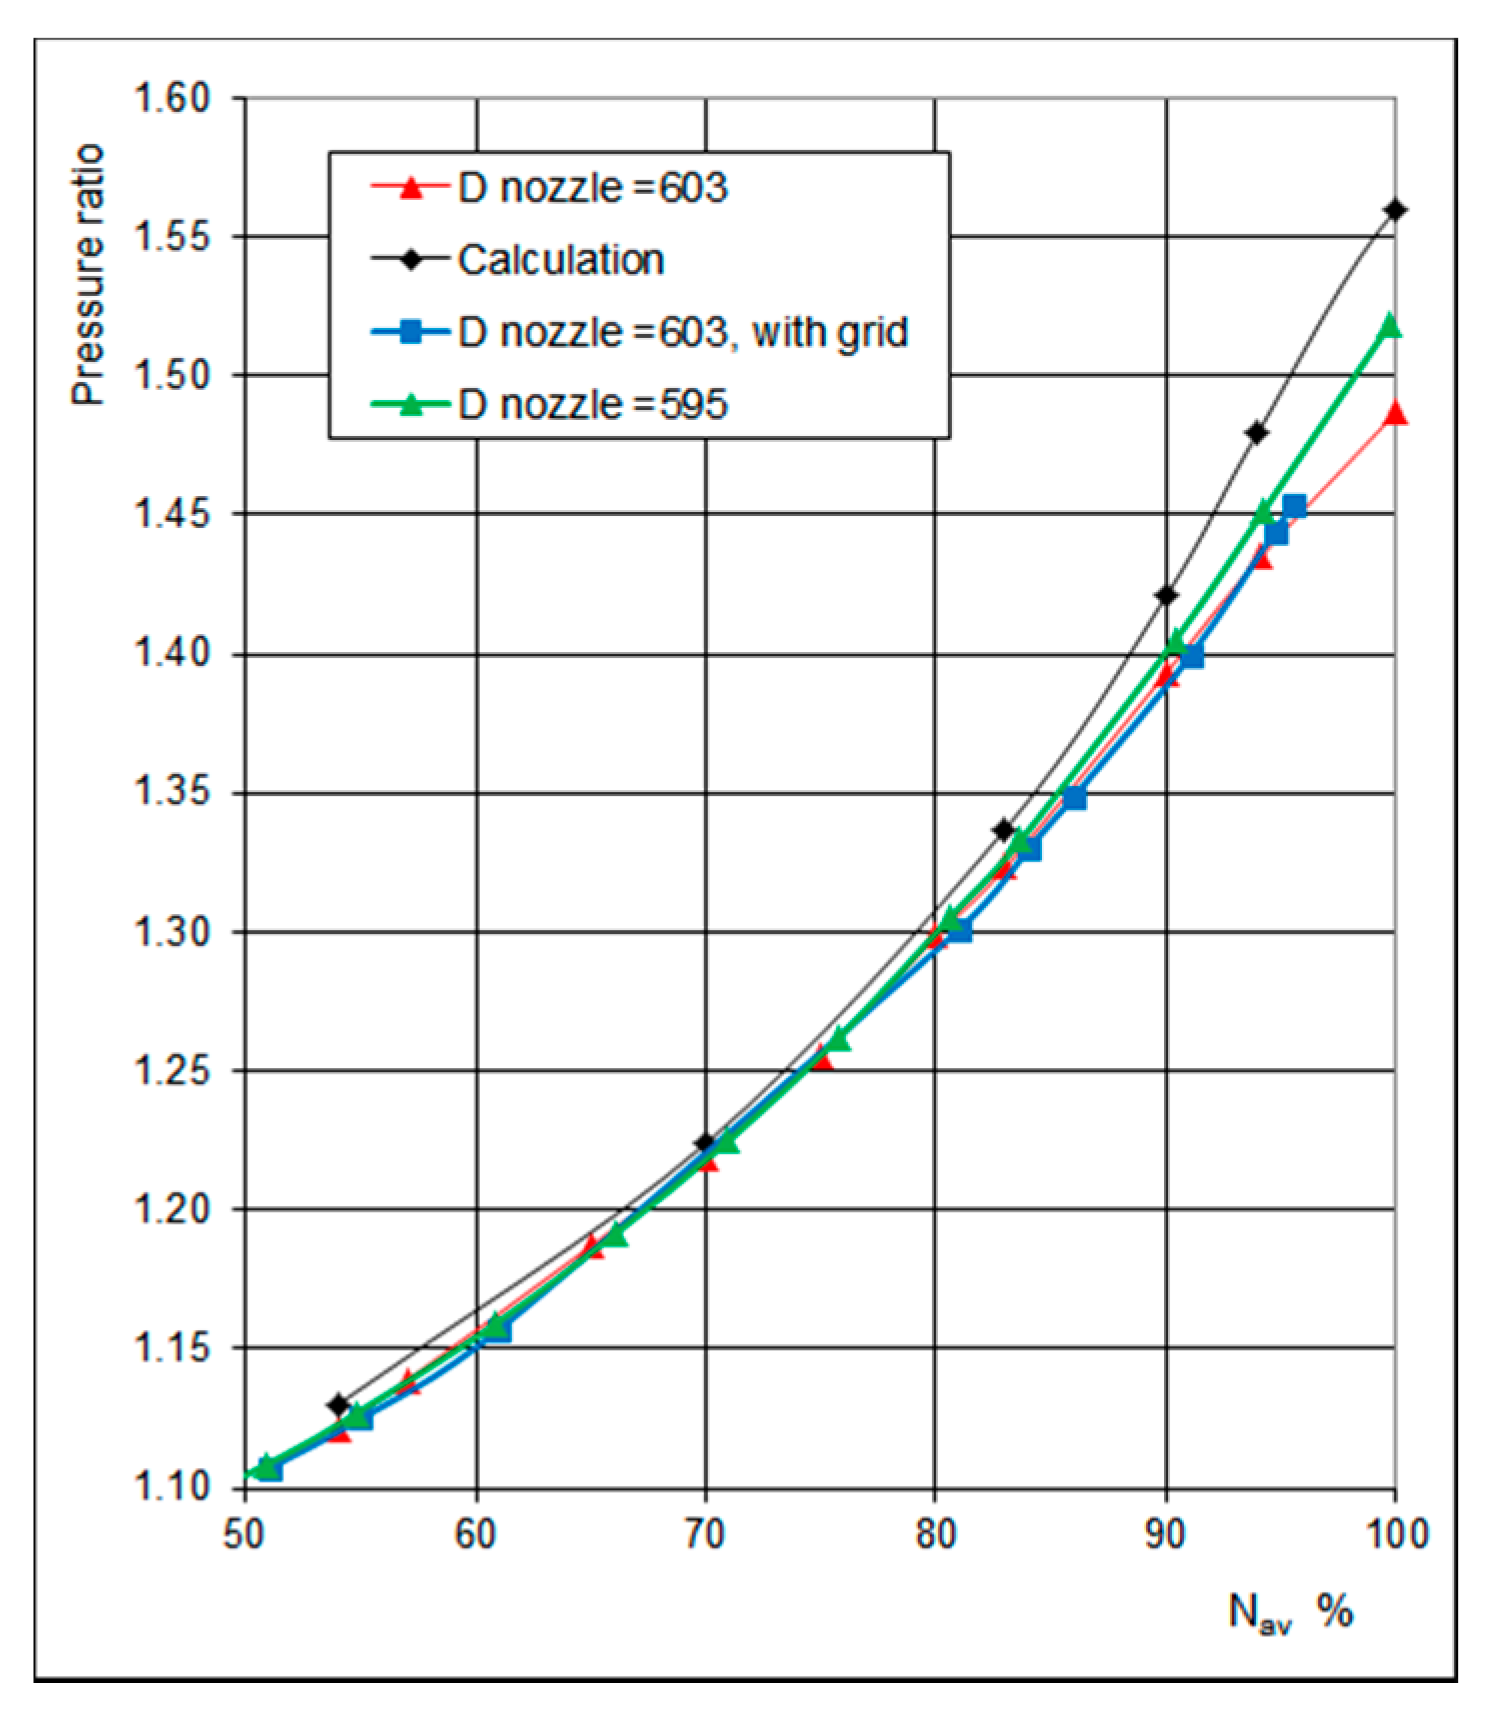
Figure 18, Figure 19, Figure 20 and Figure 21 show the basic overall aerodynamic characteristics of the fan found by experimental tests with a non-uniform air flow at the inlet and a nominal nozzle with 603 mm outlet diameter [27]. For comparison, these graphs also report test results with uniform air flow at the CRTF2A inlet and nozzles with Dn = 603 mm and Dclose = 595 mm outlet diameters. The results of preliminary calculations are also presented there. All data shown in Figure 18, Figure 19, Figure 20 and Figure 21 were calculated for the uniform flow approximation at the inlet. There are no noticeable differences in total pressure ratio for the CRTF2A with uniform and non-uniform air flow at the inlet at the same rotational speed, Nav. The throttling effect on the fan is compensated by a decrease in total pressure ratio in the non-uniform flow at the fan inlet. Figure 19 shows the effects of the rotational speed on the mass flow. It can be seen that the results of the fan with the nominal nozzle (Dn = 603 mm) at the outlet and with non-uniform air flow at the inlet agree well with those of the fan with the closed nozzle (Dclose = 595 mm) and with uniform air flow at the inlet. In this case, the flow distortion device decreases the total airflow in the fan with the nominal nozzle by 1.0–1.5 kg/s at constant rotational speed, Nav.
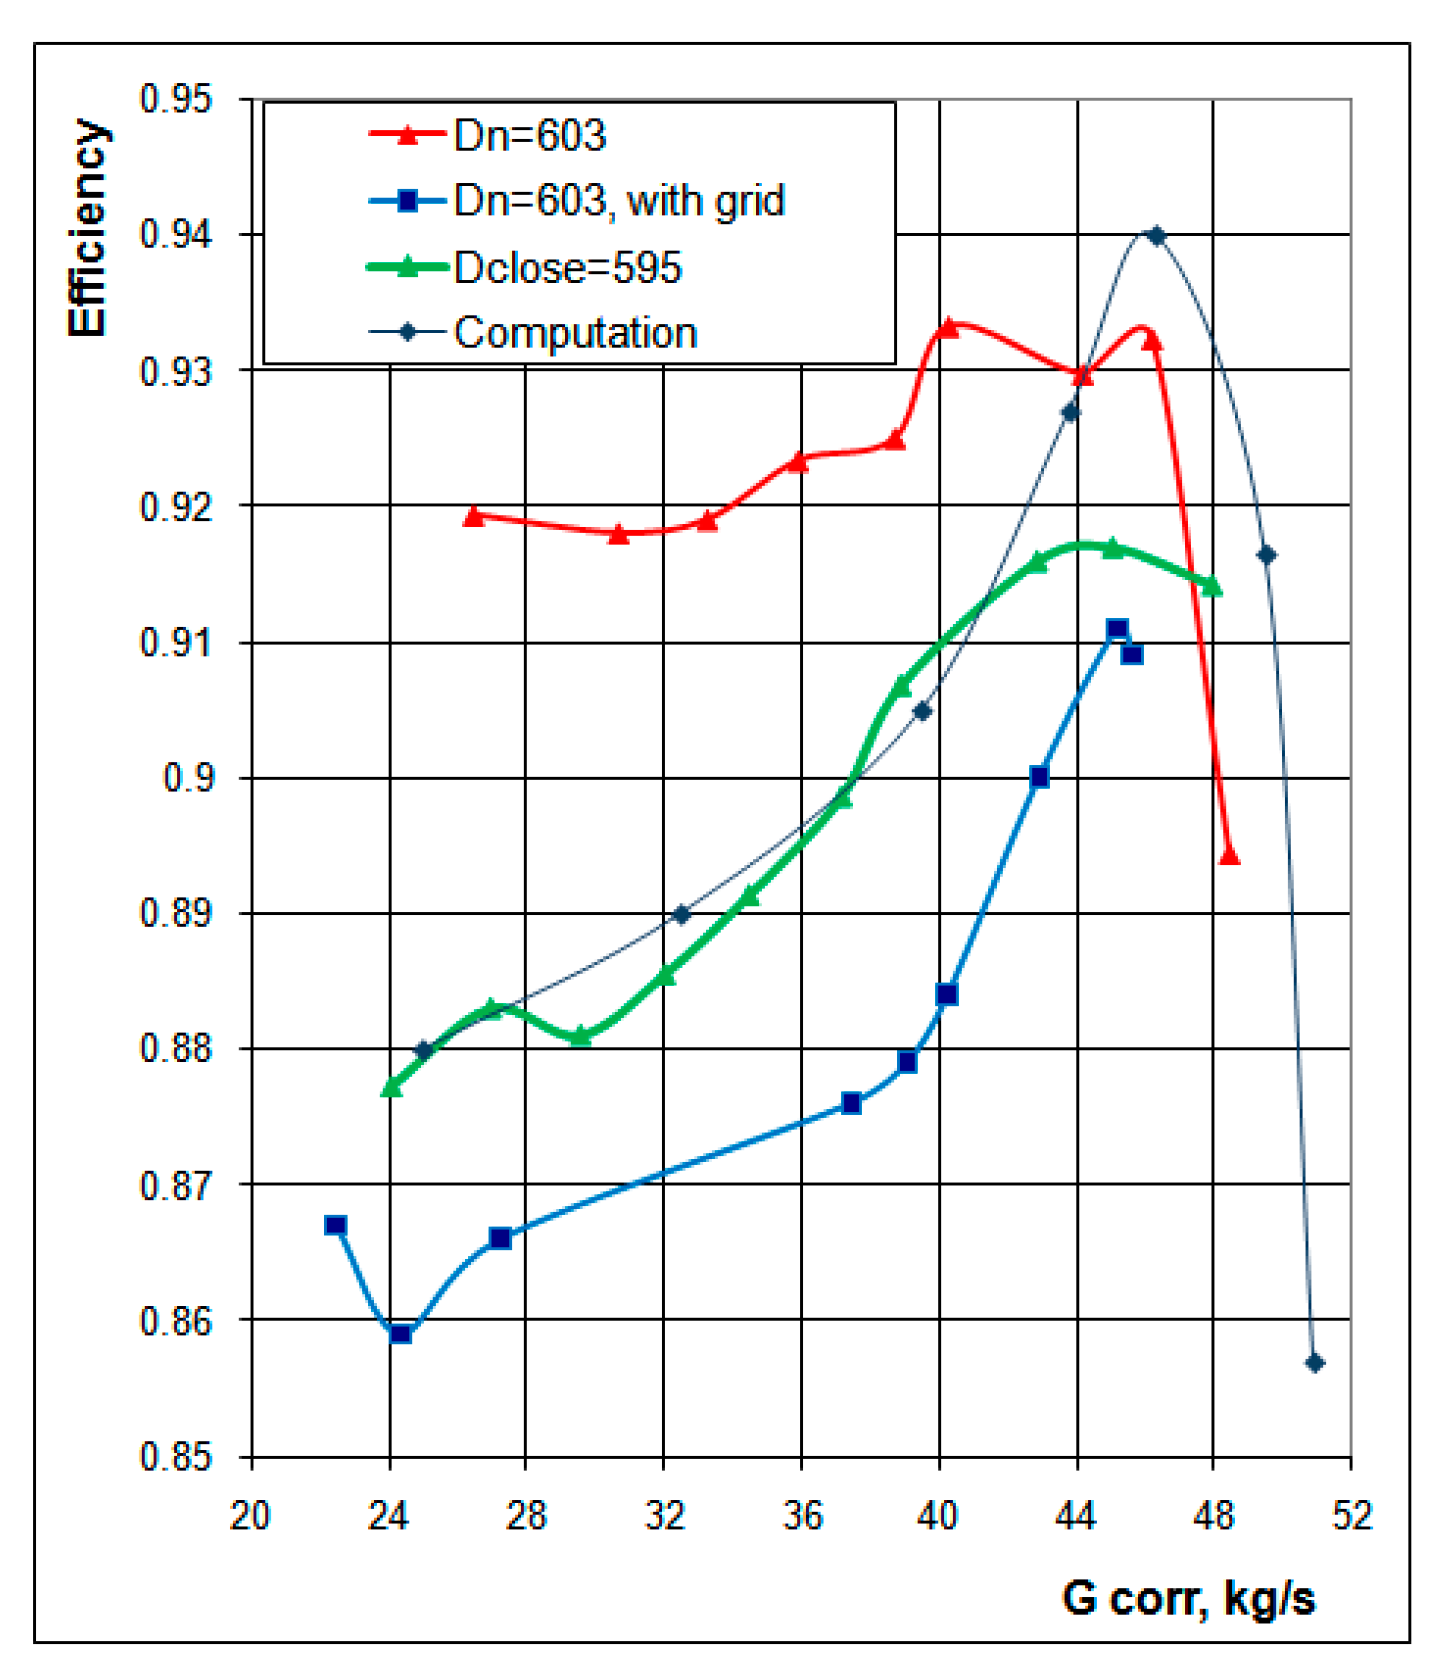
Figure 20 and Figure 21 show the dependence of the total pressure ratio, π*, and of the adiabatic efficiency, η*ad, from the total air flow, Gcor The operating line for the fan with the nominal nozzle (Dn = 603 mm) and non-uniform flow at the inlet is almost coincident with the operating line of the fan with the closed nozzle (Dclose = 595 mm) and uniform flow at the inlet. Conversely, the η*ad (Gcor) curve for the fan with the nominal nozzle and non-uniform flow at the inlet show lower values (2–2.5%) compared to the fan with the same nozzle and uniform flow at the inlet. For the fan with the closed nozzle and uniform flow at the inlet those differences reduce (0.7–2.5%).
It is worth nothing that Brailko et al. in 2010 [27] presented numerical and experimental investigations of the influence of an air flow distortion arising at the inlet of an aircraft engine on the performance of the CRTF2A counter rotating model fan in three basic operating conditions (take-off, climb, approach).
Basic characteristics of the fan along the operating line were found in the range of rotational speeds from 50% to 95%. The investigations showed that the total pressure ratio, π*, for uniform and non-uniform inlet flow did not change at all rotational speeds, while a decrease in the total air flow, Gcor, of 1–1.5 kg/s was observed. The total pressure ratio, π*, for non-uniform flow increased by 1.5–2.0% and the fan adiabatic efficiency, η*ad, decreased by 1.0–2.0% at the same air flow.
7. The “Green Engine” Concept. TheC-3A Test Facility Designed for Acoustic, Aerodynamic and Material Strength Investigations of Single Rotor Fan Models
To analyze the aerodynamic and acoustic fan performance of present-day and future turbofans, CIAM developed a family of model prototypes of these fans designed for different tip speeds ranging from Utip = 400 m/s to Utip = 315 m/s (Table 1) [24,25,28].
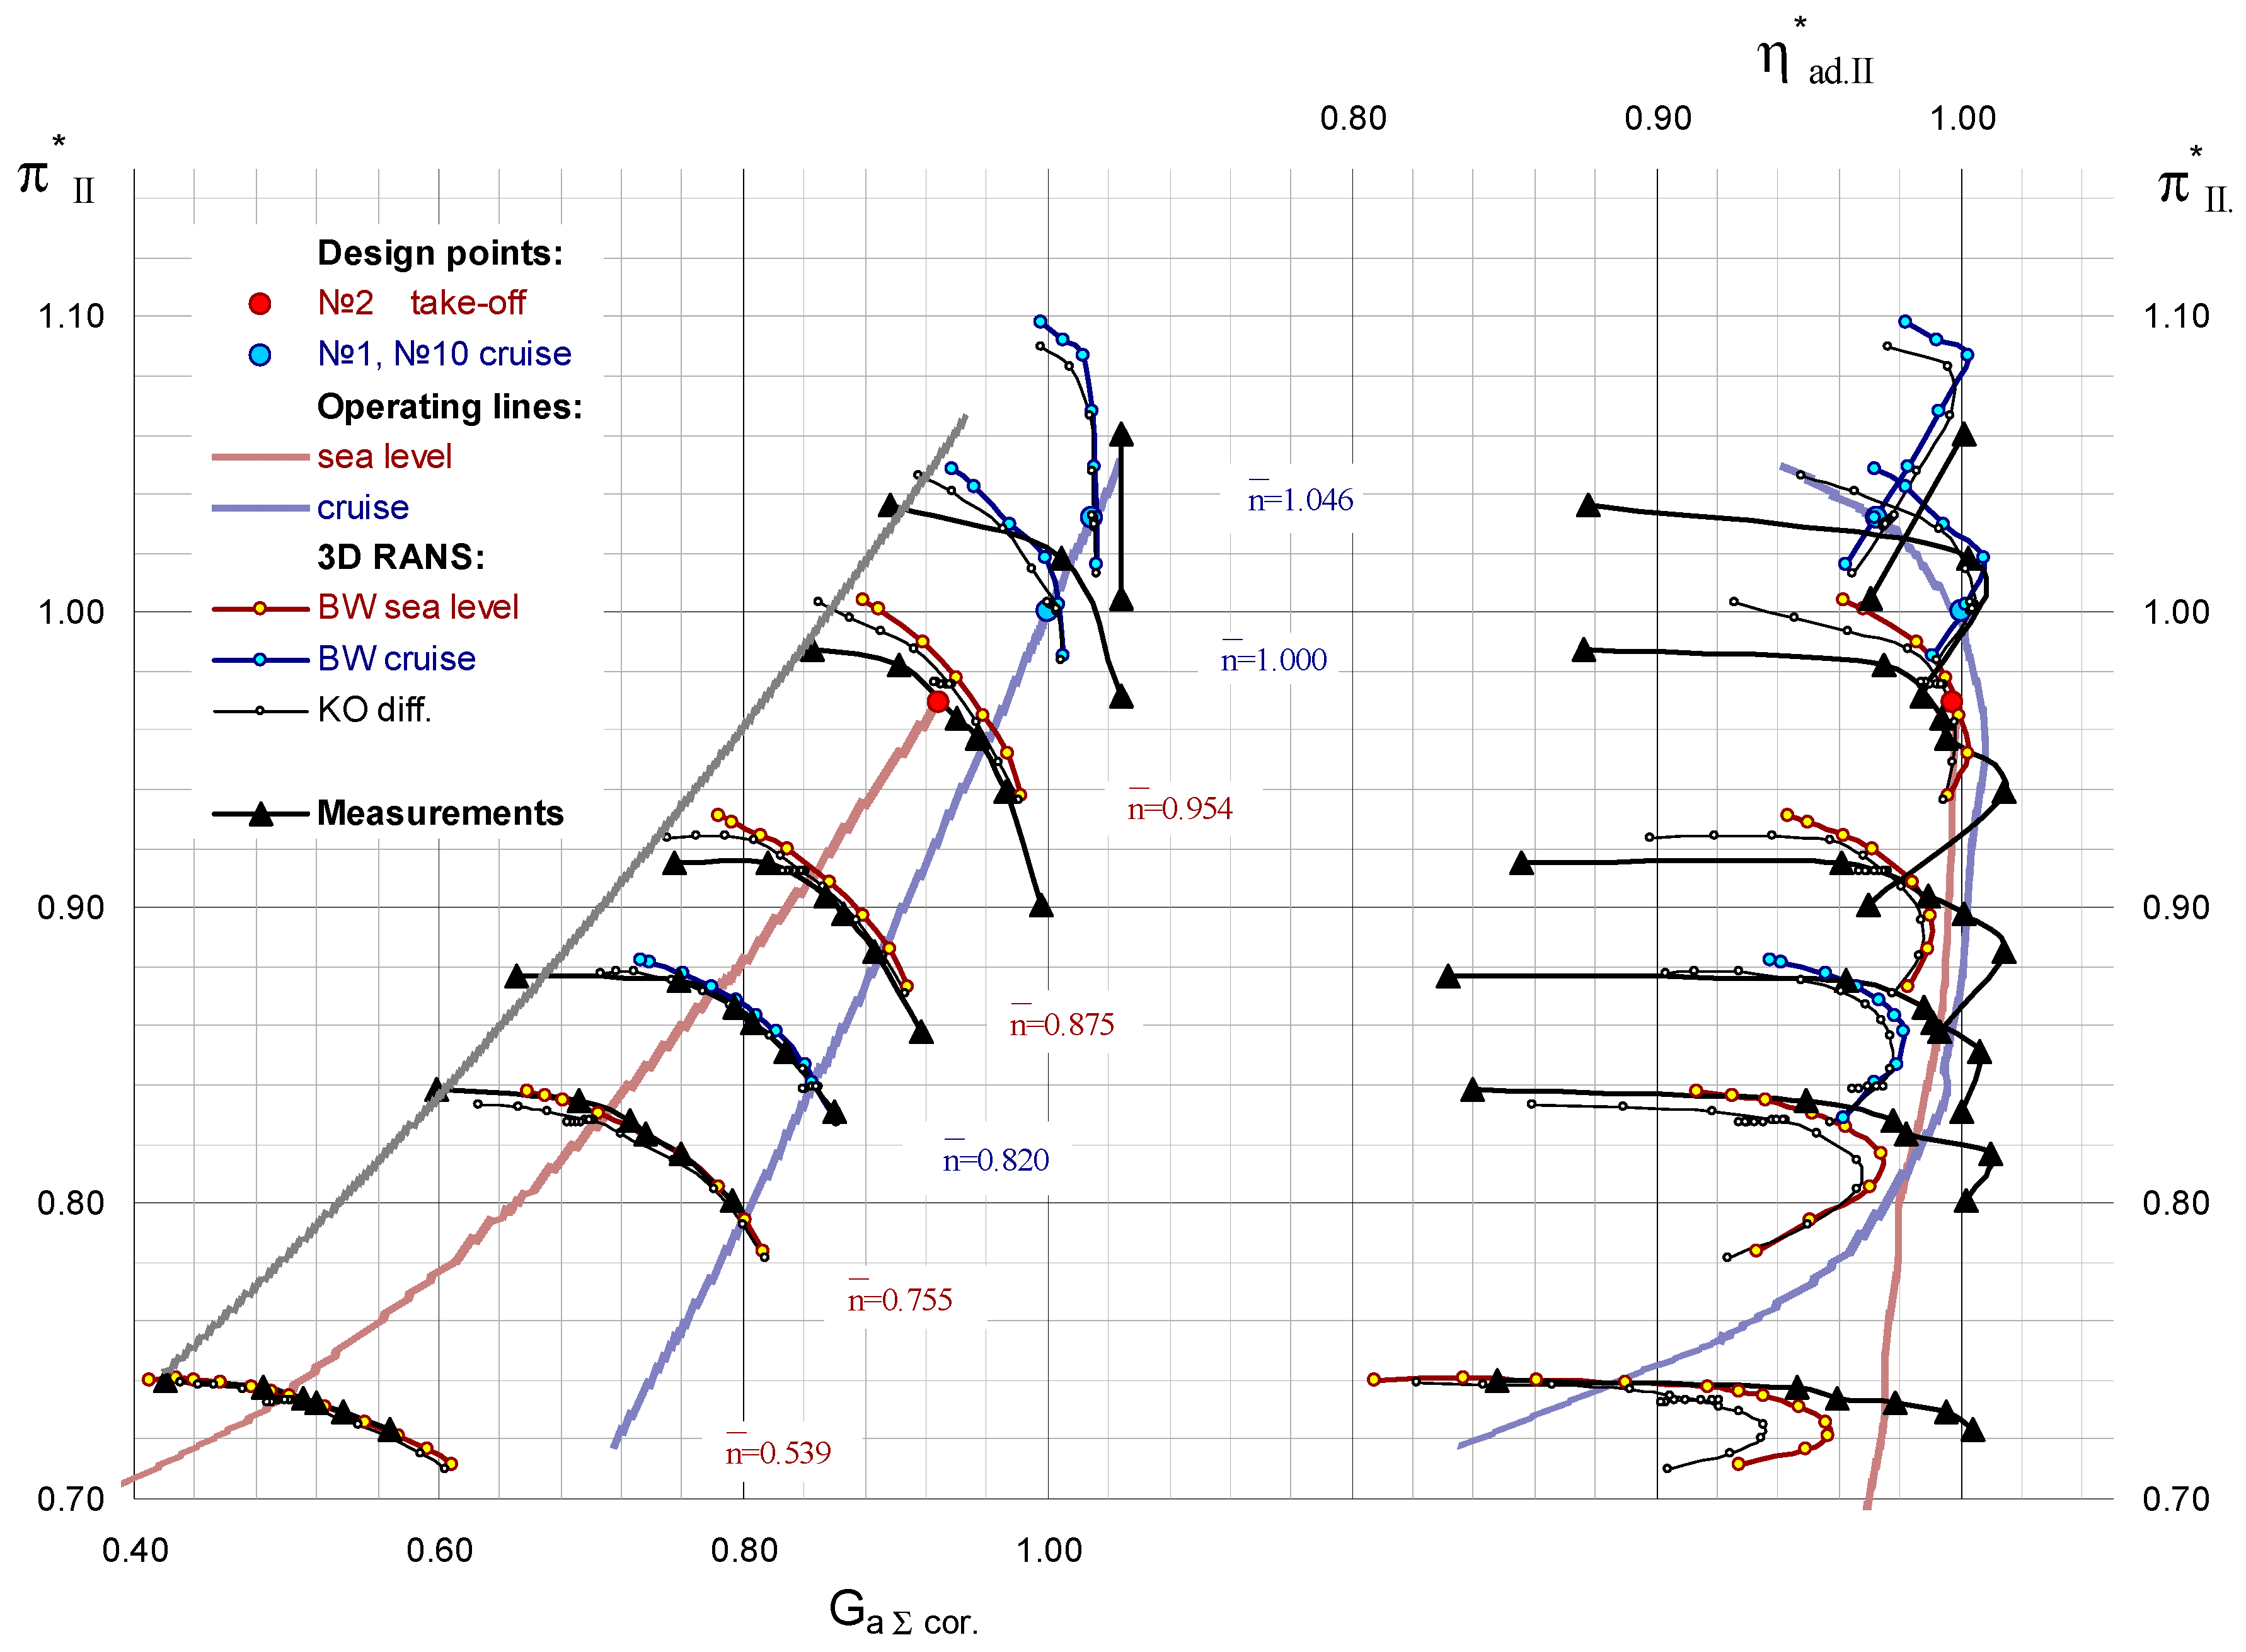
Test results of the C180-2 stage (Utip = 396.2 m/s, bypass total pressure ratio π* = 1.54, Gcor/Ffr area = 192 kg/sm2) were normalized with the full-scale fan dimensions. Based on test results, it was decided to test a full-scale fan of an advanced engine as a scaled down rotor of the C180-2 module (Figure 22).
The data measured during the tests of the C180-2 stage at the C-3A test facility demonstrate a good agreement between calculated and experimental data for the bypass duct pressure ratio, corrected air flow, and stall margin (see Figure 23). The comparison of calculated and experimental efficiency shows a fair agreement at high rotational speeds ( ≥ 0.95). The calculated efficiency values are lower than the experimental data at reduced rotational speeds. The difference in efficiency at = 0.539 is higher than 4%. The key reason for this difference is attributed to the turbulence model which fails at the description of flows with high incidence angles at leading edges of blade rows.
8. The “Green Engine” Concept. The C-3A Test Facility Designed for Acoustic
The Advisory Council for Aviation Research in Europe (ACARE) has defined new scientific and development tasks for the aviation industry as set forth in the Strategic Research and Innovation Agenda (SRIA) published in September 2012 (ACARE 2020—2008 Addendum to the Strategic Research Agenda, www.acare4europe.org). The perceived noise emission of a flying aircraft should be reduced by 50% in 2020 and by 65% in 2050 (Table 2).
To meet the ACARE strict noise requirements in 2020–2050, CIAM developed a new-generation acoustic test facility—the C-3A. The facility with its anechoic chamber was designed to develop various advanced fan configurations, i.e., traditional, counter rotating, and geared. The main advantage of the C-3A test facility is the possibility to simultaneously carry out acoustic measurements in the front and rear hemispheres of test article.
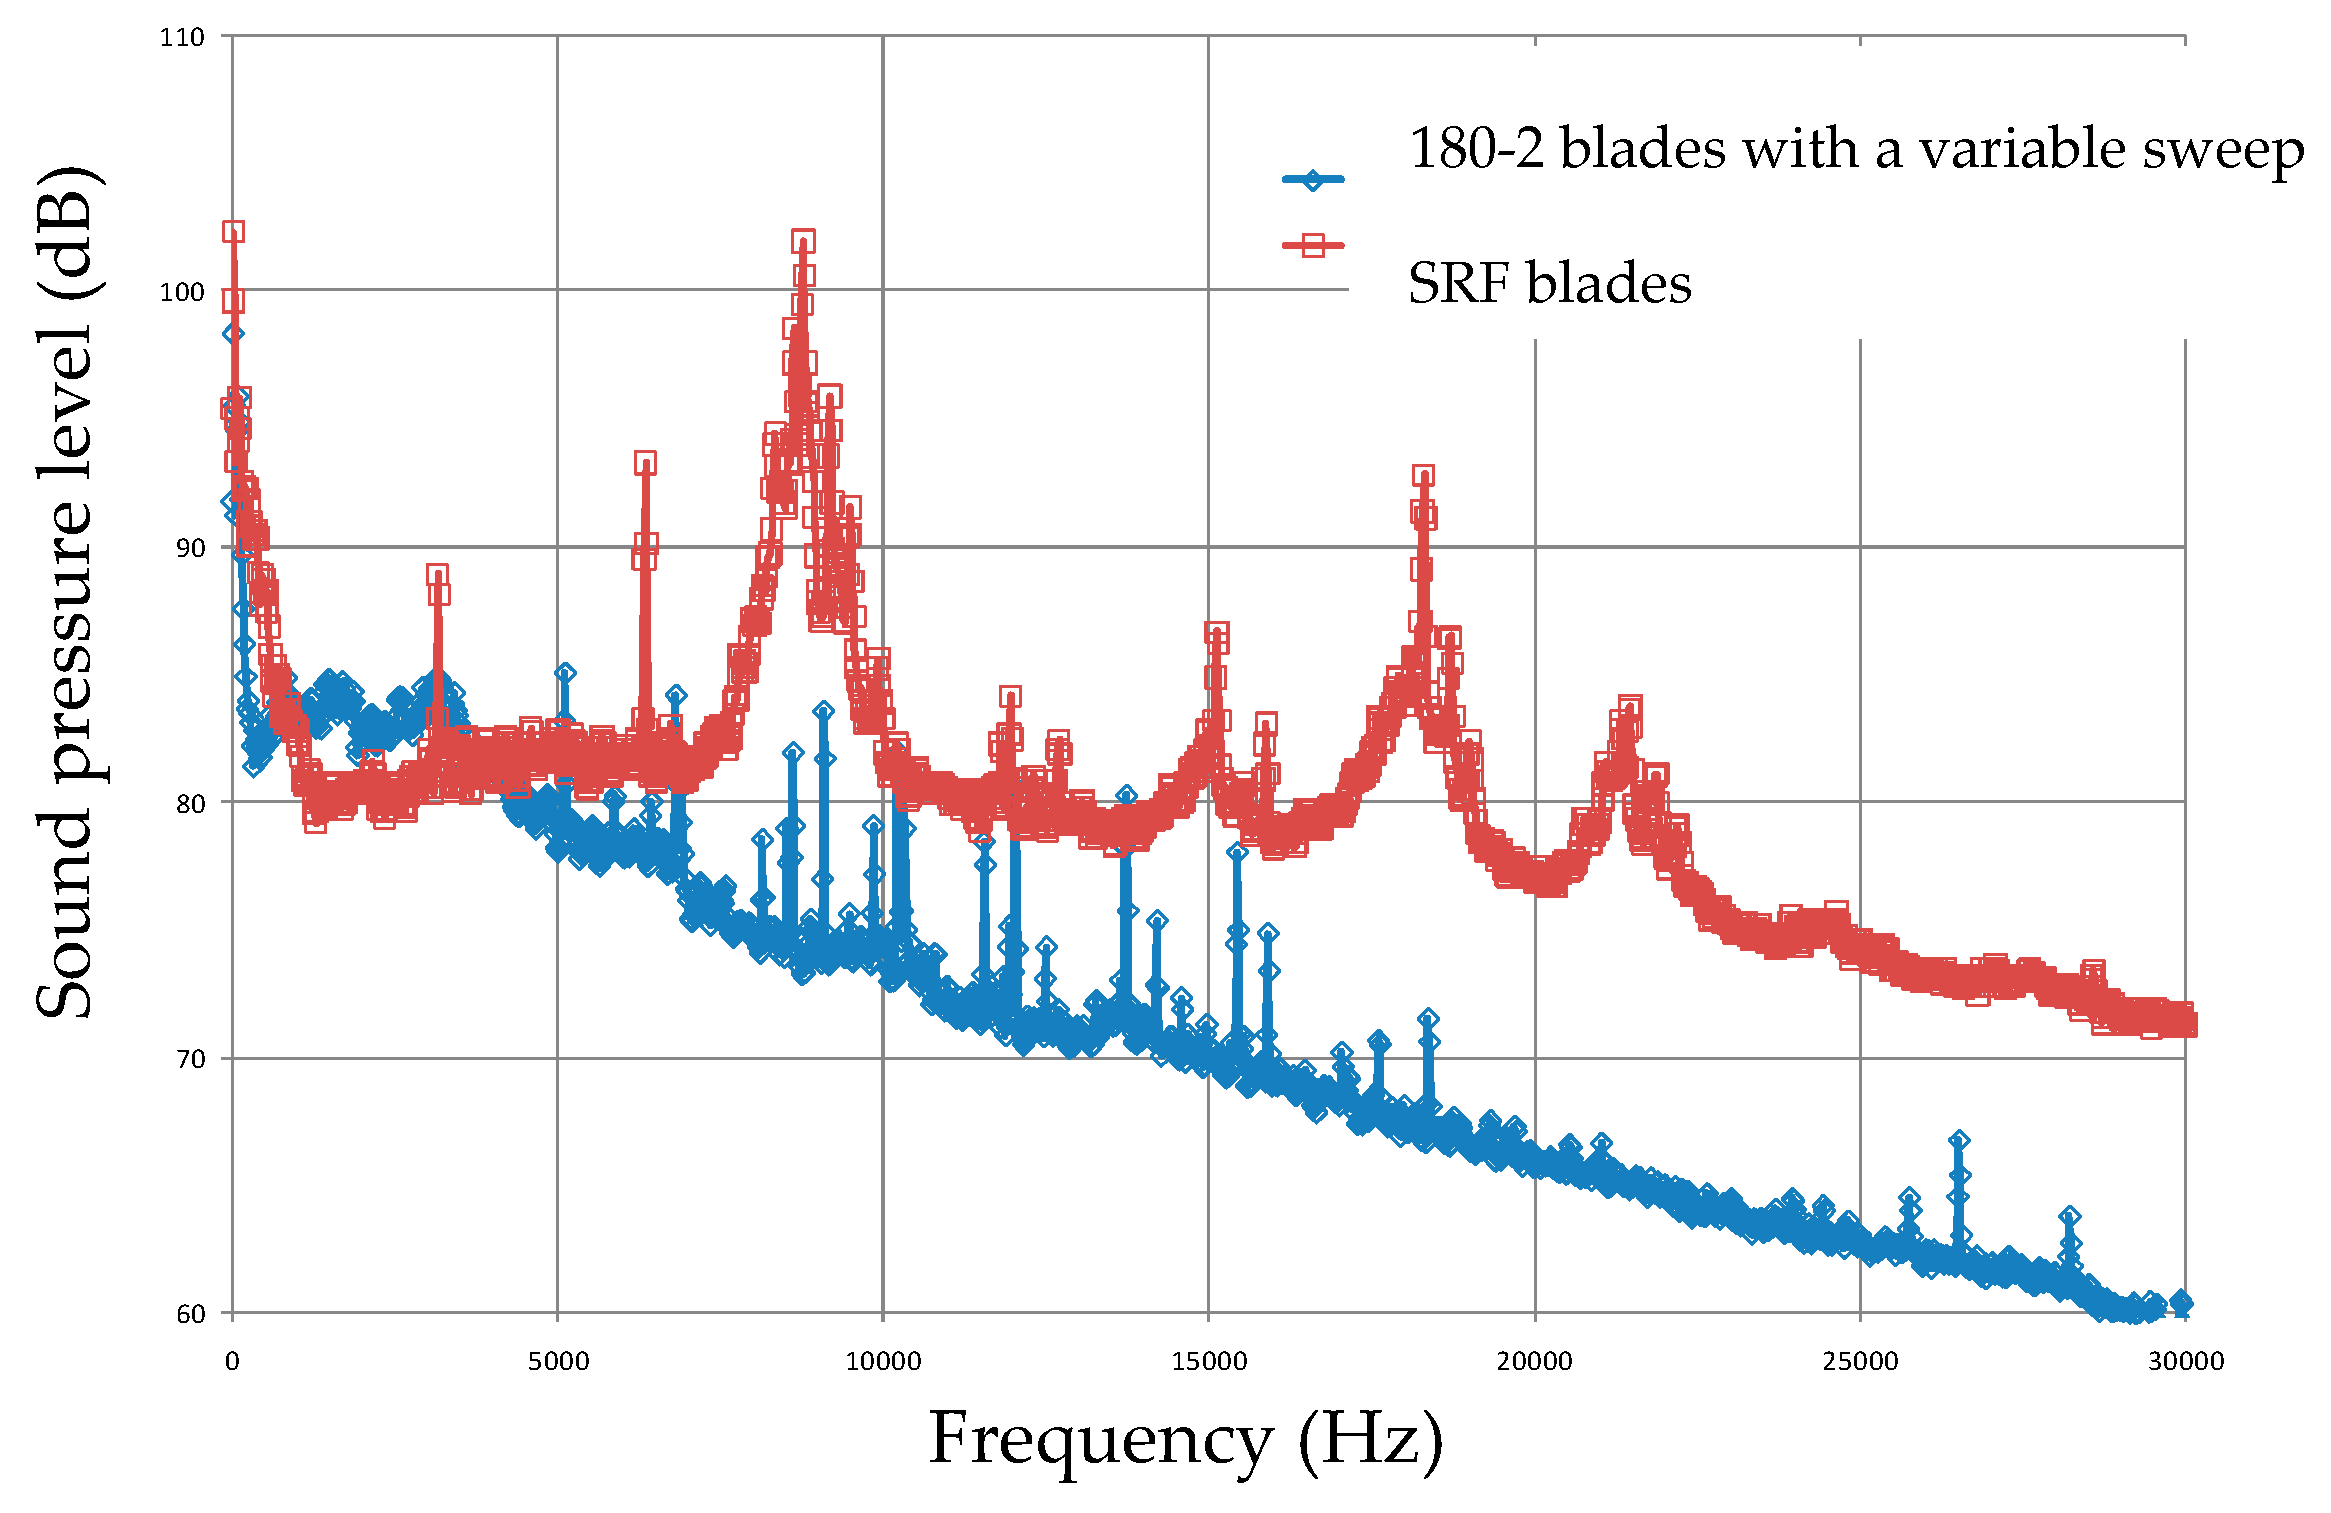
This test facility can allow special acoustic investigations aimed at the fan noise reduction at a source. This would primarily concern the study of the influence of the stator vane and rotor blade shapes on the noise generation [8,9]. Figure 24 and Figure 25 show two bypass fan models—C180-2 and SRF. Figure 26 shows a fan noise reduction due to the application of a variable sweep blade in comparison with a radial blade of SRF model fan for the CFM56-7B engine selected in the VITAL program as a reference engine.
Comparison of spectra in Figure 26 reveals better acoustic characteristics for the C180-2 fan model due to a decreased number of blades (Z = 18 as compared with Z = 24 for SRF UPS) as well as a more advanced blade shapes with variable sweep.
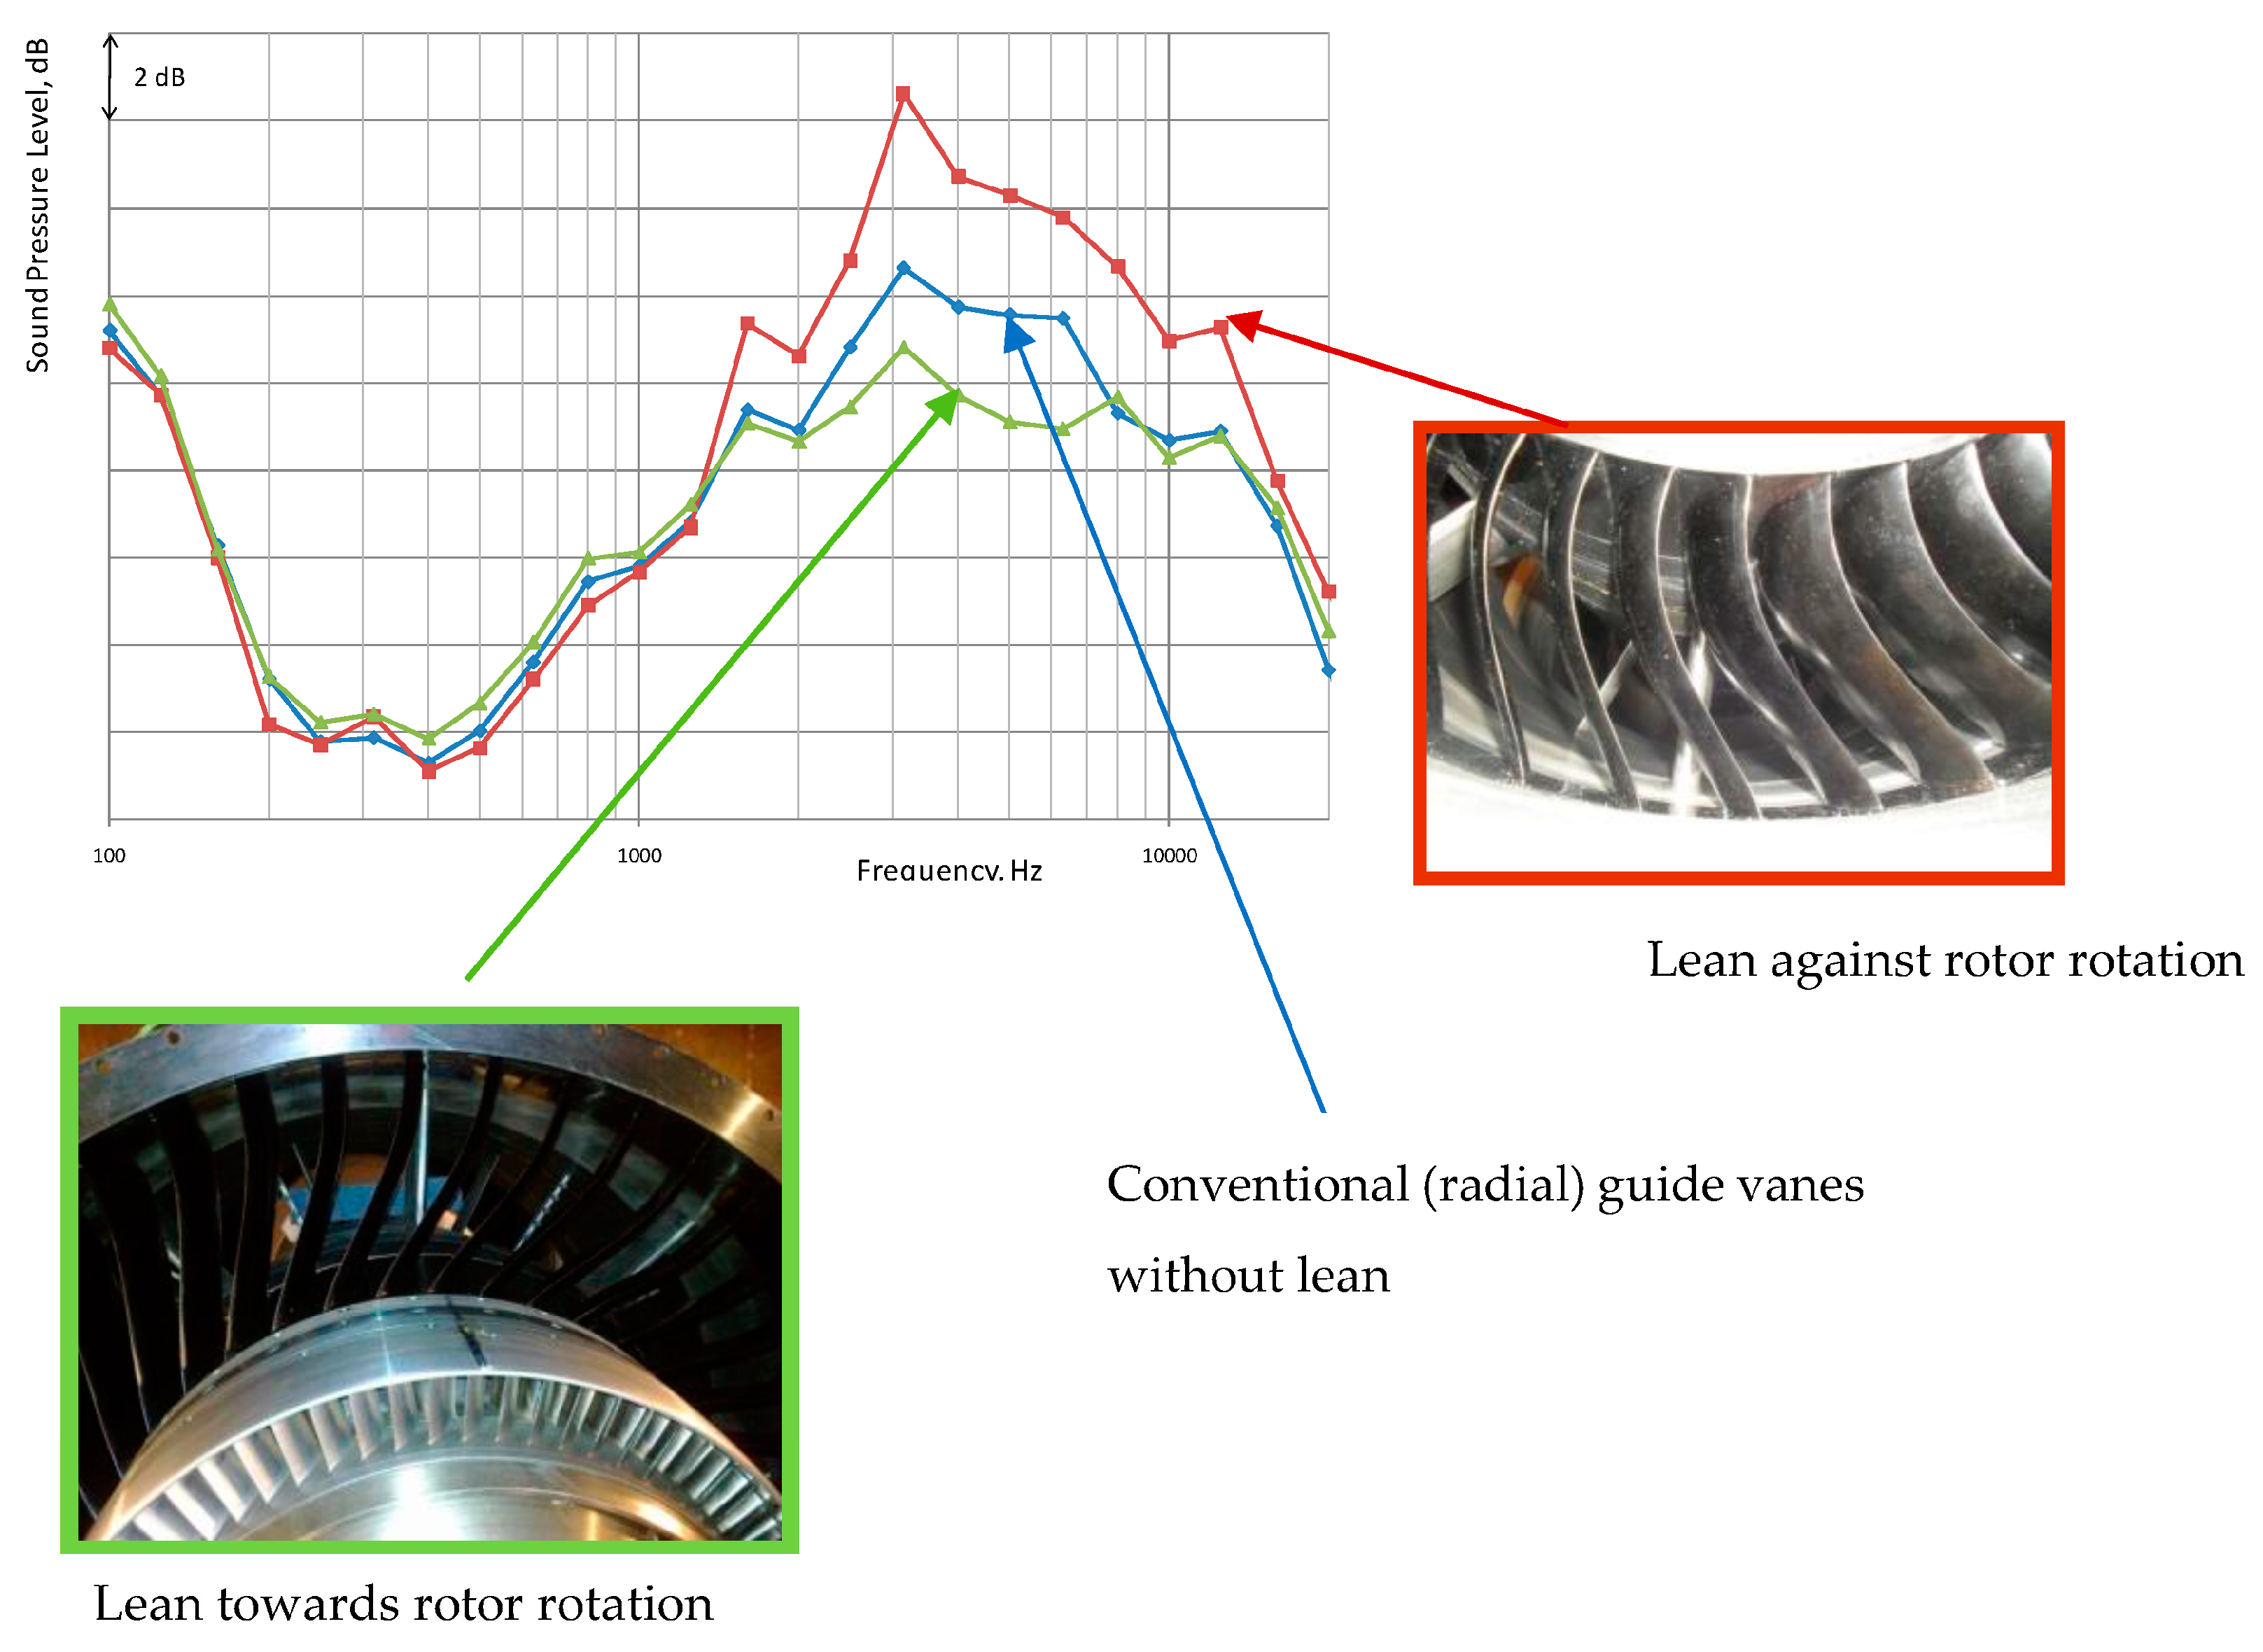
Another strategy to be explored in the green engine concept development is the use of swept and inclined stator vanes in the bypass duct [8,9,29]. Experimental investigations of the C180-2 fan model conducted at the C-3A test facility showed that the noise reduction at the source was dependent on the bypass duct guide vanes swept in the meridional direction and inclined in the circumferential direction. Figure 27 presents the results of acoustic studies for three versions of the bypass duct guide vanes in the C180-2 stage. The tests demonstrated a decrease in the tonal noise of the model fan (with 1:3 scaling factor) of 1 ÷ 3 dB within the whole frequency range.
CIAM carried out a test campaign in the C-3A test facility with the anechoic chamber with the objective of developing a noise reduction technology for turbojet fans based on leaned guide vanes. According to the experimental tests, this technology is extremely promising especially in the configuration with guide vanes leaned in the direction of the rotor rotation (Version 2) in the rear hemisphere within 3–8 kHz for the approach mode. For example, tones on the harmonics of the fan blade passing frequency decreased by 5 dB while broadband component decreased by 2 dB.
9. Numerical and Experimental Investigations of Different Casing Treatments (CT) with the Aim of Noise Reduction at a Source Keeping the Same Gasdynamic Performance
For many years, CIAM has been developing methods and means of widening the stable operation range of gas turbine engine (GTE) axial flow compressor basing on systematic experimental and theoretical studies of the phenomena preceding the flow instability and progressing after that [8,9,26]. The main source of experimental data was tests of model stages of different configuration: supersonic stages with a small dimensionless Dhub/Dtip hub diameter (0.3–0.45), subsonic stages with a large hub diameter (0.75) as well as high-pressure stages with a low aspect ratio blades.
These studies resulted in the conceptual design of the casing treatment (CT) intended to prevent the growth of local flow separation occurring on the stage flowpath.
The CT design is based on the following components:
- A slot spacer located above the inlet part of the stage rotor;
- An attached ring covering the slotted spacer.
An approximate method for the selection of optimal values of the CT geometrical parameters was developed at CIAM [26]. The method was used to design CT to be tested on axial flow compressors under operation.
The CRTF2A counter rotating model was chosen as test article. The CT was manufactured and tested upon completion of the VITAL program.
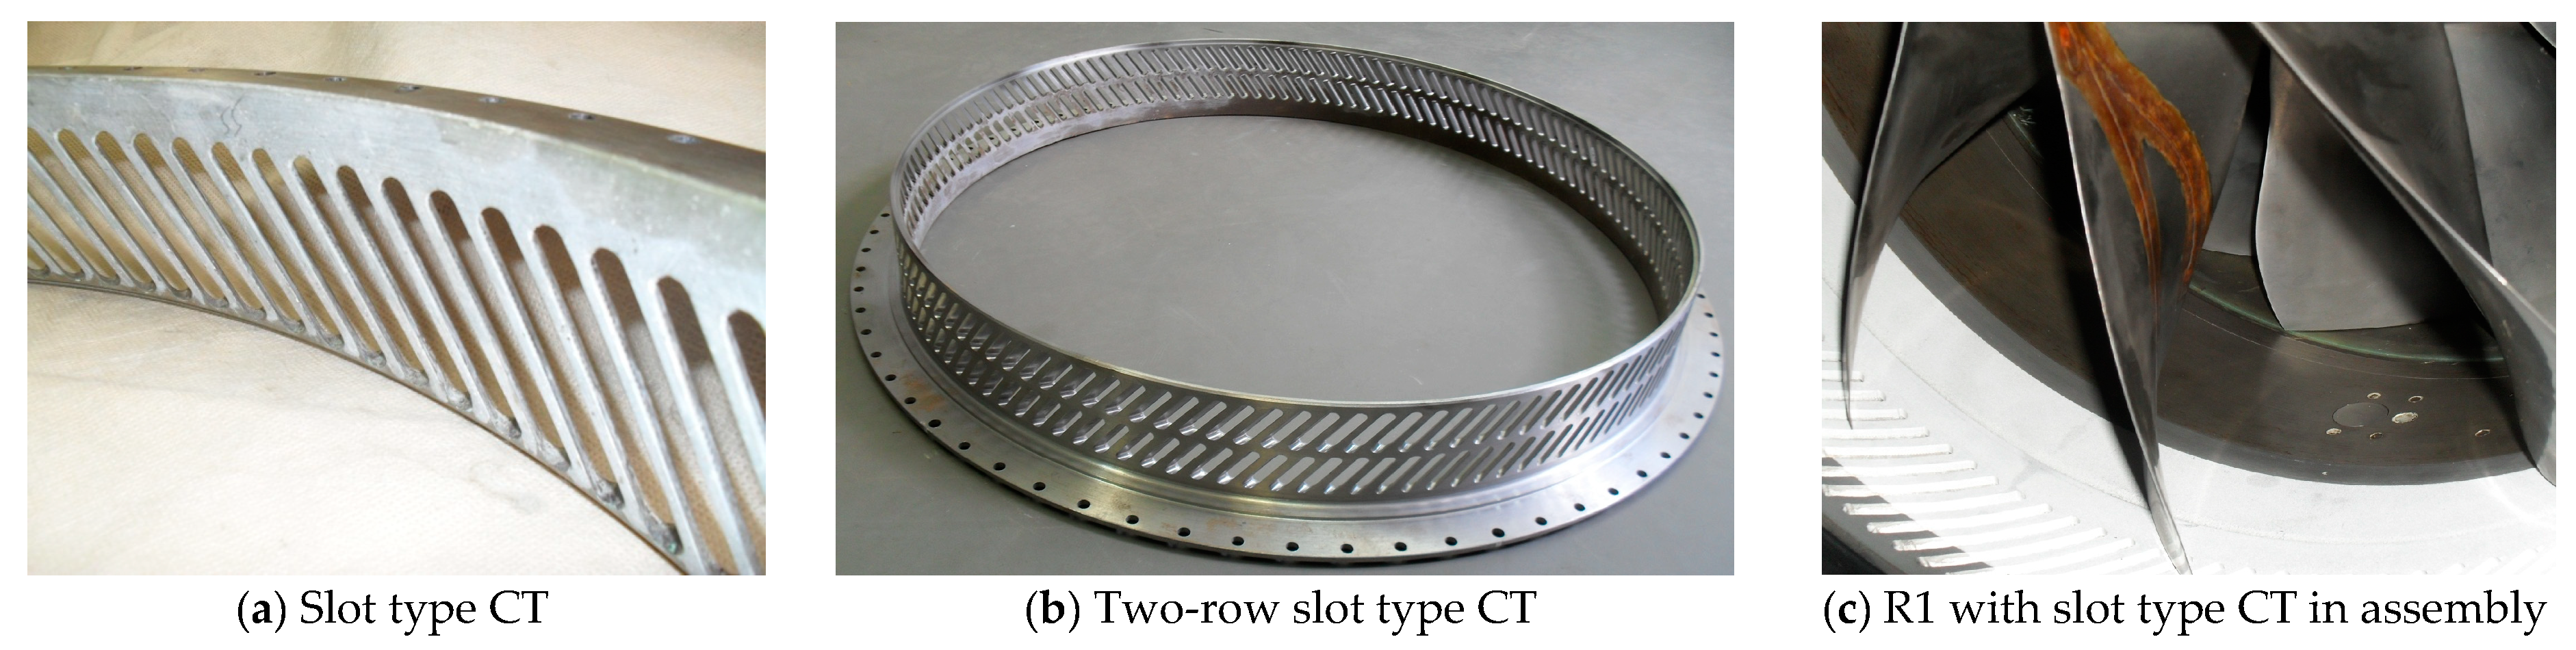
Figure 28 shows the layout of the CRTF2A model fan with the CT1 installed above R1 (the first stage rotor) and the CT2 installed above R2 (the second stage rotor). Both slot-type CTs and their general views are presented in Figure 29.
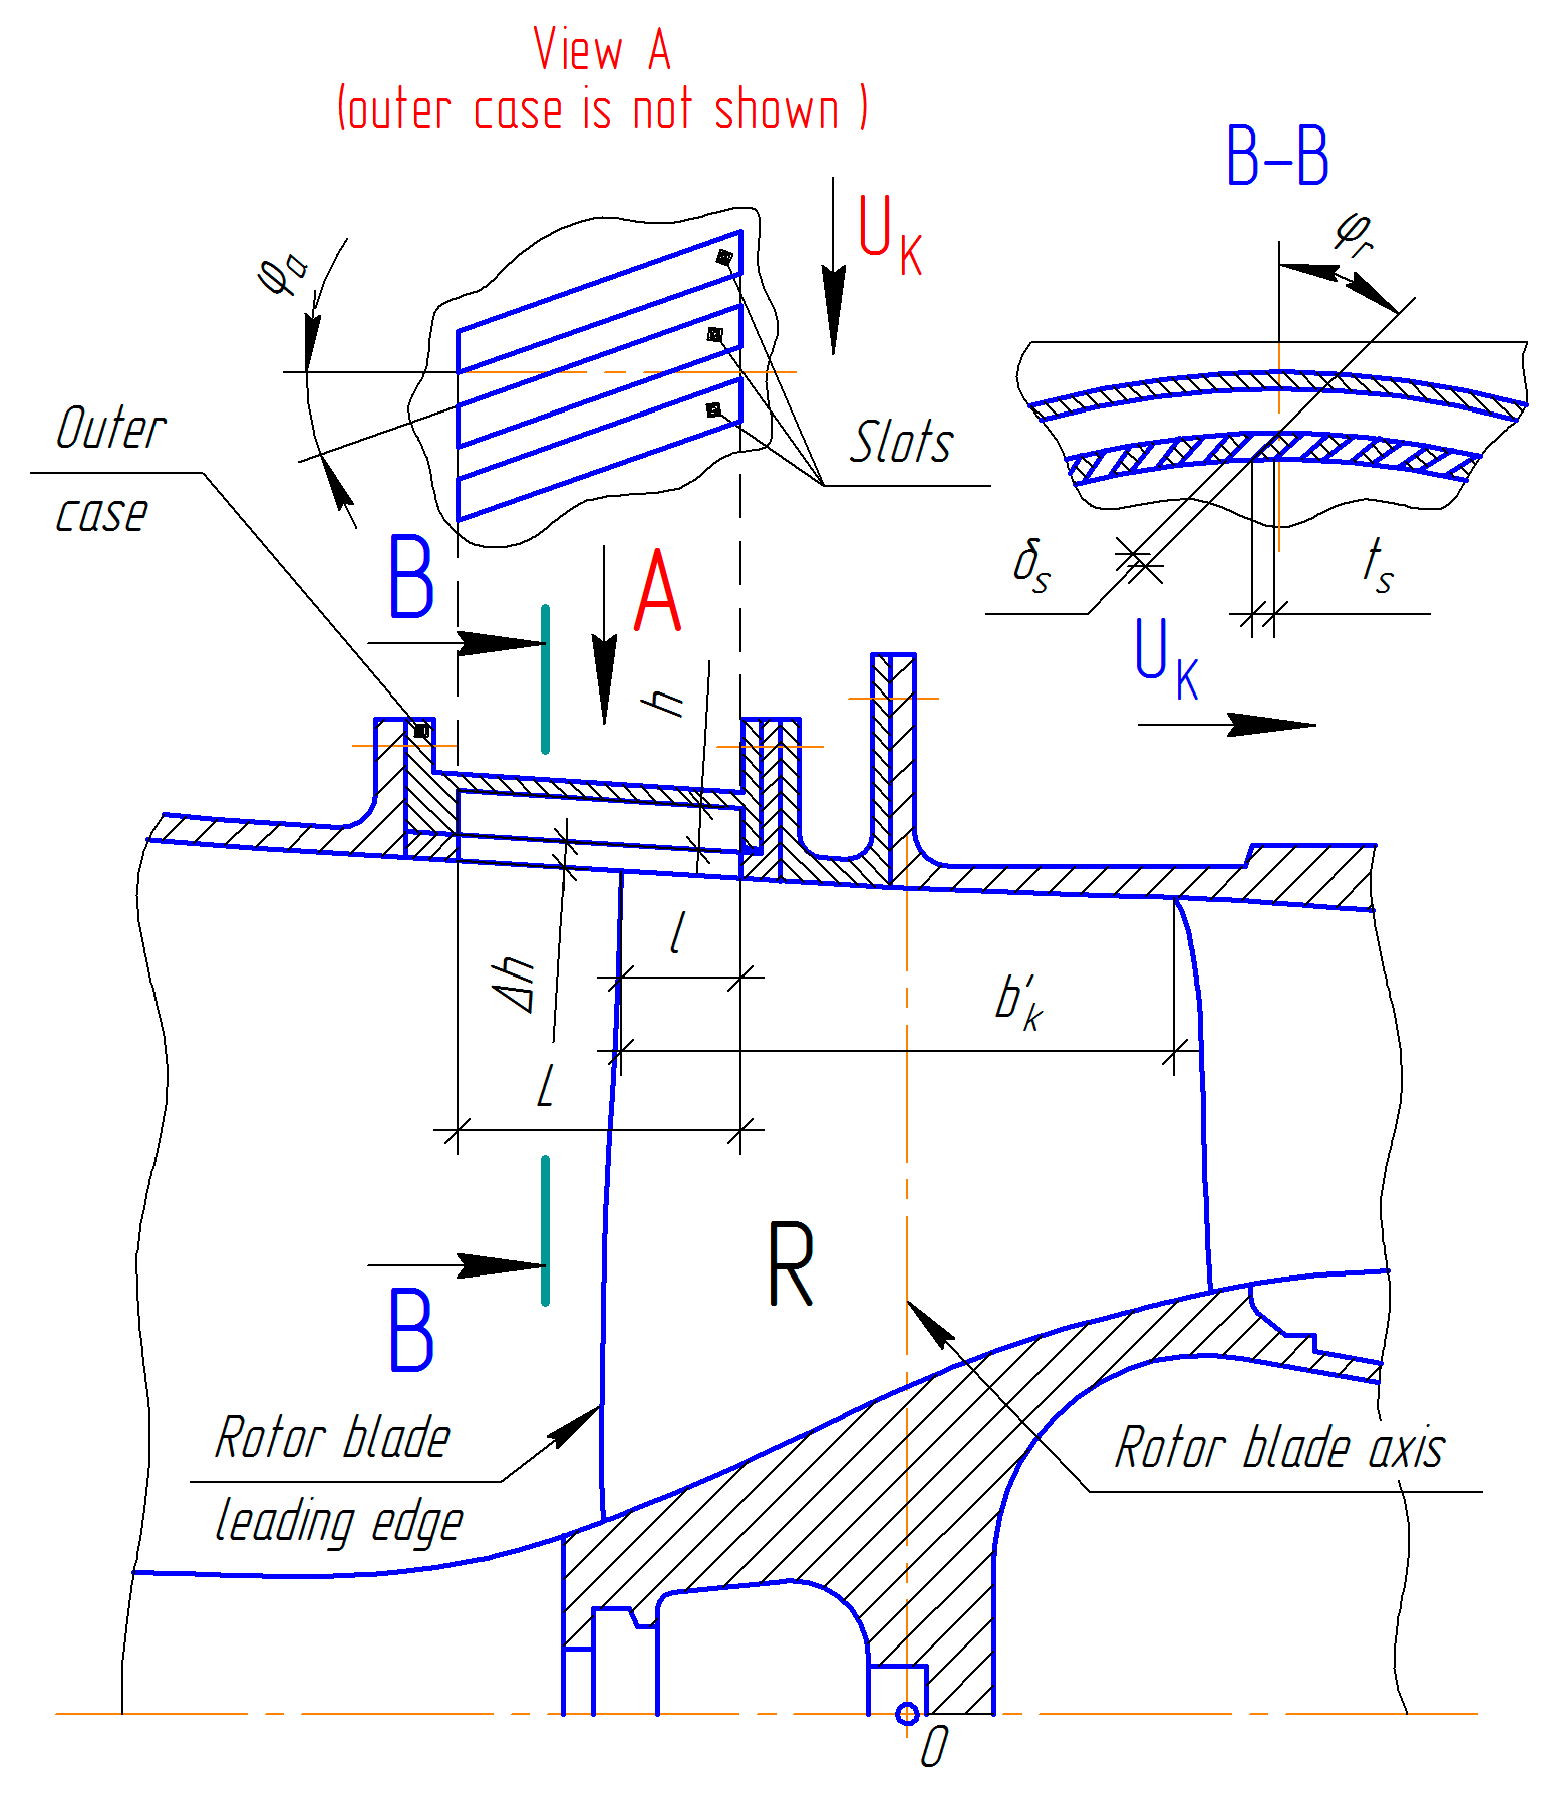
Figure 30 shows the layout of the fan rotor with the slot-type CT installed over the rotor.
Nomenclature of casing treatment is presented in Table 3.
Computed data of the fan integral gasdynamic performance shown in Figure 31 demonstrate the effect of casing treatments on the efficiency as well as on the stall margin. Computational grid for one slot of CT consists of 124,754 cells. The CT above the first rotor consists of 1,247,540 cells. The CT above the second rotor consists of 1,247,540 cells. It is observed that, the casing treatment in the initial configuration results in a decrease of the maximum efficiency by ≈0.4%. In this case, the fan stall line shifts towards the region of lower flow; while the stall margin, ∆SM, increases by ~3%. Calculations of the integral parameters of the fan with modified casing treatments (with a reduced ring cavity volume) showed a decrease in maximum efficiency by ~0.2% and a ∆SM growth by ~2.5%. Hence, this type of casing treatment enlarges the range of fan stable operation without noticeable losses of adiabatic efficiency.
Detailed analysis of the fan rotor characteristics showed that the second rotor is more sensitive to the presence of a casing treatment in terms of efficiency and total pressure ratio variations. This effect could be explained by the higher velocities in the relative motion occurring around the R2 blade airfoils caused by the flow swirling at the row inlet.
In addition, there is a second, more important, reason for the greater effect of the CT on the second rotor, namely the aerodynamic load distribution between the CRTF2A rotors. In fact, the second rotor in the CRTF2A fan has a higher aerodynamic load than the first rotor (by 40%). Experimental studies carried out by CIAM showed that the CT provides a more pronounced effect on the blade rows with large aerodynamic load [26].
Figure 31 shows experimental data for the CRTF2A fan tested in the C-3A facility with a smooth flow passage and with CT (H configuration, Table 4). The main objective of the CT installation over the CRTF2A rotors was an improvement of the acoustic characteristics of the counter rotating fan without disturbing the aerodynamic characteristics. The analysis of the results presented in Figure 31 reveals that the maximum efficiency of the two experimental set-up exceeds the maximum efficiency of the calculated characteristics by ≈0.5%. In addition, the CRTF2A with CT delivers a maximum efficiency that is 0.3% higher than the maximum efficiency of the CRTF2A without CT.
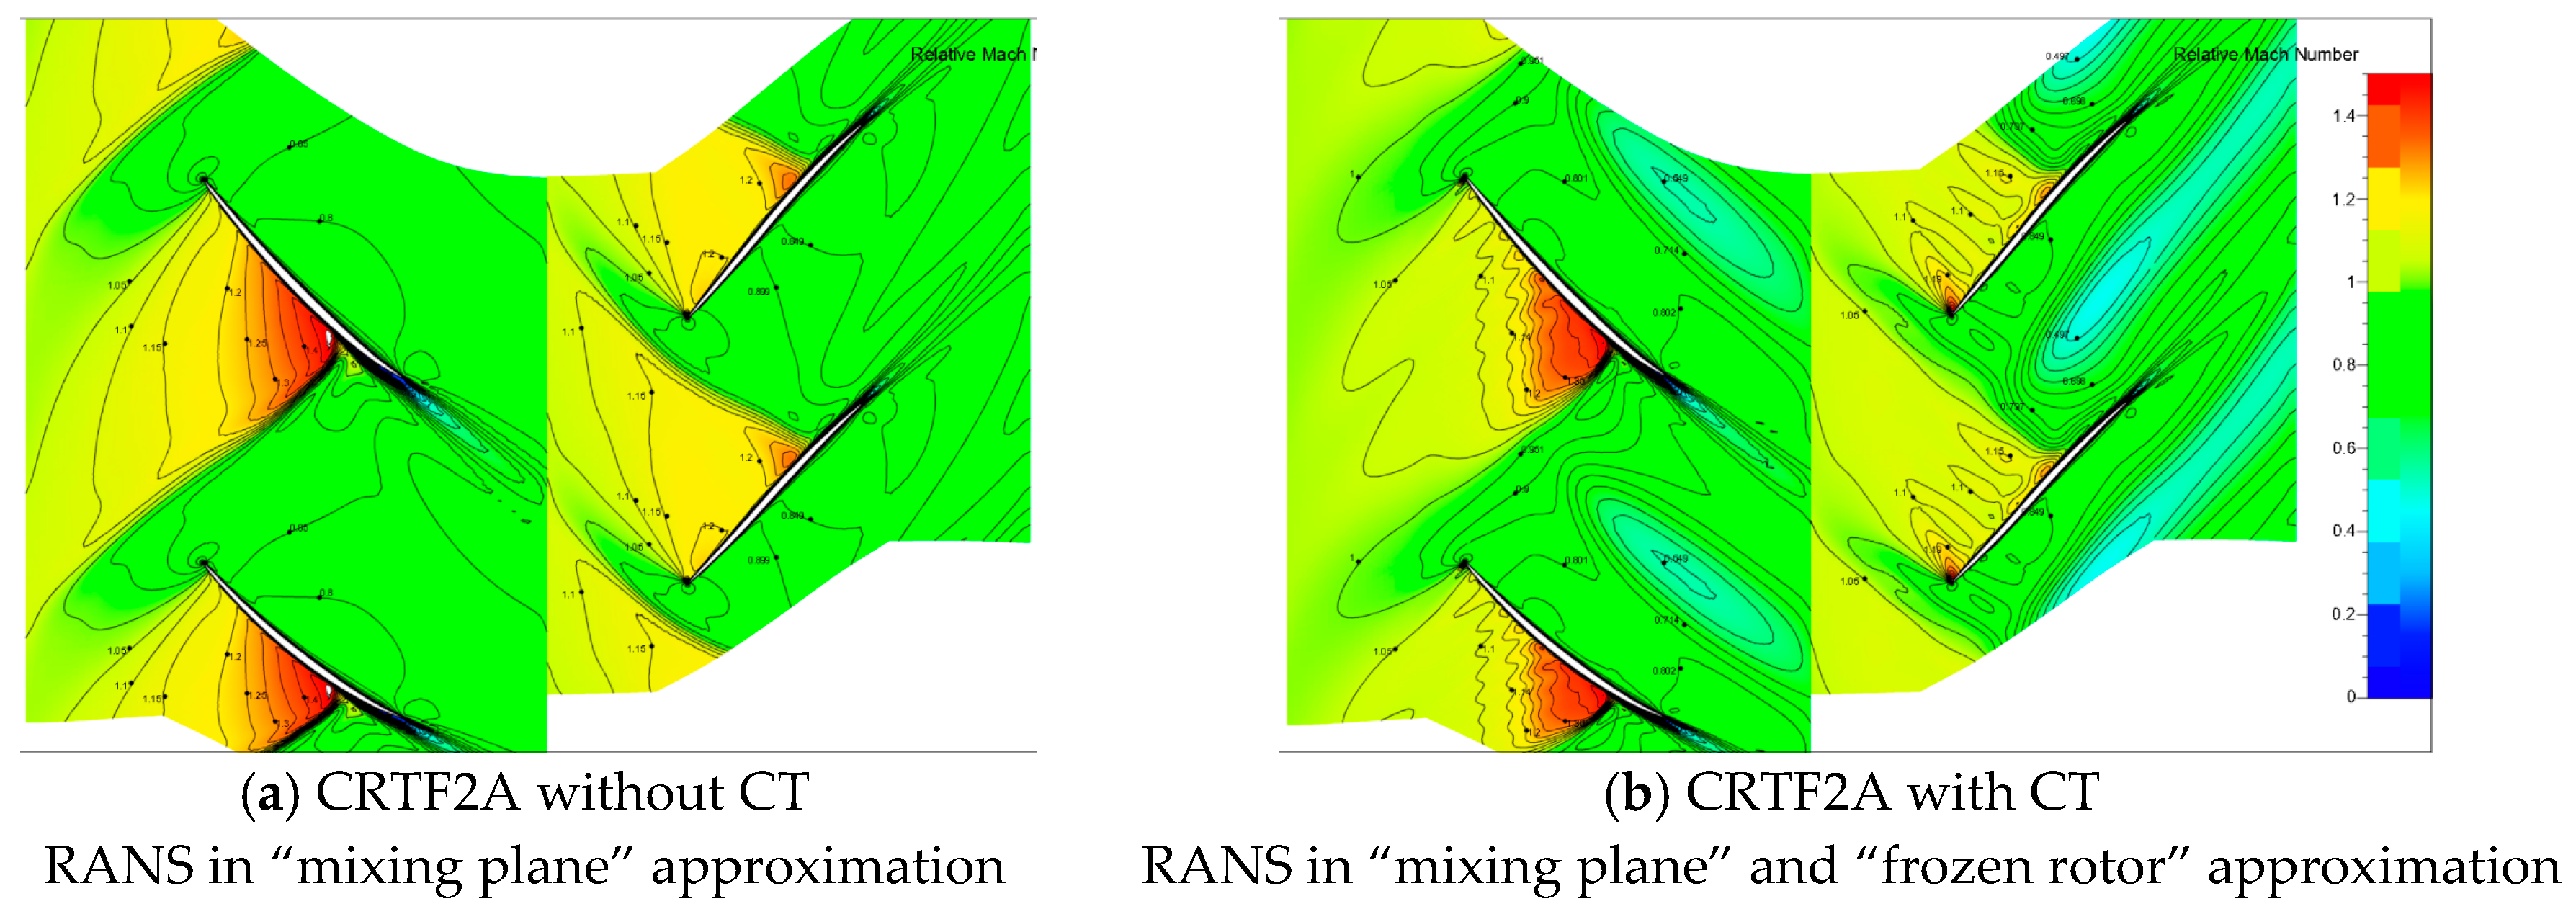
Flow fields inside the blade channels of the CRTF2A model are shown through the contours of relative Mach numbers in Figure 32 for a point on one operating line. The most evident impact of the CT on the base flow can be seen in the tip region in the close proximity of the tip clearance and of the CT slots. The application of a CT leads to reduced intensity of shocks and lower Mach numbers before the shock in the blade channels of both rotors. Lower shock intensities imply lower intensities of the shock-wave interaction between the counter rotating fan rows. This, in turn, produces a beneficial effect on the aerodynamic and vibrational characteristics of the fan as well as on its acoustic emissions. In addition to the reduced intensities of the shockwaves, the use of casing treatments results in generation of a low-velocity flow zone (light-blue zones with Mach number less than 0.5 in the mid-passage, Figure 32) resulting in a negligible increase of losses.
10. Experimental Estimations of the Overall Sound Power Level for the CRTF2A Fan Model with Casing Treatment
To quantify the capabilities of the CT to act as a fan noise silencer, we monitored the decrease in the overall sound power level (PWL). Table 4 and Figure 33 present the basic design parameters and the acoustic efficiency of the CT configuration tested in the C-3A facility [30,31].
Geometrical details and acronyms (symbols or letters) used to denote the CT configurations are given in Table 4. We can use the following relation:
where X denotes the CRTF2A configuration with CT1 and CT2.
X (z1/h1 + z2/h2),
z1 is the number of slots in CT1 installed over R1, h1 is the height of the CT1 cavity, z1 = 0 means no CT1 over R1. z2 is the number of slots in CT2 installed over R2, h2 is the height of the CT2 cavity.
If z2 = z2a/z2b, a two-row CT2 is used, which is composed of two rows of shorter slots, and their total axial length is equal to the length of an original single-row CT2. Axes of slots in each of the rows are parallel to each other, but the number of slots in each of rows may be different.
Two CTs (H (0+115; 16) and J (0+115; 11)) out of the six configurations investigated in this test campaign had a positive effect in three flight conditions. Their overall acoustic efficiency was 3.2 dB and 2.9 dB, respectively.
Configurations H, J, K, L, and C (Table 4) had only one casing treatment installed above the second rotor. In the M and N configurations, the casing treatments were installed above both rotors (Figure 28, Figure 29 and Figure 30). For instance, configuration M (133; 13.2+115; 10.2) stands for z1 = 133 (number of CT1 slots over R1), h1 = 13.2 mm (CT1 cavity height), z2 = 115 (number of CT2 slots over R2) and h2 = 10.2 mm (CT2 cavity height). Acoustic efficiency of configurations H, J and M is considerably higher than the best CT configuration C (0+85; 5.2) with 85 slots and h2 = 5.2 mm cavity height investigated in the previous test campaign.
11. The COBRA International Project (Innovative Counter Rotating Fan System for High Bypass Ratio Aircraft Engine)
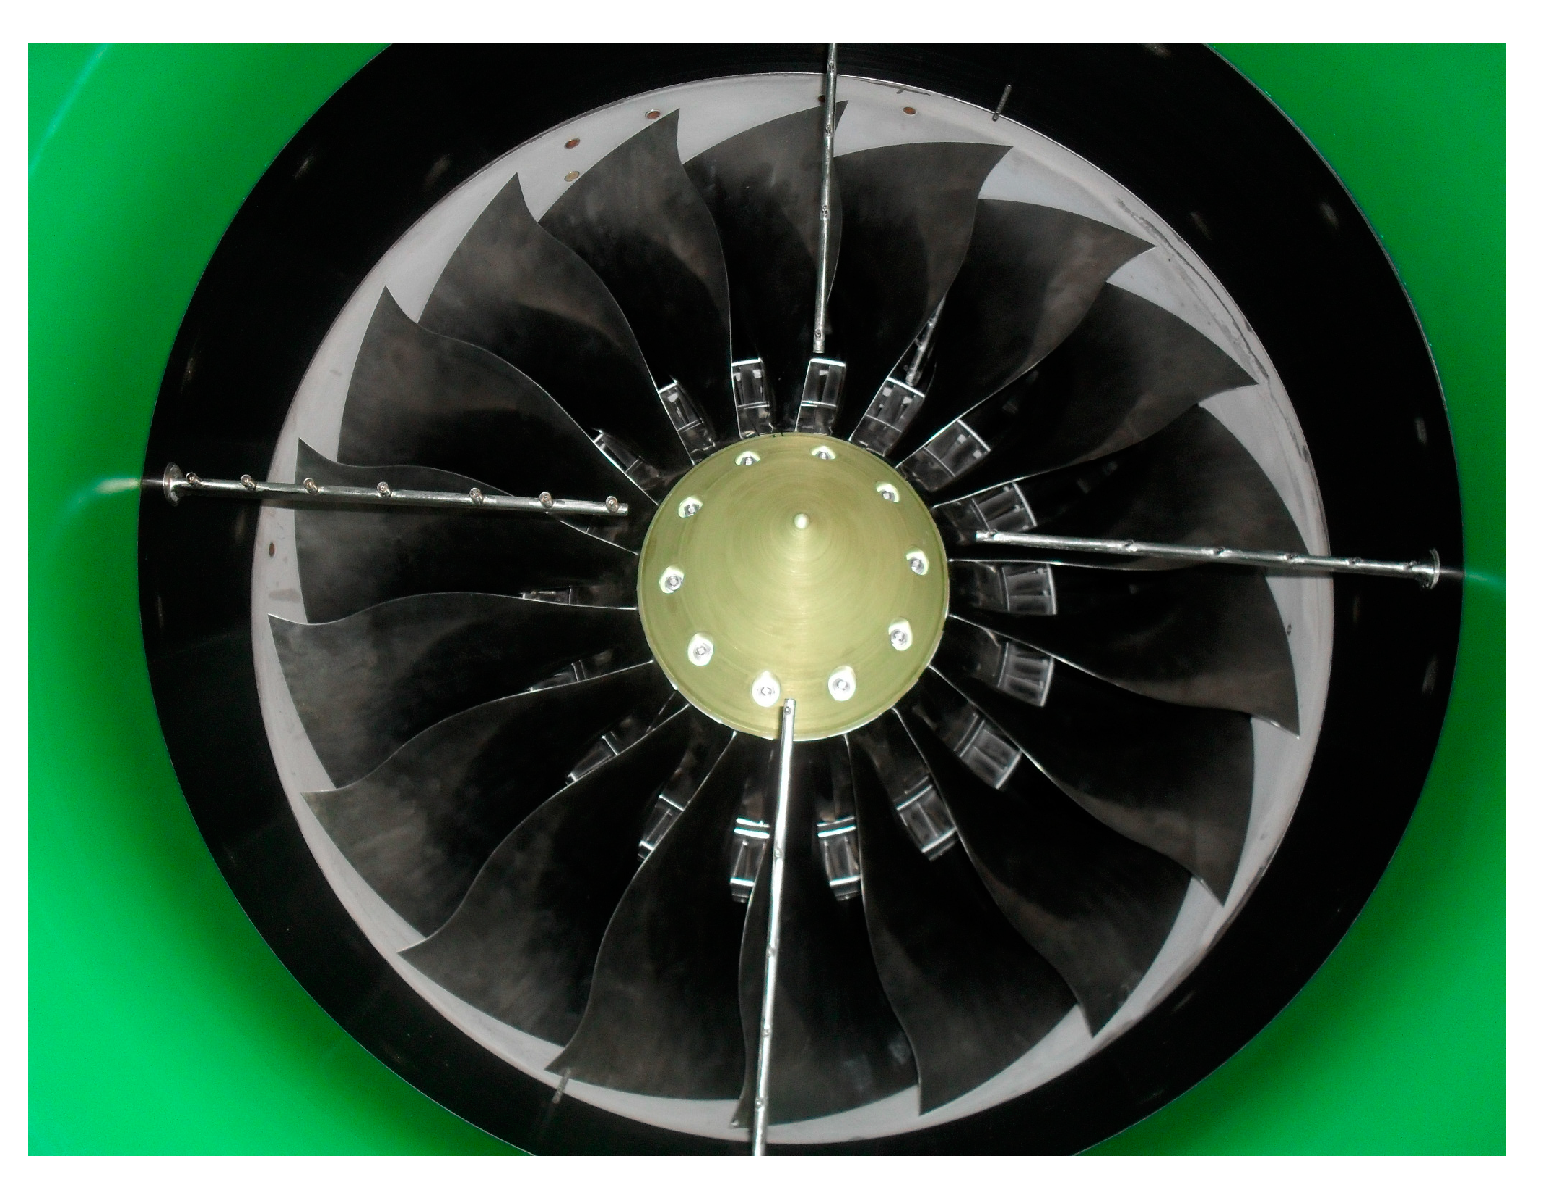
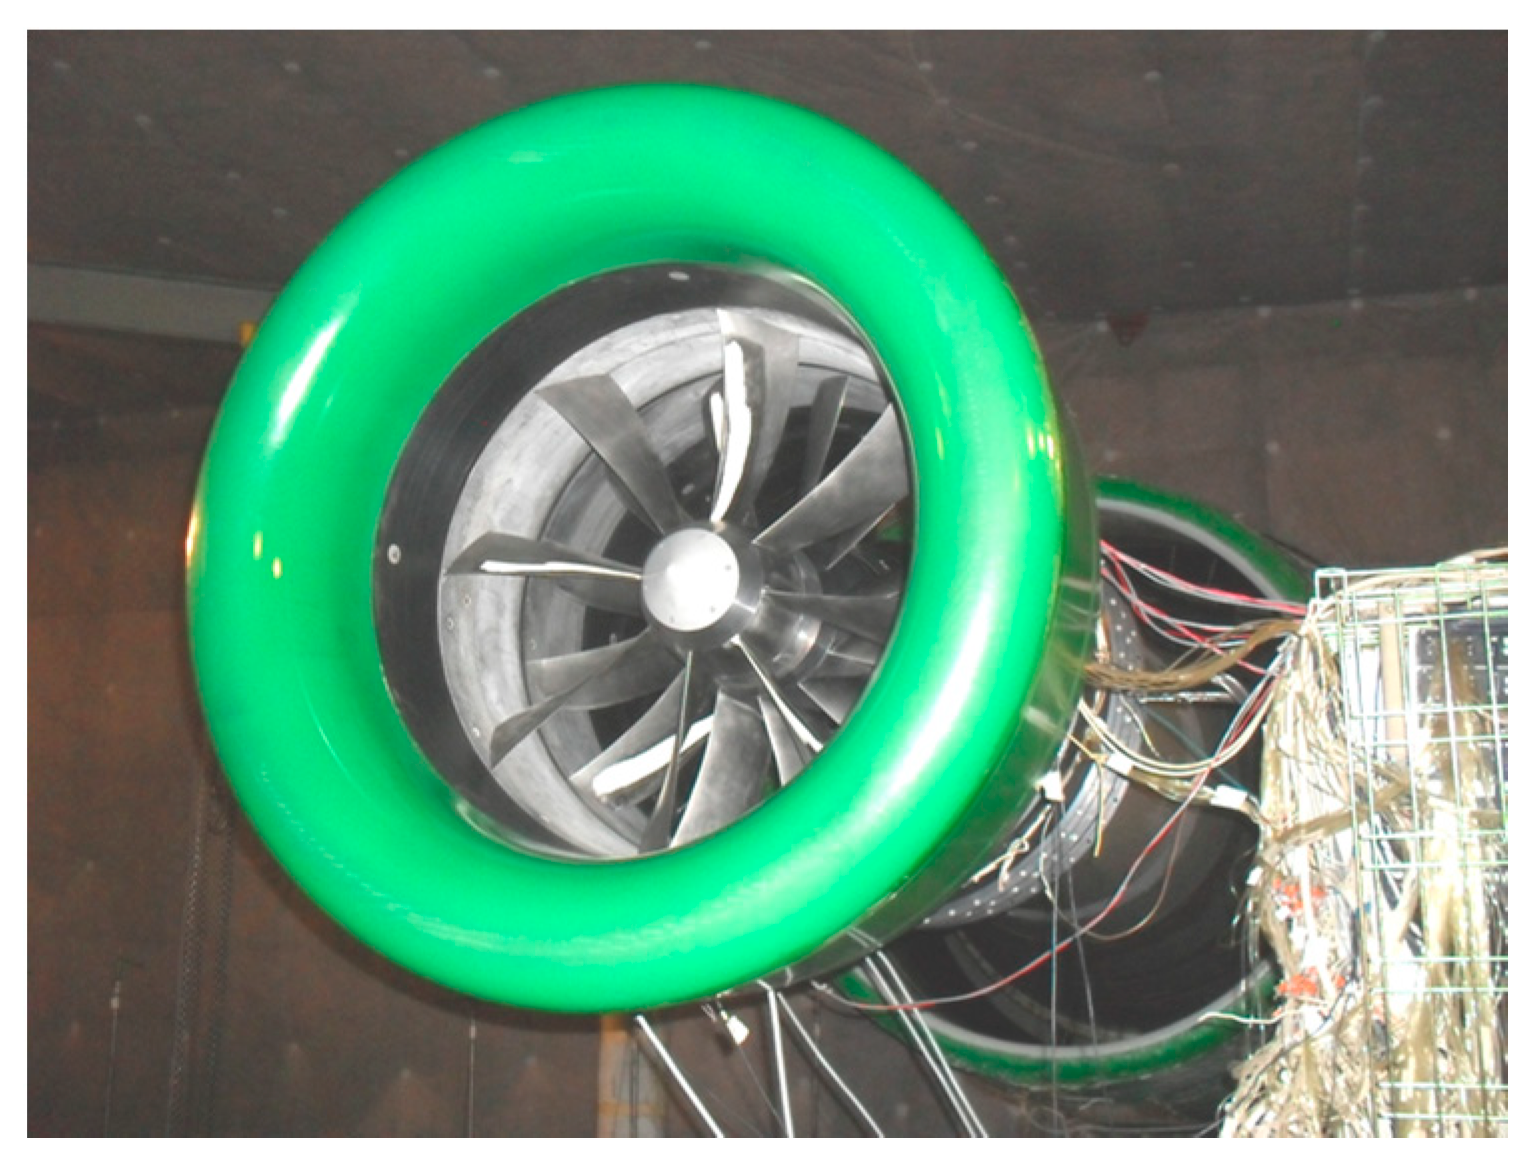
The test module is a counter rotating model fan with an ultrahigh bypass ratio (m = 20). Figure 34 shows a photo of the COBRA1 model fan installed at the C-3A test facility.
Geometric and kinematic parameters of the tested fan are given below [13]:
- Inlet diameter: 700 mm;
- Diameter of the first rotor: 718 mm;
- Diameter of the second rotor: 725 mm;
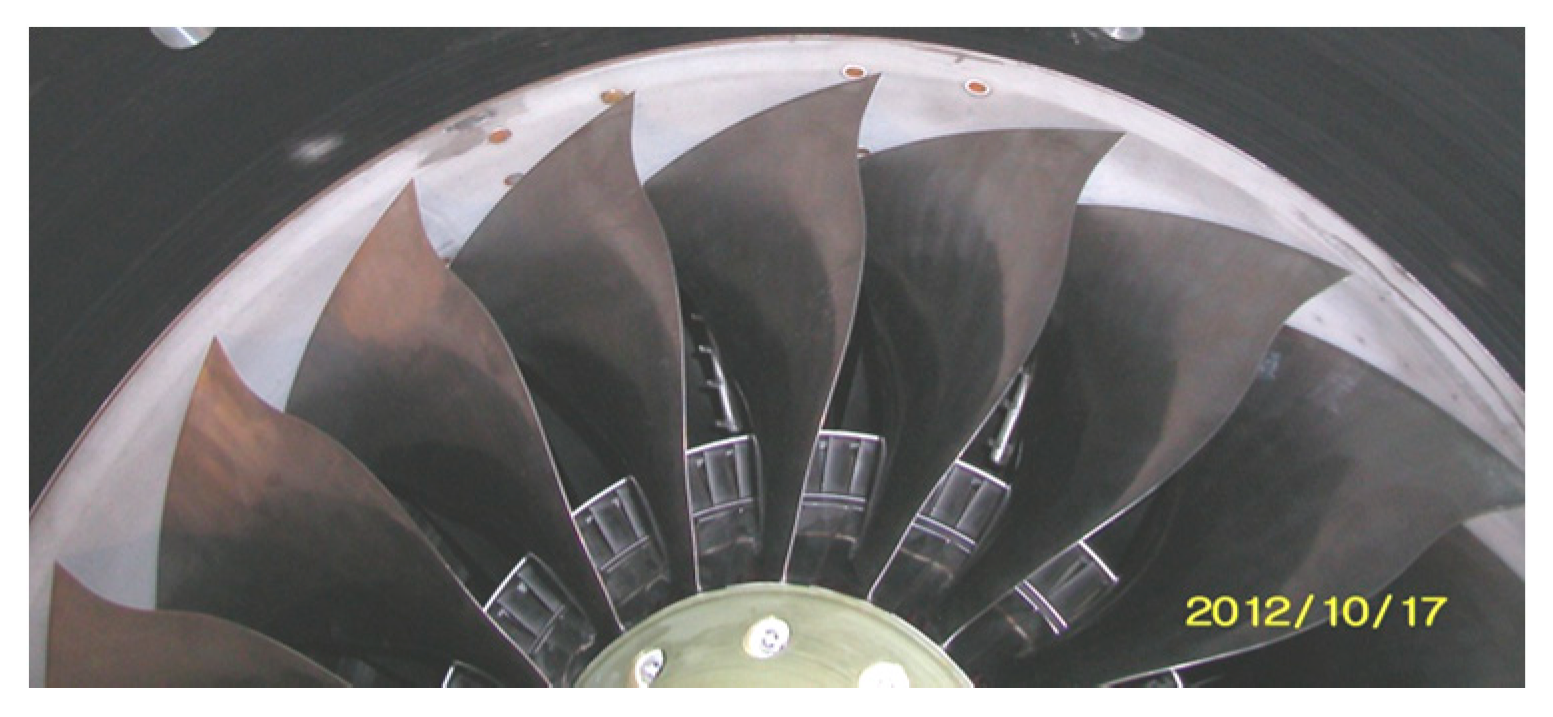
- Blade number of the first rotor: 8 (Figure 35);
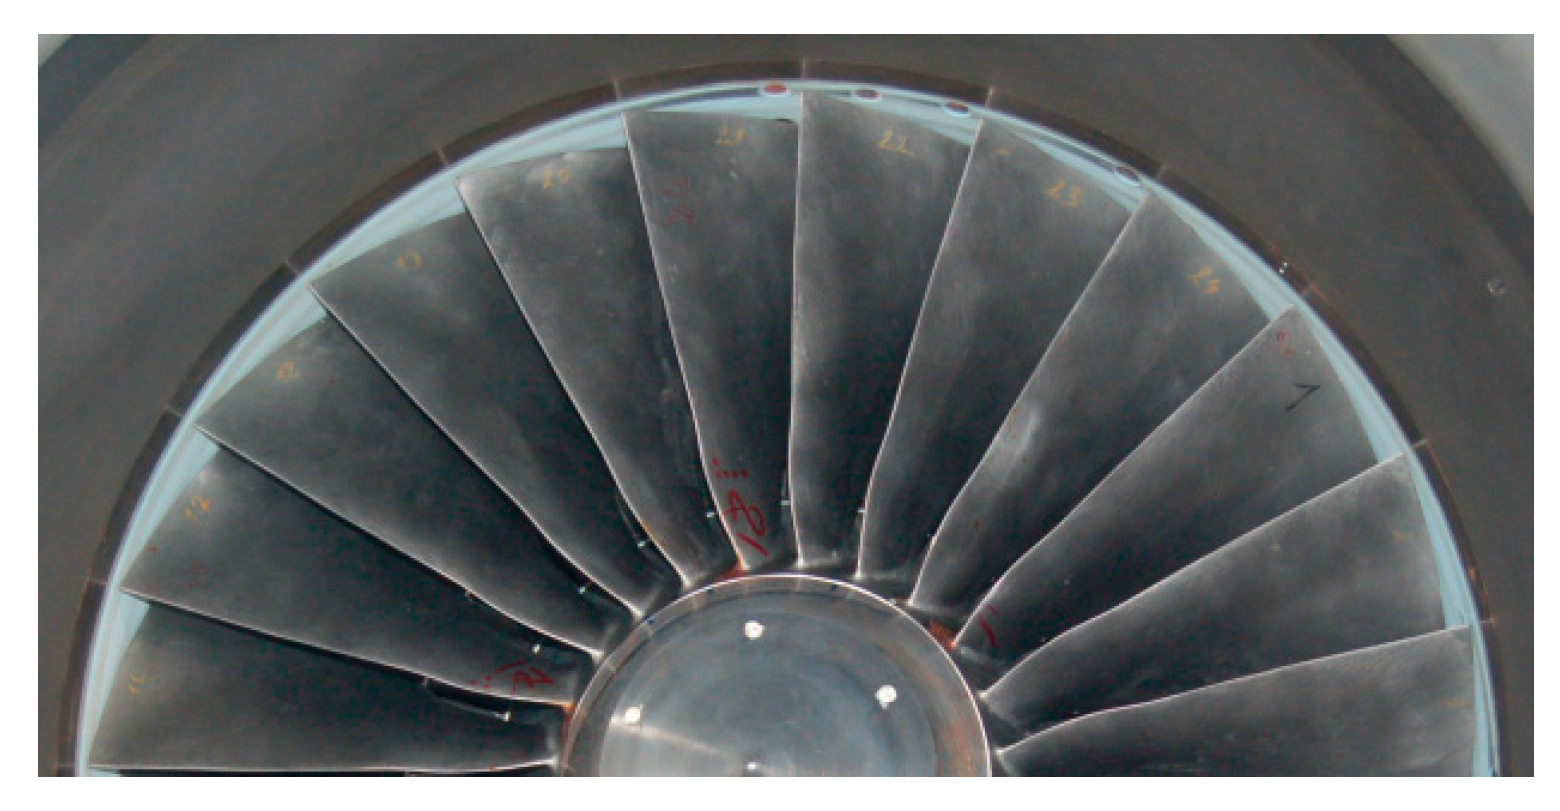
- Blade number of the second rotor: 12;
- Rotational speeds of the first and second rotors at design conditions (n = 100%) are both equal to 5800 rpm, but with opposite signs;
- Corrected circumferential speed at design conditions: Ucor = 218 m/s;
- Rotational speed ratio s, n2/n1, at low and mid conditions (n = ~54–70%) is constant and equal to 1.11;
- Torque ratio, M2/M1, is constant and equal to 1.42.
- The fan under investigations has the following calculated aerodynamic parameters at design conditions (n = 100%):
- Pressure ratio in the bypass duct: π* = 1.267;
- Adiabatic efficiency of the bypass duct: η = 0.934;
- Mass flow rate per unit frontal area: Gcor/Ffr area = 211 (kg/s)/m2;
- Bypass ratio m = 20.
The experiments investigations of the COBRA1 model fan equipped with different nozzles in the bypass duct, carried out in the C-3A test facility, provided the basic aerodynamic characteristics of the device fan. The model fan was equipped with four nozzles with the following outlet diameters: 788 mm, 800 mm, 812 mm, and 824 mm. The diameter of the external fan casing in the last section (at the nozzle inlet) was 836 mm.
The first tests were conducted without a nozzle and with the following nozzles: 824 mm, 812 mm and 800 mm in diameter. The tests with 800 mm nozzle were carried out only up to n = 85%. During the transition process to n = 90%, the blade tip timing system as well as the strain gages recorded limiting values of dynamic stresses for the blades of the fan second rotor. Therefore, tests with a more closed nozzle (788 mm) were not conducted.
Further on, the nozzles with the outlet section diameters of 788 mm and 800 mm were machined up to 818 mm and 830 mm diameters, respectively. Then, the module with these nozzles was tested again in order to get additional information about the aerodynamic performance of the fan under research.
Figure 36 shows the performance map in terms of total pressure ratio in the bypass duct (π*) versus the corrected total mass flow of the fan without a nozzle and with five different nozzles. The graph also shows a calculated operating line that would correspond to the max. adiabatic efficiency of the fan bypass duct.
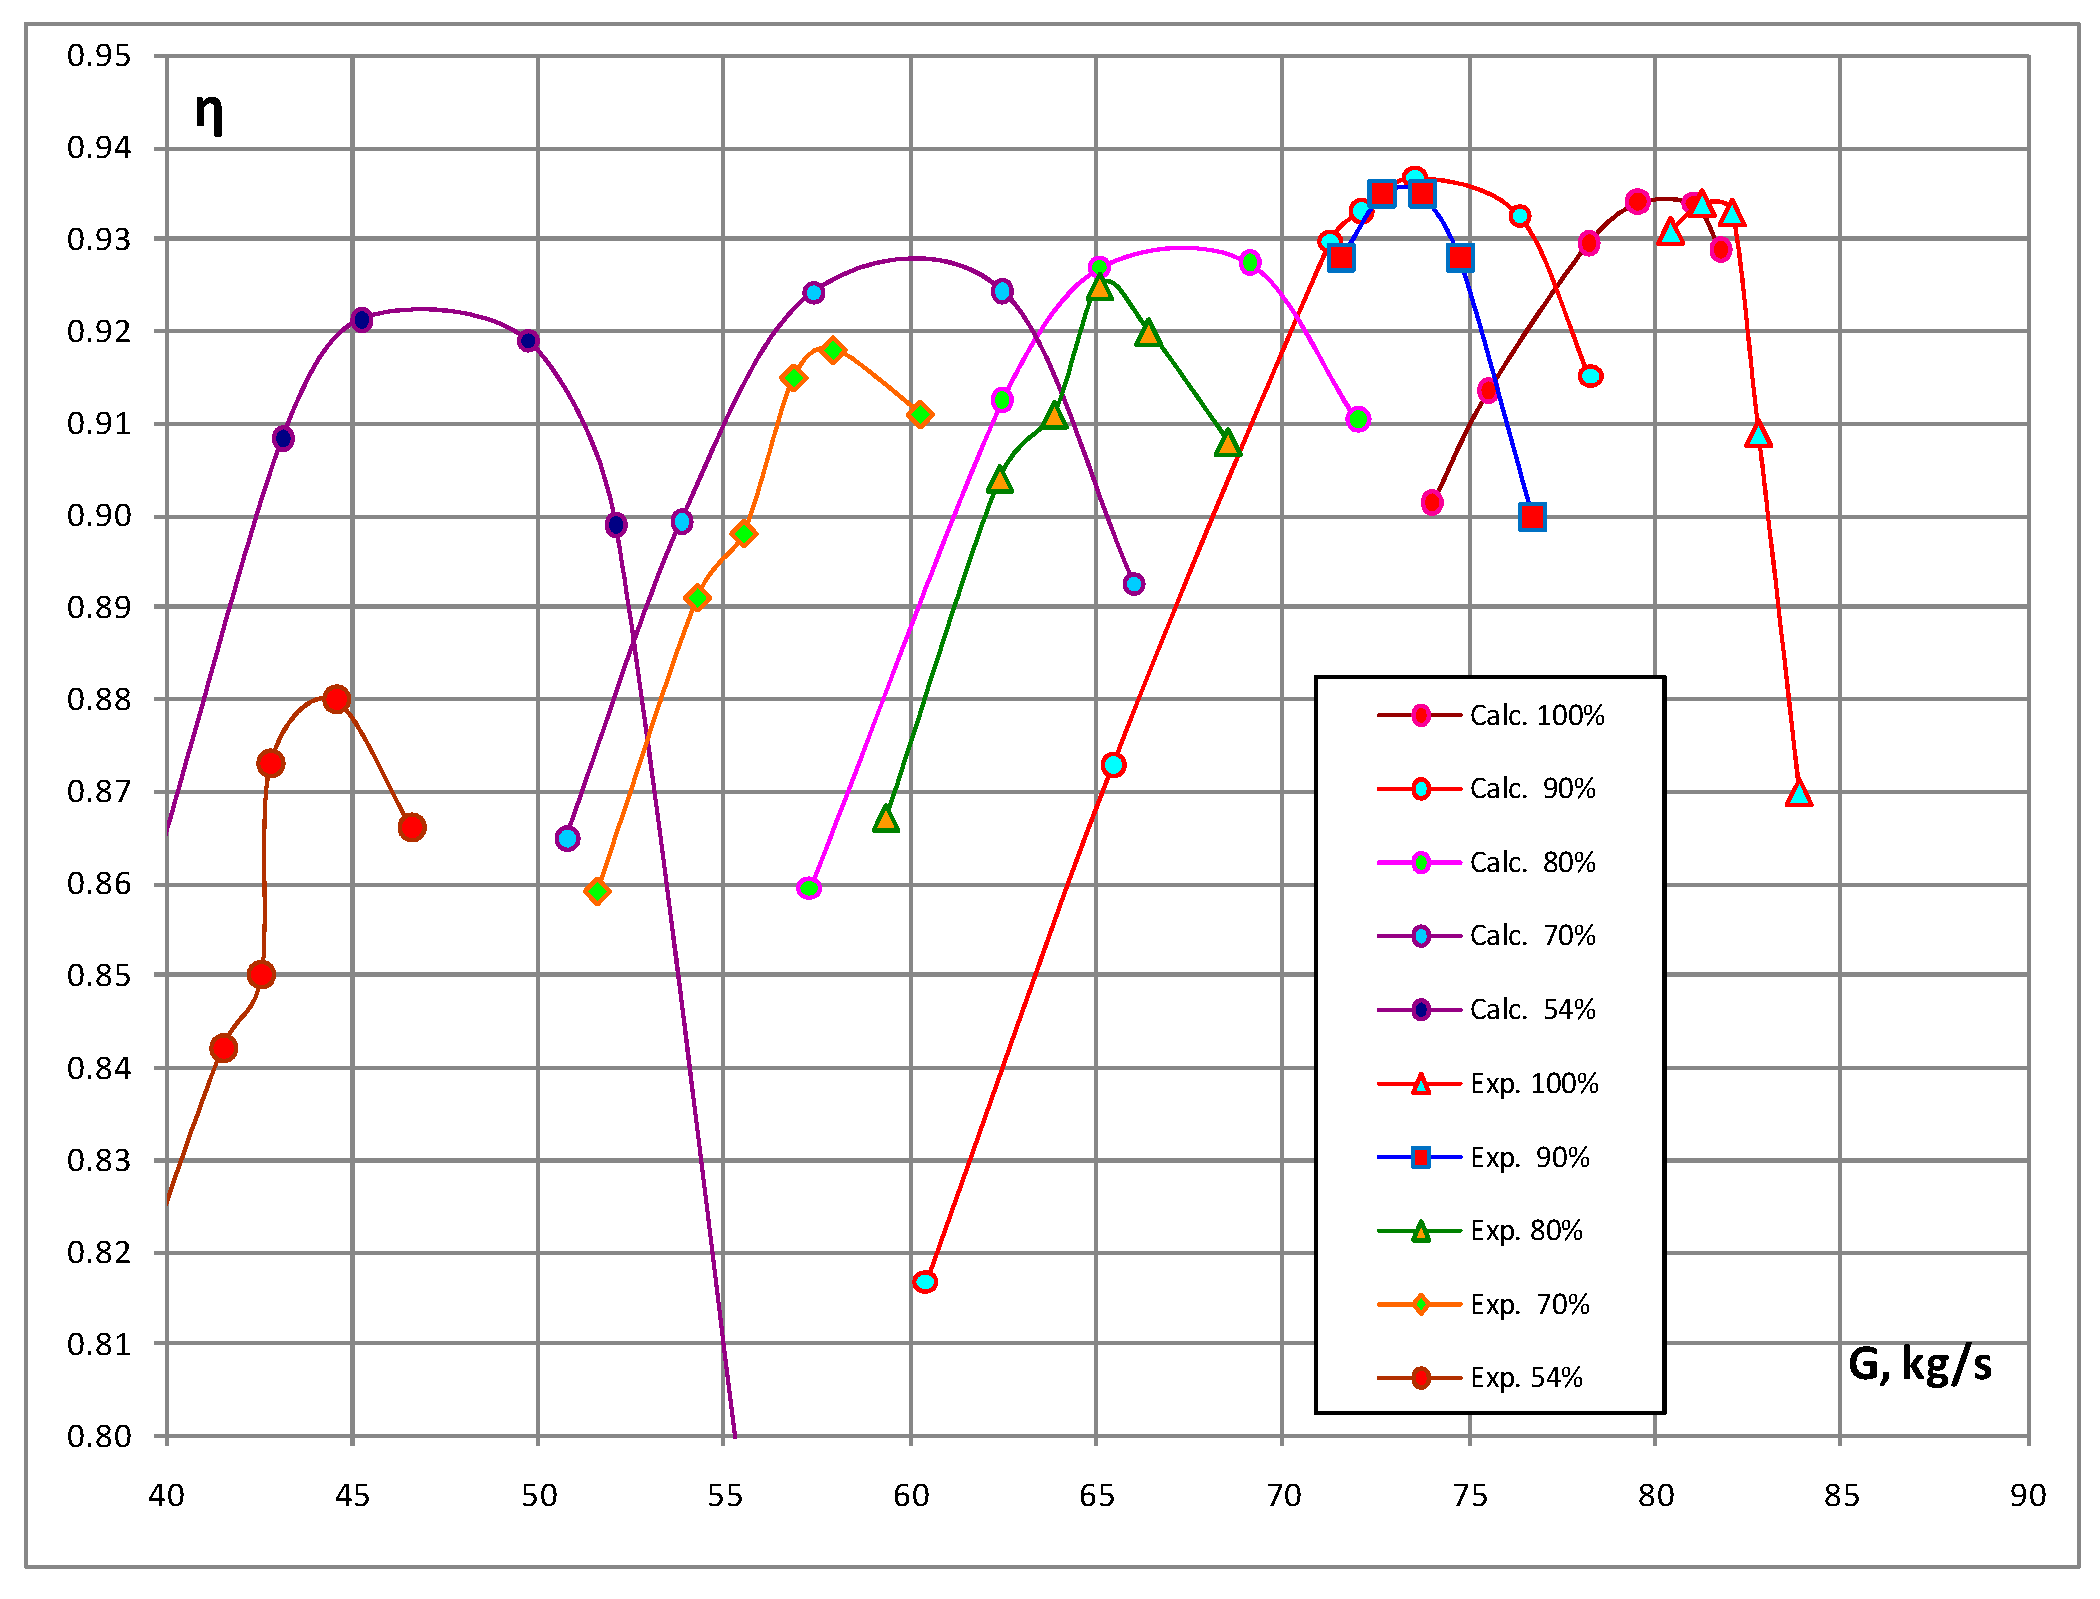
Figure 37 presents the adiabatic efficiency of the fan bypass duct (η*ad) as a function of the corrected total mass flow (Gcor) at different rotational speeds. As it can be seen, the maximum values of the fan adiabatic efficiency (η*ad max) in the range of rotational speeds from 80% to 100% are very close to design values. Only at n = 54% the experimental value of η*max lies below the design one by 4%. The main reason for this lower efficiency is the increase of the rotor incidence angles at reduced rotational speeds that leads to flow separation at blade tips. The accuracy of fan the performance calculations by RANS at decreased rotational speeds is lower. For a more accurate calculation of the fan characteristics at decreased rotational speeds, more advanced mathematical models, such as those based on the Large Eddy Simulation (LES) and Detached Eddy Simulation (DES) approach are needed.
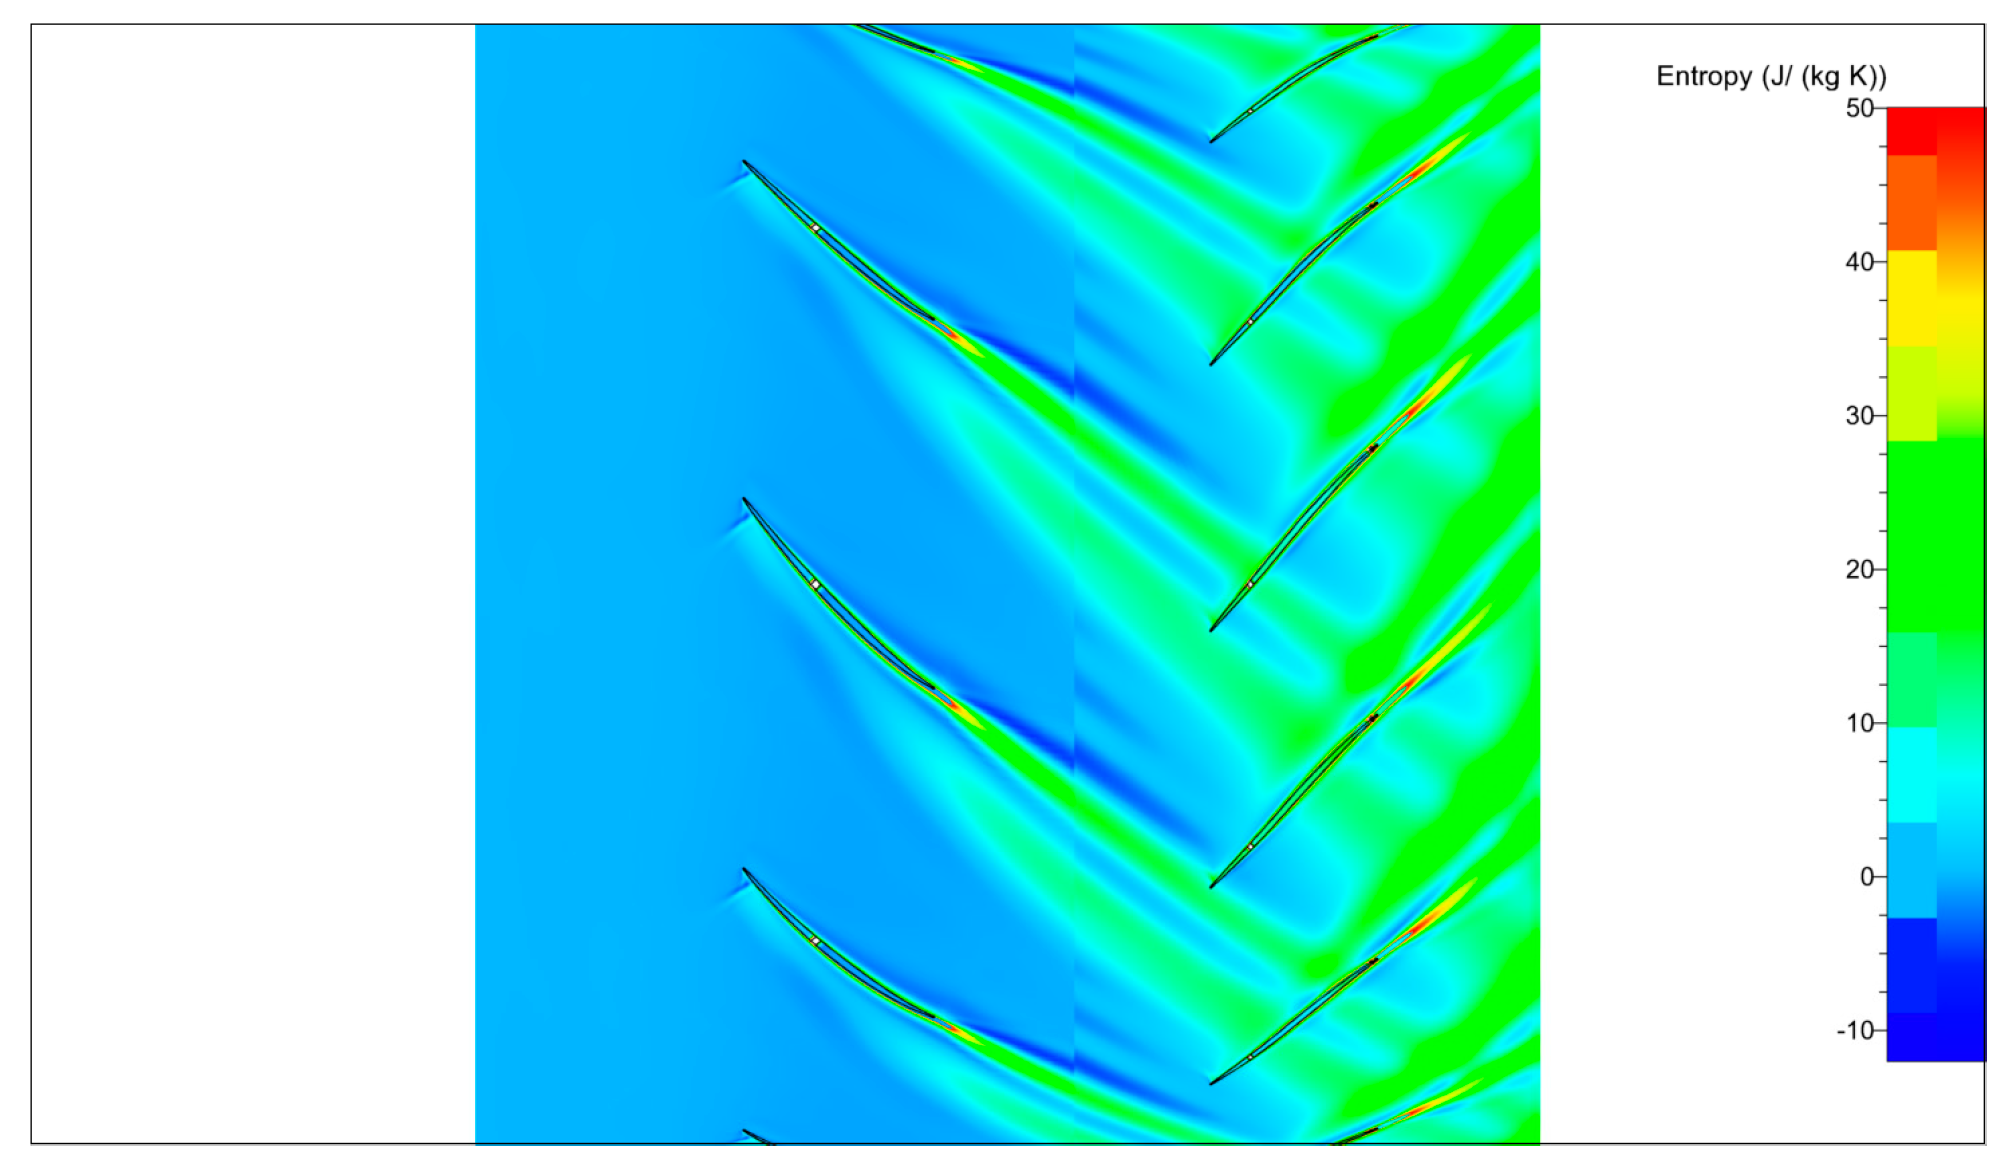
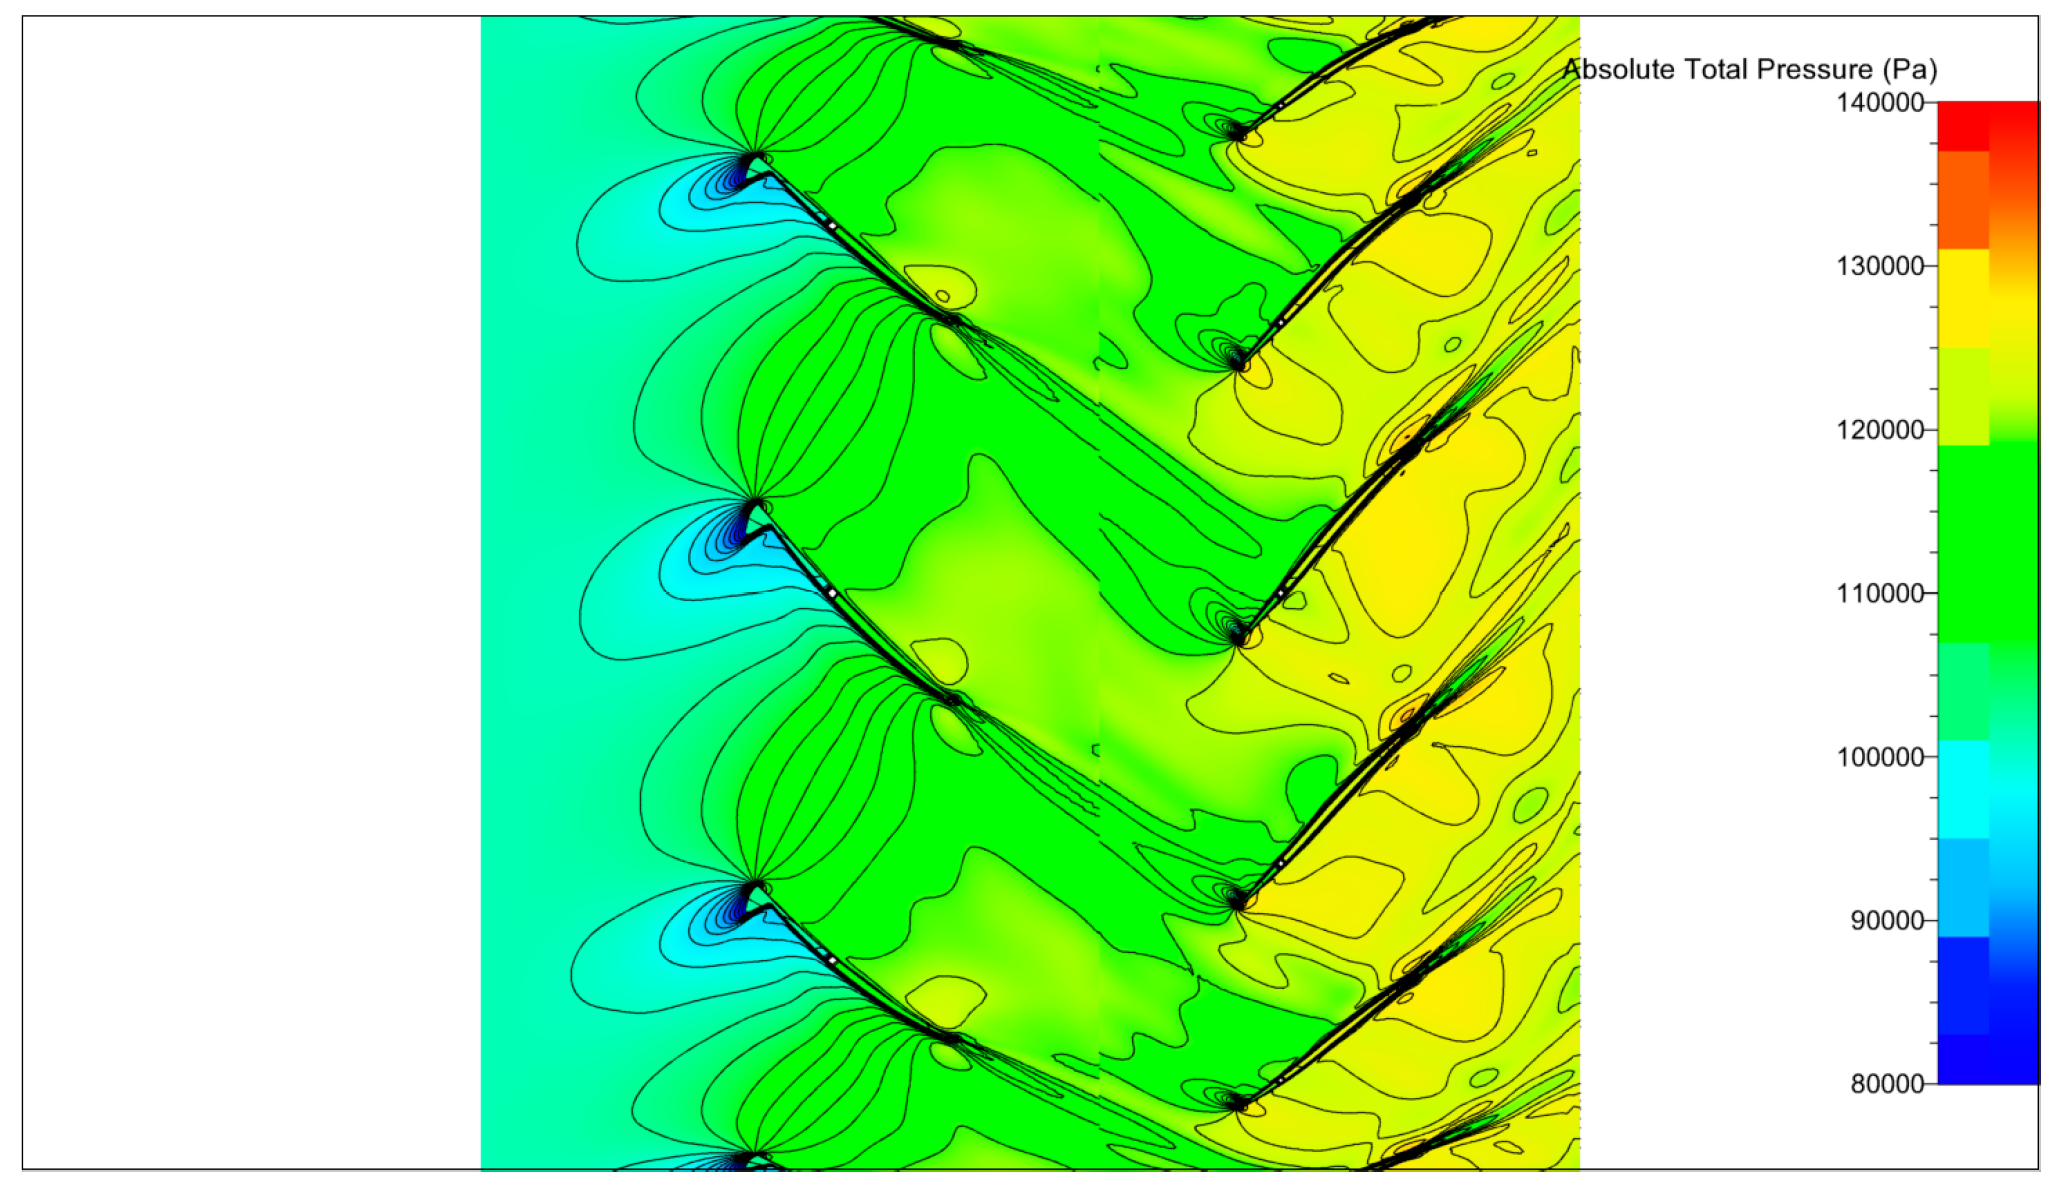
Figure 38 and Figure 39 present the results of unsteady calculations obtained with the URANS approach in terms of instantaneous distribution of the entropy function, and of the total pressure on a S1–type cylindrical surface in the blade to blade plane Both figures refer to a tip section (0.95 h) for a point near the operating line (Gcor = 40.27 kg/s, π* = 1.272, η*ad = 0.9129).
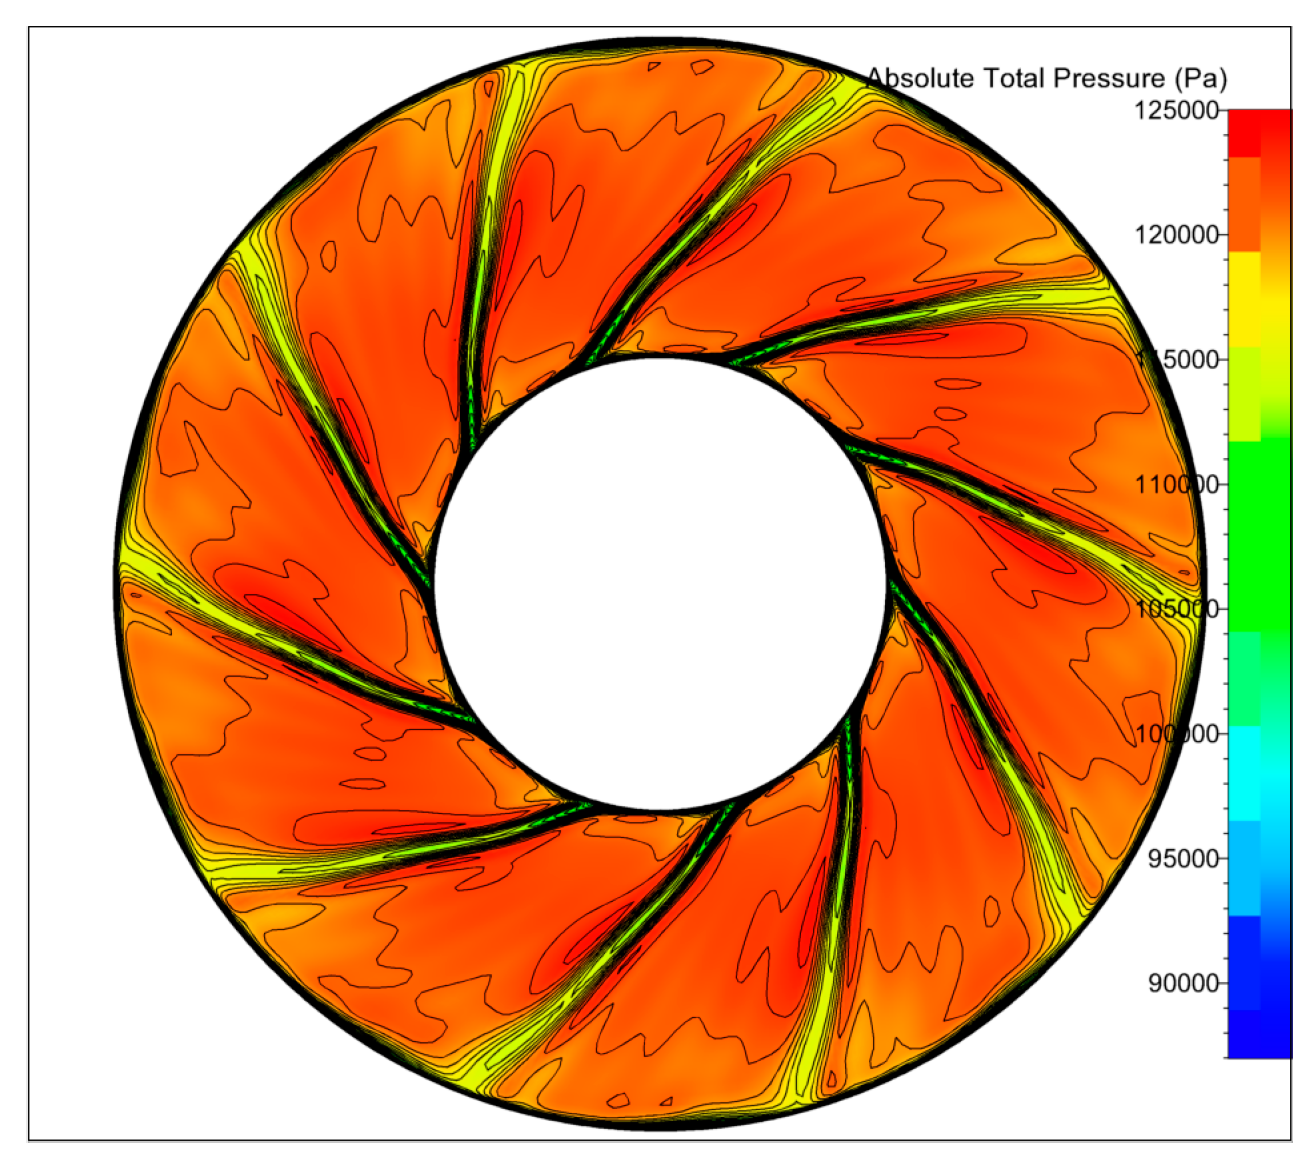
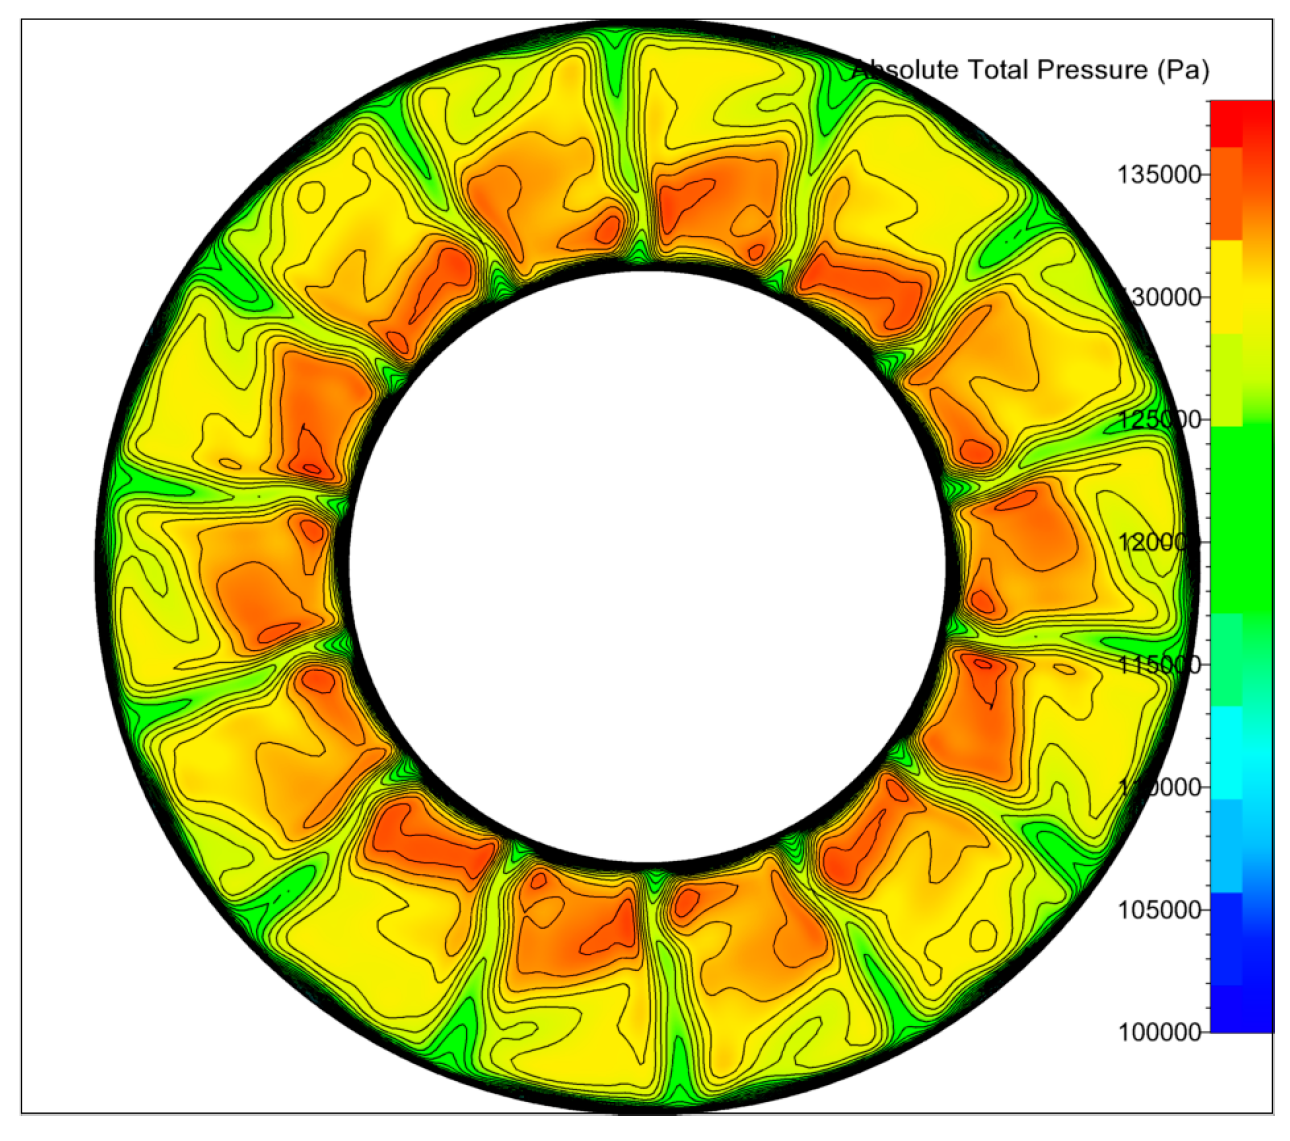
The radial structure of wakes is also important for acoustics. Figure 40 and Figure 41 show the total pressure distributions at two cross-sections of the fan: downstream R1 in the axial gap (Figure 40) and downstream R2 (Figure 41). The total pressure distribution in the cross-section at the first rotor outlet gives the opportunity to analyze the shape and intensity of the wakes details. Figure 40 demonstrates that the wakes of the first rotor are significantly inclined relatively to the radial direction. The inclined shape of the first rotor wakes exerts a positive effect on the acoustic characteristics of the fan. In fact, after passing the axial gap between the rows, the pressure disturbance becomes distributed over several blades of the second rotor thus resulting in lower pulsation amplitude, and consequently, in a lower acoustic emission level. The total pressure distribution at cross-sections downstream the second rotor demonstrates a superposition of the wakes from R1 and R2 (Figure 41).
The analysis of the enthalpy and total pressure distributions at the outlet section revealed the presence of distinct viscous wakes of the second rotor blades interacting with more fuzzy disturbances coming from the first rotor blades. It should be noted that the wakes of the second rotor have almost radial shape being only slightly curved near the hub, as it will be shown next.
During the fan design process, a calculation of the tonal noise of the COBRA1 model at approach conditions was performed [13]. For this operational point the fan parameters are: Gcor = 46.276 kg/s, π* = 1.061, N1/N2 = 0.90, N = 54%. The approach conditions were chosen because computational data for the CRTF1 fan at these conditions were available, and we wanted to perform a comparison between the fans. The aim of the calculation was to obtain the SPL of the tones, generated by the fan in the frequency range 5 KHz.
Calculations for the COBRA1 and CRTF1 fans were performed using the 3DAS in-house developed solver [32], which was previously used for the calculation of the tonal noise of different types of fans, compressors and open rotors (see [29] and references therein). An approximate rotor-stator interaction method is implemented in the solver which is based on the solution of three-dimensional Euler equations for disturbances occurring in the blade rows reference frame. The equations are solved using numerical methods typically employed in computational aeroacoustics such as the fourth order DRP (Dispersion Relation Preserving) scheme for the spatial discretization and the LDDRK (Low Dissipation and Dispersion Runge–Kutta) scheme for time integration.
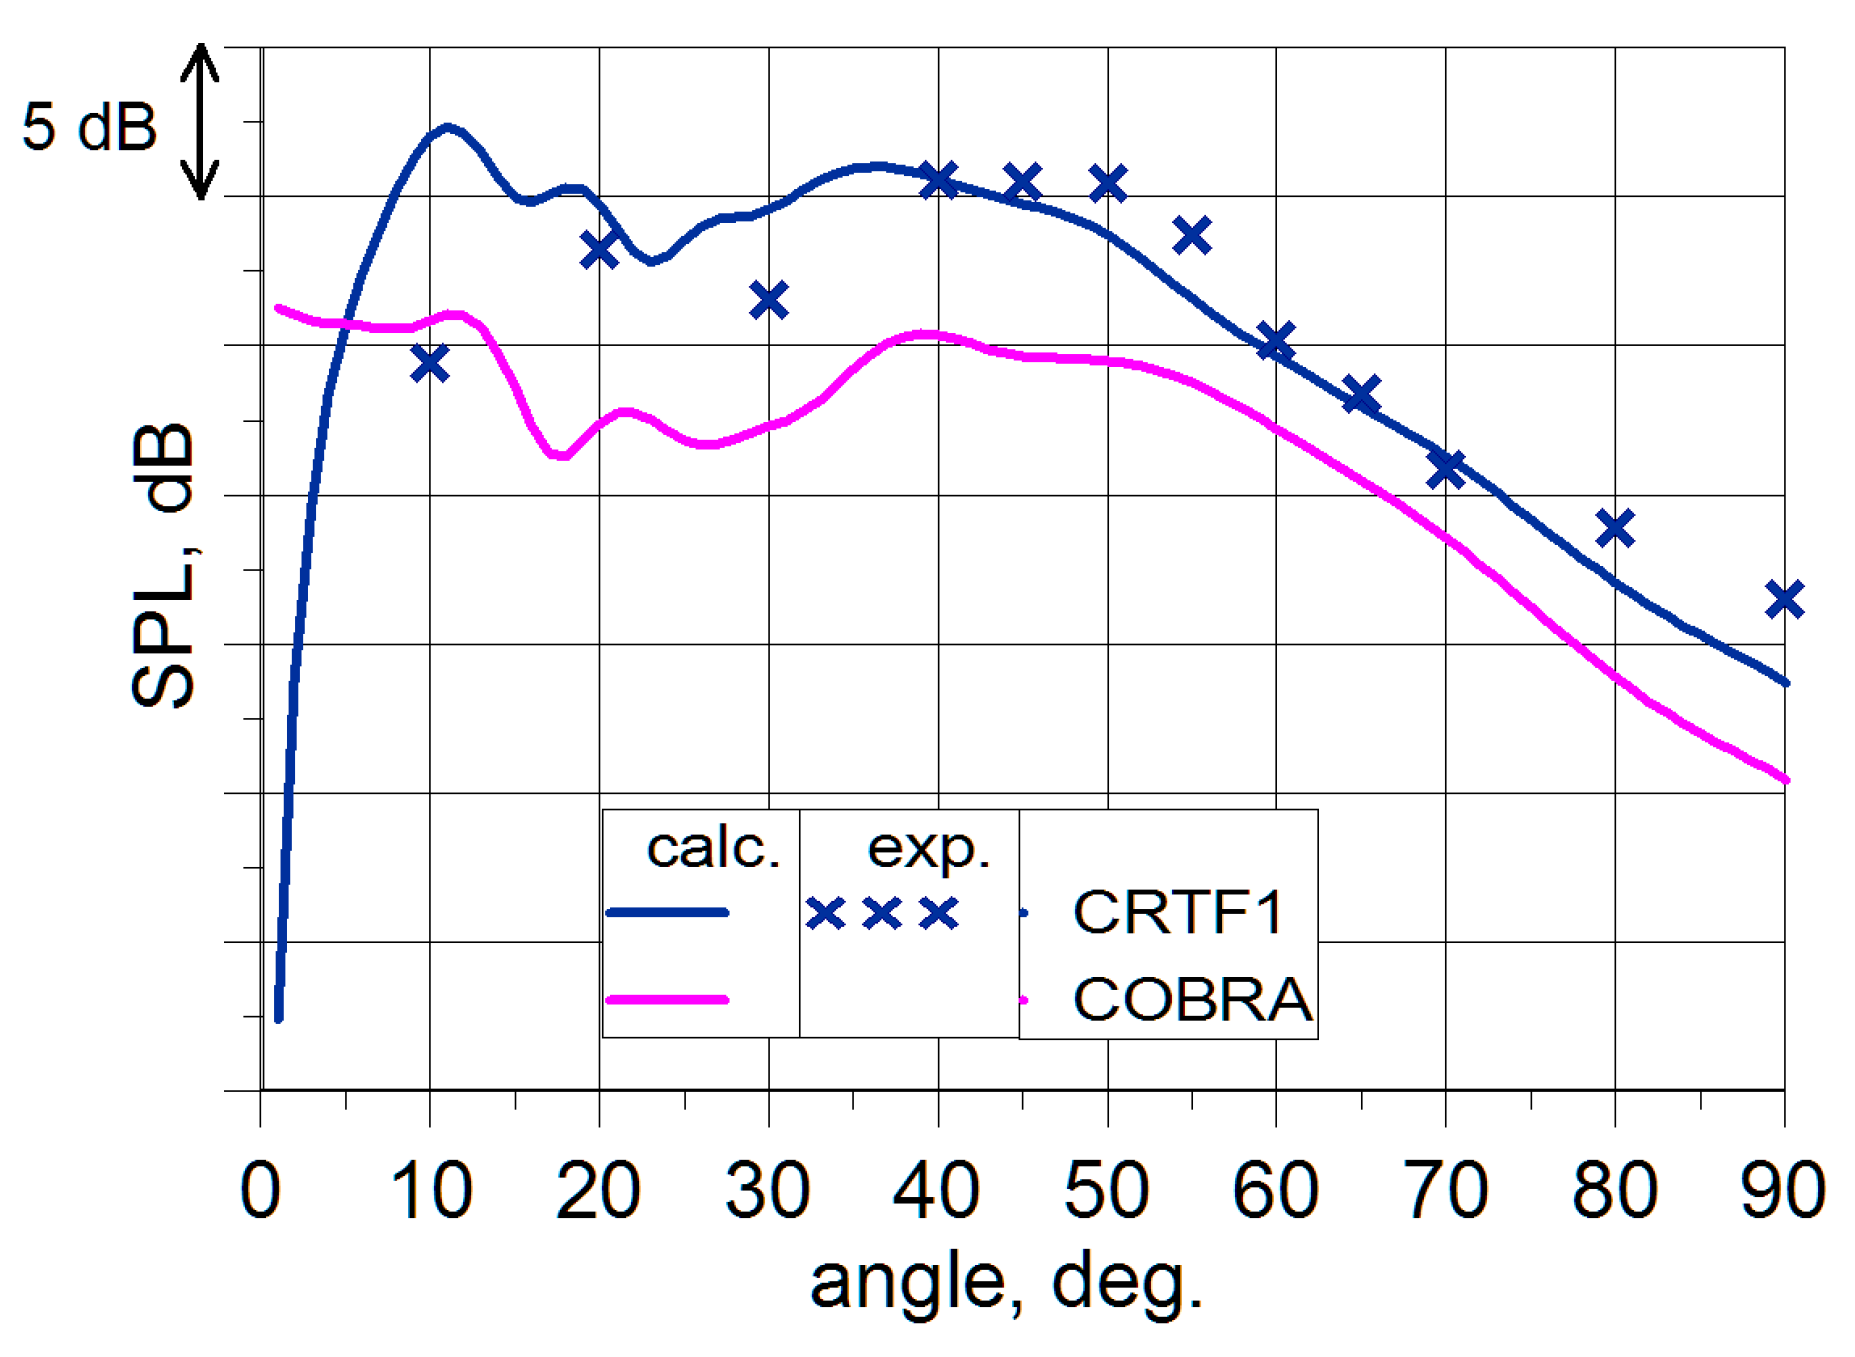
Since the CRTF1 and the COBRA1 fan models have different diameters, and different mass flows, it is hard to perform a straightforward comparison of their noise characteristics. However, in order to estimate the influence of the fan properties on the acoustic characteristics we can compare their noise at normalized mass flows. For this purpose, we rescaled the data of the CRTF1 fan at approach conditions so that it corresponds to the data at the same positions of microphones with the same mass flow of the COBRA1 fan. The comparison in terms of the summarized SPL of the tones in the specified frequency range is presented in Figure 42. It turns out that the COBRA fan noise is less intense in the forward hemisphere, as expected when comparing an Ultra High Bypass Ratio Fan (UHBR) with an HBR fan.
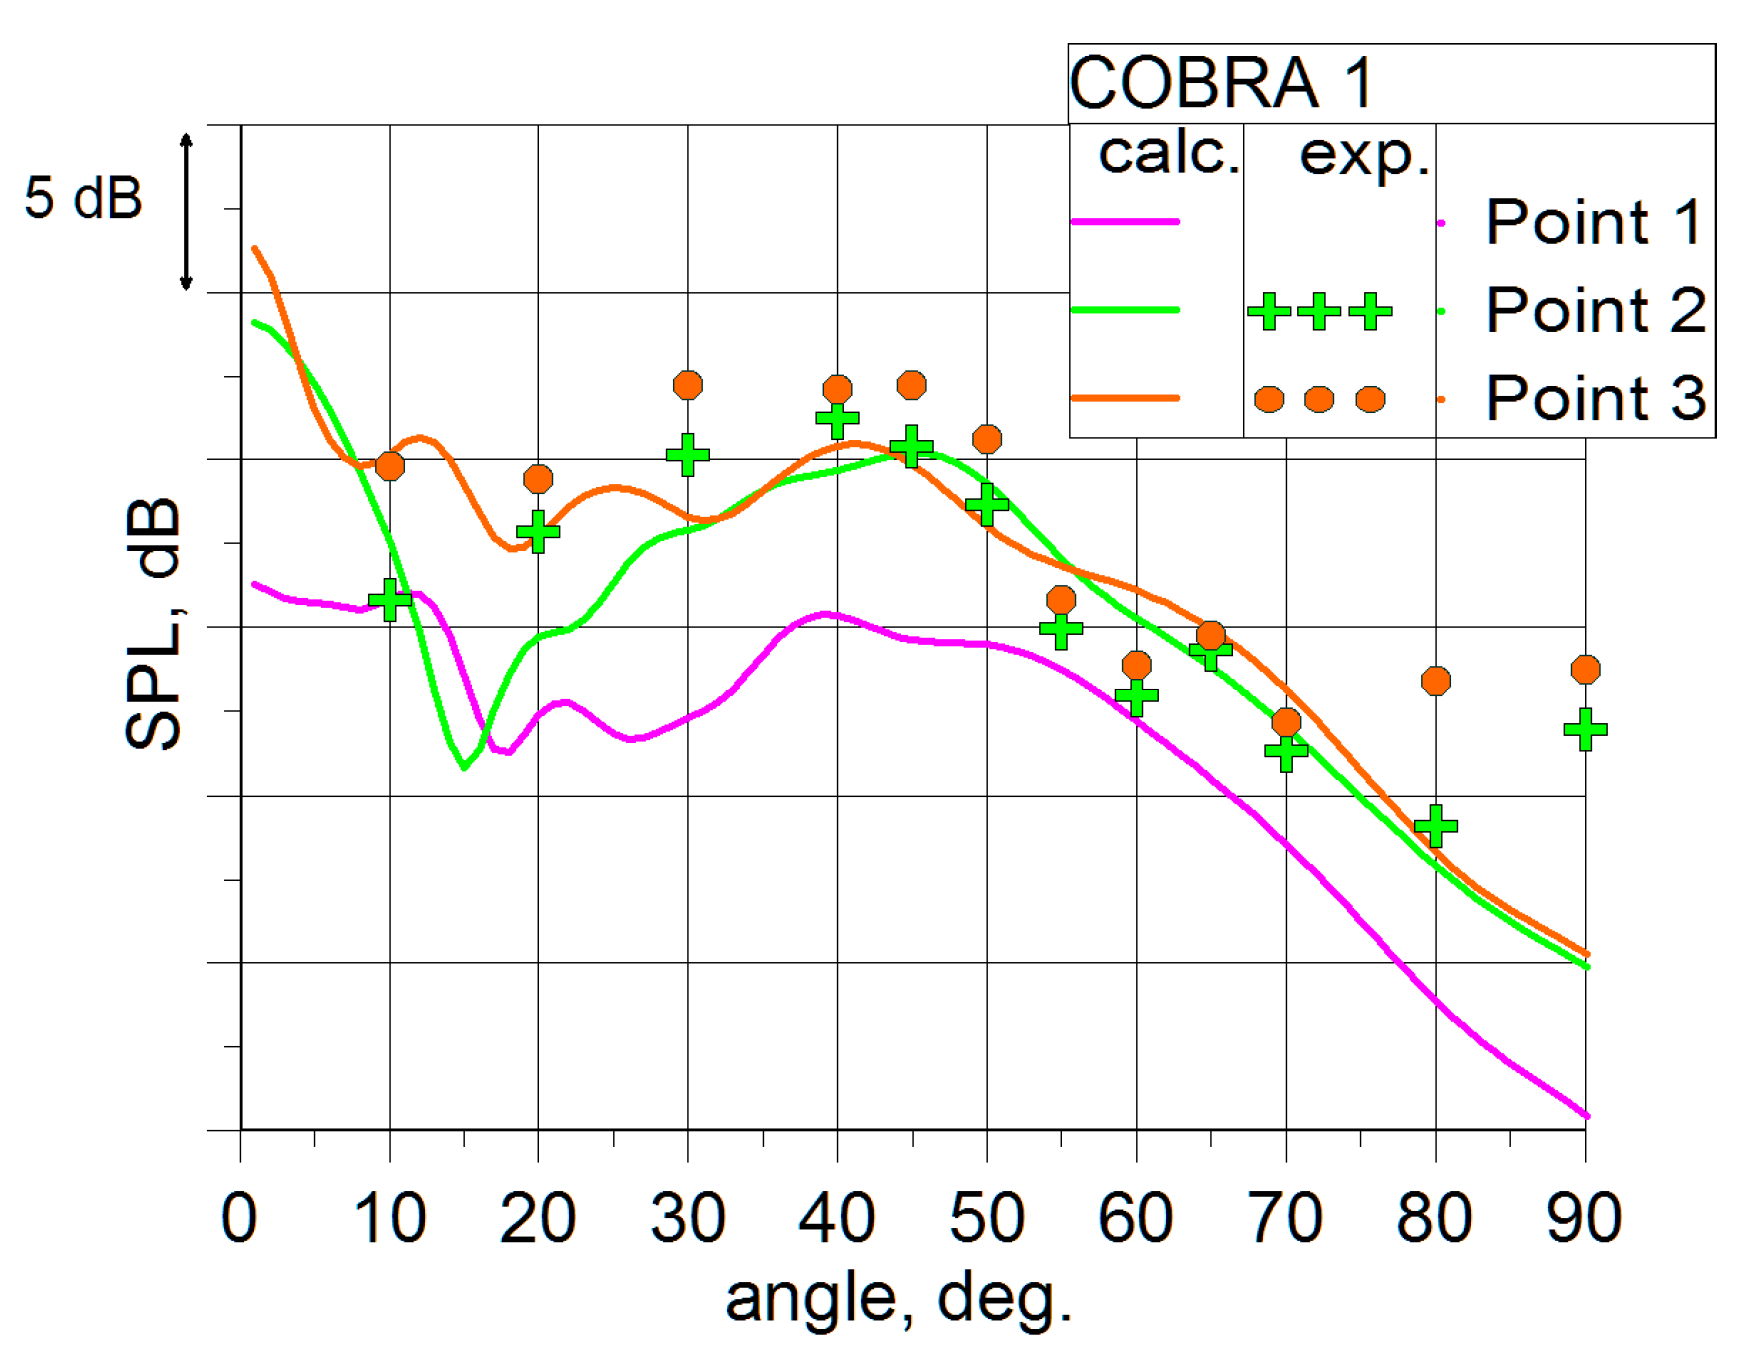
Unfortunately, there is no experimental data available for the COBRA1 fan operated at Gcor = 46.276 kg/s and N1/N2 = 0.90, due to the experimental limitations. The closest operational points, for which experimental data are available, are those with Gcor = 43.072 kg/s, π* = 1.063, N1/N2 = 0.93, N = 53% and Gcor = 44.153 kg/s, π* = 1.066, N1/N2 = 0.98, N = 54%. For these operational points we also performed SPL calculations of the tone noise in the specified frequency range. In Figure 43 the results of the calculations for these three points (which are denoted successively as Point 1, Point 2 and Point 3) and the results of the experiment tests for the last two operational points are presented. We see significantly lower SPL for Point 1 than for the others. The analyses of both computational and experimental data showed that this effect is mostly caused by the decreased load of the first rotor. The results of the comparison between the calculations and the experiments for the other two operational points show a quite good agreement. These results gave credit to the comparison of the COBRA1 tone noise with the CRTF1 tone noise presented in Figure 43.
12. Conclusions
The presented experimental analysis of the performance of several modern fan with HBR inside the C-3A test chamber clearly demonstrates that such a unique facility meets all requirements to assess the gasdynamic, acoustic, and mechanical strength characteristics of the last generation fans. With reference to the C-3A test facility, a family of counter rotating model fans with large bypass ratio (inside the EU funded VITAL program) was developed. Tests of the fans gave evidences of their excellent aerodynamic and acoustic performance comparable with the best single-row type fans, and summarized below:
- adiabatic efficiency: η*ad > 92%;
- high stall margins: ΔSM ≥ 17%;
- high stability against inlet flow distortion;
- acoustic characteristics that are comparable with a single-row fan of a “reference engine” 2000—the CFM56-7B.
A family of slot-type casing treatments (CTs) installed above the rotors was developed for additional improvement of the CRTF acoustic characteristics and stall margins. The presented optimization of the CT parameters showed the potential for an increase in the overall acoustic efficiency of counter rotating fans by 3.2 dB and a stall margin by ~3–4% without a decrease in efficiency (≤0.2%), as demonstrated by tests of the CRTF2A model in three operating conditions—runway, flyover and approach. These results clearly proved that the counter rotating fan technology is now competitive with a conventional single-row one.
An increase in the bypass-ratio up to ultra-high values m = 18–20 and a decrease in tip speeds by ΔUB ≈ 60 m/s in comparison with CRTF2A fan resulted in an additional improvement of the aerodynamic and acoustic characteristics of the counter rotating fans (achievements of the EU funded “COBRA” project). Tests of the COBRA model at the C-3A test facility showed unique results in terms of:
- adiabatic efficiency—η*ad ≥ 93.4%;
- improvements of the acoustic characteristics by 6 dB relative to the CRTF1 fan for three certification points (runway, flyover and approach).
The C-3A test facility showed its high performance in aerodynamic and acoustic tests and operational development of single-row model fans for direct drive engines with Utip ≈ 370–400 m/s as well as geared engines with Utip ≈ 315–330 m/s.
Funding
This research was supported by Central Institute of Aviation Motors named after P.I. Baranov (CIAM), Moscow, Russian Federation.
Acknowledgments
I am thankful to my colleagues for their insight and expertise that greatly assisted the research. I express my sincere gratitude to European partners working with CIAM under VITAL, DREAM, and COBRA European programs.
Conflicts of Interest
The author declares no conflict of interest.
Nomenclature
| CDP | Cruise design point |
| CT | Casing treatment |
| GTE | Gas Turbine Engine |
| HBR | High Bypass Ratio Fan |
| UHBR | Ultra High Bypass Ratio Fan |
| bm | rotor chord at the mid span, mm |
| Dn | diameter of a nominal nozzle, mm |
| Dopen | diameter of an open nozzle, mm |
| Dclose | diameter of a closed nozzle, mm |
| Ffr.area | frontal section area |
| Gcor | corrected mass flow rate |
| Gcor/GcorCDP | corrected mass flow rate/corrected mass flow rate at a design point |
| Gcor/Ffr area | specific mass flow rate |
| h | CT slot height in mm or a blade height, mm |
| m | Bypass Ratio |
| Nav | average rotor speed (n1 + n2)/2, rpm |
| n1 | R1 speed |
| n2 | R2 speed |
| cor | corrected rotational speed |
| Pst | static pressure, kPa |
| Pt | total pressure, kPa |
| Pt inlet | total pressure at the inlet, kPa |
| Sc | relative area of an “effective” cross-section of the screen here c—frontal area of distortion device elements |
| Tt | total temperature, °C |
| T*t inlet | total temperature at the inlet, °C |
| Utip | mechanical tip speed of a fan blade leading edge, m/s |
| Δx | axial gap between R1 and R2 at mid radius, mm |
| Z | number of blades in a row or number of slots in a casing treatment (CT) |
| α | flow angle, degrees |
| η*ad/η*ad.CDP | adiabatic efficiency/adiabatic efficiency at a design point |
| π* | total pressure ratio of the fan model |
| π*/π*CDP | total pressure ratio/total pressure ratio at a design point |
| σB | outlet to inlet pressure ratio at the screen (pressure recovery factor) |
| σc | total pressure drop in the screen |
References
- Talbotec, J.; Vernet, M. Snecma counter rotating fan aerodynamic design logic & tests results. In Proceedings of the 27th International Congress of Aeronautical Sciences, Nice, France, 19–24 September 2010. ICAS2010-087. [Google Scholar]
- Cailleau, J.-M. CRTF fan aerodynamic & Acoustic design & concept improvement—Preliminary results. In Proceedings of the VITAL Workshop, Budapest, Hungary, 9–10 March 2009. [Google Scholar]
- Mileshin, V.I.; Pankov, S.V.; Fateev, V.A.; Shchipin, S.K. Ducted counter rotating fan blades optimization based on 3D inverse problem solution aiming at fan gasdynamics improvement. In Proceedings of the ISABE International Conference, Montreal, QC, Canada, 7–11 September 2009. ISABE-2009-1334. [Google Scholar]
- Lengyel, T.; Voß, C.; Schmidt, T.; Nicke, E. Design of a counter rotating fan. An aircraft engine technology to reduce noise and CO2 emissions. In Proceedings of the ISABE Conference, Montreal, QC, Canada, 7–11 September 2009. ISABE2009-1267. [Google Scholar]
- Lengyel-Kampmann, T.; Bischoff, A.; Meyer, R.; Nicke, E. Design of an Economical Counter Rotating Fan: Comparison of the Calculated and Measured Steady and Unsteady Results. In Proceedings of the ASME Turbo Expo 2012, Copenhagen, Denmark, 11–15 June 2012. GT2012-69587. [Google Scholar]
- Goutines, M. Main achievements of VITAL Innovation for Sustainable Aviation in a Global Environment. In Proceedings of the Sixth European Aeronautics Days, Madrid, Spain, 30 March–1 April 2011; IOS Press: Amsterdam, The Netherlands, 2011. [Google Scholar]
- Khaletskiy, Yu.; Mileshin, V.; Talbotec, J.; Nicke, E. Study on Noise of Counter Rotating Fan Models at CIAM Anechoic Chamber. In Proceedings of the 28th International Congress of Aeronautical Sciences, Brisbane, Australia, 23–28 September 2012. Paper ICAS2012-897. [Google Scholar]
- Mileshin, V.I. Key-note speech “Numerical and experimental investigation of bypass fan stage models and high loaded compressor stages for development of new fan and high pressure compressor for advanced engines”. In Proceedings of the ETC10 Conference, Lappeenranta, Finland, 15–19 April 2013. [Google Scholar]
- Mileshin, V.I. Key-note speech “Challenges in fan and high pressure compressor development”. In Proceedings of the ISABE Conference, Busan, Korea, 9–13 September 2013. ISABE2013-1003. [Google Scholar]
- Mileshin, V.I. Key-note speech “Advanced Fan and High Pressure Compressor Designs and Materials for Civil Engines”. In Proceedings of the 6th Annual China Commercial Aircraft Convention, Shanghai, China, 20–21 November 2014. [Google Scholar]
- Mileshin, V.I. Key-note speech “Challenges in fan and high pressure compressor development”. In Proceedings of the 29th International Congress of Aeronautical Sciences, Saint Petersburg, Russia, 7–12 September 2014. ICAS2014-1026. [Google Scholar]
- Ben Nasr, N. COBRA—Innovative Counter rOtating fan system for ultra high Bypass Ratio Aircraft engine. In Proceedings of the 7th European Aeronautics Days “Aviation in Europe—Innovating for Growth”, London, UK, 20–23 October 2015. [Google Scholar]
- Druzhinin, I.; Rossikhin, A.; Mileshin, V. Computational investigation of aerodynamic and acoustic characteristics of counter rotating fan with ultra high bypass ratio. In Proceedings of the12th European Conference on Turbomachinery Fluid Dynamics & Thermodynamics, Stockholm, Sweden, 3–7 April 2017. ETC2017-146. [Google Scholar]
- Scheugenpflug, H. Technologies for the Next Engine Generation. In Proceedings of the ISABE Conference, Busan, Korea, 9–13 September 2013. ISABE2013-1007. [Google Scholar]
- Scheugenpflug, H. Technologies for the Next Engine Generation. In Proceedings of the 29th International Congress of Aeronautical Sciences Conference, Saint Petersburg, Russia, 2014. Key-Note Speech 2014-1024. [Google Scholar]
- Benzakein, M.J. The Future of the Jet Engine; GE Aircraft Engines: Cincinnati, OH, USA, 2006. [Google Scholar]
- Benzakein, M.J. Propulsion Strategy for the 21st Century—A Vision into the Future. In Proceedings of the ISABE Conference, Bangalore, India, 3–7 September 2001. ISABE2001-1005. [Google Scholar]
- Chuiko, V.M. (Ed.) Aviadvigatelestroenie. In Encyclopedia; Aviamir: Moscow, Russia, 1999; pp. 54–55. [Google Scholar]
- Holste, F.; Neise, W. Experimental determination of the main noise sources in a propfan model by analysis of the acoustic spinning modes in the exit plane. In Proceedings of the DGLR/AIAA Aeroacoustics Conference—14th A1AA Aeroacoustics Conference, Aachen, Germany, 11–14 May 1992. DGLR/AIAA 92-02-138. [Google Scholar]
- Holste, F.; Neise, W. Acoustical near field measurement on a propfan model for noise source identification. In Proceedings of the 1st CEAS/AIAA Aeroacoustics Conference—16th AIAA Aeroacoustics Conference, Munich, Germany, 12–15 June 1995. CEAS/AIAA-95-178. [Google Scholar]
- Leicher, S. Calculation of Flow along a Cowl of a Shrouded Propfan Using a 3D-Euler Code. In Proceedings of the 16th International Congress of Aeronautical Sciences, Jerusalem, Israel, 28 August–2 September 1988. ICAS-88-5.1.4. [Google Scholar]
- Schnell, R. Experimental and Numerical Investigation of Blade Pressure Fluctuations on a CFK-bladed, Counterrotating Propfan. In Proceedings of the ASME Turbo Expo Conference, New Orleans, LA, USA, 4–7 June 2001. 2001-GT-0298. [Google Scholar]
- Popovyan, A.G.; Mileshin, V.I.; Skibin, V.A.; Khaletskii, I.D.; Steshakov, E.G.; Tikunov, A.M.; Nikotin, A.V.; Denisov, M.Yu. Test Facility Designed for Aerodynamic and Acoustic Investigations of Fan Models for Turbofan Engine (Turbofan). Russian Patent RU 2337342, 27 October 2008. [Google Scholar]
- Pankov, S.V.; Mileshin, V.I.; Orekhov, I.K.; Fateev, V.A. Development of the Fan Stage with Ultra-low Rotational Speed. In Proceedings of the 30th International Congress of Aeronautical Sciences, Seoul, Korea, 25–30 September 2016. ICAS2016-0261. [Google Scholar]
- Pankov, S.V.; Mileshin, V.I.; Orekhov, I.K.; Fateev, V.A. Development of direct-driven and geared fan stages with reduced tip speeds. In Proceedings of the ASME Turbo Expo Conference, Charlotte, NC, USA, 26–30 June 2017. GT2017-64585. [Google Scholar]
- Gelmedov, F.Sh.; Mileshin, V.I.; Kozhemyako, P.G.; Orekhov, I.K. Stall margin improvement in three-stage low pressure compressor by use of slot type casing treatments. In Proceedings of the ASME Turbo Expo 2014, Düsseldorf, Germany, 16–20 June 2014. GT2014-26298. [Google Scholar]
- Brailko, I.A.; Mileshin, V.I.; Volkov, A.M.; Korzhnev, V.N. Numerical and experimental investigations of CRF with simulation of flow non-uniformity in the basic flight conditions. In Proceedings of the 27th International Congress of Aeronautical Sciences, Nice, France, 19–24 September 2010. ICAS2010-420. [Google Scholar]
- Pankov, S.V.; Mileshin, V.I.; Korzhnev, V.N. Numerical and experimental investigations bypass-flow fans for an advanced civil aircraft engine. In Proceedings of the 29th International Congress of Aeronautical Sciences, St. Petersburg, Russia, 7–12 September 2014. ICAS2014-0104. [Google Scholar]
- Rossikhin, A.A.; Pankov, S.V.; Khaletskiy, Y.; Mileshin, V. Computational study on acoustic features of fan model with leaned stators. In Proceedings of the ASME Turbo Expo 2014, Düsseldorf, Germany, 16–20 June 2014. GT2014-26350. [Google Scholar]
- Khaletskii, Iu.; Mileshin, V. Experimental study of casing treatment impact on ducted counter rotating fan noise. In Proceedings of the 22nd International Congress on Acoustics, Buenos Aires, Argentina, 5–9 September 2016. ICA2016-0108. [Google Scholar]
- Khaletskii, Iu.; Mileshin, V.; Korzhnev, V.; Pochkin, Ya. Influence of the casing treatment design parameters on the ducted counter rotating fan noise. In Proceedings of the 24nd International Conference on Sound and Vibrations, London, UK, 23–27 July 2017. ICSV-364. [Google Scholar]
- Nyukhtikov, M.A.; Rossikhin, A.A.; Sgadlev, V.V.; Brailko, I.A. Numerical method for turbo-machinery tonal noise generation and radiation simulation using CAA approach. In Proceedings of the ASME Turbo Expo 2008: Power for Land, Sea and Air, Berlin, Germany, 9–13 June 2008. GT2008-51182. [Google Scholar]
Figure 1.
IL-76 with NK-93. (a) Side view; (b) Front view.
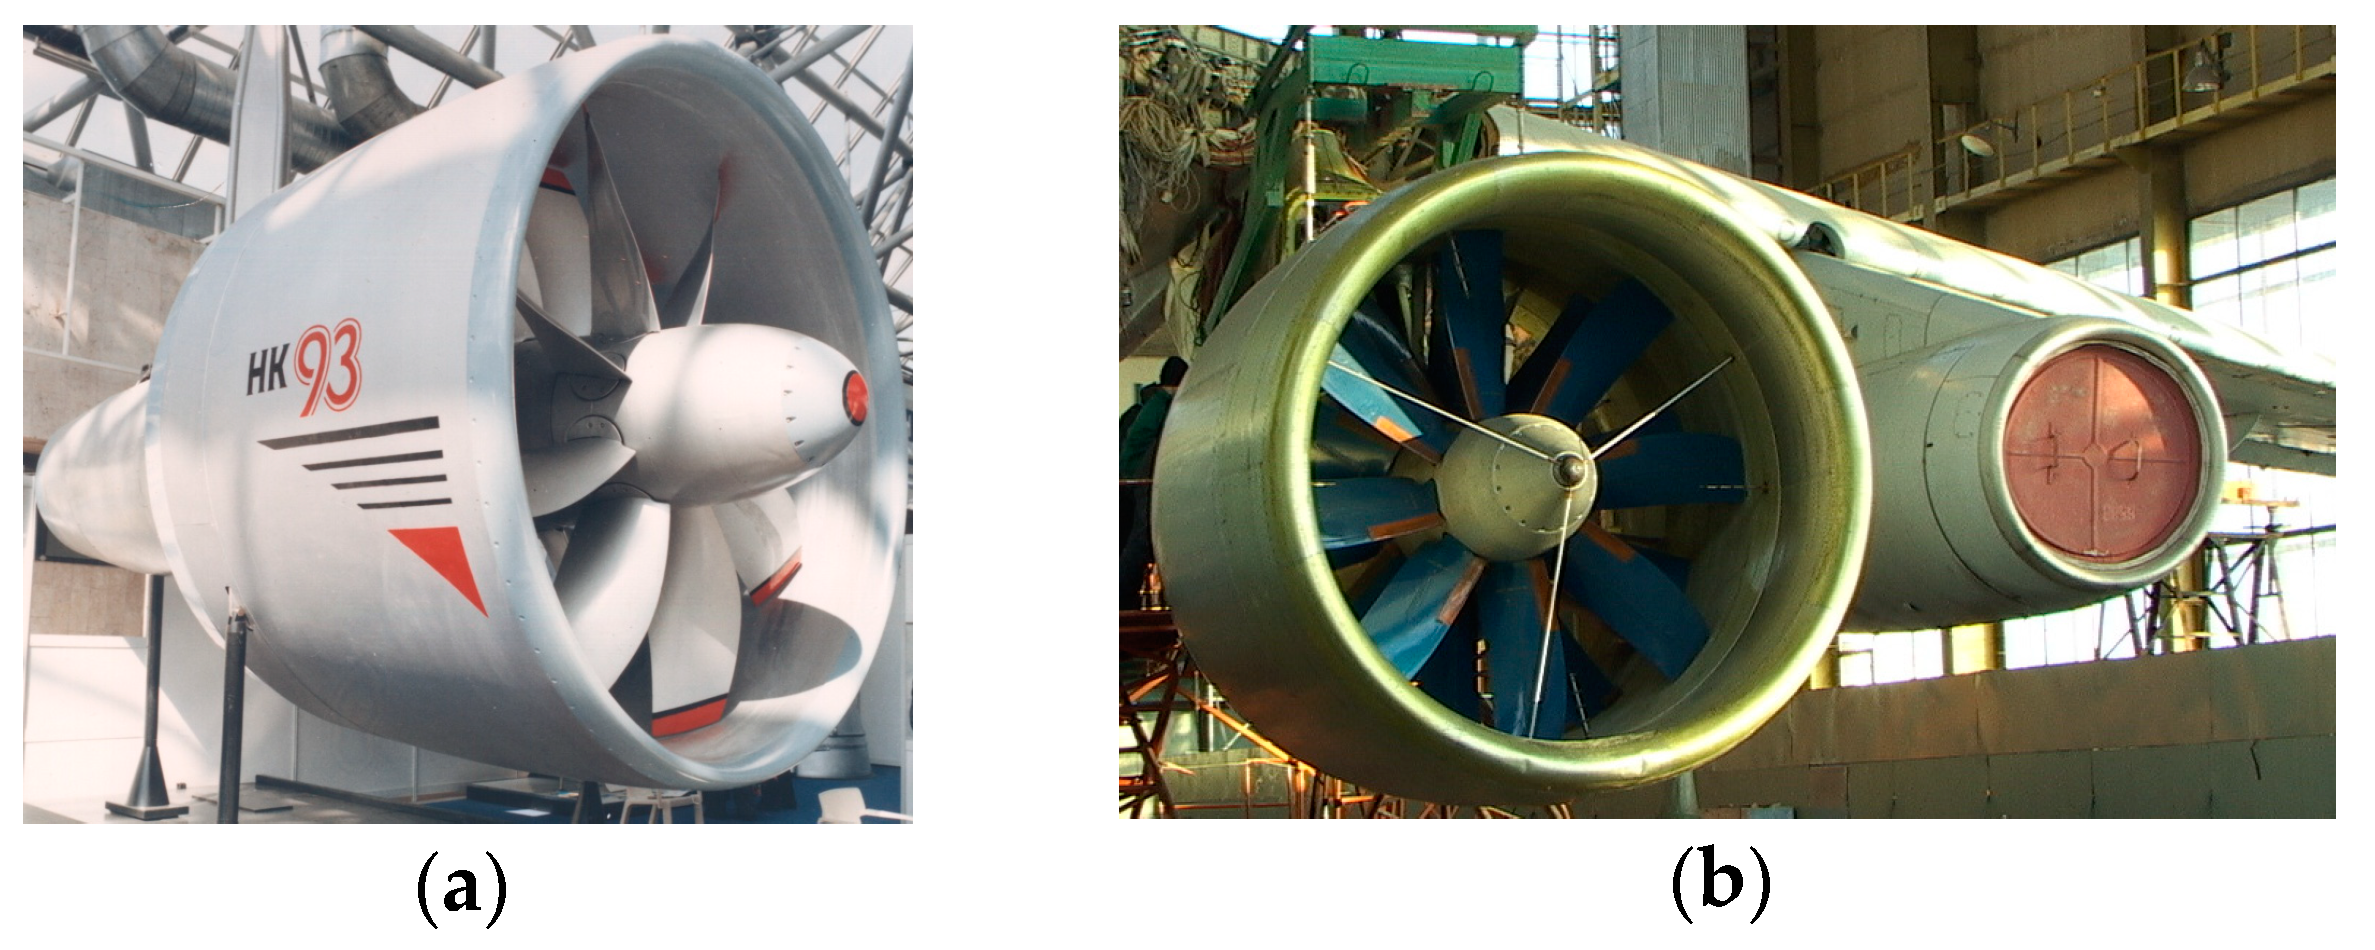
Figure 2.
C-3A acoustic test facility with the anechoic chamber, without turbulence control screen (TCS).
Figure 2.
C-3A acoustic test facility with the anechoic chamber, without turbulence control screen (TCS).

Figure 3.
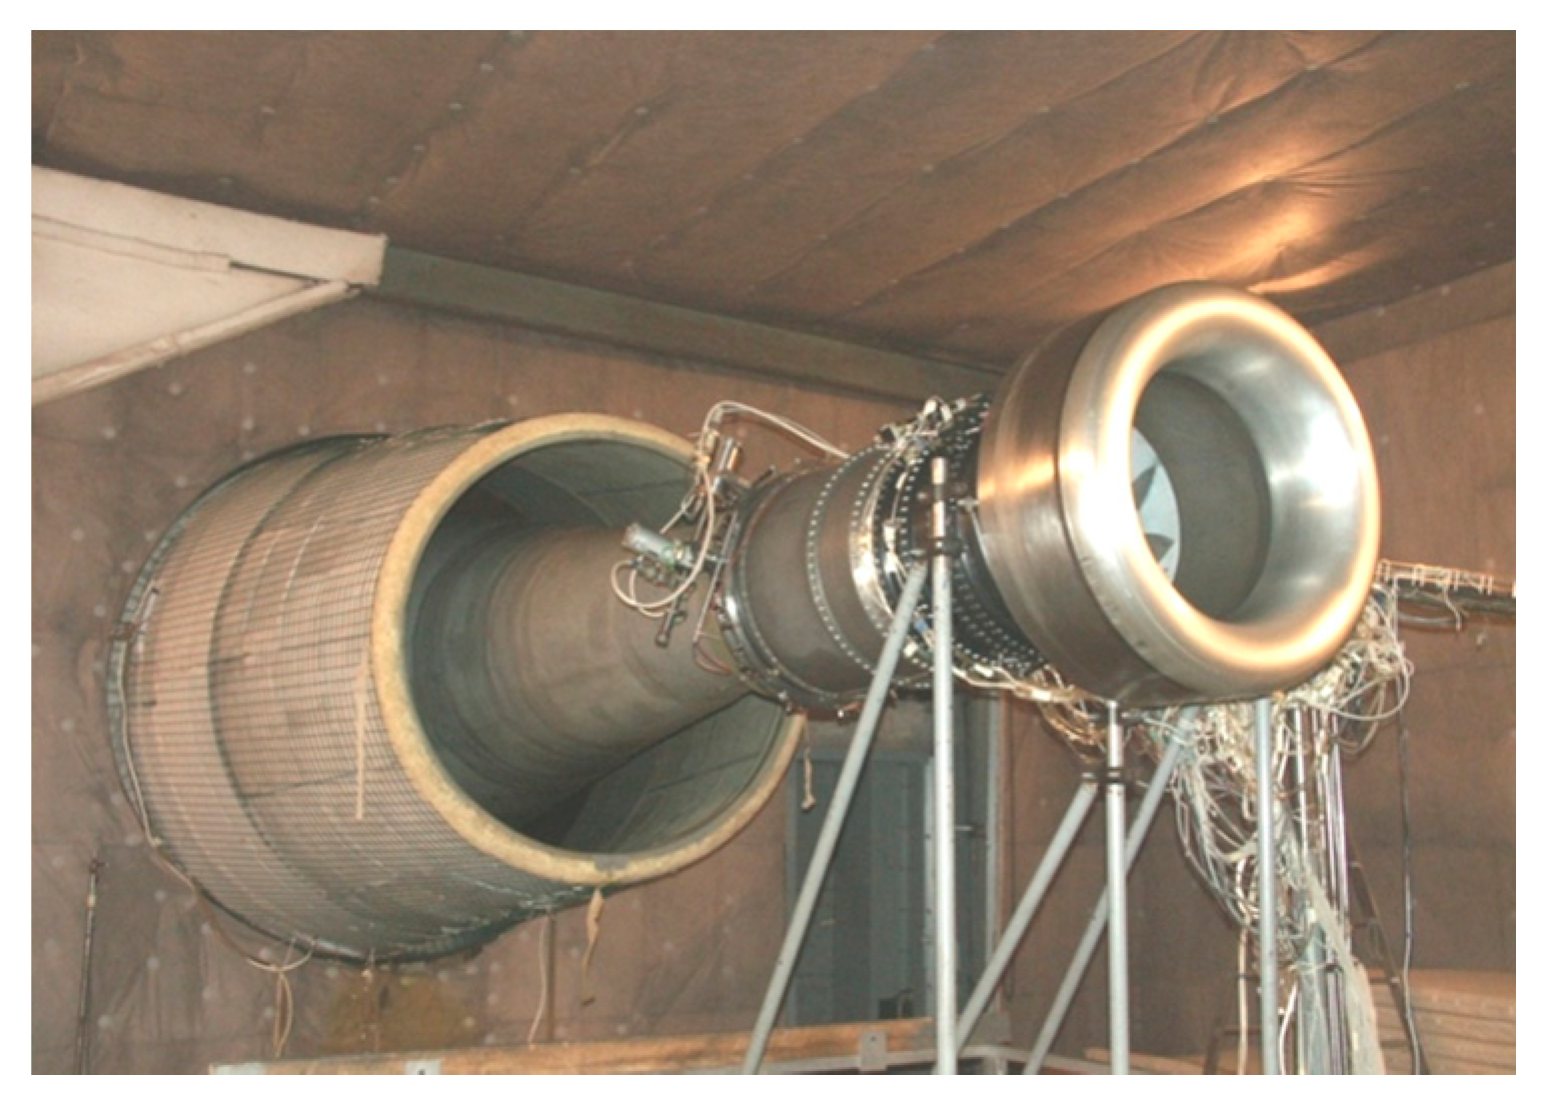
Counter rotating ducted fan technology (CRTF) model fan with TCS installed in the anechoic chamber of the C-3A test facility.
Figure 3.
Counter rotating ducted fan technology (CRTF) model fan with TCS installed in the anechoic chamber of the C-3A test facility.
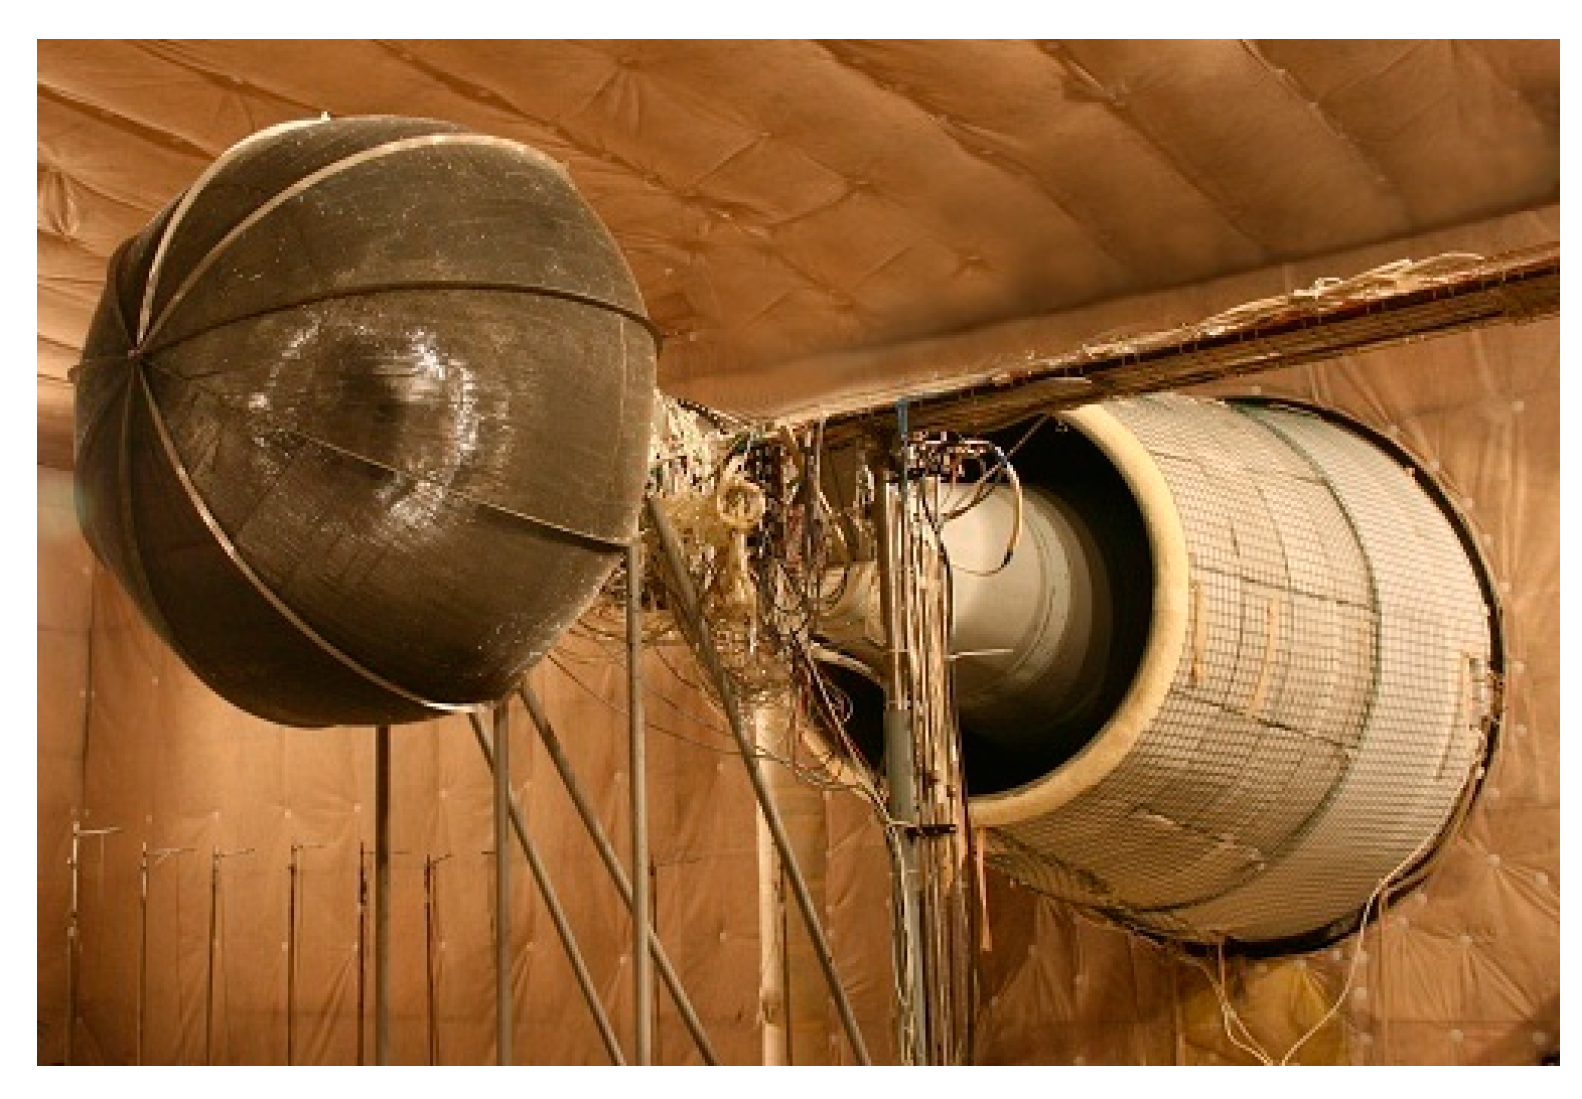
Figure 4.
The cantilever of the C-3A test facility is composed of modules with a specific length that provide beneficial dynamic characteristics of the counter rotating shafting–casing system.
Figure 4.
The cantilever of the C-3A test facility is composed of modules with a specific length that provide beneficial dynamic characteristics of the counter rotating shafting–casing system.
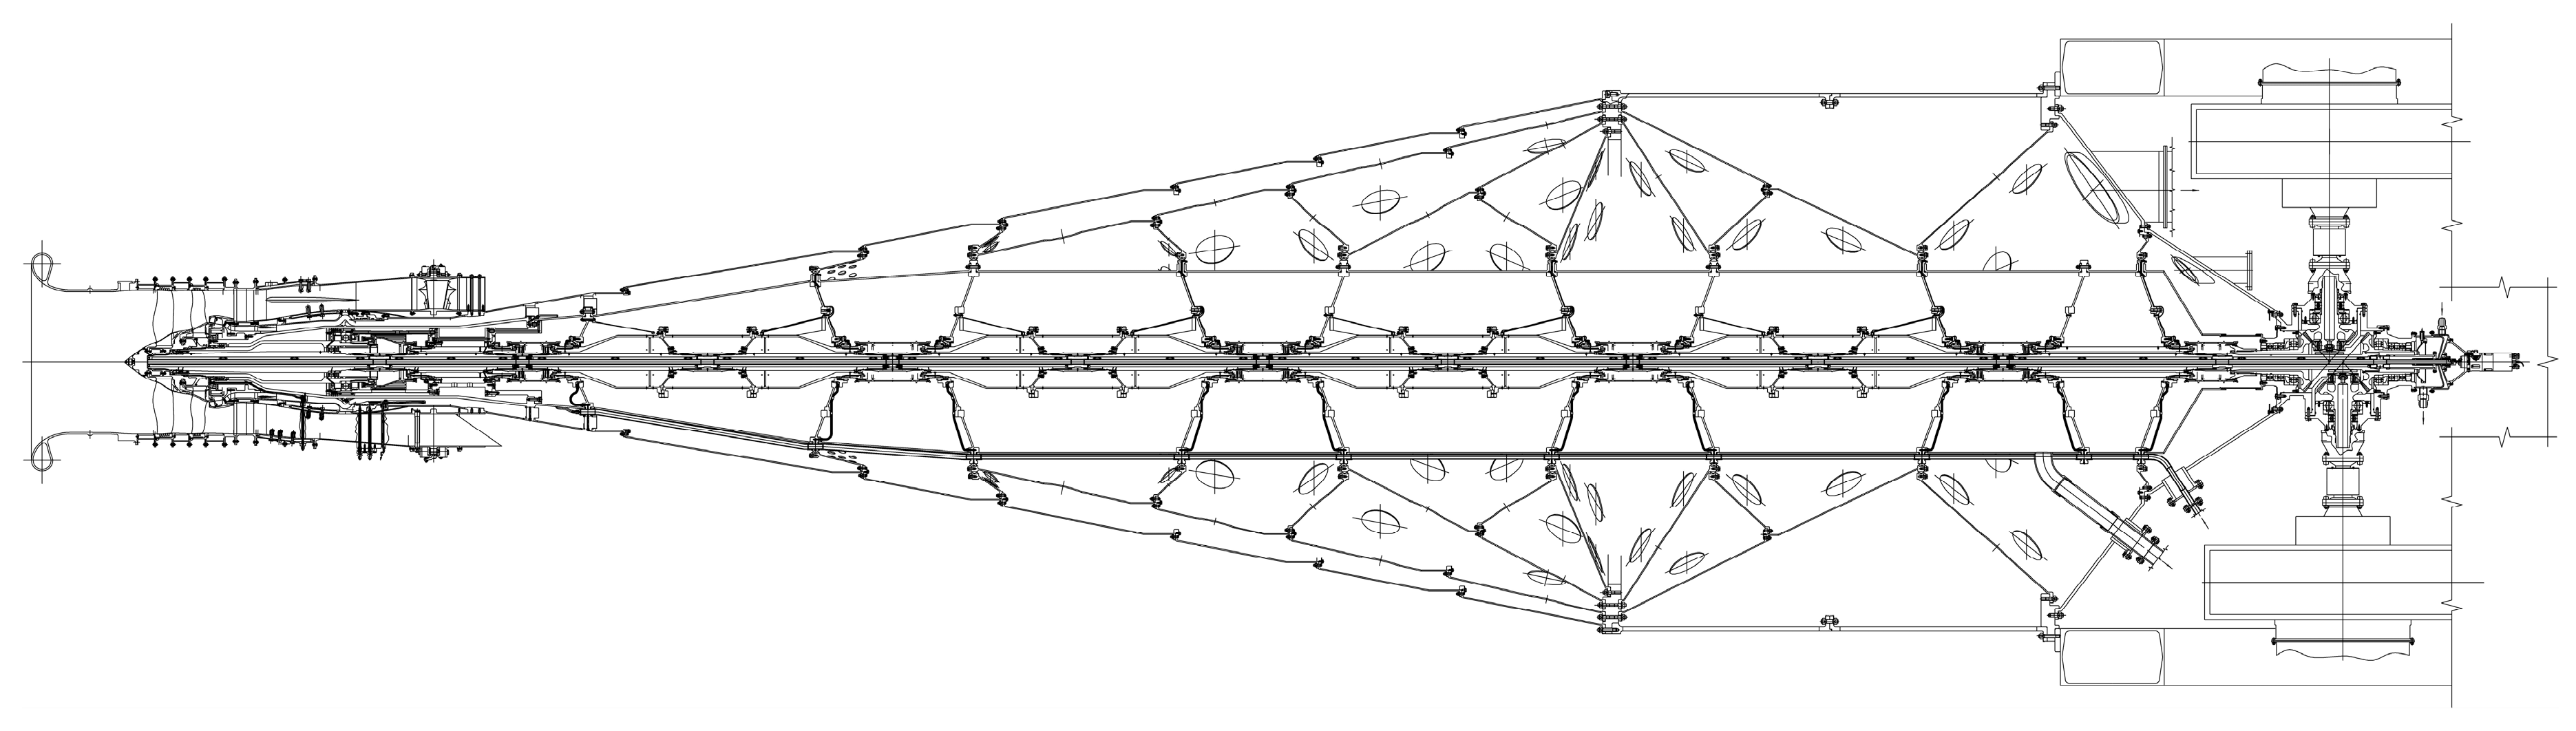
Figure 5.
Comparison of calculated data for two vibration modes with (a) n1 = 5500 rpm and (b) n2 = 12,180 rpm using the simplified beam model found by the Central Institute of Aviation Motors’ (CIAM) software package and by ANSYS software for the rotor–casing system with a nacelle installed in the cantilever part of the casing.
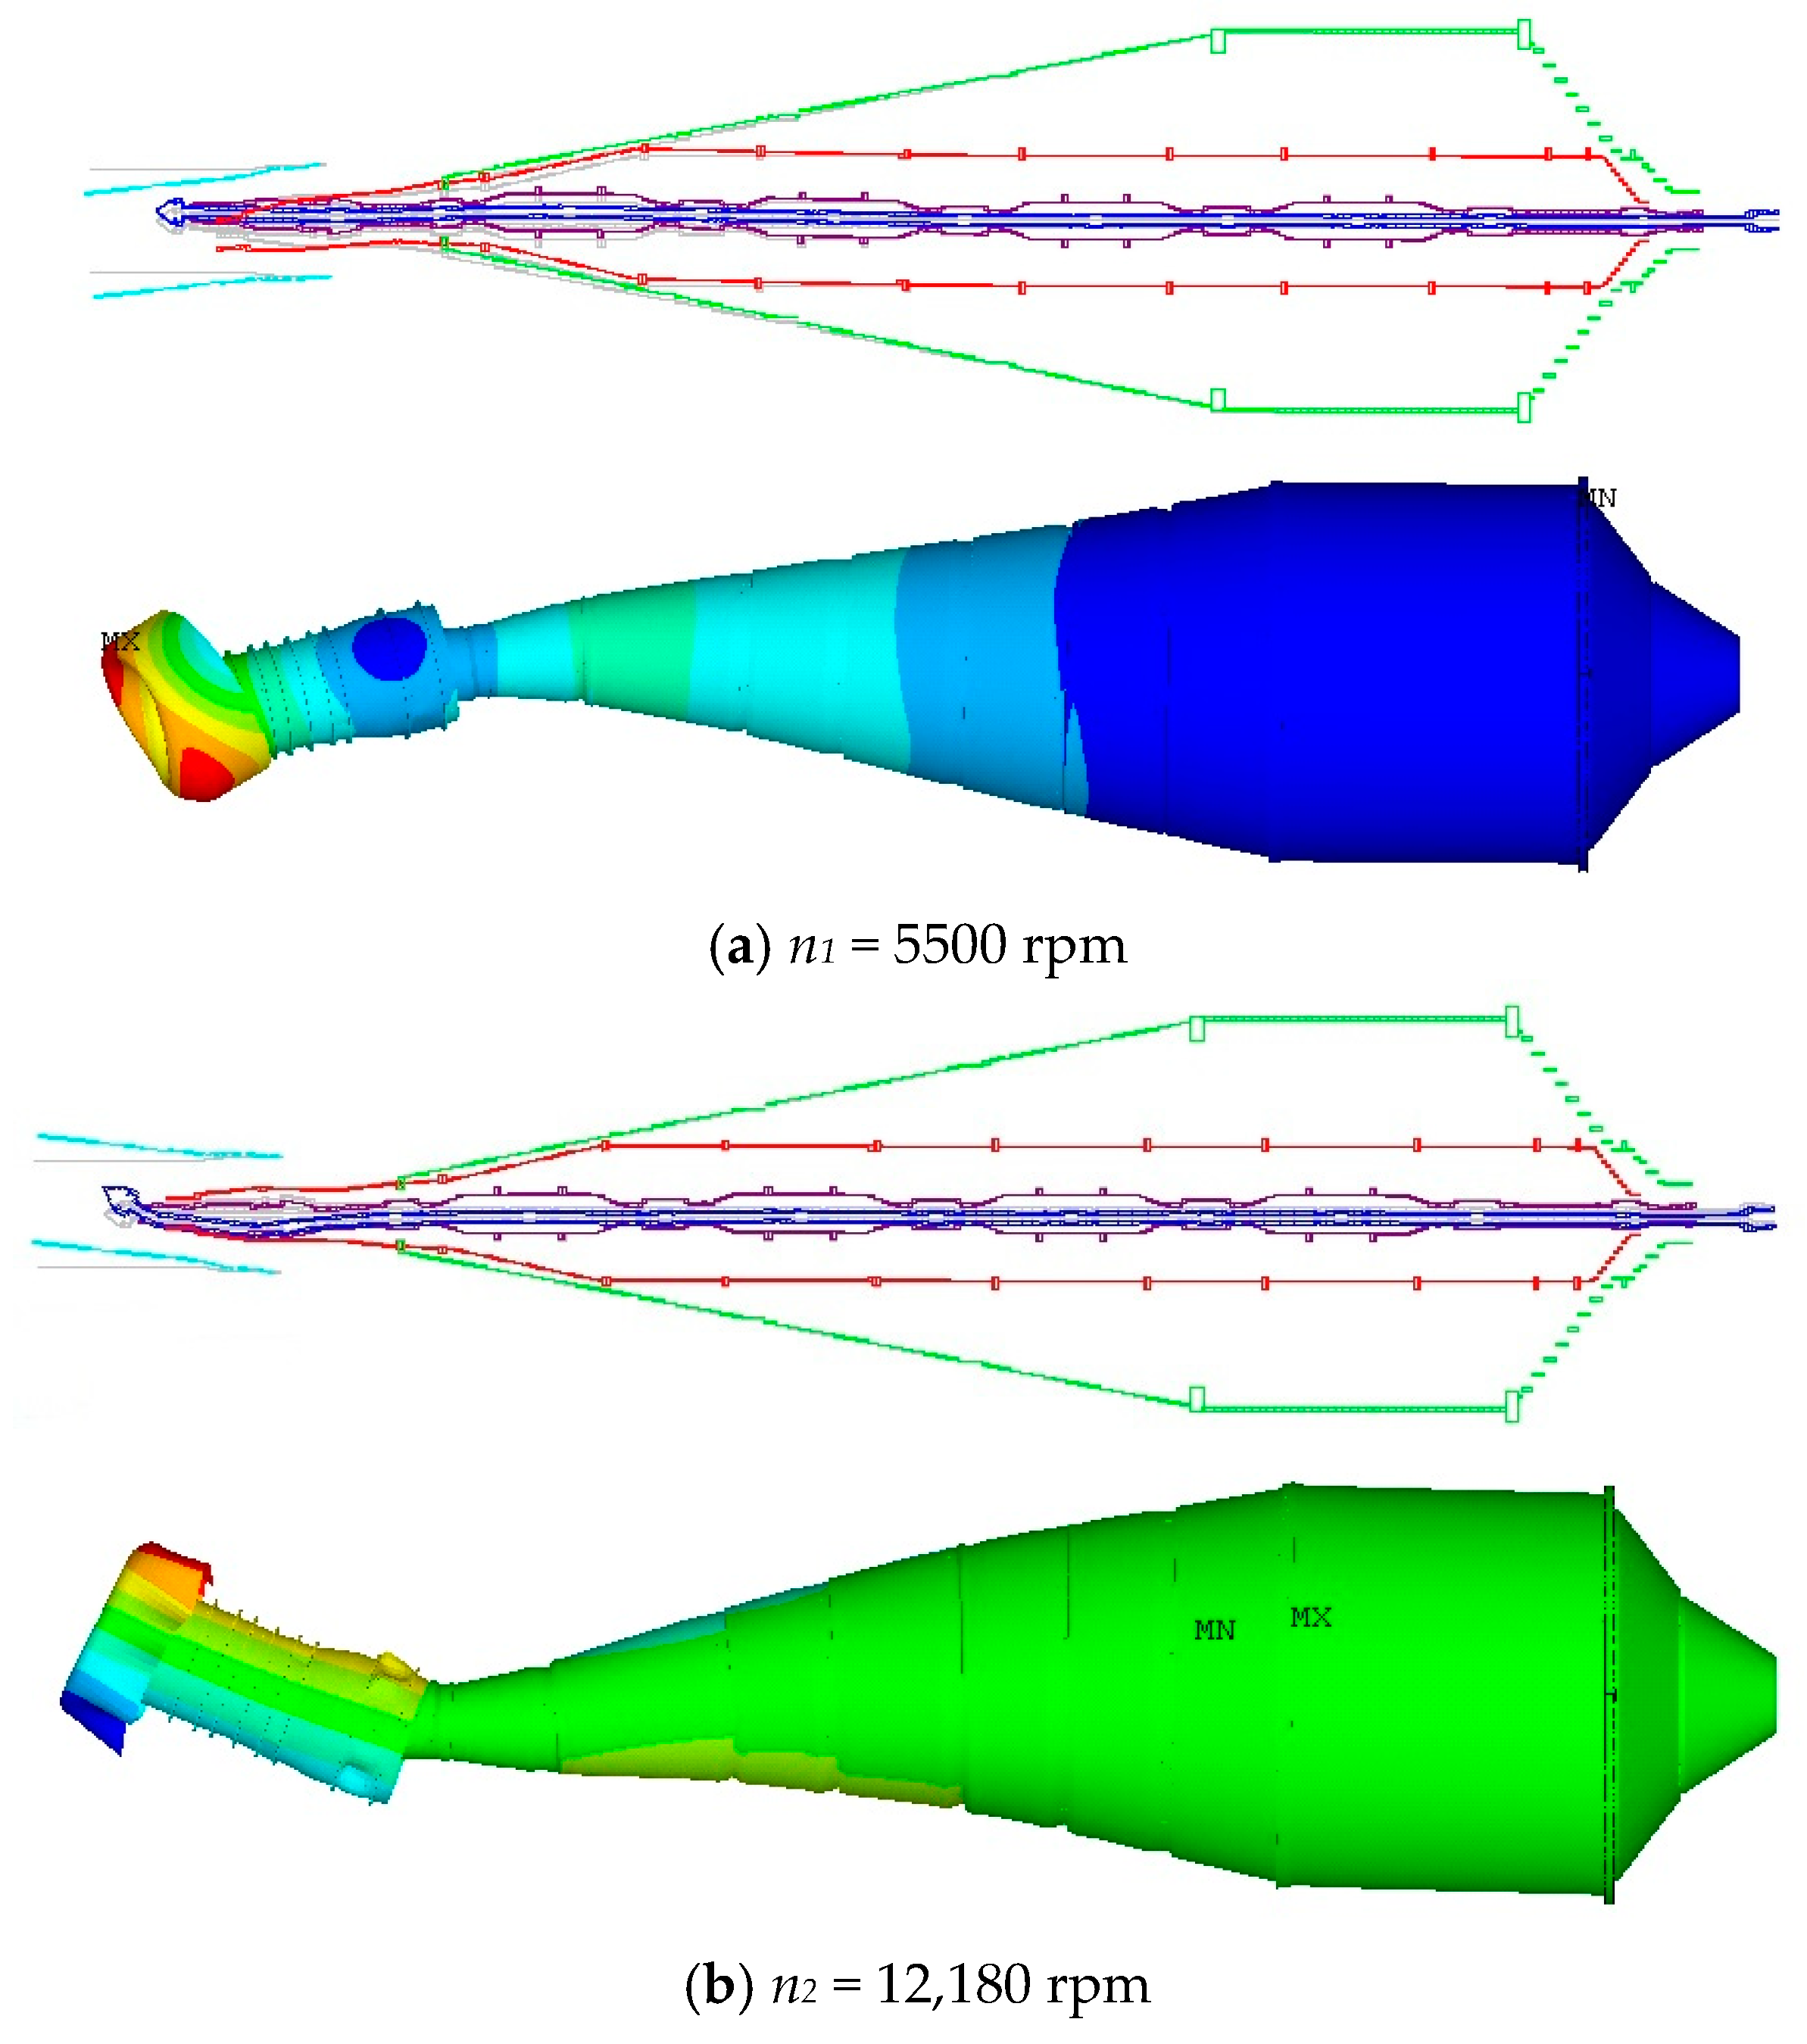
Figure 6.
Model fans developed and tested under the European VITAL project at the C-3A test facility with the anechoic chamber. (a) CRTF1; (b) SRF; (c) CRTF2b; (d) CRTF2a.
Figure 6.
Model fans developed and tested under the European VITAL project at the C-3A test facility with the anechoic chamber. (a) CRTF1; (b) SRF; (c) CRTF2b; (d) CRTF2a.

Figure 7.
CIAM estimations of the VITAL project results.
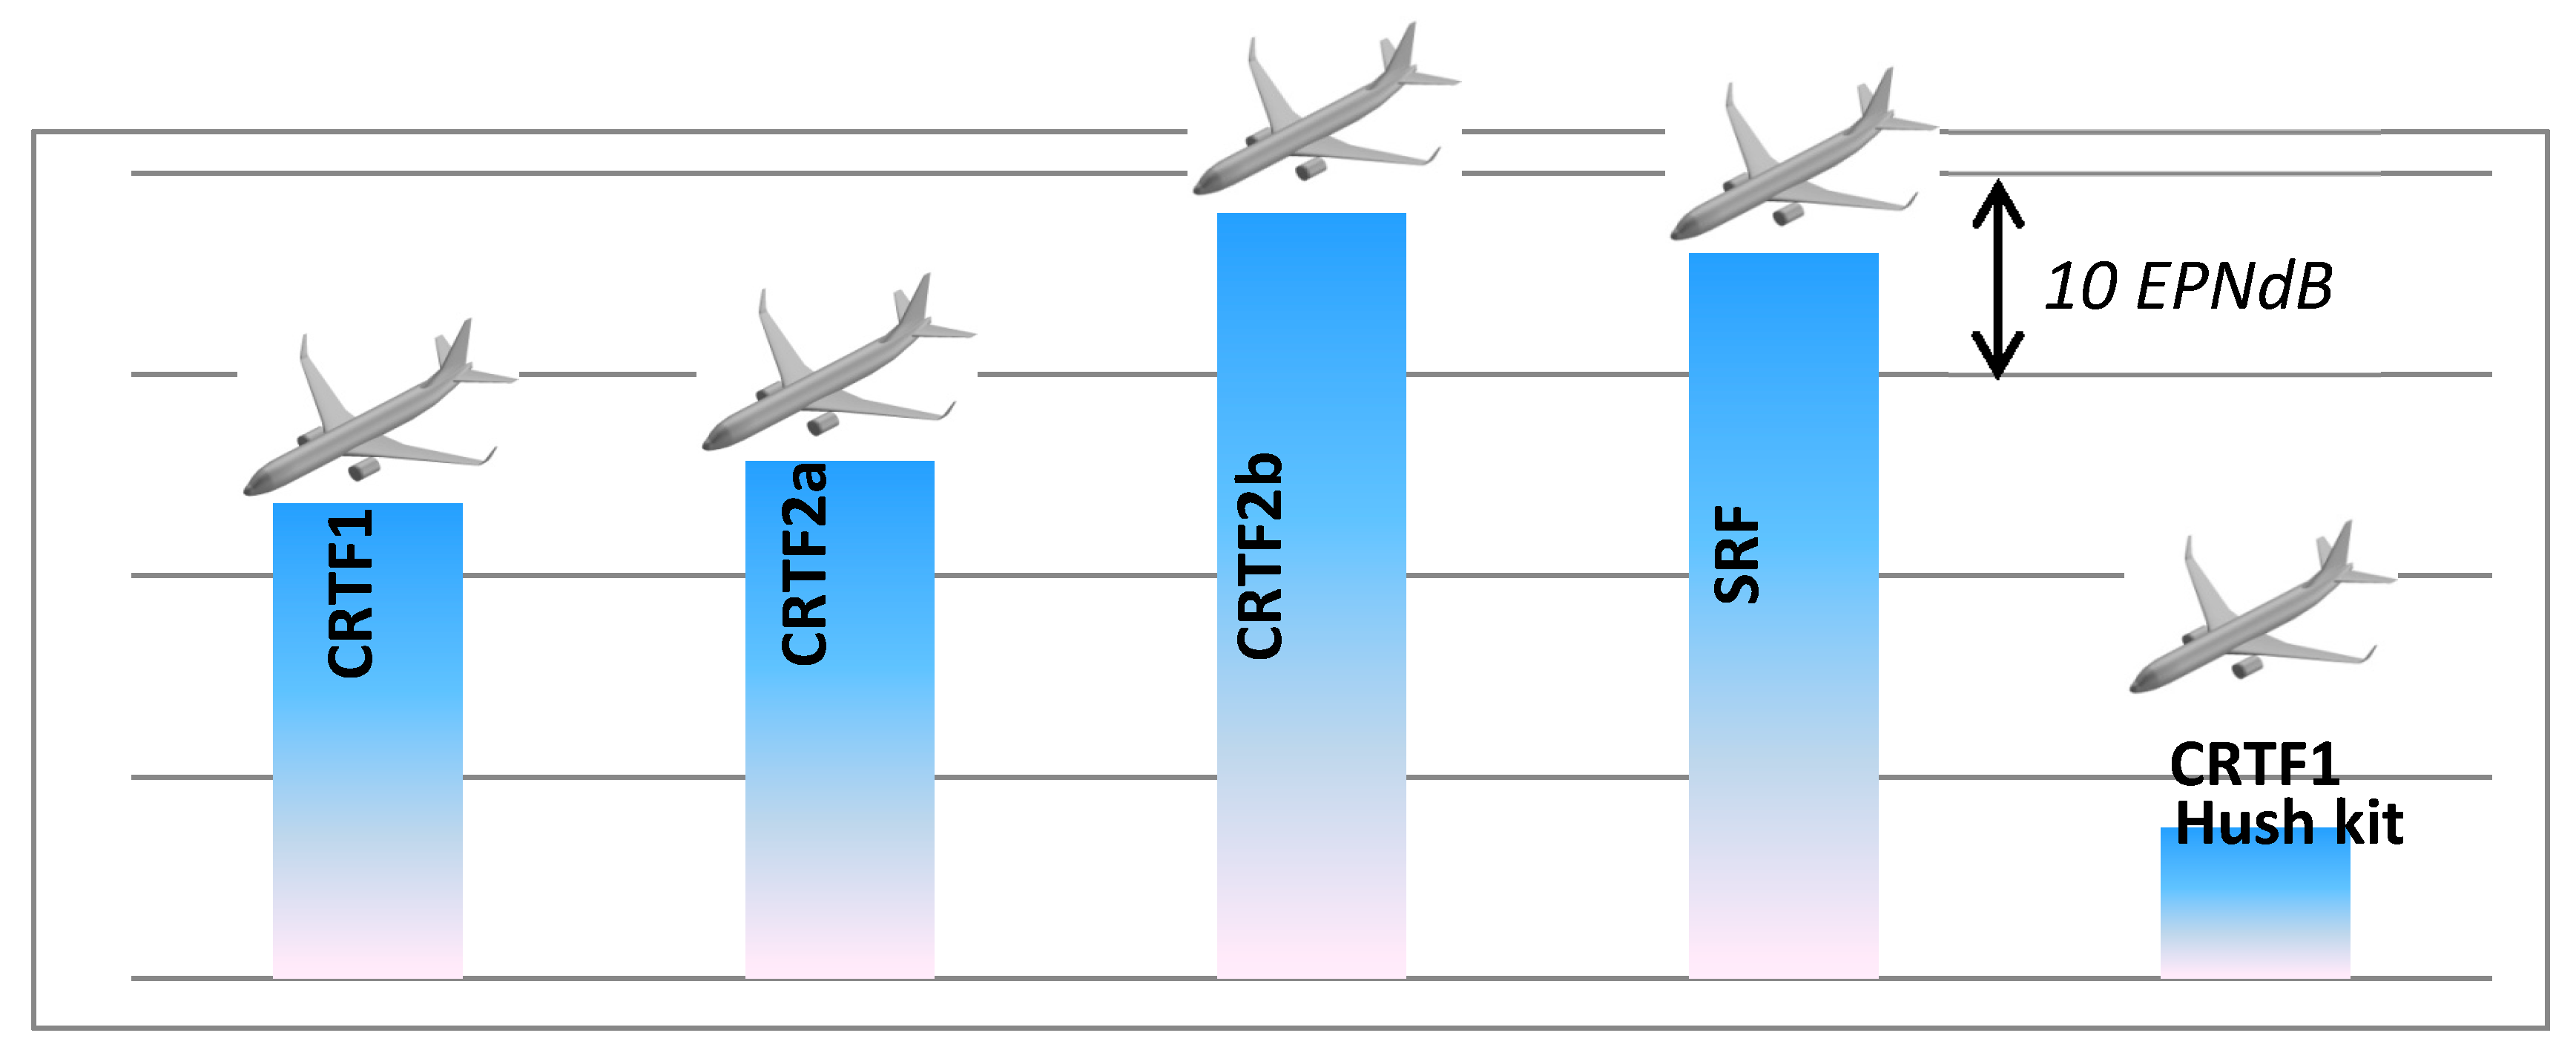
Figure 8.
Counter rotating ducted CRTF1 model fan with solid titanium blades. Longitudinal section.
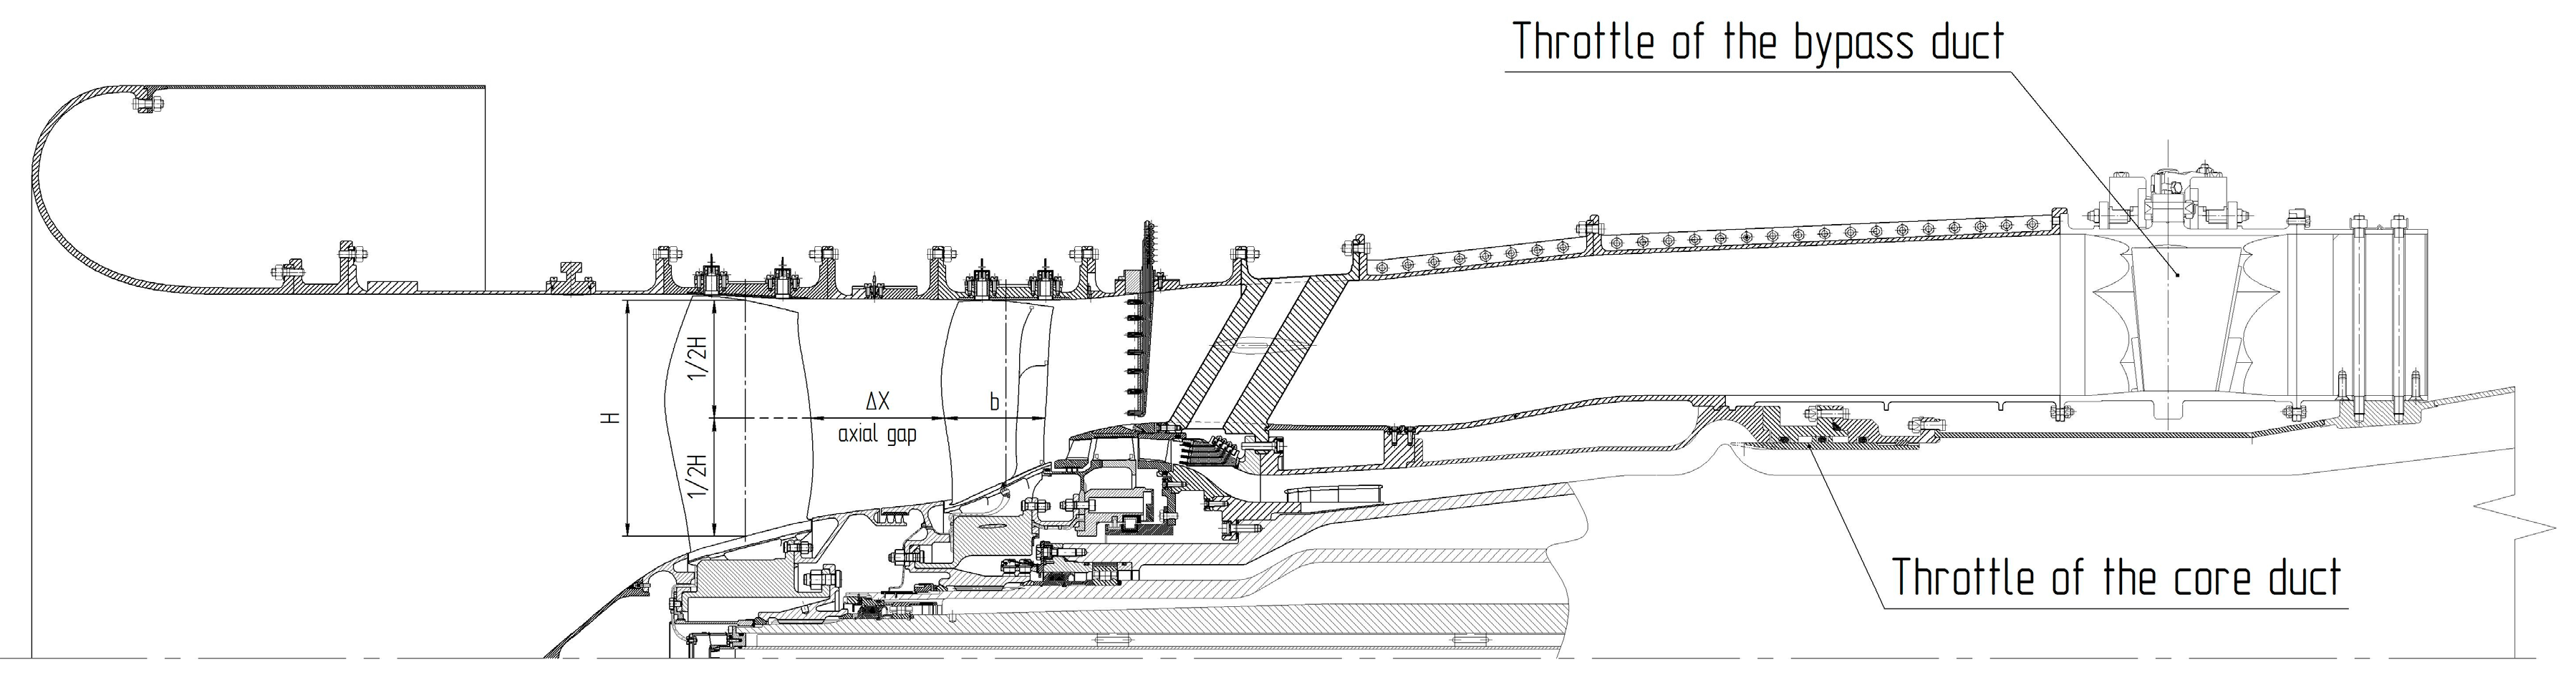
Figure 9.
Counter rotating ducted CRTF1 fan model instrumentation scheme.

Figure 10.
Comparison of calculated and experimental π*/π*CDP values along operating line at CDP (cor = 95%).
Figure 10.
Comparison of calculated and experimental π*/π*CDP values along operating line at CDP (cor = 95%).

Figure 11.
Comparison of calculated and experimental η*ad/η*ad CDP values along operating line at CDP, cor = 95%.
Figure 11.
Comparison of calculated and experimental η*ad/η*ad CDP values along operating line at CDP, cor = 95%.
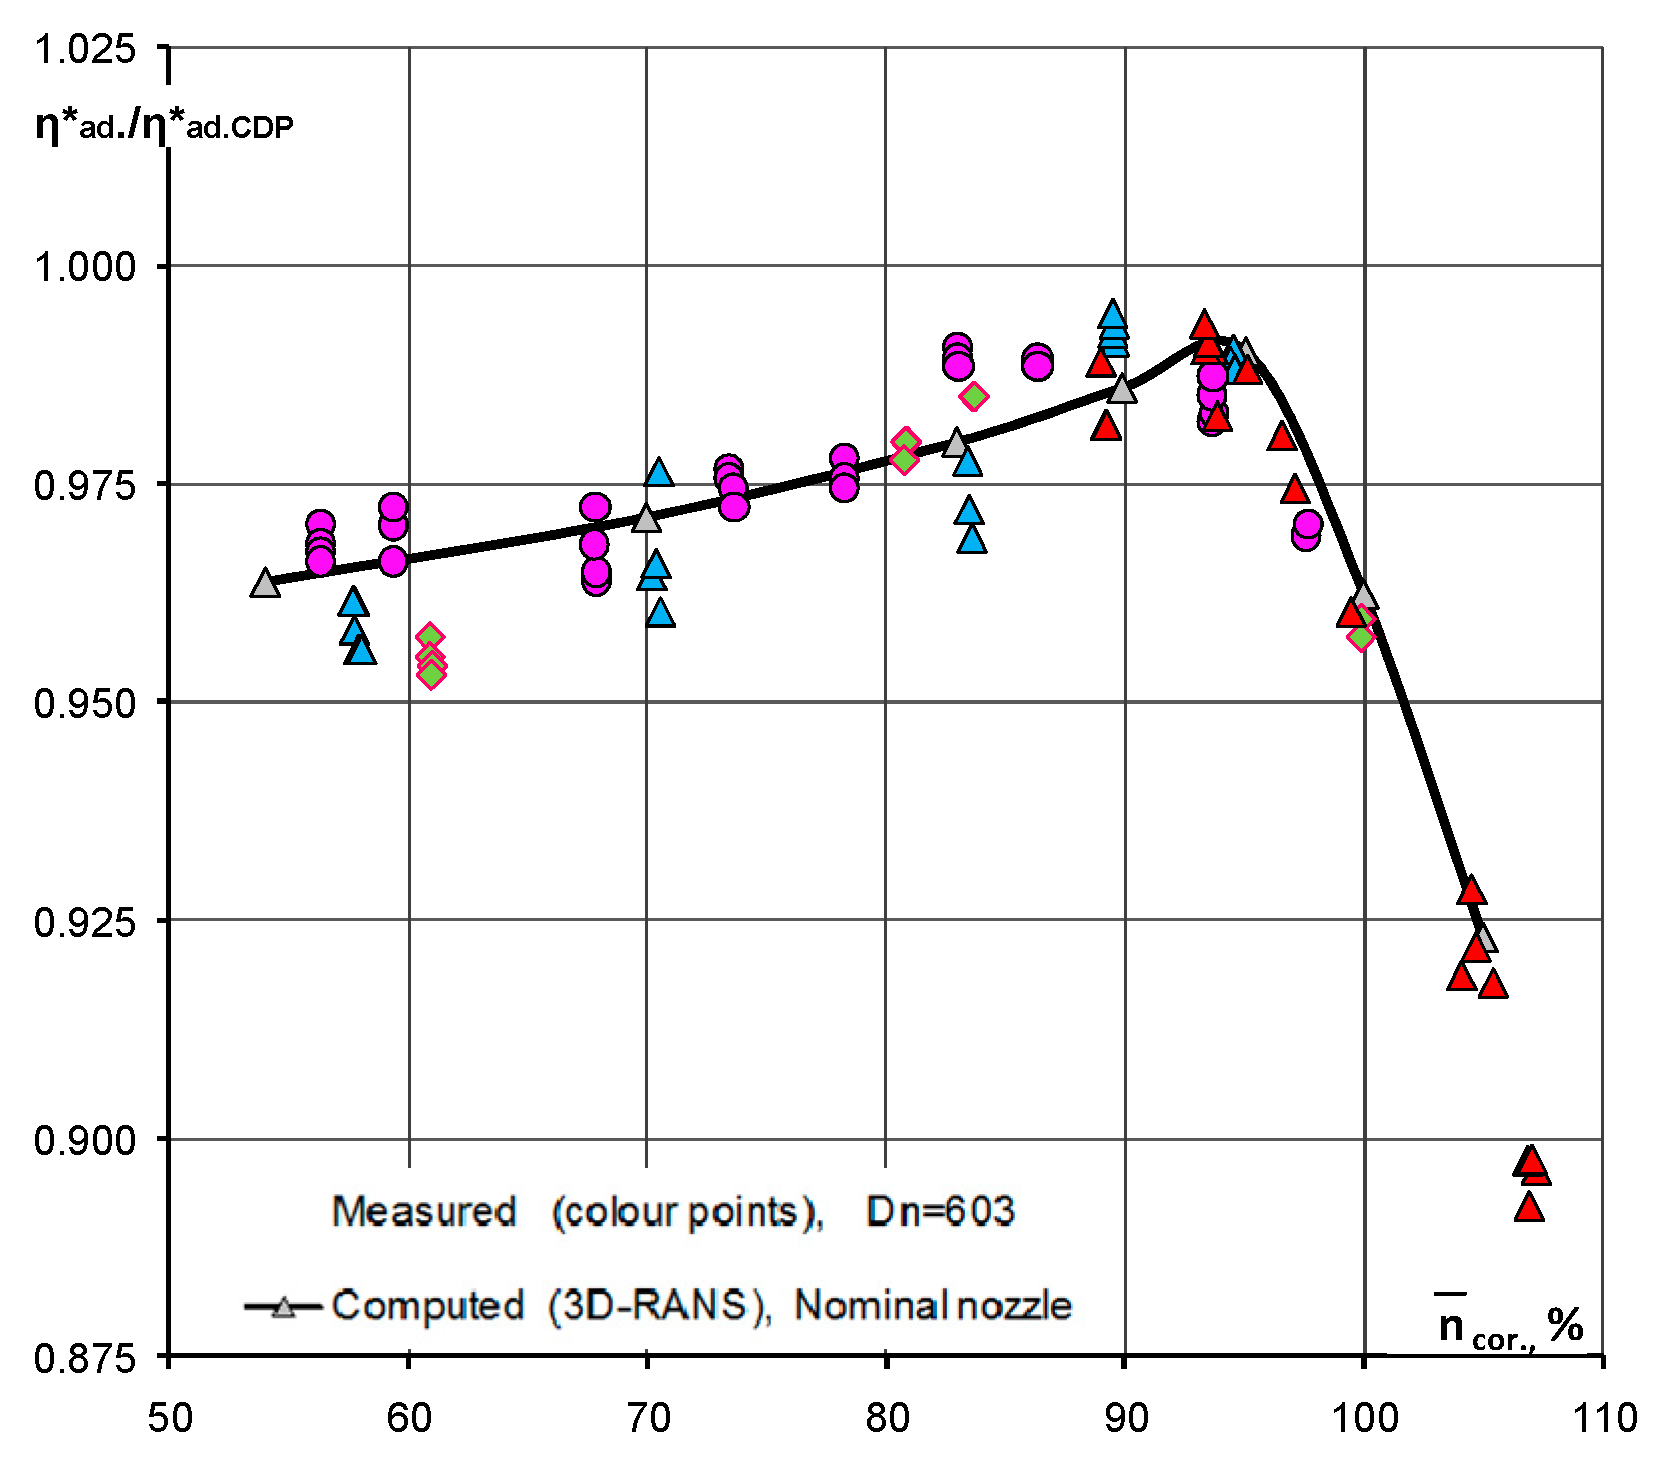
Figure 12.
Comparison of calculated and experimental Gcor/Gcor CDP values along operating line at CDP (cor = 95%).
Figure 12.
Comparison of calculated and experimental Gcor/Gcor CDP values along operating line at CDP (cor = 95%).
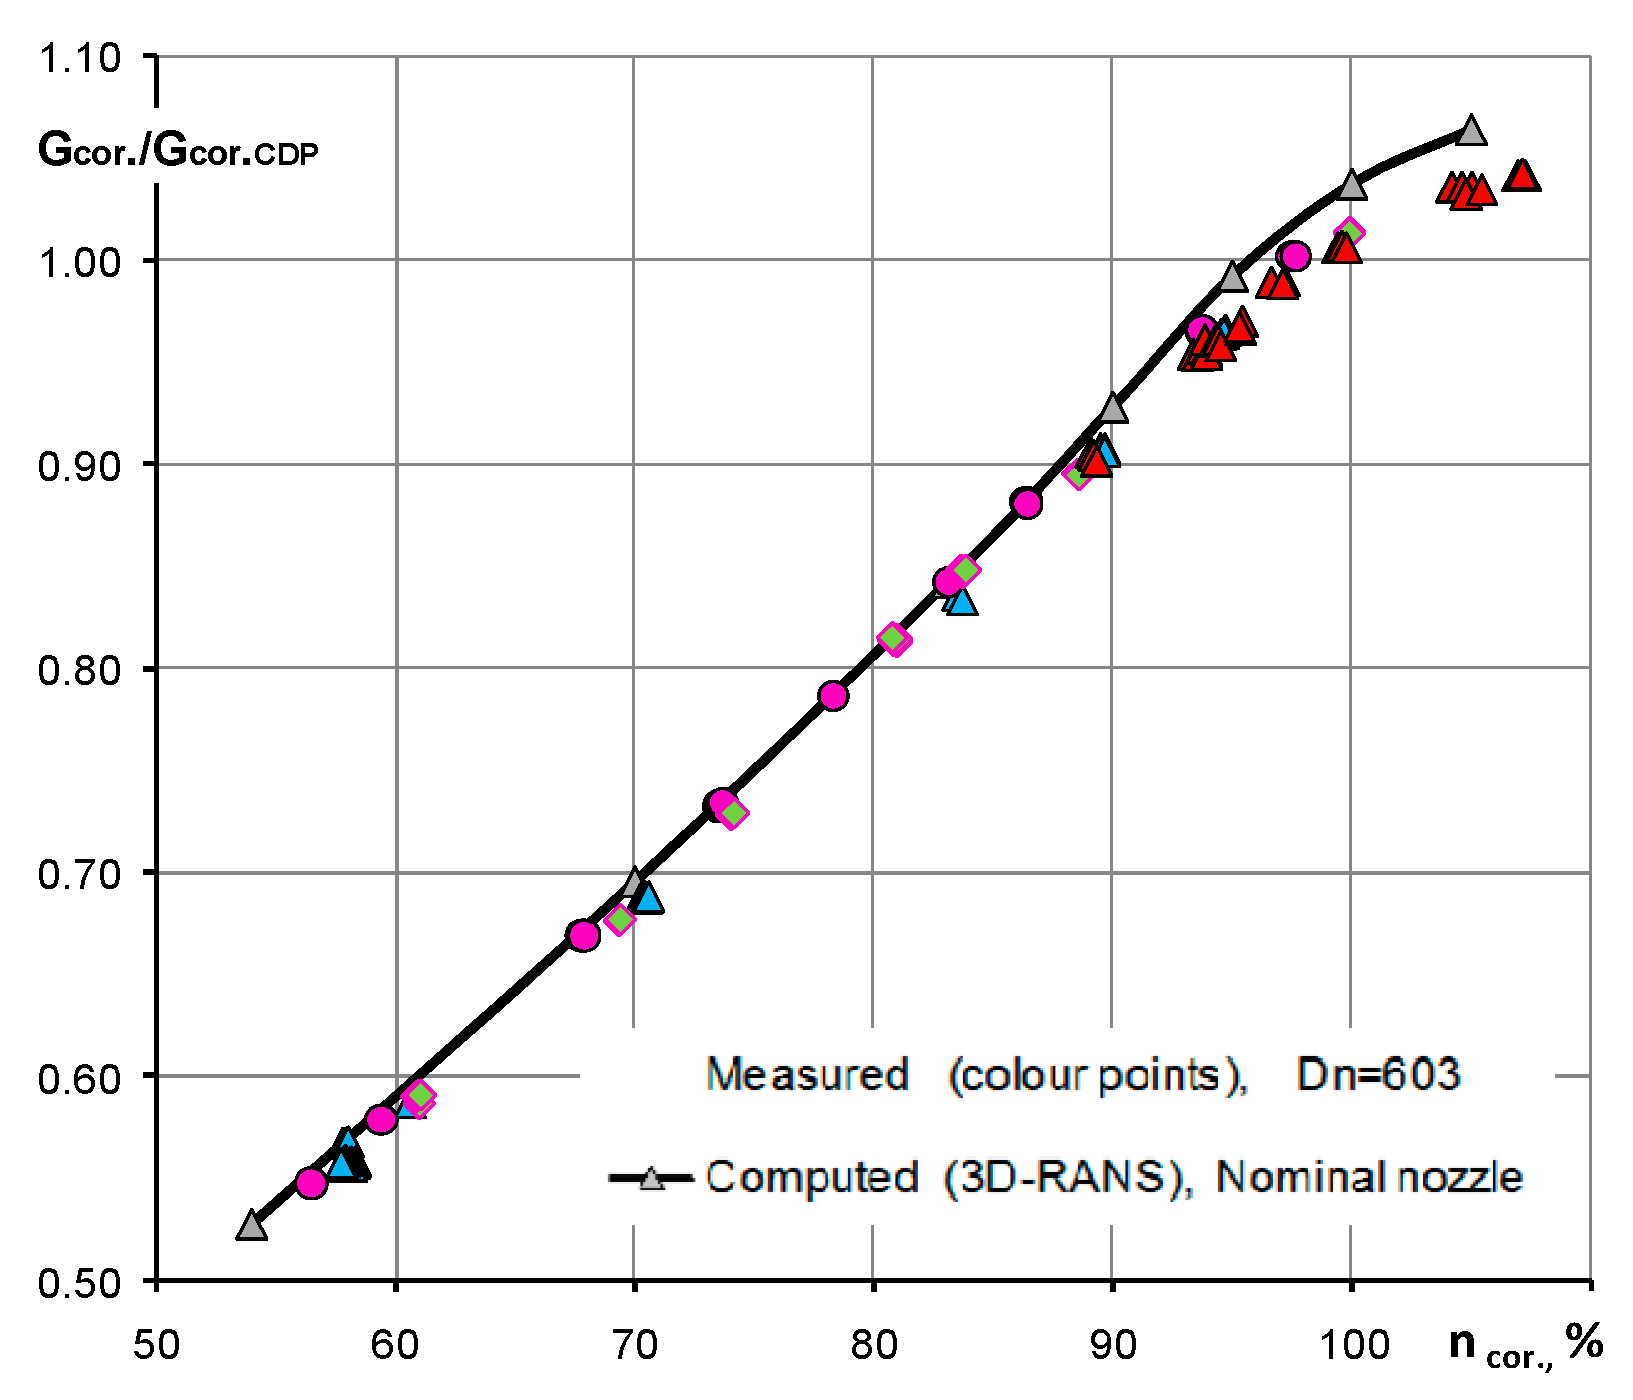
Figure 13.
Comparison of computed (3D-RANS, Reynolds Averaged Navier–Stokes) and measured radial distributions of flow parameters downstream from rotor 2, cor = 100%. (a) Total pressure ratio; (b) adiabatic efficiency.
Figure 13.
Comparison of computed (3D-RANS, Reynolds Averaged Navier–Stokes) and measured radial distributions of flow parameters downstream from rotor 2, cor = 100%. (a) Total pressure ratio; (b) adiabatic efficiency.
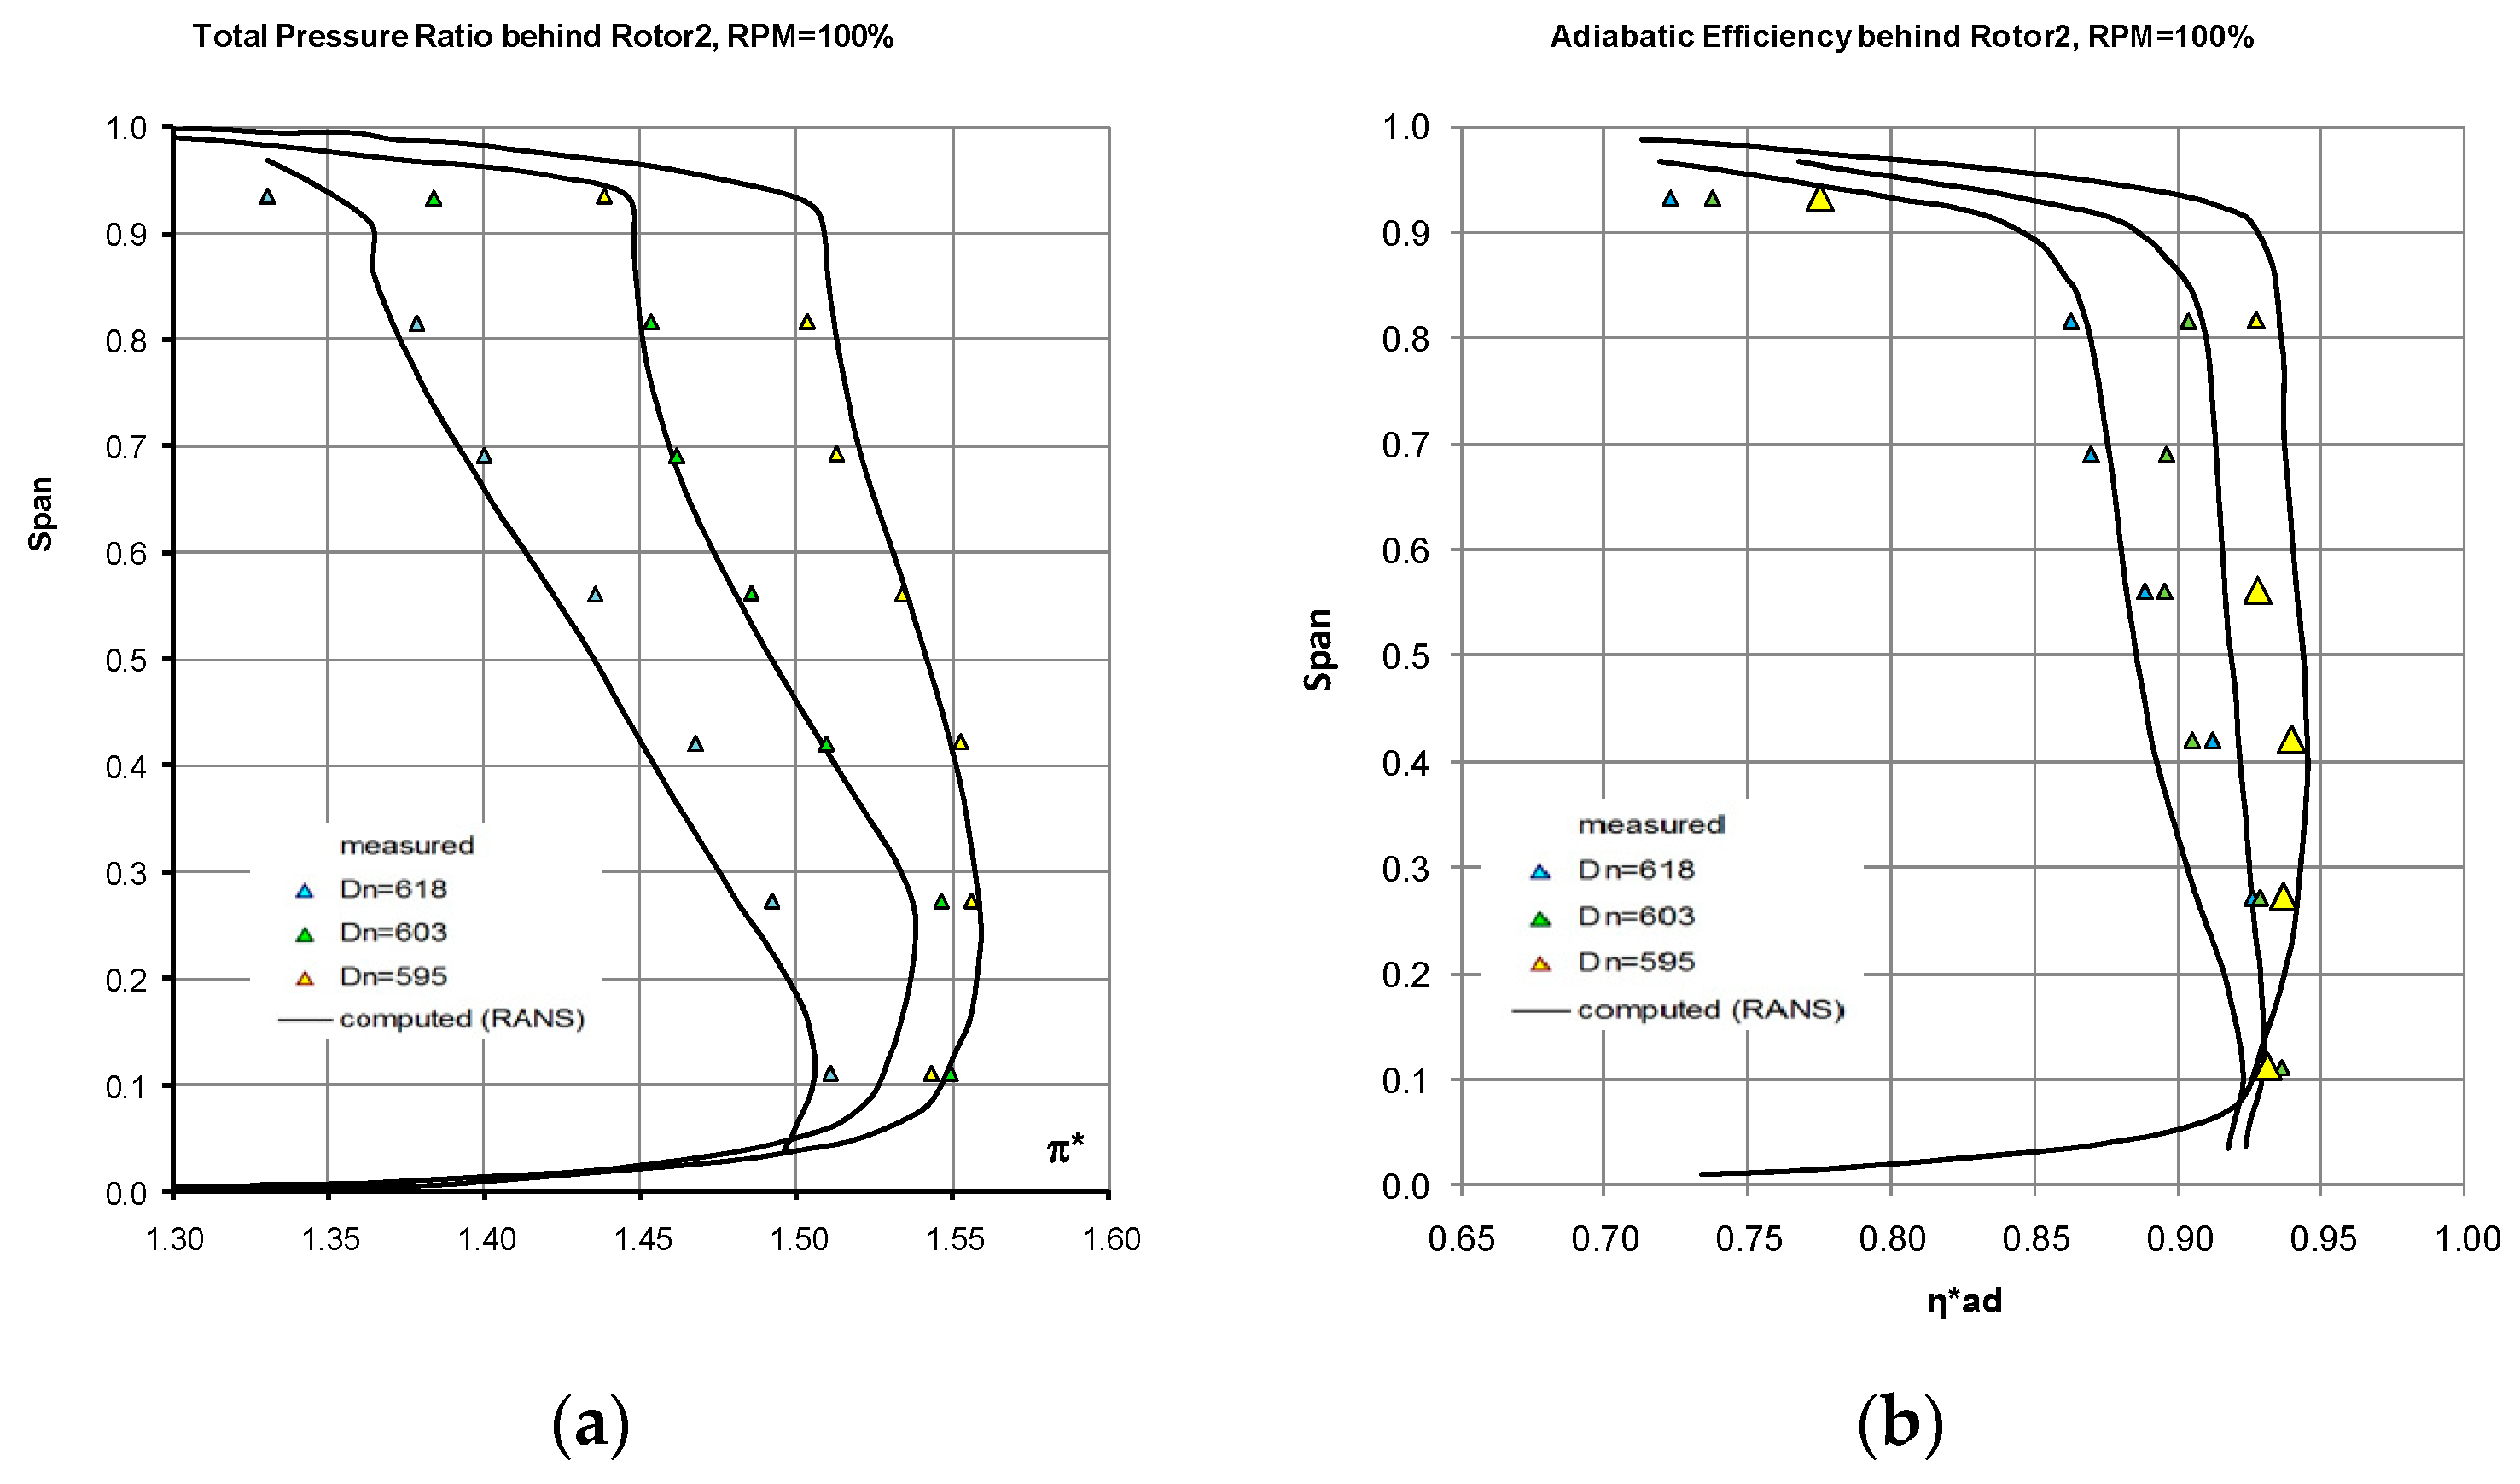
Figure 14.
Comparison of computed (3D-RANS) and measured flow angles, α, at the Rotor 1 (a) and Rotor 2 (b) outlets, cor = 70%.
Figure 14.
Comparison of computed (3D-RANS) and measured flow angles, α, at the Rotor 1 (a) and Rotor 2 (b) outlets, cor = 70%.
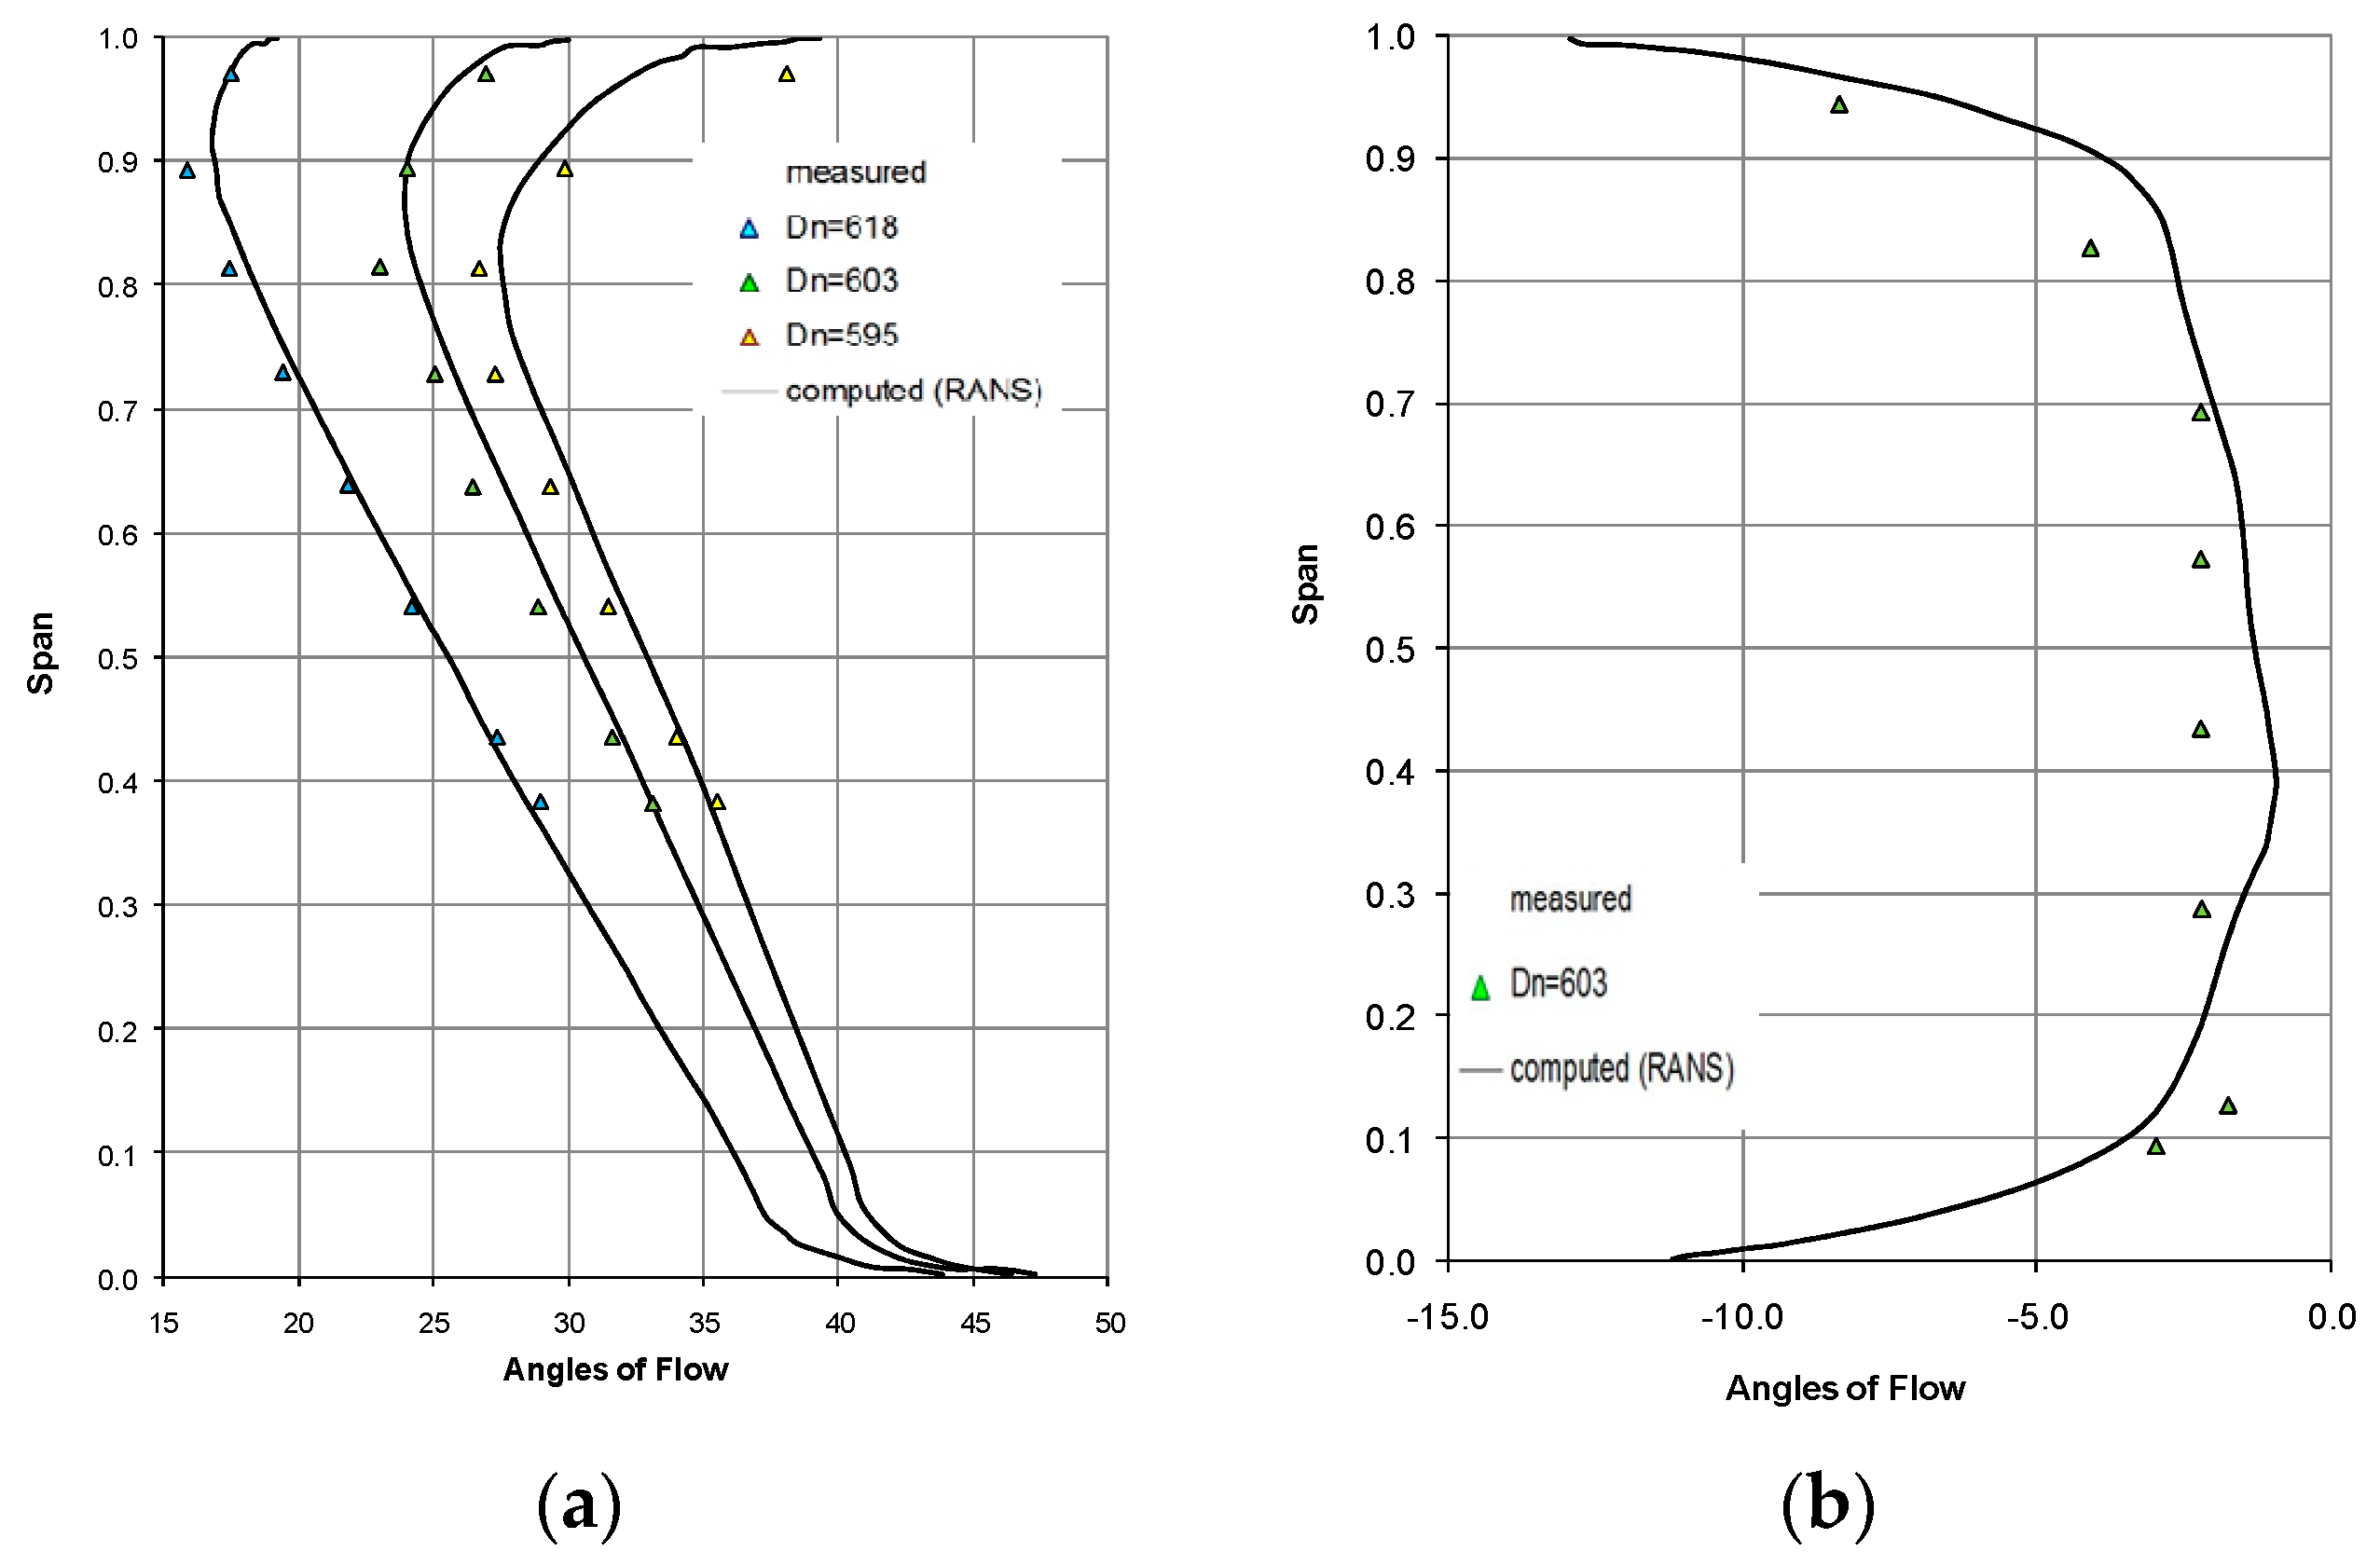
Figure 15.
Comparison of computed (3D-RANS) and measured flow angles, α, at the R1 outlet. (a) cor = 90%; (b) cor = 100%.
Figure 15.
Comparison of computed (3D-RANS) and measured flow angles, α, at the R1 outlet. (a) cor = 90%; (b) cor = 100%.

Figure 16.
Fan inlet duct with the flow distortion simulator.

Figure 17.
(a) Total pressure field at the CRTF2A inlet at R1 speed cor = 94%; (b) Schematics of the flow distortion grid.
Figure 17.
(a) Total pressure field at the CRTF2A inlet at R1 speed cor = 94%; (b) Schematics of the flow distortion grid.
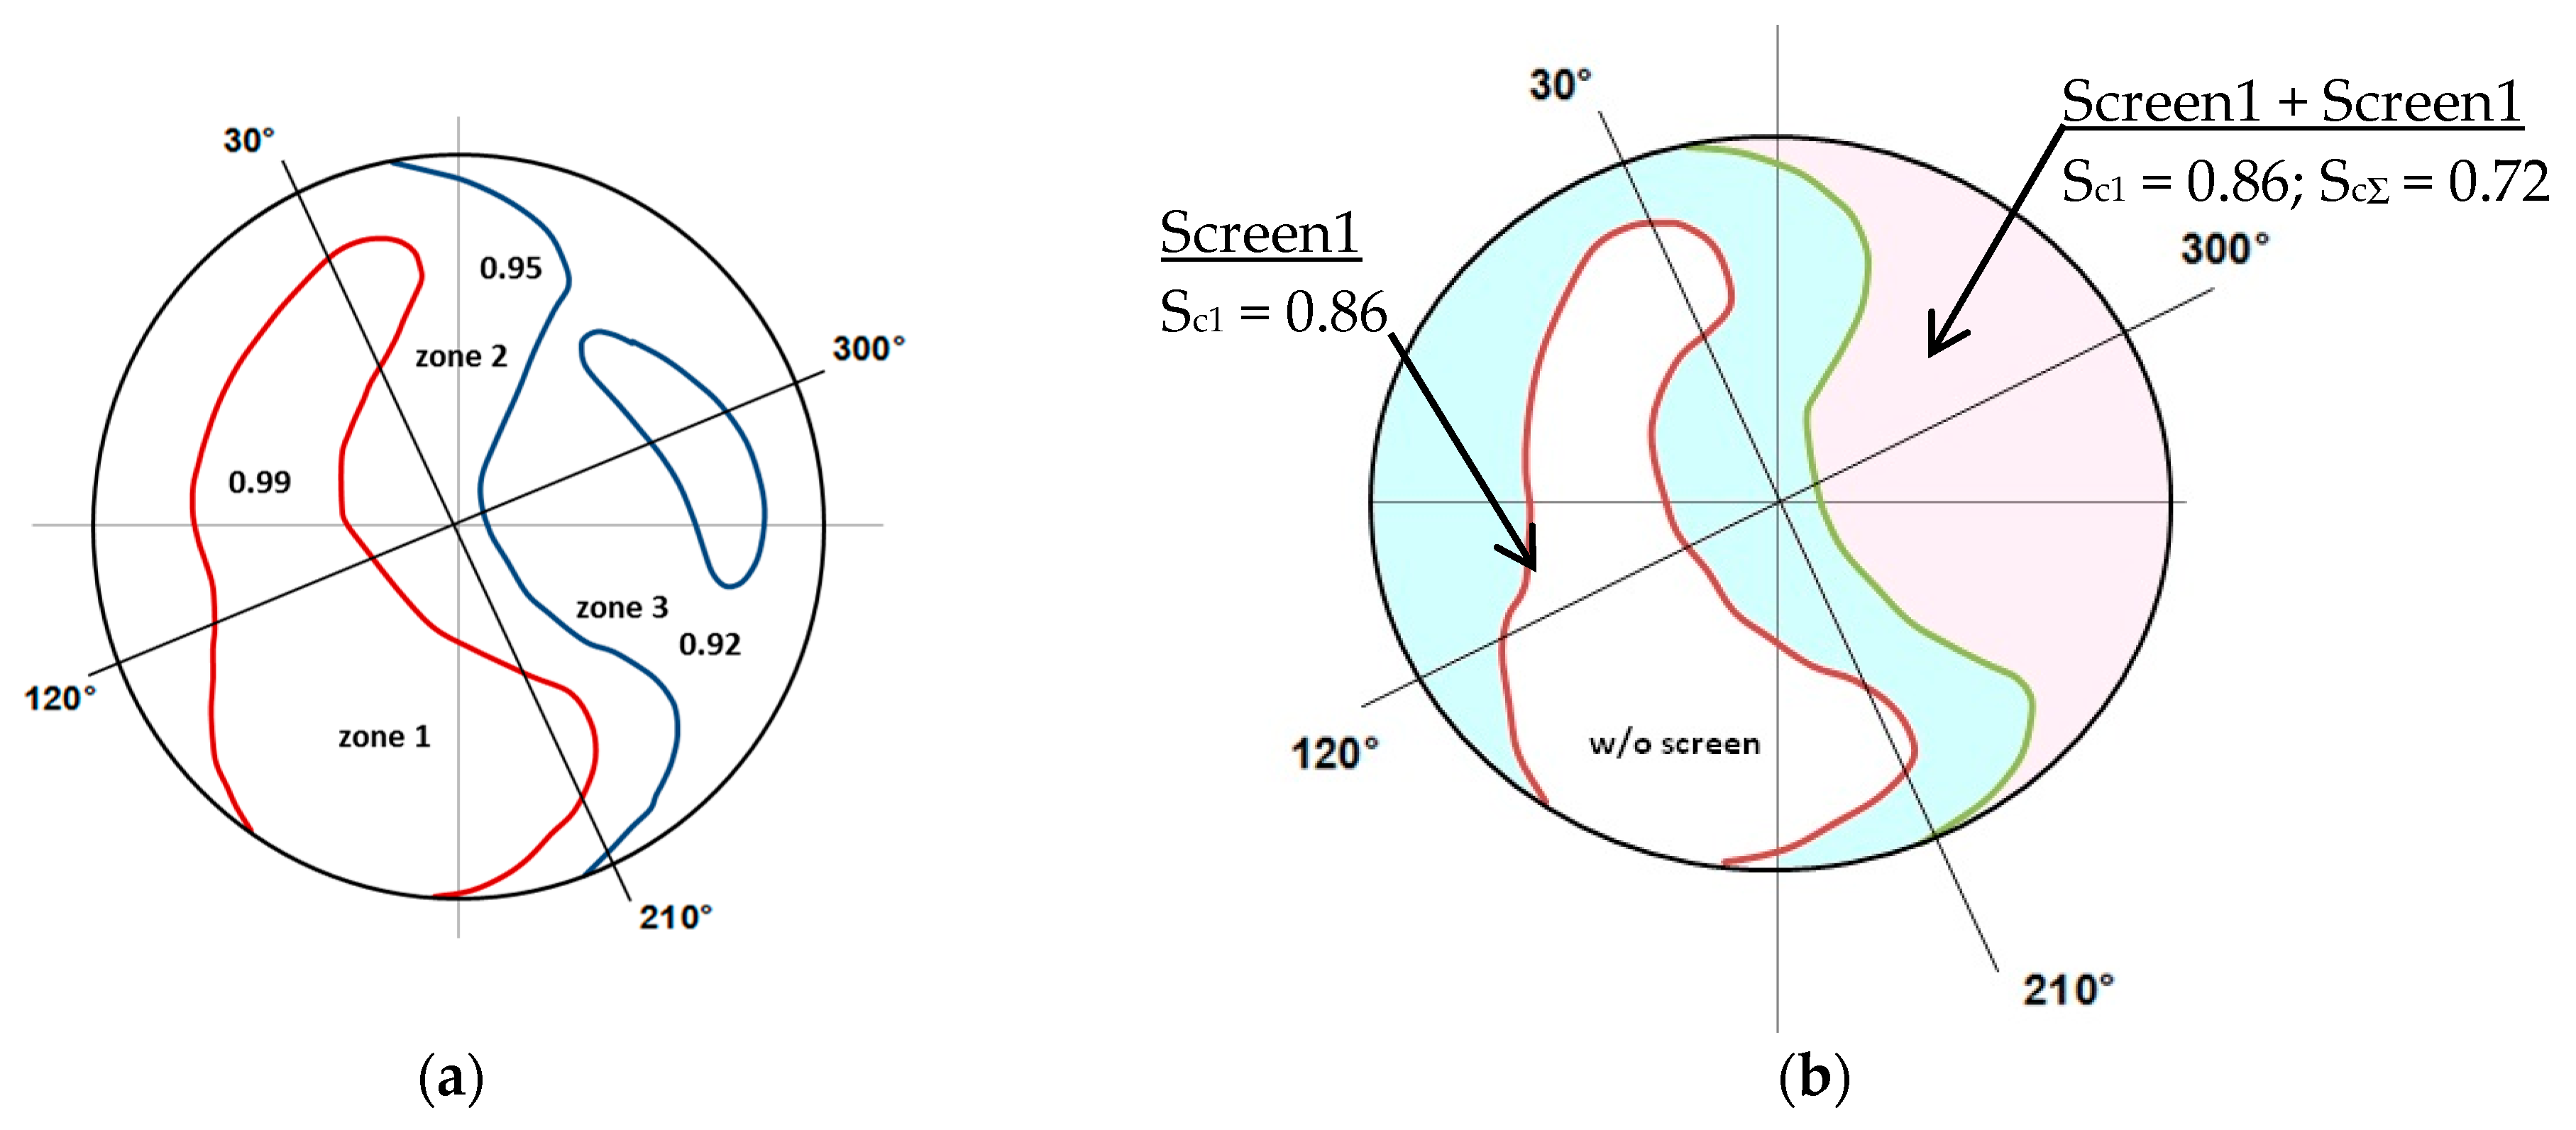
Figure 18.
Total pressure ratio as a function of average rotational speed (Nav).

Figure 19.
Total air flow of the fan as a function of average rotational speed.
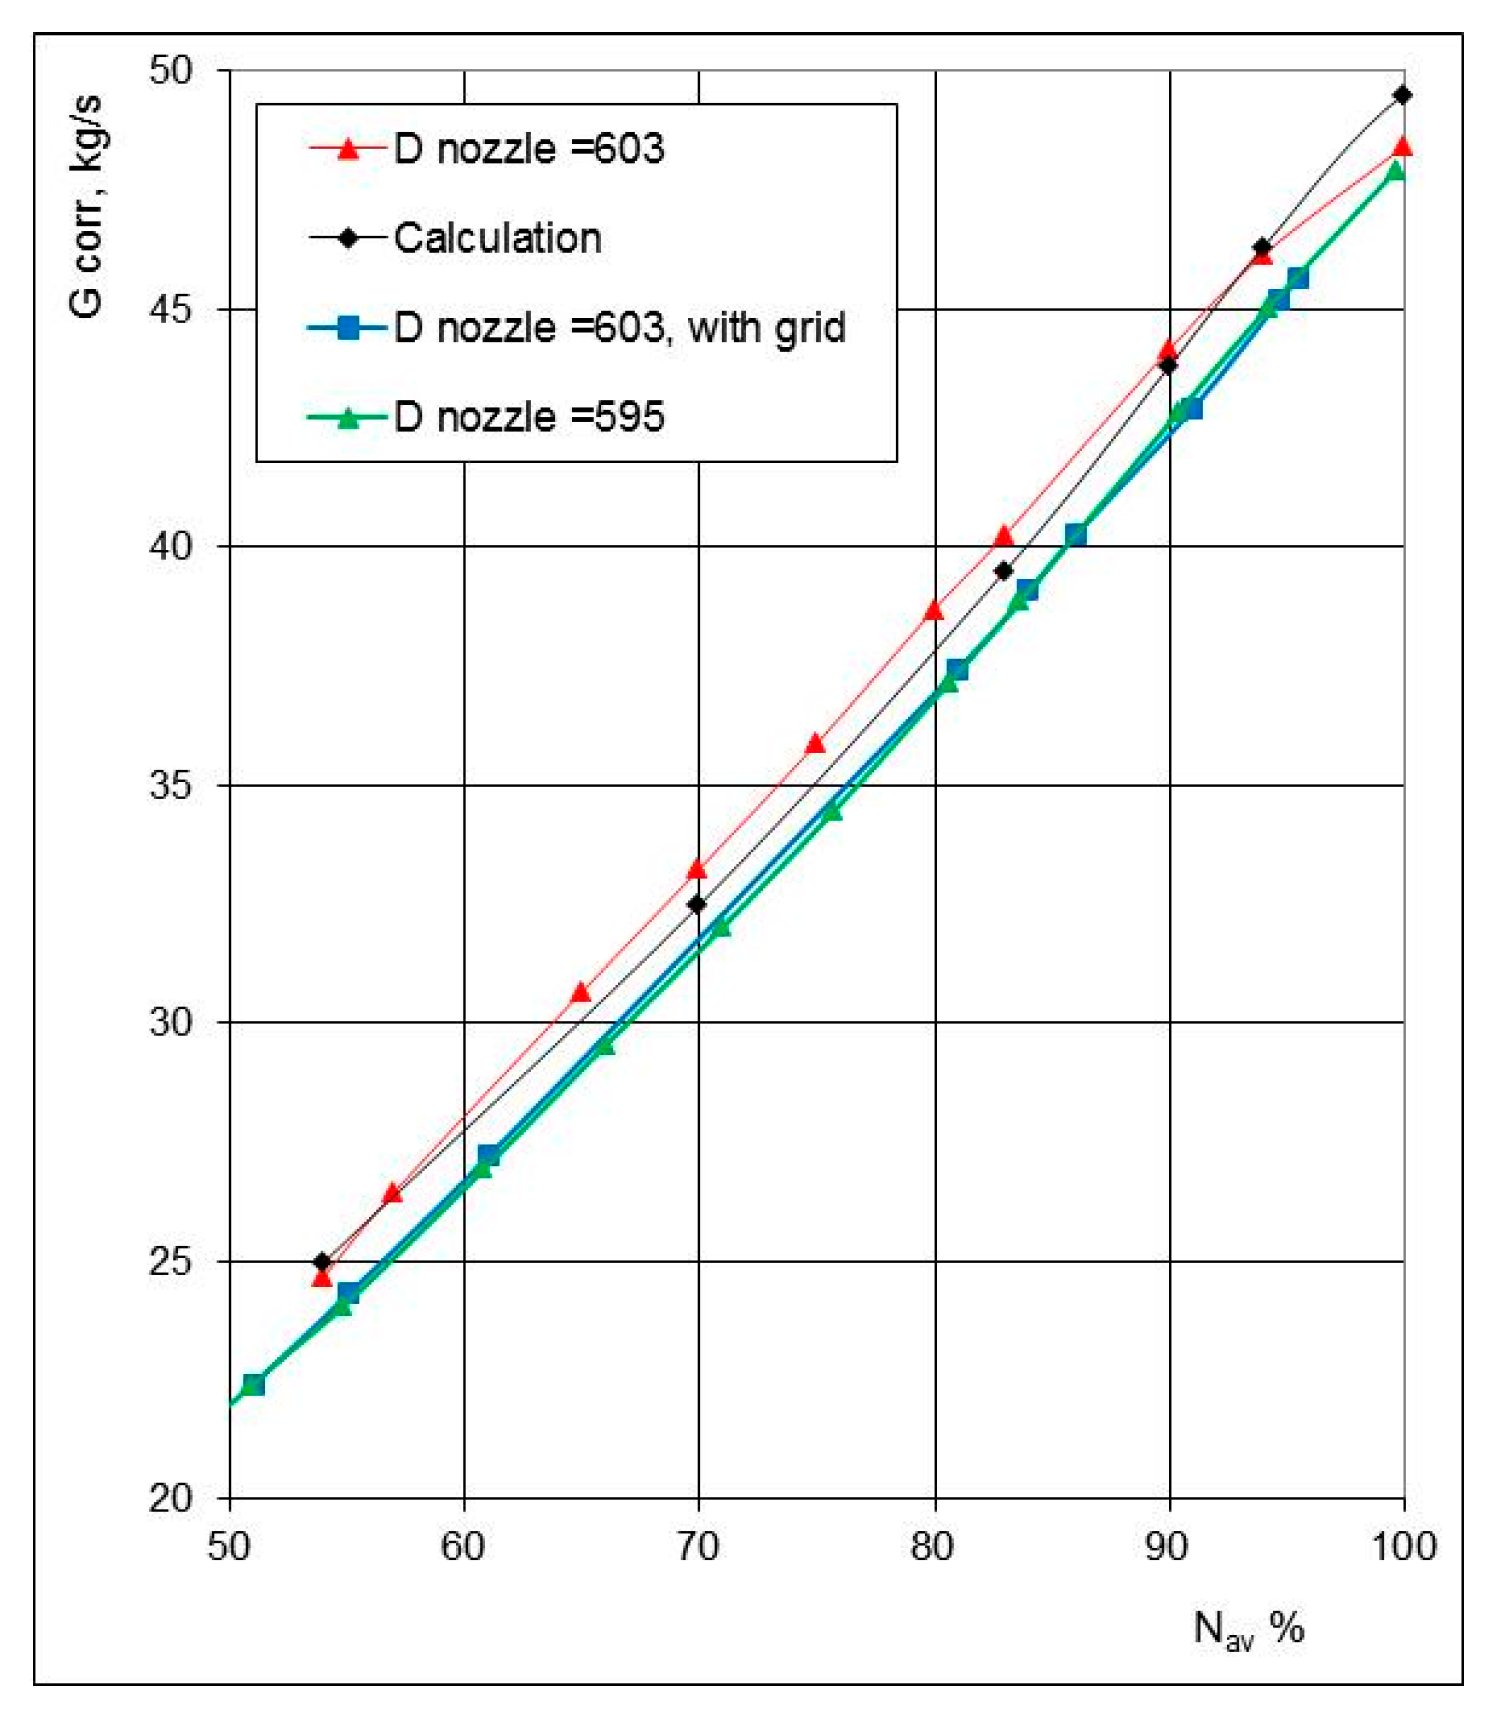
Figure 20.
Total pressure ratio as a function of corrected air flow of the fan.
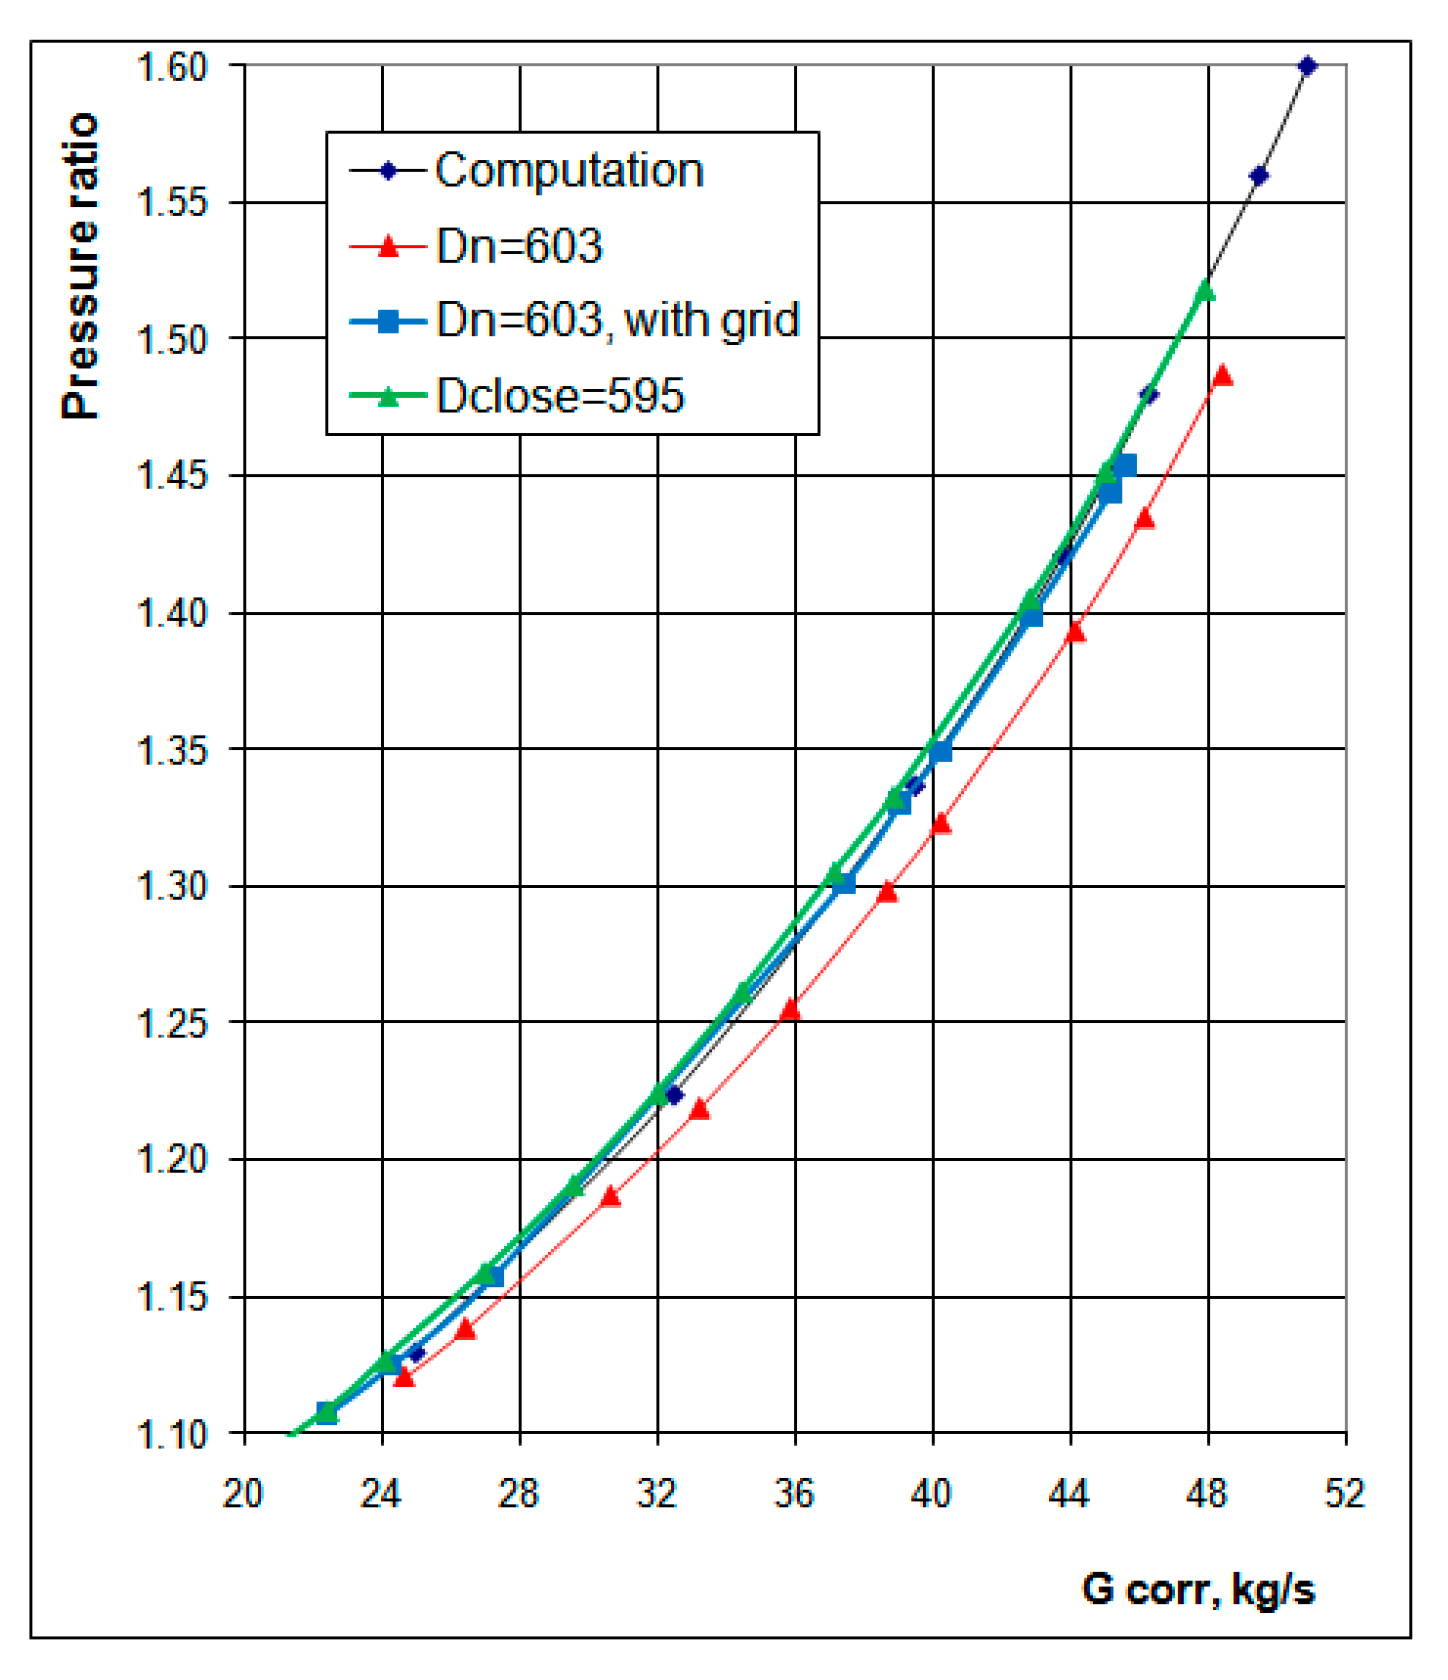
Figure 21.
Fan adiabatic efficiency as a function of corrected air flow.

Figure 22.
C180-2 stage.

Figure 23.
Test results for the C180-2 stage bypass duct. BW: 3D computation with Baldwin–Lomax algebraic turbulence model; KO diff: 3D computation with k-ω differential turbulence model. π*dimensionless = π*/π*aero design point; η*dimensionless = η*/η*aero design point.
Figure 23.
Test results for the C180-2 stage bypass duct. BW: 3D computation with Baldwin–Lomax algebraic turbulence model; KO diff: 3D computation with k-ω differential turbulence model. π*dimensionless = π*/π*aero design point; η*dimensionless = η*/η*aero design point.

Figure 24.
C180-2 model fan (a blade with a variable sweep and a forward swept tip).

Figure 25.
Single reference fan (SRF) model.

Figure 26.
Acoustic spectra for model fans with straight and swept rotor blades. The C-3A test facility with the anechoic chamber 120°.
Figure 26.
Acoustic spectra for model fans with straight and swept rotor blades. The C-3A test facility with the anechoic chamber 120°.

Figure 27.
Approach. Rear hemisphere. Blade passing frequency, BPF = 3.15 kHz. 120°.

Figure 28.
Counter rotating fan with different types of casing treatments (CT).

Figure 29.
Slot type casing treatments. (a) Slot type CT; (b) two-row slot type CT; (c) R1 with slot type CT in assembly.
Figure 29.
Slot type casing treatments. (a) Slot type CT; (b) two-row slot type CT; (c) R1 with slot type CT in assembly.

Figure 30.
The casing treatment (schematic diagram).

Figure 31.
Integral characteristics of the CRTF2A counter rotating fan with a smooth flowpath and casing treatment. Comparison of experimental and calculated values of (a) adiabatic efficiency and (b) total pressure ratio.
Figure 31.
Integral characteristics of the CRTF2A counter rotating fan with a smooth flowpath and casing treatment. Comparison of experimental and calculated values of (a) adiabatic efficiency and (b) total pressure ratio.
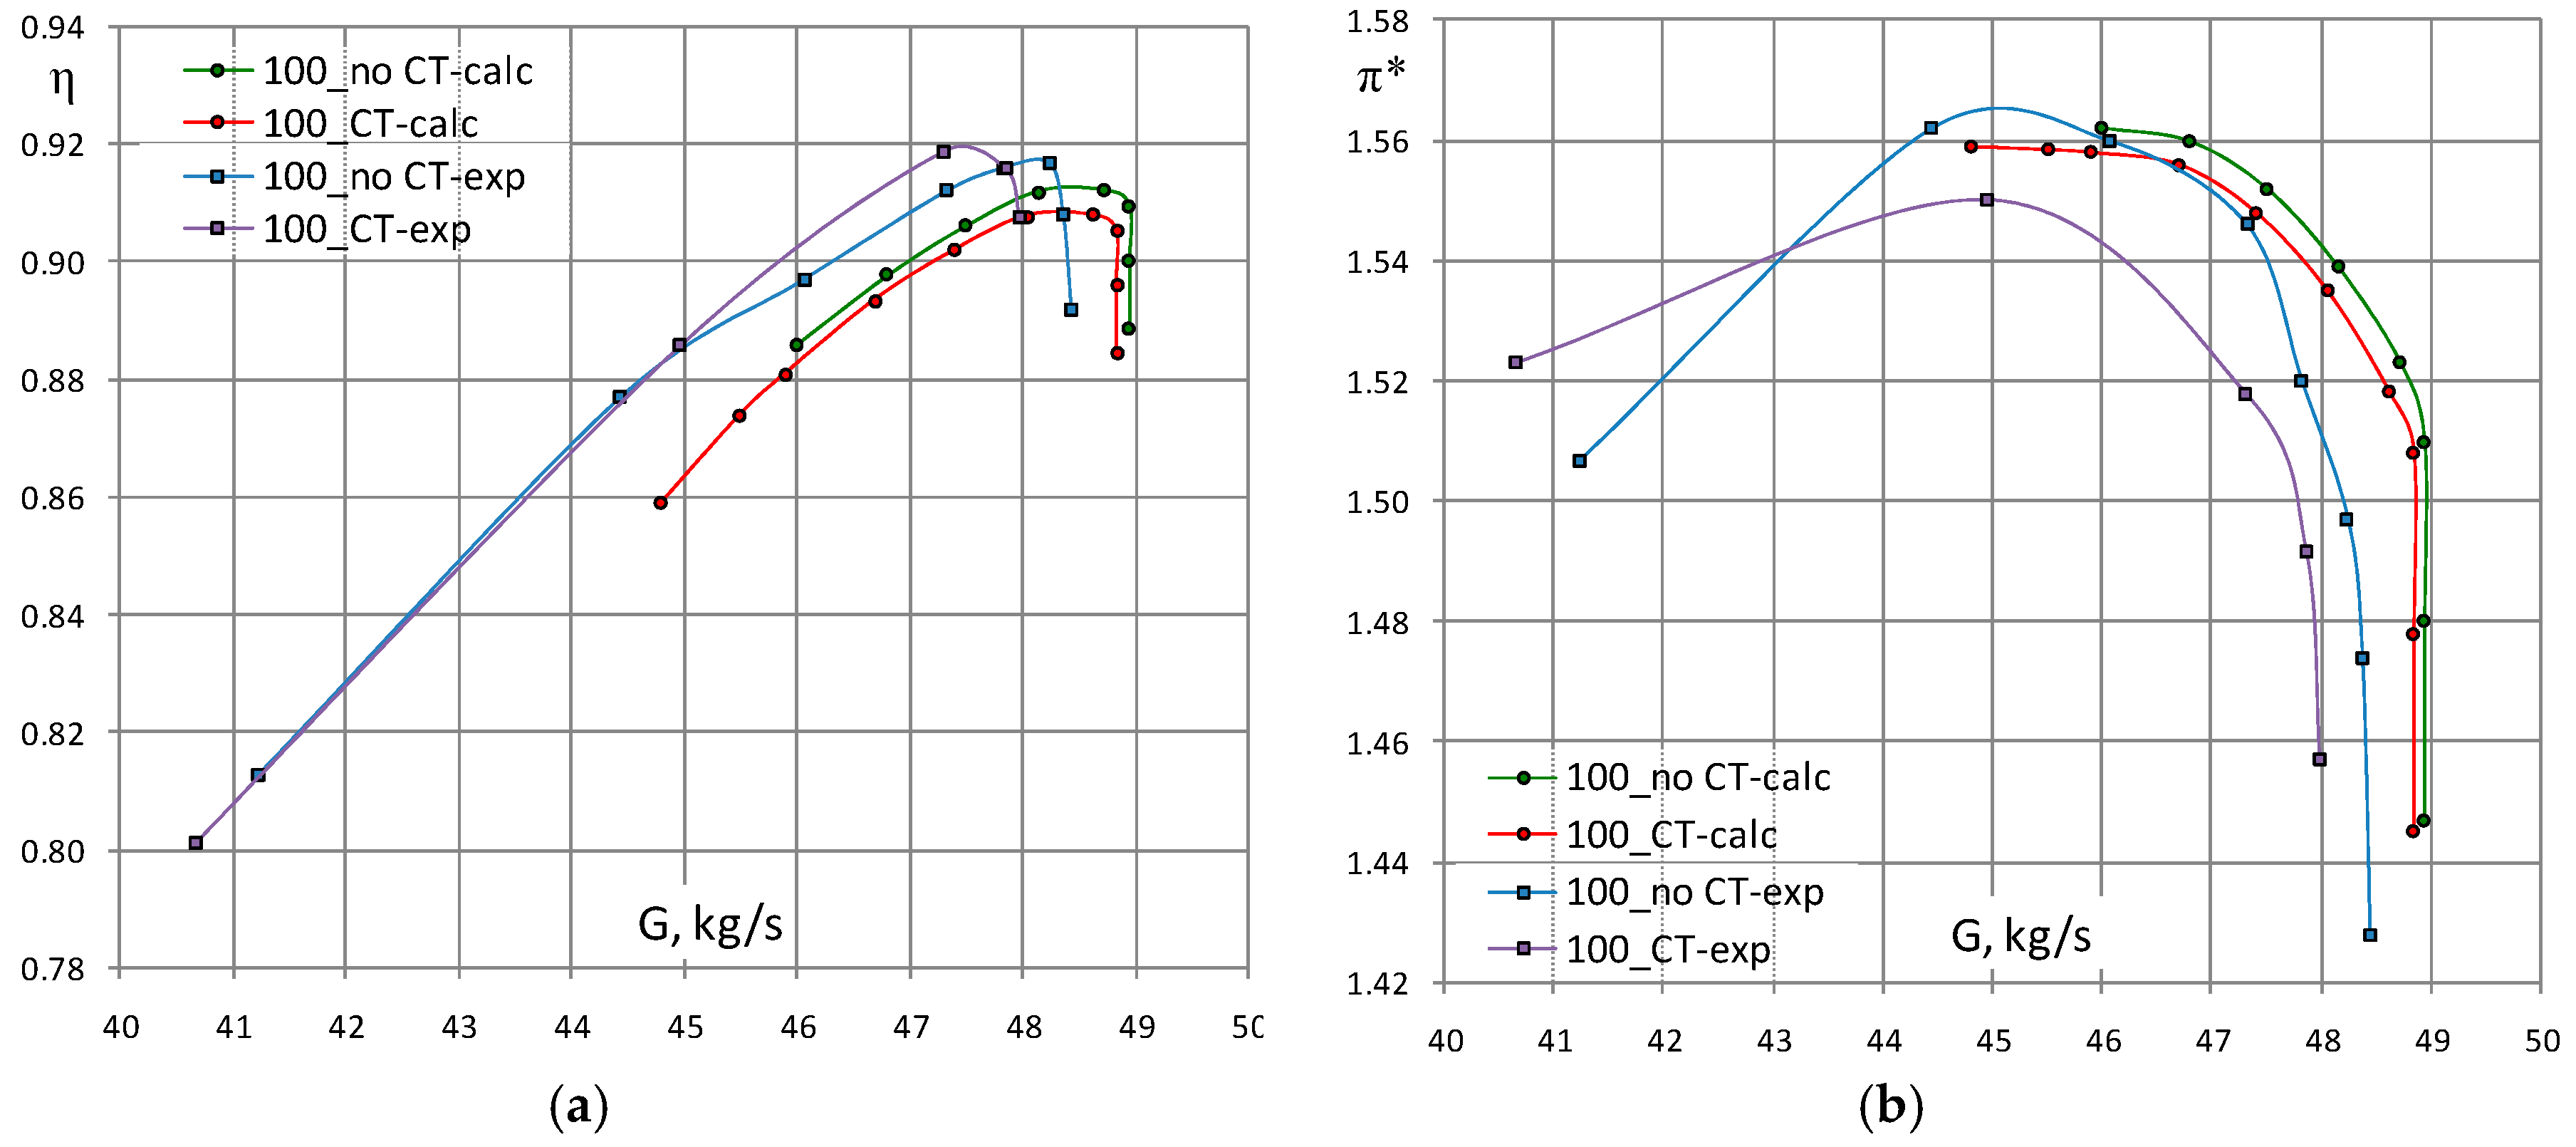
Figure 32.
Comparison of Mach numbers for a smooth flowpath and with CT. Operating line. = 100%. Section 0.95 h. (a) CRTF2A without CT; (b) CRTF2A with CT.
Figure 32.
Comparison of Mach numbers for a smooth flowpath and with CT. Operating line. = 100%. Section 0.95 h. (a) CRTF2A without CT; (b) CRTF2A with CT.

Figure 33.
Acoustic efficiency of the tested CT configurations.
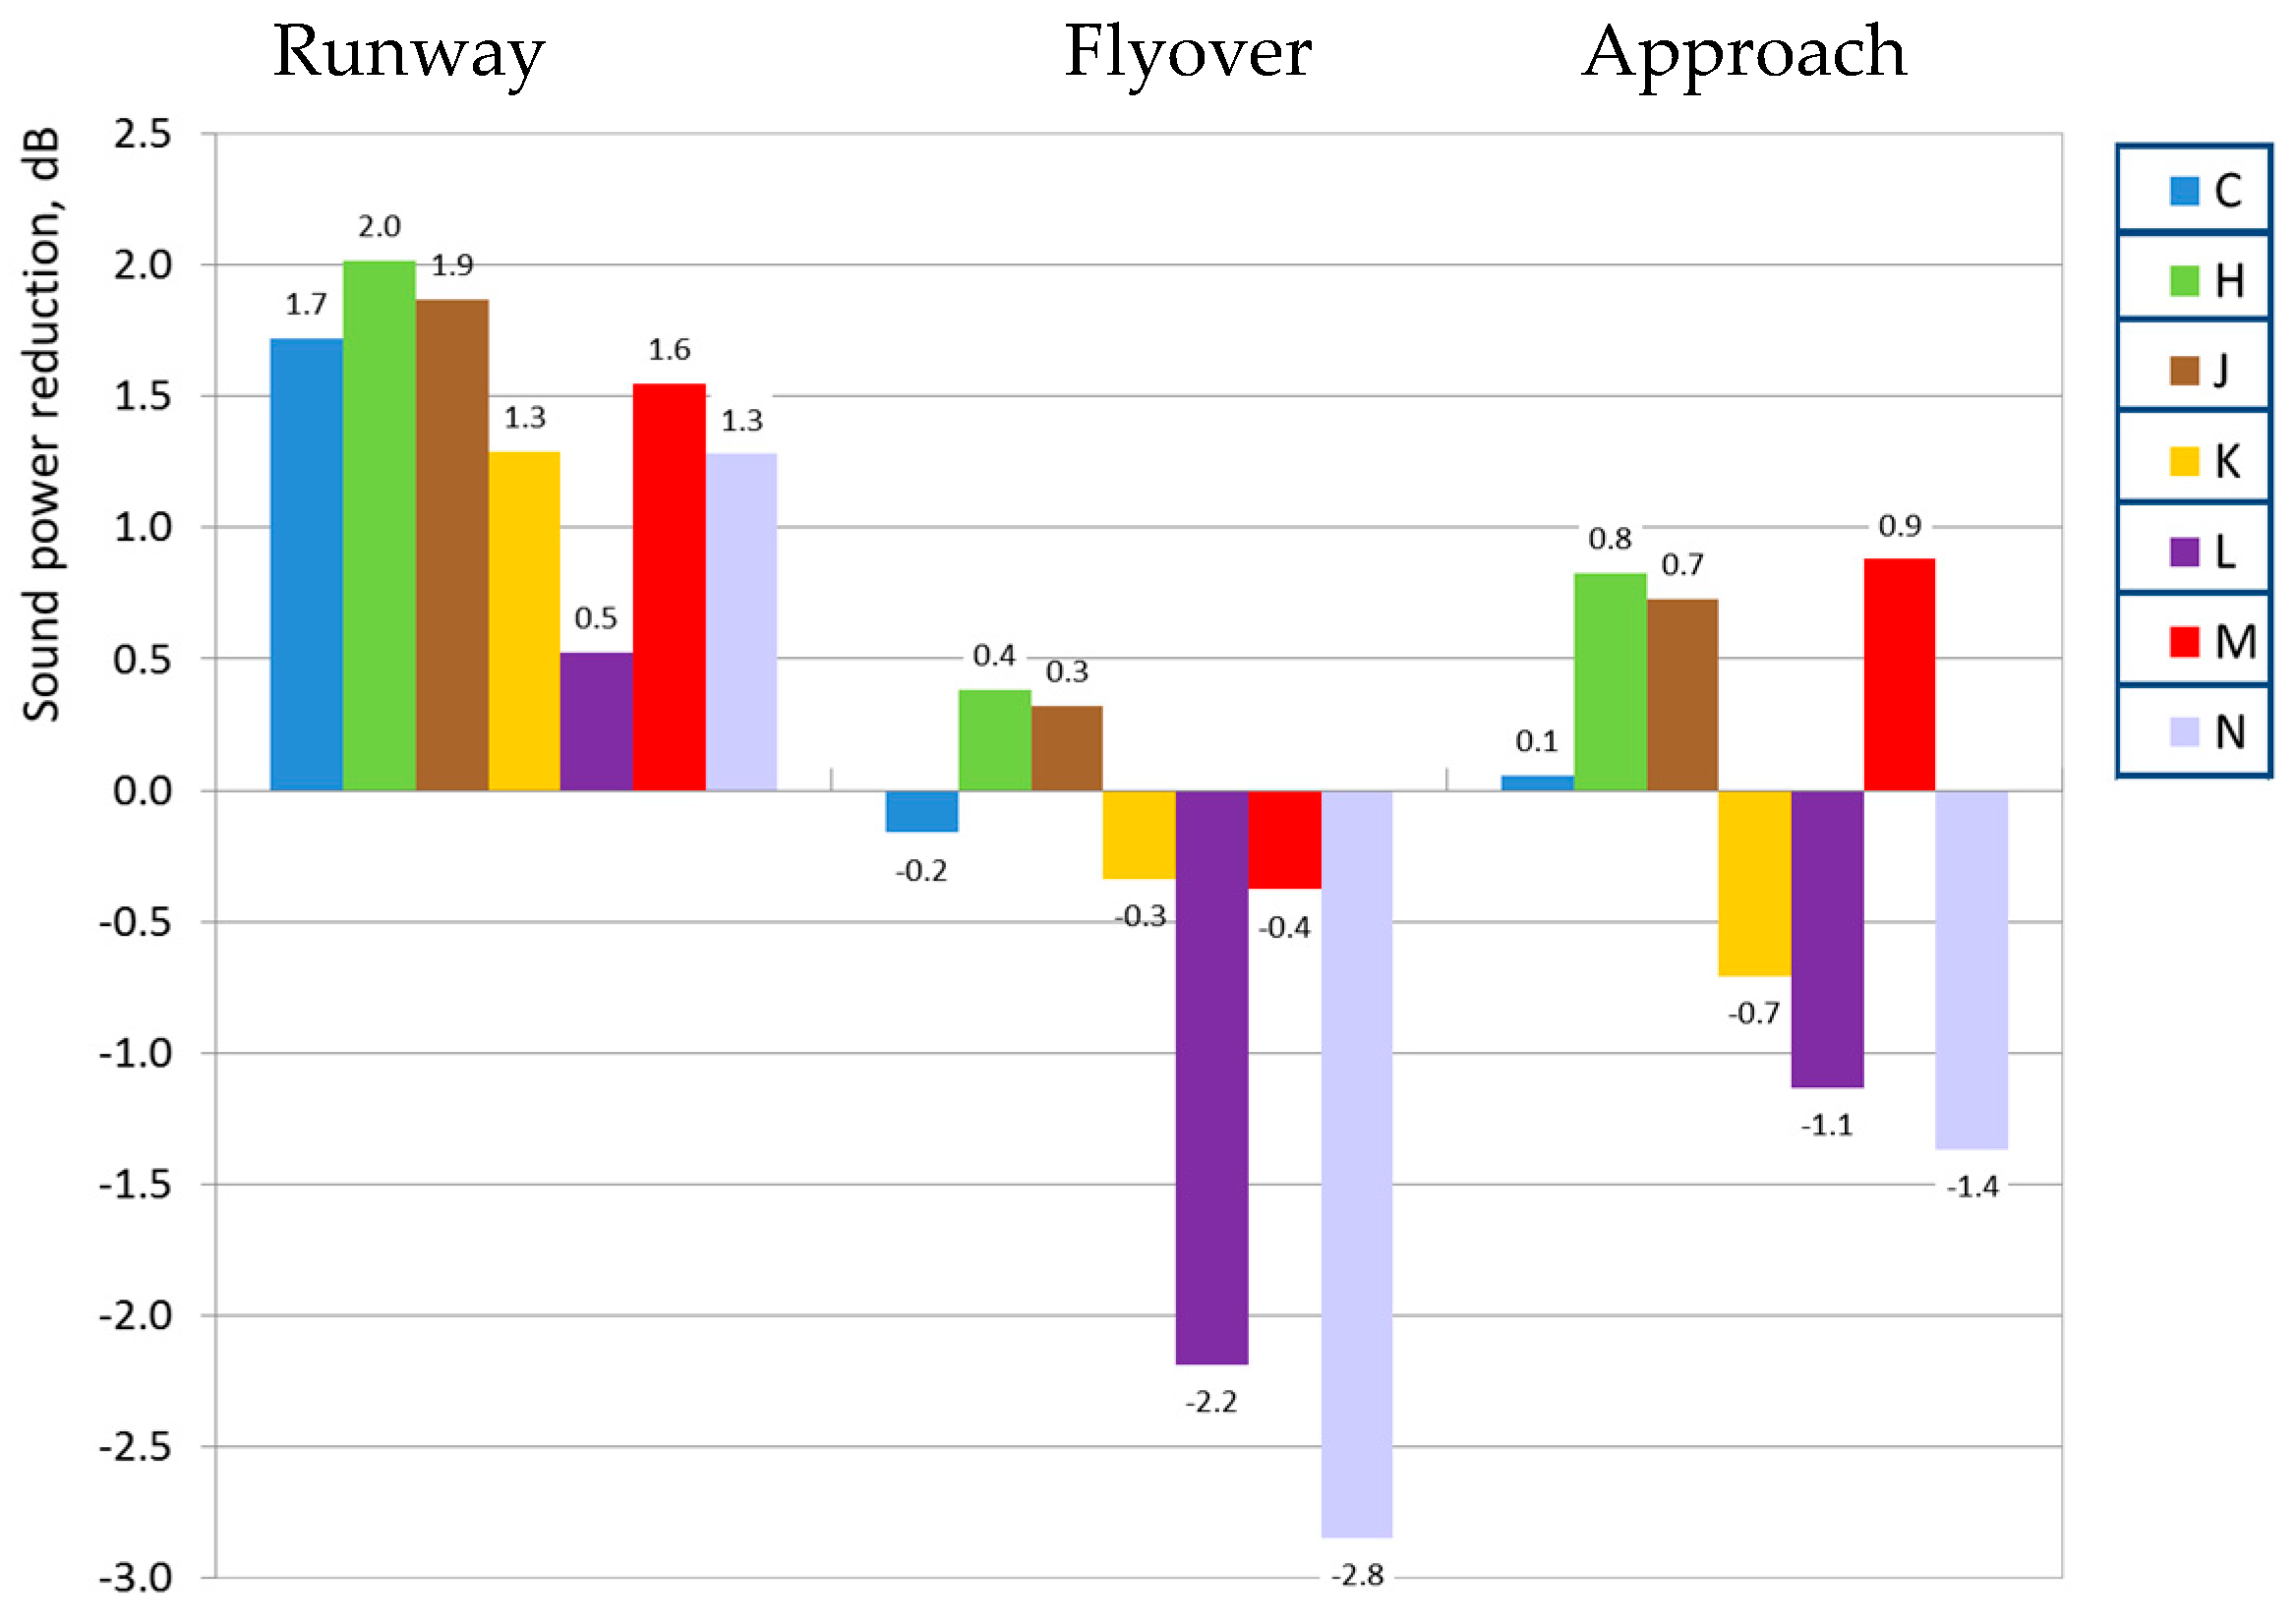
Figure 34.
The COBRA1 counter rotating fan installed at the C-3A test facility.

Figure 35.
Rotor 1 of COBRA1 fan.

Figure 36.
Fan performance map. RANS calculations.
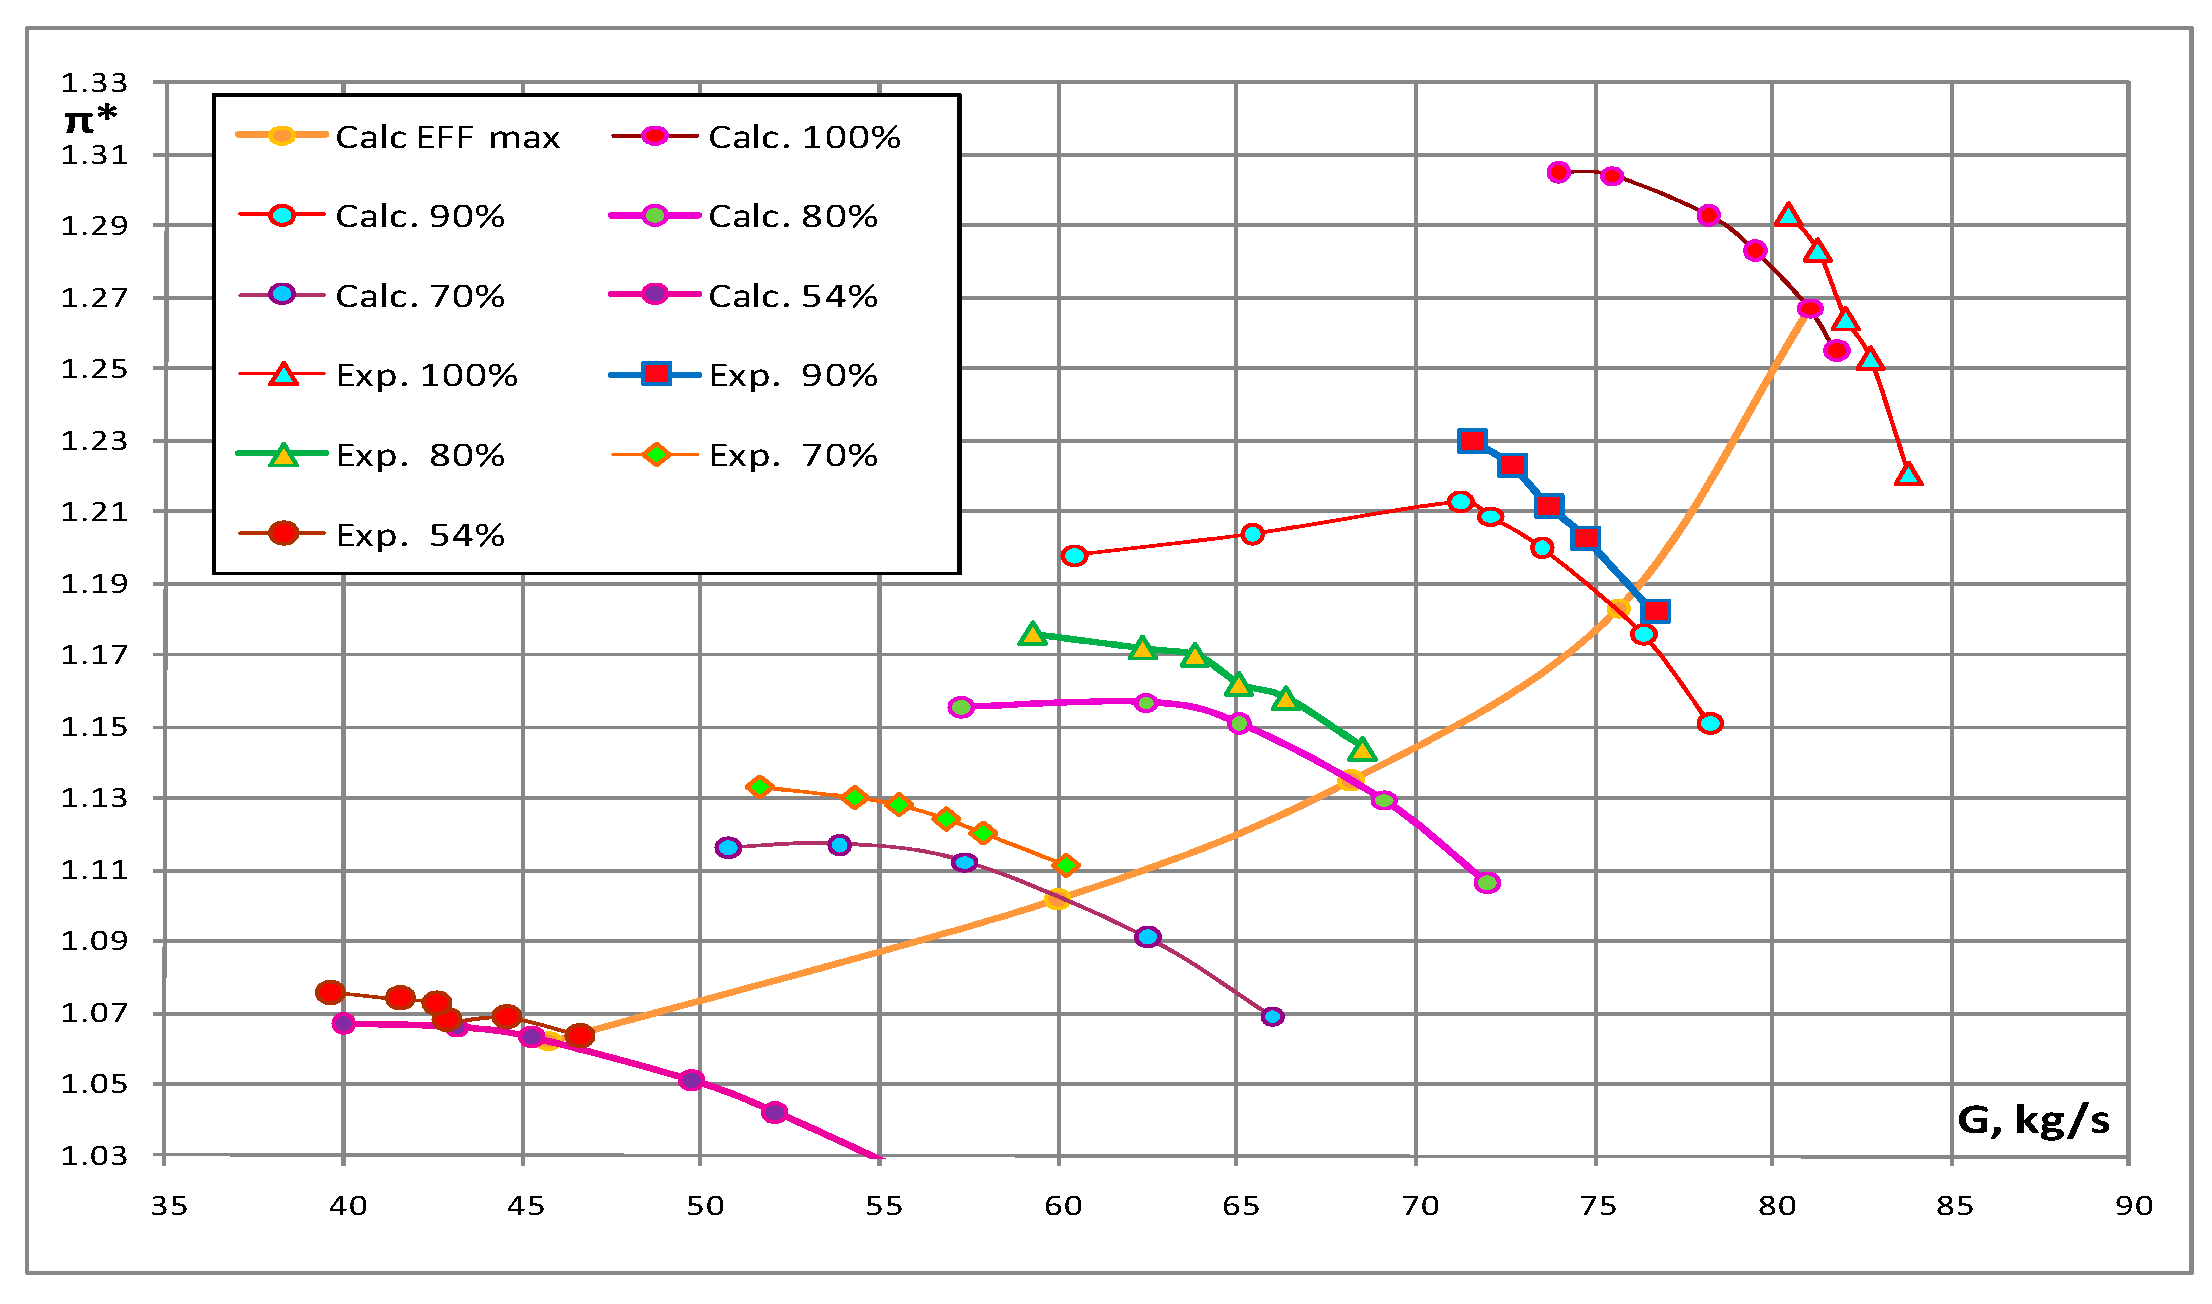
Figure 37.
Fan efficiency map.

Figure 38.
Unsteady Reynolds Averaged Navier–Stokes (URANS) calculations: instantaneous entropy field. Section 0.95 h. Operating point at = 100%.
Figure 38.
Unsteady Reynolds Averaged Navier–Stokes (URANS) calculations: instantaneous entropy field. Section 0.95 h. Operating point at = 100%.

Figure 39.
URANS calculations: instantaneous field of total pressure. Section 0.95 h. Operating point at = 100%.
Figure 39.
URANS calculations: instantaneous field of total pressure. Section 0.95 h. Operating point at = 100%.

Figure 40.
Instantaneous field of total pressure, section at the first rotor outlet. Operating point at the nominal rotational speed. = 100%.
Figure 40.
Instantaneous field of total pressure, section at the first rotor outlet. Operating point at the nominal rotational speed. = 100%.

Figure 41.
Instantaneous field of total pressure, fan outlet section. Operating point at the nominal rotational speed. = 100%.
Figure 41.
Instantaneous field of total pressure, fan outlet section. Operating point at the nominal rotational speed. = 100%.

Figure 42.
Summarized directivity diagrams of sound pressure level for CRTF1 fan (computation and experiment) and for COBRA1 fan (computation).
Figure 42.
Summarized directivity diagrams of sound pressure level for CRTF1 fan (computation and experiment) and for COBRA1 fan (computation).

Figure 43.
Comparison of sound pressure level (SPL) obtained in the calculations and in the tests for different operational points for COBRA1 fan.
Figure 43.
Comparison of sound pressure level (SPL) obtained in the calculations and in the tests for different operational points for COBRA1 fan.


Table 1.
Family of fan model prototypes.
| Booster | Tests | |||
|---|---|---|---|---|
| C179-2 | Utip = 390 ≈ 400 m/s | η*ad ≈ 0.92 | Z = 4 | 2011–2012 |
| C180-2 | Utip = 390 ≈ 400 m/s | η*ad ≈ 0.92 | Z = 3 | 2011–2012 |
| C178-1 | Utip = 360 ≈ 370 m/s | η*ad = 0.91 | Z = 0 | 2007–2011 |
| C190-2 | Utip = 315 ≈ 320 m/s | η*ad = 0.92 | Z = 4 | 2014–2015 |
Table 2.
Advisory Council for Aviation Research in Europe (ACARE) targets of noise reduction.
| Target | 2020 Vision | 2035 SRIA | 2050 SRIA |
|---|---|---|---|
| Aircraft operation | −10 dB (=−50%) | −11 dB | −15 dB (=−65%) |
SRIA: Strategic Research and Innovation Agenda.
Table 3.
CT nomenclature.
| tS | slot cascade pitch (mm) |
| δS | slot width in circumferential direction (mm) |
| δ’S = δScosφr | slot width along the normal to its longitudinal axis |
| Δh | wall thickness (mm) |
| h ≥ 5 | height of the cavity (mm) |
| φr | angle between the radius and the slot direction in the cross-section (°) |
| φa | angle between the compressor axis and the slot axis (°) |
| b’k = bcosϑ | axial projection of the tip profile chord (mm) |
| b | profile chord (mm) |
| l | axial length of CT over the rotor (mm) |
| L | axial length of CT upstream the rotor inlet (mm) |
Table 4.
Acoustic efficiency of the tested CT configurations installed on the CRTF2A fan model (dB).
Table 4.
Acoustic efficiency of the tested CT configurations installed on the CRTF2A fan model (dB).
| Configuration | Runway | Flyover | Approach | Total |
|---|---|---|---|---|
| H (0+115; 16) | 2.0 | 0.4 | 0.8 | 3.2 |
| J (0+115; 11) | 1.9 | 0.3 | 0.7 | 2.9 |
| K (0+30/72; 6) | 1.3 | −0.3 | −0.7 | 0.3 |
| L (0+42/42; 6) | 0.5 | −2.2 | −1.1 | −2.8 |
| M (133; 13.2+115; 10.2) | 1.6 | −0.4 | 0.9 | 2.1 |
| N (133; 13.2+42/42; 10.2) | 1.3 | −2.8 | −1.4 | −2.9 |
| C (0+85; 5.2) | 1.7 | −0.2 | 0.1 | 1.6 |
© 2018 by the author. Licensee MDPI, Basel, Switzerland. This article is an open access article distributed under the terms and conditions of the Creative Commons Attribution NonCommercial NoDerivatives (CC BY-NC-ND) license (https://creativecommons.org/licenses/by-nc-nd/4.0/).
Share and Cite
MDPI and ACS Style
Mileshin, V. A Review of New Experimental Technologies for the Development of Advanced Fans with High Bypass Ratio. Int. J. Turbomach. Propuls. Power 2018, 3, 21. https://doi.org/10.3390/ijtpp3030021
AMA Style
Mileshin V. A Review of New Experimental Technologies for the Development of Advanced Fans with High Bypass Ratio. International Journal of Turbomachinery, Propulsion and Power. 2018; 3(3):21. https://doi.org/10.3390/ijtpp3030021
Chicago/Turabian StyleMileshin, Victor. 2018. "A Review of New Experimental Technologies for the Development of Advanced Fans with High Bypass Ratio" International Journal of Turbomachinery, Propulsion and Power 3, no. 3: 21. https://doi.org/10.3390/ijtpp3030021