Review

Urban Sustainability Development in Morocco, a Review

by
Lahouari Bounoua
1,*,
Mohamed Amine Lachkham
2,
Noura Ed-Dahmany
2,
Souad Lagmiri
3,
Hicham Bahi
4,
Mohammed Messouli
2,
Mohammed Yacoubi Khebiza
2,
Joseph Nigro
1,5 and
Kurtis J. Thome
1
1
Biospheric Sciences Laboratory, The National Aeronautics and Space Administration, Goddard Space Flight Center, Greenbelt, MD 20771, USA
2
Water, Biodiversity and Climate Change Laboratory, Faculty of Sciences Semlalia, Cadi Ayyad University, Marrakesh 40000, Morocco
3
Research Center for the Organization and Dissemination of Geographic Information (PRODIG), UMR 8586 (CNRS), Paris City University, 75013 Paris, France
4
School of Architecture, Planning and Design, Mohammed VI Polytechnic University, Ben Guerir 43150, Morocco
5
Science Systems and Applications, Inc., Lanham, MD 20706, USA
*
Author to whom correspondence should be addressed.
Urban Sci. 2024, 8(2), 28; https://doi.org/10.3390/urbansci8020028
Submission received: 18 January 2024 / Revised: 12 March 2024 / Accepted: 14 March 2024 / Published: 1 April 2024
(This article belongs to the Topic Urban Land Use and Spatial Analysis)

Abstract

:
During the last decades, Morocco has recorded substantial urbanization and faced challenges related to urban sprawl and encroachment on fertile lands. This paper reviews several studies assessing urban sustainability development in 27 Moroccan urban areas using the UN’s Sustainable Development Goal (SDG) indicator 11.3.1, i.e., the ratio of Land Consumption Rate (LCR) to Population Growth Rate (PGR). Among the 27 urban areas reviewed, analysis of SDG 11.3.1 data revealed that only 7 exhibited trends towards sustainable urban development, while the remaining 20 showed a divergence from the sustainability objectives. We analyze the studies, conducted between 2020 and 2023, describing in depth the relationship between LCRs and PGRs, and provide a comprehensive summary of the SDG 11.3.1 outcome, discussing along the way methodological variations, and introducing a new concept for the evaluation of urban land consumption. The review reveals disparate regional urban development trends, emphasizing the need for local land tenure rules. Additionally, the study discusses how the SDG 11.3.1 reacts under the influence of several parameters such as land characteristics, climate, and geographic location. While the study acknowledges the limitations of SDG 11.3.1, it found that the indicator provides valuable insights into trends and comparisons, and should offer assistance to stakeholders, urban planners, and decision makers in their pursuit of sustainable development. However, these identified limitations underscore the need for a more comprehensive and multidimensional urban sustainability development indicator, capable of better addressing the complexities of the urban environment.

1. Introduction

Morocco, an emerging country located in North-West Africa, has been experiencing a significant population shift towards large cities, similar to other developing nations. This trend accompanied by an urban sprawl was confirmed by the most recent population and habitat census conducted in 2014 [1]. The census findings reveal that urban expansion is primarily occurring in the outskirts of cities, leading to a substantial encroachment on natural lands. This trend is projected to persist and escalate in the upcoming decades ascribed to the increasingly prevalent rural exodus and the ongoing expansion of urban edges driven by diverse socio-economic factors. It has been discovered that in urban and surrounding areas, this kind of tendency frequently results in major environmental issues [2]. The issues accompanying the escalating pace of urbanization are prevalent in many other developing countries confronting similar challenges. Therefore, Morocco, chosen as a case study for our review, is expected to provide valuable insights into the complexity of urban development in the Global South. In particular, our review sheds light on the limitations to anticipate when relying on SDG 11.3.1 for assessing urban sustainability, which holds relevance beyond the borders of Morocco.
The Kingdom of Morocco has taken various steps to integrate sustainable development within its policies and has actively worked alongside the international community to contribute to global efforts in order to achieve the 17 Sustainable Development Goals (SDGs) of the 2015–2030 United Nations (UN) Agenda [3]. Moroccan policies in this regard include the Framework Law for the Environment and Sustainable Development adopted in 2014 [4] which sets the overall regulatory framework within which public policies are to be implemented, and the National Sustainable Development Strategy [5], which focuses on the technical implementation of the strategic directions.
Amongst the 17 SDGs set by the UN, urbanization was addressed via the 11th Goal, entitled “Sustainable Cities and Communities” and more specifically via its third target labeled “Inclusive and Sustainable Urbanization” which aims to ensure that cities can accommodate and offer equal opportunities to all groups of population, in a modern, integrated, and sustainable way [6].
Previous studies indicate a scarcity of literature and reports on SDG 11.3.1. Existing reports from developed nations often highlight urban growth rates surpassing population growth rates, signaling a growing disparity. However, the experiences of developing countries in regions such as Africa, South America, and East Asia remain underrepresented in the existing literature [7].
Research has examined the sustainability of urban development in various Moroccan urban areas using the UN Sustainability Development Goal indicator 11.3.1, which focuses on the relationship between the urban land consumption rate and the population growth rate.
This review incorporates four such studies representing the entirety of research conducted on urban sustainability in Morocco using SDG 11.3.1. These studies collectively cover a total of 27 urban areas, providing comprehensive insights into the dynamics of urban development sustainability within the Kingdom between the last two censuses.
First, the pioneering study [8] investigated urban development sustainability in the 25 largest urban areas of Morocco based on population data from 2003 to 2013. Although the census dates for Morocco were 2004 and 2014, the study interpolated the population data to 2003 and 2013 to match the best available Landsat satellite imagery. The first study was followed by two more in 2022, Refs. [9,10], each of which analyzed SDG 11.3.1 in two urban areas, namely Tangier and Laayoune, and Marrakech and Agadir, respectively, for the years of 2004 and 2014. The study conducted by [8] assessed the same four urban areas as in the aforementioned studies of Tangier, Laayoune, Marrakech, and Agadir. However, the variations in the methodology employed to estimate SDG 11.3.1 in each study justify their inclusion. This allowed for a more comprehensive comparison and more understanding of how the indicator responds to changes in the estimation of its components, namely land consumption and population growth rates. Lastly, ref. [11] explored urban sustainability in three additional Moroccan urban areas, namely Berkane, Taza, and Rabat, where SDG 11.3.1 has not been previously estimated.
Nowadays, sustainability is among the most crucial factors in territorial planning and management decision-making processes, thus, prioritizing adaptation and learning among all stakeholders is now necessary for sustainable development to emerge [12]. In this context, the objective of this paper is to review and provide a comprehensive summary of the key findings from the aforementioned four studies, and to discuss the strengths, limitations, and the performance of SDG indicator 11.3.1 in assessing urban development sustainability based on local data in Morocco’s urban areas. Additionally, this contribution introduces a new concept, the Urban Zone of Interest (UZI), to estimate urban land consumption, a contested measure in previous studies.

2. Methods and Data

SDG indicator 11.3.1 is defined as the ratio between the rate of land use for urban purposes and the rate of population growth in the same urban area over a given period [6]. In order to calculate indicator 11.3.1, satellite imagery is used to estimate the change in impervious surface of the urban area for the given period, which includes all man-made infrastructures, and which will subsequently be used to determine the land consumption rate (LCR). Local census data are used to calculate the population growth rate (PGR) over the same area and period. Using the UN-defined method [6], we calculated the SDG 11.3.1 using the Land Consumption Rate (LCR) and Population Growth Rate (PGR):
L C R = L n ( U r b [ t + t ] / U r b [ t ] ) t ,
P G R = L n ( P o p [ t + t ] / P o p [ t ] ) t ,
The SDG Indicator 11.3.1 is calculated as the ratio of LCR to PGR:
S D G   11.3.1 = L C R P G R
S D G   11.3.1 = L n ( U r b [ t + t ] / U r b [ t ] ) L n ( P o p [ t + t ] / P o p [ t ] )
Using the natural logarithm notation, Ln, Urb [t] represents the built-up surface area (in area units) during the initial year, while Urb [t + ∆t] represents the built-up surface area during the final year. Similarly, Pop [t] denotes the total population count (in persons) in the initial year for each urban area, and Pop [t + ∆t] represents the total population count for the same urban area in the final year. The variable ∆t signifies the number of years between the two measurements. Since population and urban areas tend to undergo gradual changes, many countries conduct national population censuses at least once every 10 years. This study adopts a decadal scale for analysis.

2.1. Determining the Size of the Urban Area

There is no generally agreed upon definition of a “city” or an “urban area”, apart from its administrative delineation and name. Assessing SDG 11.3.1 based solely on the administrative boundaries of an urban area has some challenges. First, the administrative boundaries of an urban area may change over time for socio-economic considerations, as was the case in Morocco in 2015, when a new regional territorial realignment resulted in changing the number of administrative regions and a redistricting of provinces and communes [13]. Such unanticipated redistricting may change delineations of the census units and make population counts incomparable in time. On the other hand, in the case where there are no changes in administrative boundaries of the urban area under consideration, the assessment may show no change in land consumption. This situation may also arise when the selected administrative urban area is fully urbanized. Therefore, using the administrative boundaries for estimation of land consumption may lead to large disparities in SDG 11.3.1 estimates and limit international as well as national comparability. Furthermore, urban expansion has widened the statistical coverage of urban residents, yet, population data are typically collected based on administrative regions, which may not align with the actual boundaries of the built-up area in research, leading to a common issue known as the modifiable areal unit problem in geographical studies [7,14].
Following consultation with its member states, the United Nations Statistical Commission (UNSC) endorsed the Degree of Urbanization (DEGURBA) as a workable method to delineate cities, and urban and rural areas for international statistical comparisons [15]. This method combines population size and density thresholds to stratify territories along the urban-rural continuum and captures the full extent of a “city”, including the dense neighborhoods beyond the boundary of the city core. DEGURBA is applied in a regular grid of 1 km × 1 km classified based on population density, contiguity, and population size. Subsequently, local units are classified either as urban or rural depending on the type of grid cells in which the majority of their population resides. The UNSC encourages countries to adopt the degree of urbanization to define the area for the computation of indicator 11.3.1. This method has several benefits and can be applied in a cost-effective manner using existing household data [15]; however, it relies on interpolated gridded population, which may carry large uncertainties. Often, the creation of a gridded population does not make use of any other geographic information in order to spatially disaggregate the census population. Population is usually allocated into grid cells with the simple assumption that it is an exclusive function of the land area within that pixel. Furthermore, when the census units are large, the precision of individual grid cells within that unit is severely degraded [16,17,18], and may lead to spurious results.
Multiple scholars suggest that urban development intensity could be delineated for urban zones, stretching from the city center to the nearby rural regions, based on the percentage of Impervious Surface Area (ISA). The use of a threshold methodology to define polygons via satellite imagery and identifying a sensible boundary between the urban core and the low urban-intensity surroundings, following a land use classification, is advocated. Specifically, it has been determined that pixels with less than 25% ISA could be categorized as rural. This threshold is expected to define spatially coherent urban groupings, thereby aiding in the delimitation of urban zones [19,20].
The studies over Morocco taken into consideration in this review used: (1) a modified version of the DEGURBA method, and (2) introduced the new concept of Urban Zone of Interest (UZI) based strictly on the SDG 11.3.1 objective to describe the dynamic of land consumption for urban purposes as a function of population change.

2.2. Modified DEGUBRA

The modified DEGURBA was used in [8] and consisted of using Landsat data as a base for the definition of the urban area’s size. Landsat data for 2003 and 2013 at 30 m × 30 m horizontal resolution were first processed to correct for atmospheric effects and then used to cover the urban areas study domain (Figure 1). The selection of these years was based on the availability of cloud-free satellite images and their close temporal alignment with Morocco’s census years of 2004 and 2014. In the same line of thought as the degree of urbanization concept, an urban area was defined to refer to a conurbation—a sizable urban conglomerate where the zones of influence of distinct cities or towns are linked by a quasi-continuous built-up area of varying density. Cities or towns in the conurbation may be independent units loosely connected to each other, but overall forming a cluster of impervious surfaces (Figure 2A). As in DEGUBRA, all pixels were then aggregated from 30 m × 30 m to 1 km × 1 km spatial resolution, and the ISA was expressed as a fraction of the 1 km × 1 km pixel (Figure 2B). Next, the urban conurbation was stratified into three zones based on the ISA fraction in each 1 km × 1 km pixel. The stratification process began with the highest Impervious Surface Area (ISA) fraction at the core of the urban conurbation and extended outward. This delineated an urban zone comprising all pixels with ISA fractions equal to or greater than 25%, and a suburban zone consisting of pixels with ISA fractions between 25% and 5%. Pixels with less than 5% ISA were categorized as rural.
When delineating rural zones using this methodology, caution was exercised to avoid encroaching into the suburban or urban areas of neighboring urban conurbations, if any, by limiting the rural zone’s extent within a buffer of 20 km from the 5% ISA contour. The urban area’s boundaries were then established by encompassing all census units that contained pixels with an ISA exceeding 5%, as illustrated in Figure 2C. In other words, the size of the urban area was determined based on the count of pixels classified as both urban and suburban.
This definition offered an objective framework for assessing and contrasting SDG 11.3.1 when focusing on the same urban area in both the initial and subsequent time frames. In Morocco, urban areas typically comprise small and disorganized cities and towns, where the boundaries between urban cores and suburbs are indistinct, with the suburbs naturally blending into the urban cores, but generally with less areal density compared to those cores [8]. By contrast, the suburbs are clearly distinct from rural zones (Figure 2B).

2.3. The Urban Zone of Interest (UZI)

Since the primary objective of SDG 11.3.1 is to inform on the relationship between the consumption of land use for urban purposes as a function of population growth, a method was developed to measure the urban land use based mainly on the locations where land use change occurred. The urban zone of interest is defined as an assemblage of documented, entire census units (communes in the case of Morocco) where urbanization has significantly changed the landscape during the considered period. It is useful at this point to note that in Morocco, the territorial administrative division consists of “regions” the largest units that includes “provinces”, which in turns are divided into “communes”, the smallest census units. Thus, UZIs are not necessarily formal administrative structures, although they are delineated using communes which are formal administrative divisions.
UZIs are defined using satellite imagery to depict the impervious surface area (ISA) within communes where land has been converted to urban. Figure 3 illustrates the UZI for Rabat’s urban area. The focus was on areas with high ISA density and where important changes occurred (Figure 3B). The administrative boundaries of the census units were then used to categorize areas with a high density built-up as the centers of the UZI. It is important to note that all census units selected to be part of the UZI must be included entirely in both years of the measurement period and must have population counts. The impervious (buildup) surface area is then estimated in the UZI by taking the number of pixels classified as built-up in the satellite imagery and multiplying it by the unit area of the pixel. It is crucial to emphasize the significance of utilizing high-resolution satellite data when conducting studies of this nature. The accuracy and precision of the data employed are paramount in attaining the highest level of credibility and reliability for the obtained results.
In this review, we included the results of SDG indicator 11.3.1 for the urban areas of Tangier and Laayoune obtained by [9], as well as the results for the urban areas of Agadir and Marrakech obtained by [10]. These urban areas were also included in the study conducted by [8]. However, in the latter study [8], Landsat data at 30 m resolution was used as a base to aggregate to 1 km × 1 km, then a fraction of the 1 km pixel was used to define the surface of urban area, whereas the more recent studies of [9,10] directly used the higher spatial resolution of 30 m × 30 m to estimate land consumption rates in their calculation of SDG 11.3.1. Similarly, ref. [11] used Landsat 30 m × 30 m to define the ISA within the UZIs in the assessment of SDG 11.3.1 of the urban areas of Berkane, Taza, and Rabat. This way, we established an intersection of urban areas where SDG 11.3.1 was defined using modified DEGURBA and UZI for land consumption rates (LCR). This allowed for further comparative analysis.
The measurement of land consumption for urban purposes differed in another aspect, namely the distinction between pixels classified as urban land and those categorized as rural land. In estimating urban land consumption, the pioneering study [8] considered only pixels with an ISA greater than or equal to 5% of the pixel. Consequently, pixels with an ISA less than 5% were deemed rural and not included in the calculation of the land consumption rate, whereas the other three studies [9,10,11] considered all Landsat pixels classified as urban land in estimating the land consumption rate.

2.4. Determination of the Urban Area Population

Once the urban area is defined, the next step is to determine the demographic data within the UZI during the same period. This data are then used to calculate the population growth rate (PGR). To this end, demographic data must be acquired within each constituent unit of the UZI for the beginning and end of the study period. Morocco’s census demographic data are accessible via the website of the High Commission for Planning (HCP) [21,22].
Out of the four studies on which this review is based, the first one [8] utilized a linear interpolation technique, applying the 10-year population average growth rate for each of the 25 urban areas to estimate the populations for 2003 and 2013, extrapolated from data collected in 2004 and 2014. This considered the population change between 2003 and 2013 to match that between 2004 and 2014 [8]. It is worth mentioning that this was necessary, as there was no cloud-free satellite imagery available for all the 25 urban areas during the census dates from 2004 to 2014. The remaining three studies used the data offered by the national census websites directly because their study period synchronized with the census dates. Figure 4 illustrates the population change in all 27 urban areas between the study’s two endpoints and the corresponding increase in their ISA. The urban areas are ordered by population increase, with Zagora having the smallest increase of 5216 persons and Casablanca having the largest, with a total increase of 385,218 persons.

3. Results and Discussion

The estimation of the impervious surface area, population count, and SDG indicator 11.3.1 for each one of the 27 urban areas in Figure 1 are given in Table 1:
To facilitate a comparative analysis among various urban areas, Figure 5 illustrates the presentation of data pertaining to SDG indicator 11.3.1, which has been organized in ascending order, and Figure 6 presents the population change in the 27 urban areas, arranged in an increasing order, alongside their corresponding SDG 11.3.1 scores.
Prior to examining the distinct outcomes for all 27 urban areas, it is important to acknowledge the disparities observed in the assessment of SDG 11.3.1 for the four urban areas of Marrakech, Agadir, Laayoune, and Tangier as they differ significantly in the three studies in which they were included [8,9,10]. In the first study [8], it was found that all four urban areas deviated from sustainability, with Marrakech scoring 1.13, Tangier 1.61, Laayoune 2.21, and Agadir 2.32 for the SDG 11.3.1 indicator. However, it was found in [9] that the urban area of Tangier scored 0.98, while Laayoune’s SDG 11.3.1 was 0.76; on the other hand, ref. [10] found that Agadir urban area scored 0.75 and Marrakech 0.44 for the same indicator, suggesting that all four urban areas remained within the bounds of sustainability. The differences observed can be partially attributed to the use of different spatial resolutions for defining the urban area surfaces, highlighting the importance of utilizing high-resolution satellite imagery. Furthermore, this difference can also be partially attributed to the fact that the measurement of land consumption for urban purposes differed in the distinction between pixels classified as urban lands versus those labeled as rural and excluded from the calculation. In ref. [8], the land appropriated for urban use was represented by the 1 km × 1 km grid cell with an ISA greater than 5%, which overestimated it and resulted in higher SDG 11.3.1 values. This method also introduced a compensating effect by considering the population of the rural areas included in the census but not accounting for its footprint on land. However, although compensating for each other, these two biases resulted in higher SDG 11.3.1 values, primarily due to an overestimation of the urban land consumption component. Nevertheless, while utilizing a larger land area in LCR calculations may introduce a certain level of bias, it is important to note that this bias is consistently applied at both the starting and ending points of the computation. Consequently, this bias tends to cancel out to some extent when calculating the final SDG 11.3.1 score. Therefore, the impact of this bias on the final score is less significant.
In Figure 6, a notable trend emerges. It can be observed that urban areas experiencing significant population increases tend to exhibit lower SDG 11.3.1 scores compared to areas with relatively smaller population increases. Analyzing the specific results of each urban area in future sections will help elucidate the factors contributing to this observed trend.
In the pioneering study [8], the assessment of SDG indicator 11.3.1 for the urban area of Rabat, which consists administratively of six census units, could not be realized as the total population of all the six census units decreased during the period 2004–2014. Therefore, the delineation of the Rabat urban zone of interest presented a challenge. This decrease in population makes SDG 11.3.1 negative and its interpretation not in line with the indicator’s objective. The decline in the population of the province of Rabat has been mainly attributed to the departure of natives to neighboring areas, especially Sale and Skhirate-Temara, which provide proximity and more affordable housing. To bypass this obstacle, ref. [11] defined an urban zone of interest for which SDG 11.3.1 estimation became possible by considering a metropolitan urban area of Rabat, which included the six administrative units constituting Rabat, to which were added five census units belonging administratively to Sale, the commuter province of Rabat to the north, and nine other census units that belong to Skhirate-Temara, the commuter province of Rabat to the south (Figure 3). These census units were selected based on their significant land consumption and their geographical proximity to the province of Rabat compared to other census units. This assemblage allowed the newly defined urban zone of interest (UZI) to have positive population and land consumption growth, and, consequently, made the evaluation of indicator 11.3.1 possible. Most importantly, the UZI defined the actual conglomeration around the urban area of Rabat where urban expansion occurred (Figure 3).

3.1. SDG Indicator 11.3.1 and Morocco’s Administrative Regions

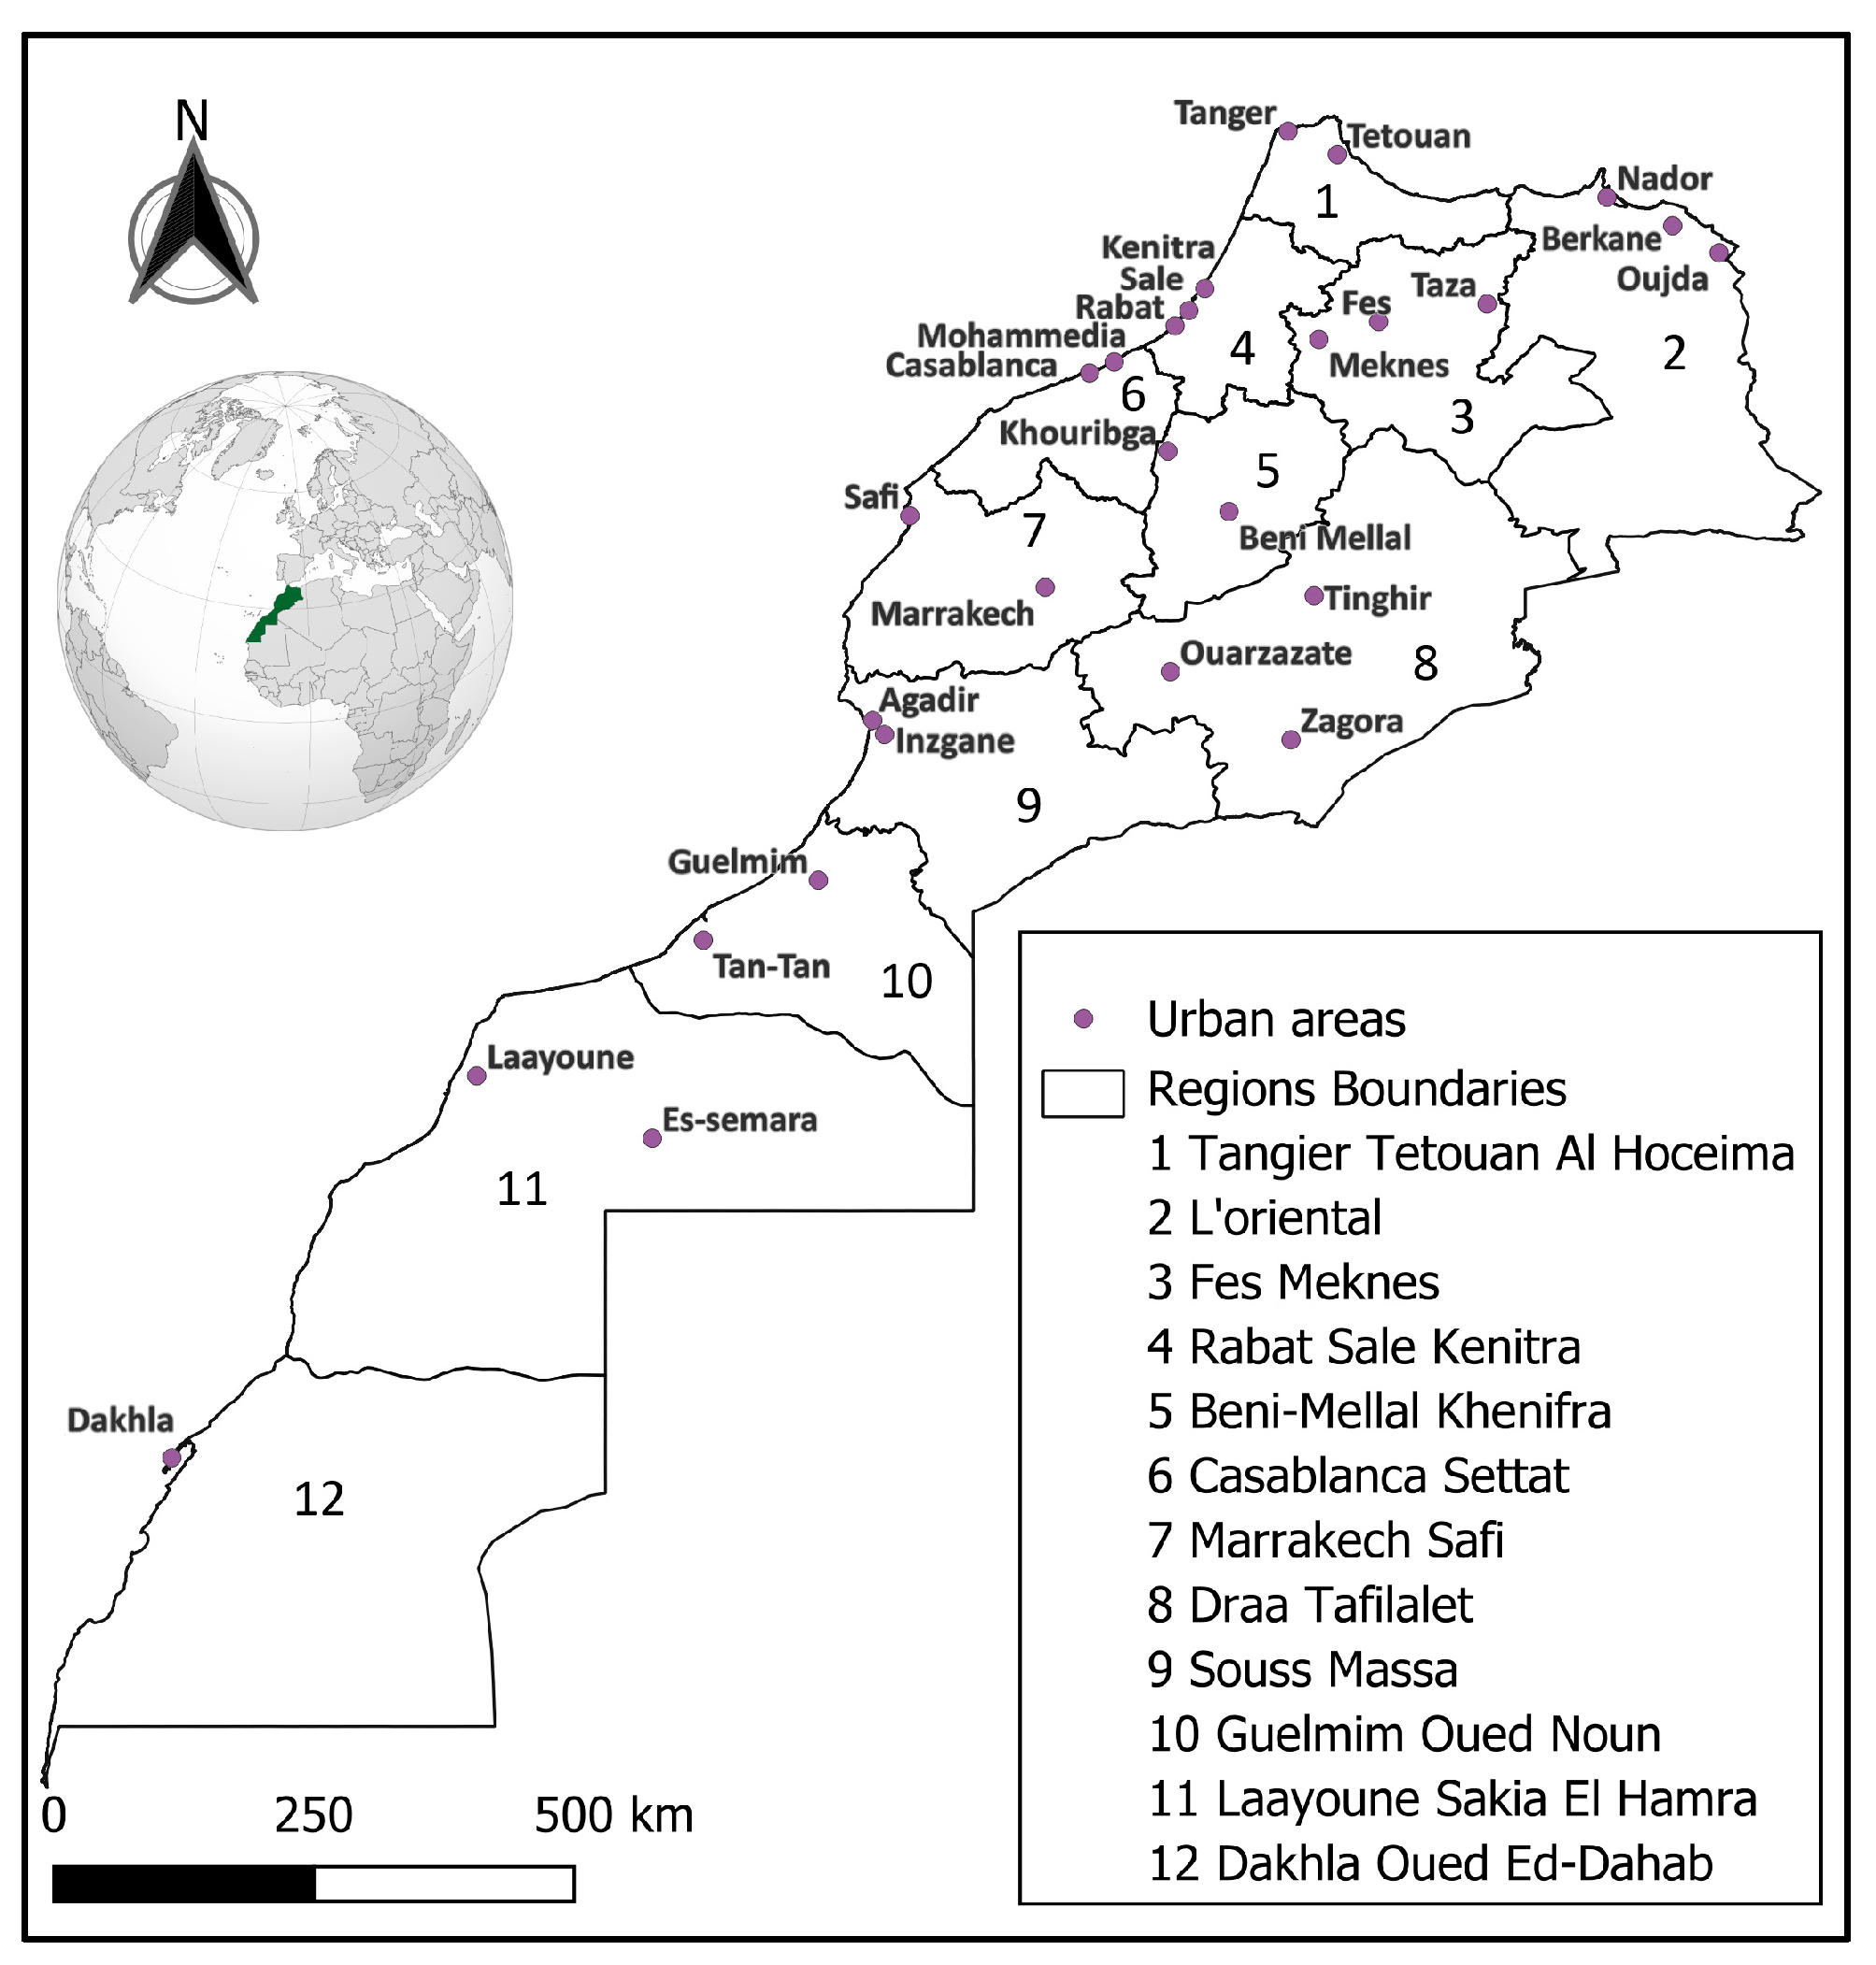
This review encompassed urban areas from all twelve Moroccan administrative regions (Figure 1). The forthcoming section will examine the urban sustainability status of urban areas within each region. We will begin with regions where all of the urban areas included in this review demonstrated sustainable urban development per SDG 11.3.1 and conclude with the administrative regions in which no urban area has managed to avoid a decline from the initial state of urban sustainability. Table 2 presents an overview of these statistics.
The Casablanca-Settat region was represented by two urban areas: the economic capital of the Kingdom, Casablanca, and its neighbor to the north, Mohammedia, with both scoring an SDG Indicator 11.3.1 lower than the neutral value of one, implying their trends towards urban land consumption sustainability. Located on the Atlantic coast of western Morocco, Casablanca has a population of about 3.71 million (ca. 2014) in the urban area and over 4.27 million in Greater Casablanca and is expanding more horizontally than vertically. Casablanca is a large financial center in Africa where the leading Moroccan companies and many foreign corporations doing business in the country have established their headquarters and main industrial facilities. Therefore, real estate is expensive and a large part of the working population overflows to the neighboring Mohammadia to the north. However, this inter-urban migration has slowed due to an increase in housing commodity prices in Mohammadia following the surge in demand. As expected, Casablanca and Mohammadia are amongst the urban areas with the smallest SDG indicators with a land consumption rate much lower than population growth rate and hence a sustainable urban development.
The regions of Tangier-Tetouan-Hoceima, Souss-Massa, Marrakech-Safi, and Laayoune-Es Semara were represented by two urban areas each. Within these regions, a notable divergence in sustainability trends was observed between the two urban areas, with one exhibiting a positive trajectory towards sustainability per SDG 11.3.1, while the other exhibited a contrasting trend away from sustainability.
In the context of urban areas in northern Morocco, specifically Tangier and Tetouan, both situated along the Mediterranean coast, we observed disparities in the results of SDG 11.3.1. According to the first study [8], Tangier received a score of 1.61, which exceeds the neutral value of one. In the second study [9], Tangier received a score of 0.98, barely below unity. When comparing the urban sustainability in Tangier and Tetouan and seeking to comprehend the dynamics of these neighboring urban areas, it is evident that both scores for Tangier are notably lower than that of Tetouan. Tetouan’s score stands at 2.85, indicating a significant departure from urban sustainability. These discrepancies can be attributed to specific factors. Tangier has undergone significant urban development, positioning itself as the second-strongest industrialized urban agglomeration in the country after Casablanca. This transformation is marked by the presence of robust industrial and economic assets, aligning with the objectives envisioned in the region’s urban development master plan. Prominent among these assets are the Tangier-Med port, the automotive manufacturing hub, exemplified by the Renault-Nissan Tangier Med plant, and various energy, infrastructure, and textile industries. The industrial growth in Tangier was followed by a surge in population migration to the city and notable increases in land prices with a discernable trend towards vertical urbanization. As a result, an increasing number of individuals have sought residence in adjacent urban areas within commuting distance to Tangier, particularly Tetouan due to its comparatively attractive land prices and opportunities, thus affecting the SDG 11.3.1 scores for the two urban areas.
Regarding the Marrakech-Safi region, represented by its two prominent urban areas, Marrakech and Safi, a striking disparity in urban development outcomes is apparent. Marrakech, which experienced an expansion of its urban land area by approximately 26.55 km2 for a population increase of 287,523 people, achieved an SDG 11.3.1 score of 0.44. This score indicates a notable shift toward enhanced urban sustainability and expresses an urban land consumption of about 92 square meter per capita (m2/capita). The increase in urban land use is not only to accommodate the growth in population but rather to account for a substantial physical growth during this period, marked by the construction of new residential neighborhoods, housing complexes, and commercial zones on the urban area’s outskirts. In the inner city, the expansion is clearly evidenced by the construction of modern housing and infrastructure, several hotels, leisure buildings, and roads, all driven by the imperative of accommodating the growing population, but, most importantly, capitalizing on the flourishing tourism industry.
Conversely, Safi, over the same timeframe, expanded its urban land area by approximately 9.55 km2, accommodating a comparatively modest population increase of 23,758 people or about 402 m2/capita. This expansion resulted in Safi attaining an SDG 11.3.1 score of 10.02, signifying an extreme departure from urban sustainability among all the urban areas under this review. The remarkable increase in Safi’s score can be attributed to several factors, including, for a large part, the pronounced growth of the phosphate and chemical industries, cement and textile manufacturing, substantial infrastructure enhancements at the Safi port, and a noteworthy residential expansion. These dynamics collectively led to more than doubling of the city’s urban footprint during the period, surging from 7.66 to 17.21 km2 for a relatively small increase in population count. This is a clear indication that SDG 11.3.1 does not really inform about the relationship between urban land consumption rate and population growth rate alone, and other socio-economic factors need to be taken into consideration in the assessment of sustainability in the urban development.
As far as the L’Oriental region is concerned, its three most populous urban areas during the period of analysis were Berkane, Oujda, and Nador. Among the three, it was found that only Berkane had a sustainable trend with an indicator of 0.31, while the urban areas of Nador and Oujda scored an indicator of 1.50 and 1.85, respectively, reflecting a slight drift from urban development sustainability.
During the considered timeframe, the urban area of Berkane underwent an interesting urbanization and industrial growth. The agricultural sector, particularly the cultivation of citrus fruits, remained a cornerstone of Berkane’s economy, leading to modernization efforts, such as expanded orchards and advanced irrigation systems. The agro-industrial sector flourished with the establishment of processing facilities and infrastructure improvements, including residential infrastructure and road enhancements and transportation network expansions (e.g., Voie Express N6), that were implemented to further support urbanization.
Similarly, Oujda’s urban area experienced a substantial influx of residents, leading to the construction of new residential areas and infrastructure development, highlighted by the expansion of highways and the Oujda-Angad Airport. Oujda’s industrial sector saw growth with the establishment of the “Oujda’s industrial zone”, attracting industries like food processing and textiles to meet rising consumer demands. Educational and healthcare infrastructure expanded as well, such as the extension of the “University of Mohammed I” and other medical establishments. Despite the considerable urbanization Berkane’s urban area underwent, it only expanded by an extra 1.84 km2, accommodating a relatively modest population increase of 46,262 people, an increase corresponding to about 40 m2/capita, and allowed an SDG 11.3.1 score of 0.31, showing a positive trend towards sustainability. In contrast, Oujda experienced much more significant urban growth during the same period, with its urban area expanding by 15.59 km2 and a population increase of 92,129, or an increase of about 169 m2/capita. This resulted in a higher SDG 11.3.1 score of 1.84, indicating a departure from its initial sustainability state.
The Dakhla-Oued Eddahab region, situated in the extreme southern part of Morocco, was represented by a single urban area, Dakhla. Dakhla is notable for its thriving fishing industry and aquaculture activities that experienced expansions and modernization during the study period. Additionally, the Dakhla port underwent upgrades and expansion to accommodate increased shipping traffic and facilitate seafood product exports. In tandem with these industrial developments, Dakhla’s strategic coastal location along the Atlantic Ocean and its natural scenic beauty attracted both tourists and investors. The city witnessed tourism infrastructure, including hotels, resorts, and recreational amenities. Notably, Dakhla’s urban area achieved an SDG 11.3.1 score of 1.26 slightly exceeding unity, indicating a modest deviation from the region’s initial urban development sustainability level, following its urban revival.
The Guelmim-Oued Noun and Beni Mellal-Khenifra regions were each represented by two urban areas, namely Guelmim and Tan Tan, and Beni Mellal and Khenifra, respectively. In both cases, the SDG 11.3.1 scores for these urban areas exceeded unity, denoting a drift away from their initial level of urban sustainability.
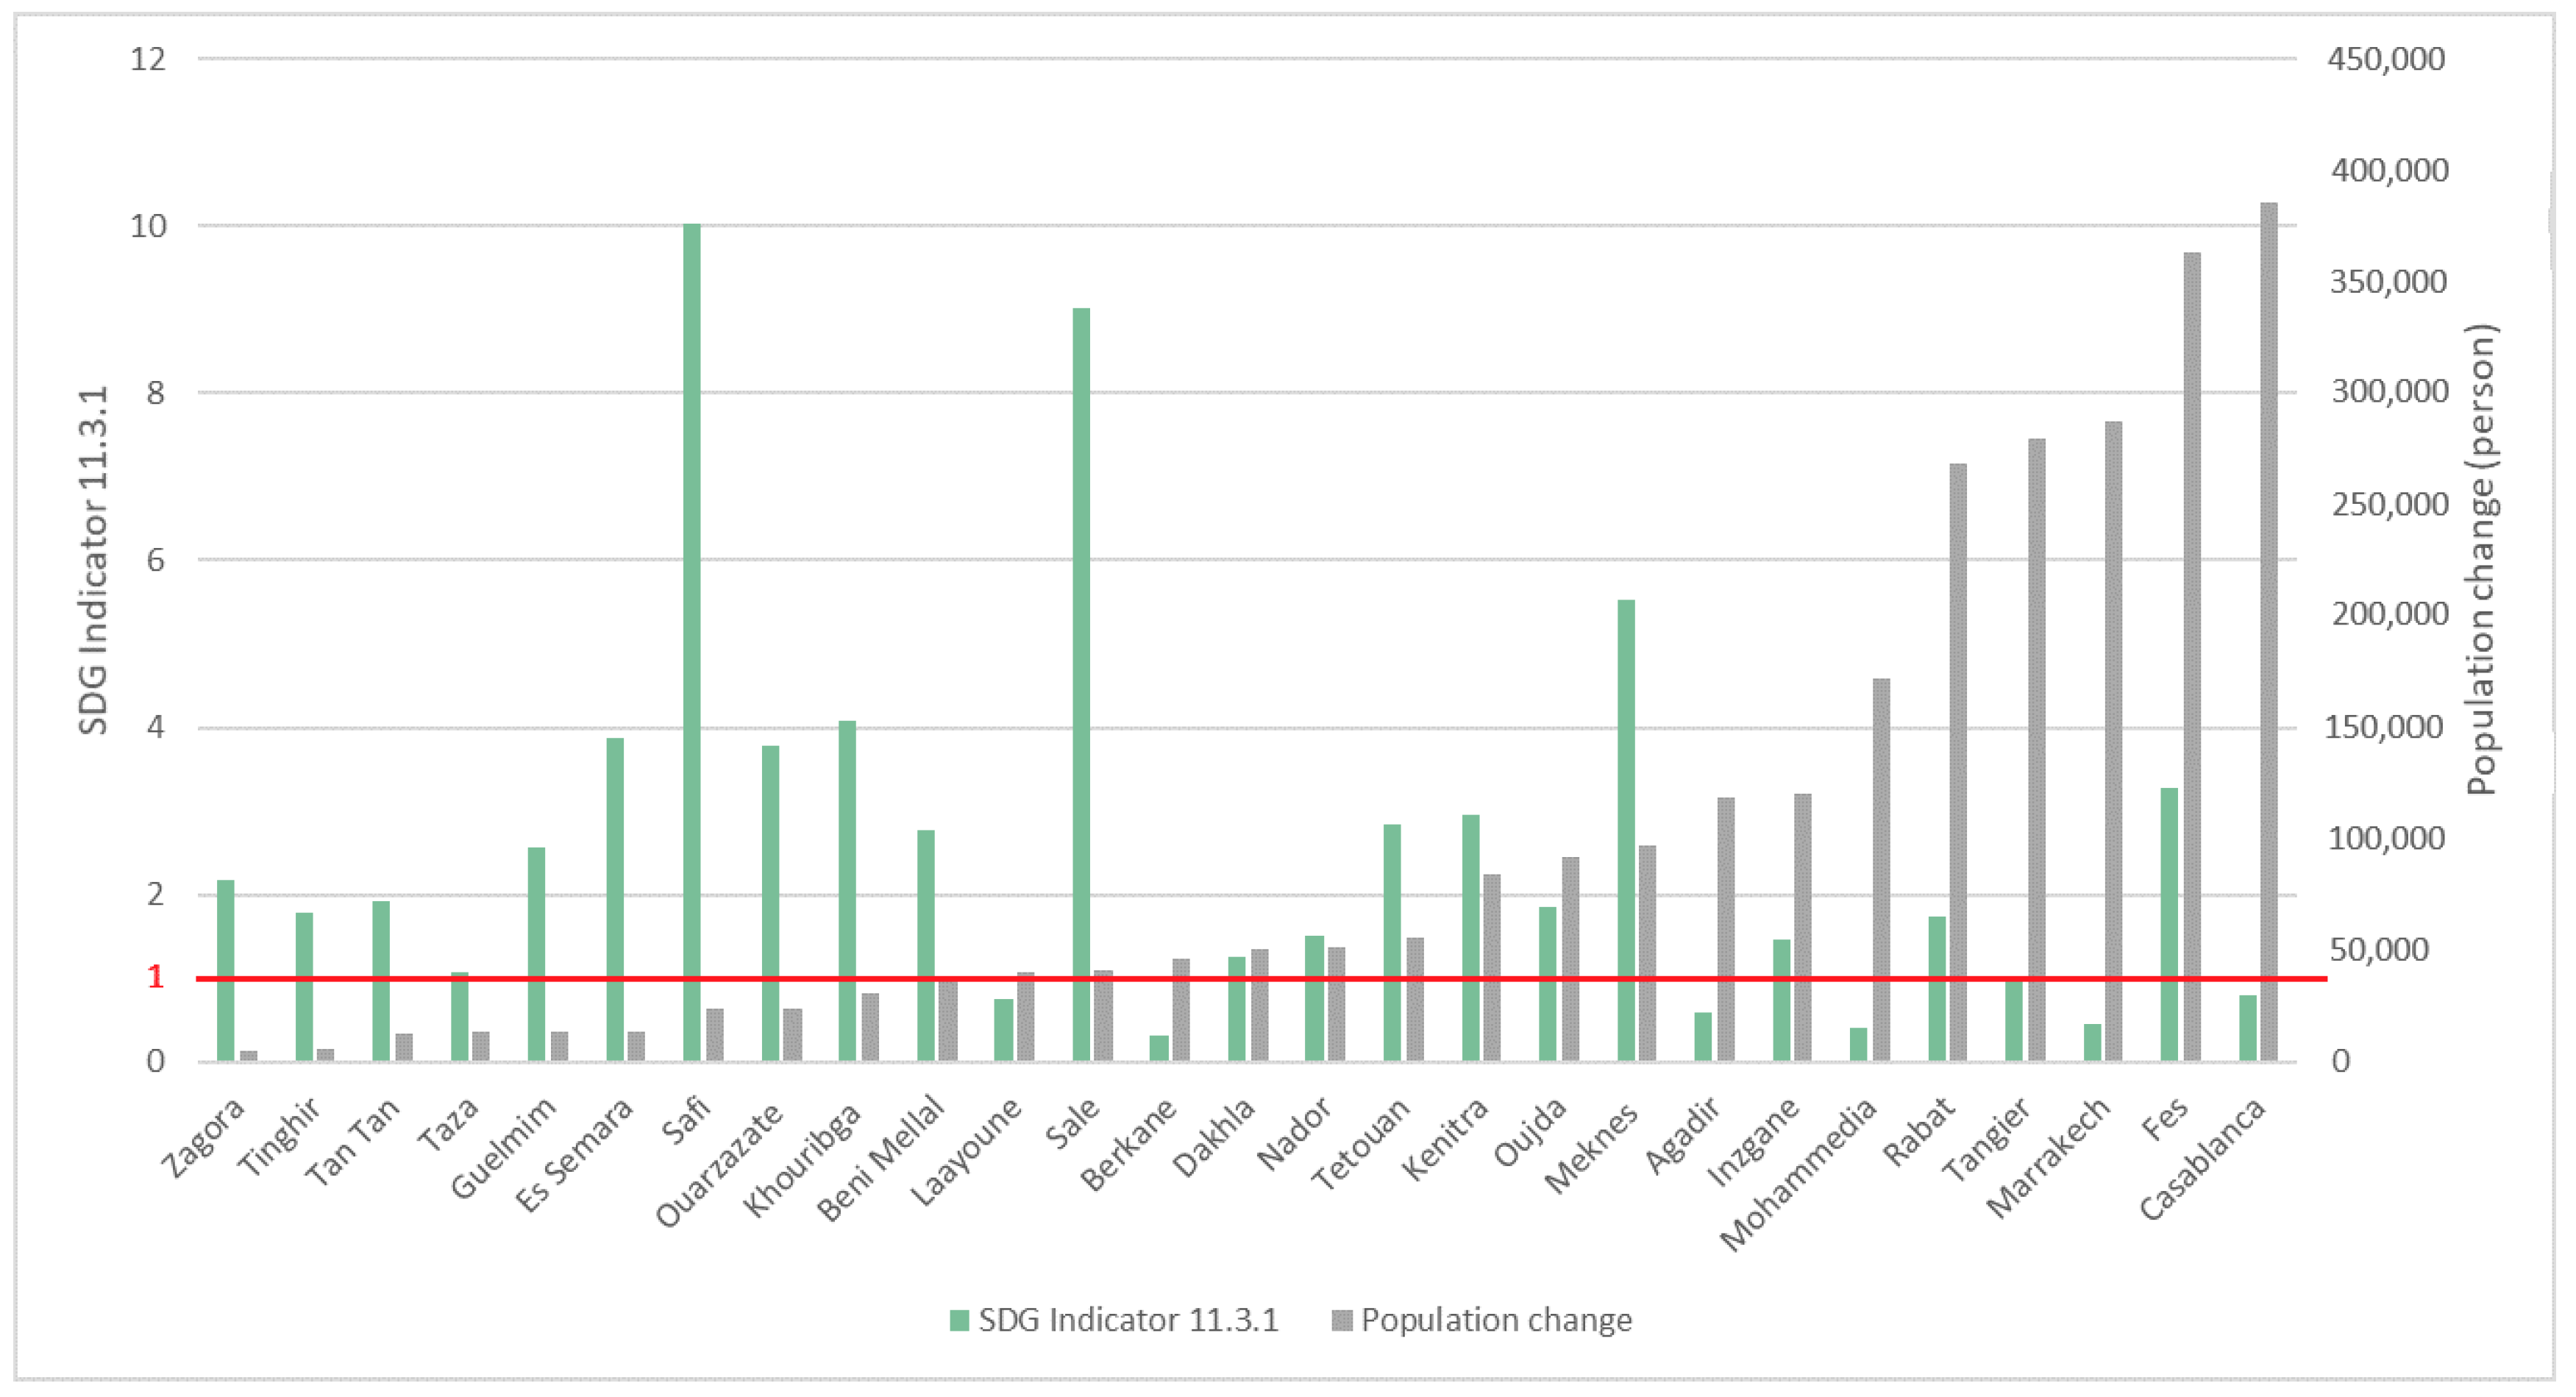
Among the twelve administrative regions included in this review, the remaining three—Fes-Meknes, Rabat-Sale-Kenitra, and Draa Tafilalet—had ranked last in in terms of urban development sustainability as defined per SDG 11.3.1. They were each represented by three different urban areas, however, none of the urban areas within these regions achieved a score lower than the neutral value of one (Figure 5).
As we contemplate the major events that have marked the present landscape of Rabat’s metropolitan area, a detailed examination of the trajectory chosen among other possibilities becomes imperative. Rabat, as the capital of the Kingdom, received a special attention with regard to infrastructure development and economic optimization. This advancement brought along ongoing projects which had affected the housing market prices that consequently became over the reach of even well-off social classes [23]. Under such circumstances, people were forced to look for more affordable housing alternatives elsewhere; thus, new settlements started to rise in the vicinity of the capital. Such settlements included those located in the communes of Ain El Aouda, Sabbah, and Sidi Yahya Zair, census units 3, 13, 14, respectively, in Figure 1, all three belonging to the administrative province of Skhirate-Temara. The geographical distribution of these new emerging urban settlements took place on a vast area of land, which raises the question on whether there was a possibility for a better urban planning with the aim of lessening the commuting distance, of these now-dispersed urban settings, to the capital Rabat, and carry along other advantages in terms of resources allocation, and infrastructure optimization.
The computation of SDG Indicator 11.3.1, omitting the three aforementioned census units (3, 13, and 14) from the UZI of Rabat, resulted in the reduction in the SDG Indicator 11.3.1 score from the original 1.74 to 1.61, showcasing how, the new impervious surface area introduced in these communes (between 2004 and 2014) negatively impacted the indicator’s result, as land was consumed at a higher rate than population growth. Currently standing scattered, these three urban settlements face many challenges such as smaller-scale economies and limited opportunities for growth, due to the coupling of infrastructure development costs and resource allocation. Adding to that, the higher commuting-related environmental impact and potential fragmentation of local ecosystems raises ecological sustainability concerns.
Exploring the possibility of having one continuous urban settlement, combining the aforementioned three settlements and any planned urban expansions taking place in the Skhirate-Temara province, with a commuting purpose, should have been a possible alternative pathway that could have some benefits. This approach allows for efficient land use, streamlined infrastructure development, and economies of scale, fostering a central economic hub for the entire Skhirate-Temara province and possibly the entire Rabat metropolitan area. It facilitates cost-effective provision of centralized services, promoting equitable access to shared resources and enhancing social integration. A continuous urban settlement solution could have taken place in the northern part of the Sidi Yahya Zair (commune 14) where the project of the new city “Tamesna” was already launched in 2004 aiming to free some of the housing pressure on Rabat and solve the informal housing problems. However, this project still faces a number of challenges, such as the refusal of many households to participate in the resettlement process [24], and several private developers exiting the project prematurely [25]. Examining the shortcomings encountered during the implementation of the latter project and considering the various aspects highlighted in the modeling scenario for a continuous settlement sheds light on a more comprehensive understanding of the complex issue of sustainable urban development.
The urban areas of Tinghir, Zagora, and Ouarzazate, all located in the administrative region of Draa-Tafilalet, underwent noticeable urban land consumption. Tinghir, known for its stunning Todgha Gorges—a natural oasis created by the river Todgha carving its way through limestone with over 400 m in height canyon-walls on the eastern part of the Atlas Mountain—saw an expansion of residential areas and improved infrastructure, including the construction of new housing complexes. Zagora, a gateway to the Sahara Desert, experienced growth in tourism-related infrastructure, such as hotels and desert excursion services. Ouarzazate, often referred to as the “Hollywood of Morocco” due to its role in the film industry, witnessed an expansion of its film-related infrastructure. The entire Draa-Tafilalet region saw infrastructure improvements, including new roads extension and renewable energy projects, contributing to its economic and urban development. However, this development occurred at a rate much higher than the population growth in the three urban areas, leading to an SDG 11.3.1 score exceeding the neutral value of one, especially in Ouarzazate.

3.2. SDG Indicator 11.3.1 and Urban Land Value

The 27 urban areas included in this review were categorized into three distinct groups based on their land value. The first category comprised six urban areas, including Casablanca, Rabat, Fes, Tangier, Marrakech, and Agadir, which are considered the most important urban agglomerations in their respective administrative regions. Among these urban areas, Casablanca, Rabat, and Fes each had a population exceeding 2 million, while Tangier, Marrakech, and Agadir had populations surpassing 500,000 people circa 2014 [22]. These areas hosted high levels of tourist attraction and significant socio-economic development in addition to high level of public services such education, transportation, and health care, with all of them being considered among the most important metropolitan areas in the country. Consequently, land value in these urban areas is the highest in Morocco. Out of the six urban areas included in this class, Agadir, Casablanca, Marrakech, and Tangier showed a positive trend towards sustainability according to SDG indicator 11.3.1.
In the context of densely urbanized areas, characterized by high levels of prior development—such as those in this category—horizontal expansion manifests as the outward extension of urban boundaries, meaning the consumption of additional land horizontally. This pattern of expansion frequently encounters physical constraints, ranging from natural geographical features such as the Atlantic Ocean limiting the expansion to the west of the capital Rabat, Casablanca and Agadir, and the Mediterranean Sea, limiting that to the northern side of the urban area of Tangier. Consequently, land within the urban area limits becomes increasingly scarce and costly. In response to these challenges, verticalization emerges as a natural response to mitigate the limitations and cost associated with horizontal expansion. However, while verticalization offers the potential for increased housing capacity, it often comes at the expense of quality of life due to densification and overcrowding. This can lead to various problems such as increased traffic congestion, reduced green spaces, and decreased privacy, challenging the overall livability of these metropolitan urban settings. Simultaneously, it encourages people to explore commuter urban areas for more affordable housing options. The SDG 11.3.1 scores obtained for Casablanca, Tangier, Marrakech, and Agadir may be significantly influenced by the dynamic interplay of these factors.
In this context, the focus of SDG 11.3.1 on urban land consumption and population growth fails to adequately address the critical issue of overcrowding within growing urban areas, thereby overlooking a significant aspect of sustainable urban development.
When evaluating urban sustainability in Rabat, the capital city, we observe significant disparities compared to the previous four urban areas. These variations are remarkable, even though the capital shares common attributes of being densely populated and highly developed. These characteristics lead to an upward trend in land costs, which, in turn, indirectly influences the promotion of more vertical urbanization. Rabat achieved an SDG 11.3.1 score of 1.74, surpassing the neutral value of one. This outcome can be partially attributed to the decision regarding the definition of its UZI. To mitigate the peculiar effects of negative population growth, the UZI encompassed not only Rabat but also the census units from the commuter urban areas of Sale and Skhirate-Temara (Figure 3). Additionally, the presence of numerous governmental buildings in the capital including the parliament, ministerial headquarters, embassies, and consulates, introduces a bias into the indicator, because the relationship between population growth and urban land consumption becomes disjointed, as individuals employed in these institutions or benefiting from their services may often be censed elsewhere. Expanding on this concern, it is worth noting that a substantial portion of academic buildings in Rabat faces a similar situation. Many of these facilities are not solely used by residents of Rabat but also by scholars commuting from Sale and Skhirate-Temara. Sale, for instance, has only one public university, specializing in law, economics, and social sciences. In contrast, Skhirate-Temara lacks any public universities, forcing a large number of students pursuing various scientific disciplines to commute to institutions located in Rabat. These factors collectively contribute to the complexity of assessing urban sustainability and underscore the importance of carefully defining the metrics that inform such evaluations.
The urban area of Fes stands out in this category, exhibiting a relatively high SDG 11.3.1 indicator score of 3.28, which indicates a departure from its initial sustainability. Several factors contributed to this shift in Fes’s development. Notably, rapid population growth drives increased housing demand, land consumption, and infrastructure pressures within the urban area. Additionally, limited appealing commuter options, mainly Meknes and Sefrou, influenced residents to settle within Fes itself. Confronted with challenges like the swift urbanization, the expensiveness of access to affordable formal housing, and economic constraints, residents and migrants from neighboring rural areas resorted to informal housing solutions. This led to the proliferation of a number of slums, including Ain Smen and Dhar El Mehraz, which were later on taken down and projected to be subject for replacement by formal urban development infrastructure.
Overall, it can be inferred that land tenure in these urban areas, which are considered capitals in their respective administrative regions, made vertical urban expansion choice more preferrable because it provides affordable housing, leading indirectly to patterns of urban sustainability as defined by SDG 11.3.1.
The second category comprises eight urban areas: Meknes, Oujda, Kenitra, Sale, Tetouan, Nador, Safi, and Mohammedia. These urban areas had relatively lower land costs compared to those within the first category and were characterized by limited tourism and a relatively modest level of economic activity. Except for Oujda and Safi, most of the urban areas in this category primarily functioned as commuter towns, offering affordable housing within reasonable distances of metropolitan centers. Interestingly, seven out of the eight urban areas in this category displayed a concerning trend toward unsustainability with only Mohammedia’s urban area managing an SDG 11.3.1 score lower than unity. Notably, Sale and Safi stood out with exceptionally high SDG 11.3.1 scores, recording values of 9.01 and 10.02, respectively, indicating a significant departure from initial sustainability levels. The previous section delved into the factors underlying the remarkable score of the urban area of Safi.
In parallel, the urban area of Sale, while already shouldering the responsibility of serving as the primary commuter city for the Moroccan capital, Rabat, boasts a diverse array of thriving manufacturing sectors. These encompass pharmaceuticals, textiles, food processing, chemicals, construction materials, and the preservation of traditional handicrafts. The ever-growing weight of the population influx attracted by the latter elements has contributed to the city’s extreme SDG 11.3.1.
Mohammedia, however, stood as an exception in this second category with an SDG indicator of 0.41. This is most likely due to the economic opportunities present in Casablanca and the rise in its land value. The relatively affordable housing in Mohammedia and its proximity to Casablanca led to fast occupation of its available land, which is expected to increase in the near future. This will lead to a horizontal urban expansion, expressed by an increasing indicator value. At some point, the land will reach an unaffordable value and vertical urban expansion becomes preferable. New other urban agglomerations may form if the original drivers of urban expansion continue to prevail.
The final category comprised the remaining 13 urban areas: Guelmim, Berkane, Tinghir, Tantan, Khouribga, Es Semara, Dakhla, Laayoune, Beni Mellal, Ouarzazate, Zagora, Taza, and Inezgane. In this category, land value has lower price tags compared to the previous two categories, and their industrial sectors are not robust. The population of these urban areas did not exceed 250,000 people ca 2014, with only one exception of Inezgane, which had a population of 514,630 [22]. Out of these 13 urban areas, 11 showed a trend of moving away from sustainability. Only Berkane and Laayoune had a SDG 11.3.1 score below neutrality. The pattern of drifting away from urban sustainability in this final category can be attributed to the combined effect of affordable land value and the cultural preference of residents from smaller towns to live on relatively larger single-family houses and farm-like dwellings rather than in multi-family residential buildings that are prevailing in metropolitan areas.

3.3. SDG Indicator 11.3.1 and Climate

Morocco’s favorable geographical location in North-West Africa grants it a diverse range of climates, spanning from the humid Mediterranean climate in the north to the arid Saharan climate in the south. This diversity highlights how Morocco’s urban areas experience a spectrum of climate patterns.
The arid Saharan climate prevails in six urban areas—Dakhla, Zagora, Laayoune, Es Semara, Ouarzazate, and Tinghir—where the winter nights are cold, but the days are hot, and with summer daily average temperatures around 35 °C. Five out of the six urban areas had an SDG Indicator 11.3.1 higher than unity, at the only exception of Layounne, scoring lower than one. This describes the somewhat general tendency of the urban population in the arid south to use more land per capita than in the north and is intrinsically linked to their lifestyle and culture. The economy in these areas is based mainly on agriculture, livestock and fisheries, but is currently moving towards tourism infrastructure investments and small to medium industries. These recent developments have also created a situation where urban development seems to trend away from sustainability. This observation was further substantiated by a separate study that evaluated the same sustainability indicator in Algeria, the neighboring country to the east of Morocco. The study focused on five major wilayas in Algeria, which included the urban area of Ghardaia, located in the northern region of the arid Sahara Desert. The findings of their research indicated that out of the twelve communes comprising the Wilaya of Ghardaia, seven showed a discernible departure from sustainability [26].
The semi-arid climate is predominant in twelve urban areas, including Agadir, Marrakech, and Berkane, having an SDG 11.3.1 score lower than unity, whereas the two urban areas of Inezgane and TanTan did not drift far away from sustainability as their indicators rose relatively slightly over the value of one, scoring 1.46 and 1.91, respectively. On the other hand, the urban areas of Guelmim, Beni Mellal, Fes, Khouribga, and Meknes had an SDG 11.3.1 score well above the value of one. The urban area of Safi had the highest indicator 11.3.1, score of all the urban areas.
Finally, the last category falls under a sub-humid to humid climate and had relatively lower SDG 11.3.1 scores when compared to other urban areas under different types of climate. Out of the eight urban areas in this category, the three urban areas of Casablanca, Mohammedia, and Tangier had SDG 11.3.1 scores lower than one. Moreover, the urban areas of Taza, Rabat, and Nador had scores ranging between one and two, implying a slight departure from sustainability. The urban area of Tetouan and Kenitra have an urban development that is deemed unsustainable with indicator values of 2.85 and 2.96, respectively. Sale’s urban area appeared to have the most unsustainable development of this category with an SDG indicator of 9.01. This value is partly due to the fact that Sale is a commuter to the Kingdom’s capital Rabat, and where during the studied decade a large fraction of the people working in Rabat have moved to live in Sale. As noted in [26], the formulation of SDG 11.3.1 does not capture land consumption in capital cities which host government and diplomatic’ buildings, which do not occupy a large fraction, but whose population is not censed in the capital. This study extends this concept to urban areas considered as commuters to a capital city and assesses the sustainable development indicator over an urban zone of interest, as defined in Section 2.2.

3.4. Relation between Population Growth and Urban Expansion

This analysis shows that urban land consumption is not driven uniquely and necessarily by population growth. Other factors such as laws and regulations, or industrial, touristic, and agricultural developments, may have an equal, or even larger, footprint on urban land consumption. No discernible direct correlation between urban land consumption and population growth was clearly established. Our analysis indicates that urban land consumption growth rate and population growth rate may, in some cases, go hand in hand. However, in other cases, the two variables can develop in different ways. For example, during the study period, the urban expansion in Safi and Ouarzazate was 9.55 km2 and 10.36 km2, respectively, with comparable population growth of 23,758 people in Safi and 23,764 people in Ouarzazate, respectively. This is not always the case; for example, the urban areas of Kenitra and Sale had comparable land expansions of 14.3 km2 and 13.66 km2, respectively; however, while Kenitra’s urban area recorded a population increase of 84,514 people, Sale’s urban population increased only by 41,235 people, about half that of Kenitra. This lack of direct correlation may be due to a number of factors, including geographic constraints, land tenure and regulation, and cultural preferences, such as the preference for horizontal versus vertical expansion observed in relatively smaller urban agglomerations [8]. Government buildings, along with industrial, touristic, agricultural, or other infrastructures not necessarily associated with population, need to be considered when assessing urban development sustainability. Adding to that, more importance must be given to consistent, regionally adapted regulation of land use in urban areas must [8].

3.5. SDG 11.3.1 Limitations

The definition of SDG Indicator 11.3.1 appears to be based on the concept of urban land consumption being primarily driven by population growth, with a suggestion that sustainability in urban development is closely tied to vertical urban expansion, as overcrowding is not considered. In simpler terms, if a city’s growth occurs more upwards than outwards, the indicator implies a positive trend towards sustainability.
However, this perspective neglects a critical factor—overcrowding—which can substantially diminish the quality of life in vertically expanding urban areas, if not associated with social, environmental, and economic development. Furthermore, overcrowding can exacerbate population density, leading to soaring real estate prices in central urban zones, which creates population hotspots that place intense pressure on public services and green spaces, significantly affecting the three pillars—social, environmental, and economic—of sustainability. Therefore, SDG Indicator 11.3.1 falls short in representing these critical aspects of sustainability.
The SDG 11.3.1 also raises questions about what level of sustainability is achieved, particularly when the initial sustainability status of the urban area is not known. Moreover, the indicator assumes a value of one as a neutral point, signifying that development remains sustainable. However, this assumption is not substantiated, as a score of one merely indicates that sustainability has remained constant from an initial state. This is problematic because the initial condition may have been highly unsustainable to begin with.
The indicator also faces several technical limitations. It is undefined when population remains constant over a study period and uninterpretable when there is a decrease in either population or urban land consumption. Moreover, the indicator registers zero if land consumption remains constant during the measurement period, rendering the result uninterpretable.
Furthermore, the bias issue that emerges in the application of SDG 11.3.1 assessments for capital cities, as previously elaborated, underscores a broader challenge in the indicator’s implementation. This capital city bias is not unique to Rabat or Algiers, and it can be extended to many other capital cities worldwide. Capital cities often exhibit unique characteristics, which underscores the need for a more nuanced and context-aware approach when evaluating their urban development sustainability.
In assessing urban sustainability, it is crucial to consider the distinction between relative and absolute measures. Relative indicators, such as those commonly used in assessing urban sustainability, compare environmental impacts across different entities or time periods relative to a baseline or reference point [27]. While these indicators offer insights into trends and comparisons, they may obscure the true level of sustainability in its intrinsic form. Conversely, absolute indicators provide a direct assessment of sustainability without reference to external benchmarks, offering a clearer understanding of the actual environmental impacts [27]. SDG 11.3.1 relies on relative measures, comparing the rate of land consumption to population growth. Adopting an absolute indicator for urban sustainability would enable a more precise evaluation of environmental impacts and better inform decision making to address sustainability challenges effectively.
Considering these limitations, it is imperative to advocate for a new and improved indicator that offers a more comprehensive and inclusive evaluation of urban development sustainability. This new indicator should encompass a broader range of factors that SDG 11.3.1 overlooked. While the current indicator solely considers land consumption and population growth, the proposed metric should include additional dimensions, such as the economic one overlooked by SDG 11.3.1, and include more social and environmental factors, while simultaneously encompassing culture and local identities of cities as they stand firm as integral components of the remedy to the challenges of urbanization [28]. Additionally, it should adhere to internationally defined standards for urban development sustainability. Such a holistic approach is essential for providing policy leaders and decision makers with a more accurate and insightful assessment of urban development plans and their effectiveness.
Attempts were made to capture the multidimensional nature in assessing sustainability. For instance, in a study investigating the sustainability of 31 Chinese provincial-level administrative regions, a composite sustainability indicator (CSI) was employed, aggregating thirty indicators spanning economic, social, and environmental dimensions [29]. Another contribution proposed a set of composite indices that cover various dimensions of sustainable development (environment and natural resources, energy transition, sustainable mobility, economic dynamism, social cohesion and solidarity, and governance and citizenship) [30]. While it provided an evaluation framework for empirically comparing the sustainability performance of 96 metropolitan French departments, the study acknowledged several limitations. For instance, the complexity involved in designing and implementing composite indices means that careful interpretation of the results must be carried out. Additionally, while the indices met the primary requirements of a well-defined composite index, it was explained how the inherent choices in the methodology implemented (variables selection, aggregation methods, and normalization) significantly influence the outcomes [30].

4. Concluding Remarks

This paper conducted a comprehensive review of four studies that evaluated urban sustainability in a total of 27 urban areas within the Kingdom of Morocco. These assessments were based on the integration of Landsat satellite imagery and national demographic census data, utilizing the Sustainable Development Goal (SDG) indicator 11.3.1. The primary objective was to explore and analyze how this indicator responded to various parameters, including land value, climate, and geographic location. The results of this review have yielded several noteworthy insights.
The findings of the four studies highlighted the dynamic nature of urban sustainability in Morocco. They demonstrated that urban areas with differing land characteristics, climates, and geographic locations exhibited varying degrees of progress toward achieving their sustainability development goals.
Generally, it was found that higher land tenure in metropolitan urban areas makes vertical urban expansion more preferable as it allows for the increases in housing capacity while minimizing the need for encroachment on new natural lands. This, in turn, contributes indirectly to the promotion of urban sustainability as outlined in SDG 11.3.1. According to the same indicator, a pattern of drifting away from urban sustainability was observed as land value drops, which could be attributed to the joint influence of market affordability and the cultural inclination of citizens from smaller towns to opt for relatively larger homes over multi-family residential buildings, which are more common in metropolitan areas. Contrastingly, the impact of climate on urban sustainability appeared less pronounced, with urban areas experiencing different climates exhibiting diverse patterns of urban sustainability. This underscores the importance of considering local contextual factors when assessing urban sustainability.
Furthermore, it is essential to acknowledge the limitations encountered in utilizing SDG indicator 11.3.1. While it provides valuable insights into urban development, its scope does not capture the full complexity of sustainable urbanization. These limitations have prompted us to advocate for the introduction of a new sustainability indicator that can assess sustainability in a more intrinsic, inclusive, and multidimensional manner. A more comprehensive indicator would facilitate more informed decision making for future urban development initiatives in Morocco, and the rest of the world.
This contribution addresses the challenges associated with utilizing SDG 11.3.1, laying a foundation for future studies and contributions aiming to make use of the aforementioned indicator in other case studies. Despite its limitations, it was found that the indicator provides valuable insights into trends and comparisons at the urban area level, and should offer assistance to stakeholders, urban planners, and decision makers in their quest for a sustainable development.

Author Contributions

Conceptualization, L.B. and K.J.T.; methodology, L.B., M.A.L. and N.E.-D.; software, L.B., M.A.L. and N.E.-D.; validation, L.B., M.A.L., N.E.-D., S.L., H.B., M.M. and M.Y.K.; formal analysis, L.B., M.A.L., N.E.-D. and M.M.; investigation, L.B.; resources, L.B. and K.J.T.; data curation, L.B., M.A.L. and J.N.; writing—original draft preparation, L.B., M.A.L. and N.E.-D.; writing—review and editing, L.B., M.A.L., N.E.-D., S.L., H.B., M.M. and M.Y.K.; visualization, J.N. and M.A.L.; supervision, L.B.; project administration, L.B.; funding acquisition, L.B. and K.J.T. All authors have read and agreed to the published version of the manuscript.

Funding

This research received no external funding.

Data Availability Statement

Derived data may be obtained upon request from the lead author.

Conflicts of Interest

Author Joseph Nigro was employed by the company Science Systems and Applications. The remaining authors declare that the research was conducted in the absence of any commercial or financial relationships that could be construed as a potential conflict of interest.

References

  1. Haut Commissariat au Plan (HCP). Recensement General de La Population et de l’Habitat (RPGH) 2014, Statistical Data on Urbanization. Available online: http://rgphentableaux.hcp.ma/ (accessed on 9 July 2023).
  2. Luan, W.; Li, X. Rapid Urbanization and Its Driving Mechanism in the Pan-Third Pole Region. Sci. Total Environ. 2021, 750, 141270. [Google Scholar] [CrossRef] [PubMed]
  3. United Nations General Assembly. Transforming Our World: The 2030 Agenda for Sustainable Development. 2015. Available online: https://undocs.org/en/A/RES/70/1 (accessed on 10 July 2023).
  4. Ministère délégué auprès du Ministre de l’Energie, des Mines, de l’Eau et de l’Environnement, chargé de l’Environnement. Framework Law N° 99-12 on the National Charter for the Environment and Sustainable Development. 2014. Available online: http://dmp.uae.ma/textes_juridiques/generaux/loi_cadre_99_12.pdf (accessed on 2 July 2023).
  5. Ministère de la transition énergétique et du développement durable. Stratégie Nationale de Développement Durable (SNDD). 2017. Available online: https://www.environnement.gov.ma/fr/strategies-et-programmes/sndd?showall=1&limitstart (accessed on 2 July 2023).
  6. United Nations Habitat. Sustainable Development Goal 11+ Make Cities and Human Settlements Inclusive, Safe, Resilient and Sustainable: A Guide to Assist National and Local Governments to Monitor and Report on SDG Goal 11+ Indicators. 2018. Available online: https://smartnet.niua.org/sites/default/files/resources/sdg_goal_11_monitoring_framework.pdf (accessed on 3 July 2023).
  7. Wang, Y.; Huang, C.; Feng, Y.; Zhao, M.; Gu, J. Using Earth Observation for Monitoring SDG 11.3.1-Ratio of Land Consumption Rate to Population Growth Rate in Mainland China. Remote Sens. 2020, 12, 357. [Google Scholar] [CrossRef]
  8. Bounoua, L.; Fathi, N.; El Berkaoui, M.; El Ghazouani, L.; Messouli, M. Assessment of Sustainability Development in Urban Areas of Morocco. Urban Sci. 2020, 4, 18. [Google Scholar] [CrossRef]
  9. Zakaria, A. Étude Comparative de La Durabilité Du Développement Urbain Dans Les Villes Du Maroc: Cas de Laayoune et de Tanger. Master’s Thesis, Cadi Ayad University, Faculty of Sciences Semlalia, Marrakech, Morocco, 2022. [Google Scholar]
  10. Hanane, B. Estimation et Comparaison de l’indicateur de Développement Durable ODD 11.3.1 Au Maroc: Cas Des Villes de Marrakech et d’Agadir. Master’s Thesis, Cadi Ayad University, Faculty of Sciences Semlalia, Marrakech, Morocco, 2022. [Google Scholar]
  11. Amine, L.M. Assessing and Comparing Sustainable Urban Development in Moroccan Cities, a Review. Master’s Thesis, Cadi Ayad University, Faculty of Sciences Semlalia, Marrakech, Morocco, 2023. [Google Scholar]
  12. Ioppolo, G.; Cucurachi, S.; Salomone, R.; Saija, G.; Shi, L. Sustainable Local Development and Environmental Governance: A Strategic Planning Experience. Sustainability 2016, 8, 180. [Google Scholar] [CrossRef]
  13. Direction Générale des Collectivités Territoriales (DGCT). Decree No. 2-15-40 of February 20, 2015 Defining the Number of Regions, Their Names, Their Capitals and the Prefectures and Provinces That Make Them Up. 2015. Available online: https://www.collectivites-territoriales.gov.ma/fr/node/2677 (accessed on 4 July 2023).
  14. Openshaw, S. The Modifiable Areal Unit Problem; Concepts and Techniques in Modern Geography; Geo: Norwich, UK, 1984. [Google Scholar]
  15. Dijkstra, L.; Galic, A.; Brandmüller, T. Measuring Sustainable Development Goals in Cities, Towns and Rural Areas: The New Degree of Urbanisation1. Stat. J. IAOS 2022, 38, 549–559. [Google Scholar] [CrossRef]
  16. Bhaduri, B.; Bright, E.; Coleman, P.; Dobson, J. LandScan: Locating People Is What Matters. Geoinfomatics 2002, 5, 34–37. [Google Scholar]
  17. Balk, D.L.; Deichmann, U.; Yetman, G.; Pozzi, F.; Hay, S.I.; Nelson, A. Determining Global Population Distribution: Methods, Applications and Data. In Advances in Parasitology; Elsevier: Amsterdam, The Netherlands, 2006; Volume 62, pp. 119–156. [Google Scholar] [CrossRef]
  18. Tatem, A.J.; Noor, A.M.; Von Hagen, C.; Di Gregorio, A.; Hay, S.I. High Resolution Population Maps for Low Income Nations: Combining Land Cover and Census in East Africa. PLoS ONE 2007, 2, e1298. [Google Scholar] [CrossRef] [PubMed]
  19. Wu, C.; Murray, A.T. Estimating Impervious Surface Distribution by Spectral Mixture Analysis. Remote Sens. Environ. 2003, 84, 493–505. [Google Scholar] [CrossRef]
  20. Lu, D.; Weng, Q.; Li, G. Residential Population Estimation Using a Remote Sensing Derived Impervious Surface Approach. Int. J. Remote Sens. 2006, 27, 3553–3570. [Google Scholar] [CrossRef]
  21. Haut Commissariat au Plan (HCP). Recensement General de La Population et de l’Habitat (RPGH) 2004. Available online: https://applications-web.hcp.ma/hpmc/frmmarocenchiffres.aspx (accessed on 22 June 2023).
  22. Haut Commissariat au Plan (HCP). Recensement General de La Population et de l’Habitat (RPGH) 2014. Available online: http://rgphentableaux.hcp.ma/Default1/ (accessed on 22 June 2023).
  23. Elsheshtawy, Y. (Ed.) The Evolving Arab City: Tradition, Modernity and Urban Development; Planning, History and the Environment Series; Routledge: London, UK, 2011. [Google Scholar]
  24. Keep, M.; Montanari, B.; Greenlee, A.J. Contesting “Inclusive” Development: Reactions to Slum Resettlement as Social Inclusion in Tamesna, Morocco. Cities 2021, 118, 103328. [Google Scholar] [CrossRef]
  25. Rousseau, M. An Ideal Turned into an Ordeal: A Political-Economic Analysis of the Creation of a New Town in the Fringes of Rabat, Morocco. 2016. Available online: https://agritrop.cirad.fr/591049/ (accessed on 26 August 2023).
  26. Bounoua, L.; Bachir, N.; Souidi, H.; Bahi, H.; Lagmiri, S.; Khebiza, M.Y.; Nigro, J.; Thome, K. Sustainable Development in Algeria’s Urban Areas: Population Growth and Land Consumption. Urban Sci. 2023, 7, 29. [Google Scholar] [CrossRef]
  27. Anders, B. Better, but Good Enough? Indicators for Absolute Environmental Sustainability in a Life Cycle Perspective. Ph.D. Thesis, Technical University of Denmark, Kongens Lyngby, Denmark, 2015. Available online: https://findit.dtu.dk/en/catalog/5672ea221fb7ae3b76000091 (accessed on 21 February 2024).
  28. UN-Habitat. The Eleventh Session of the World Urban Forum: Transforming Our Cities for a Better Urban Future. 2023. Available online: https://unhabitat.org/sites/default/files/2023/04/wuf11_report_final_1.pdf (accessed on 21 February 2024).
  29. Yi, P.; Wang, L.; Zhang, D.; Li, W. Sustainability Assessment of Provincial-Level Regions in China Using Composite Sustainable Indicator. Sustainability 2019, 11, 5289. [Google Scholar] [CrossRef]
  30. Bonnet, J.; Coll-Martínez, E.; Renou-Maissant, P. Evaluating Sustainable Development by Composite Index: Evidence from French Departments. Sustainability 2021, 13, 761. [Google Scholar] [CrossRef]
Figure 1. Study area showing the 27 urban areas as well as their administrative regions.
Urbansci 08 00028 g001
Figure 2. Definition of the urban area of Tangier using satellite data. (A) Administrative limits of the urban conurbation (blue) where the grey dots represent the ISA at 30 m × 30 m and the dashed contours represent the limits of census units (communes). (B) Census units with urban surface area greater than 5% and aggregation of the urban surface area from 30 m × 30 m to 1 km × 1 km and delimitation of the urban zones. (C) ISA change from 2003 to 2013.
Urbansci 08 00028 g002
Figure 3. (A) Rabat-Sale-Kenitra region and (B) Rabat’s urban zone of interest.
Urbansci 08 00028 g003
Figure 4. Population and ISA changes in the 27 urban areas.
Urbansci 08 00028 g004
Figure 5. SDG Indicator 11.3.1 scores for the 27 urban areas.
Urbansci 08 00028 g005
Figure 6. Population change and SDG 11.3.1 scores in the 27 urban areas. The red line represents an SDG 11.3.1 neutral value of one.
Urbansci 08 00028 g006
Table 1. Urban surface area, population count, and SDG indicator 11.3.1 for the 27 urban areas.
Time Period of the StudyUrban AreaImpervious Surface Area (Km2)Population Count (Person)SDG Indicator 11.3.1
Initial YearFinal YearInitial YearFinal Year
2004–2014Berkane15.2917.13104,771151,0330.31
Marrakech148.59175.14642,079929,6020.44
Agadir39.7446.22408,958527,8650.59
Laayoune6.938.02189,771229,9790.76
Tangier42.8560.53664,295943,8170.98
Taza10.210.93137,771151,0331.06
Rabat116.49149.171,753,9042,021,9551.74
2003–2013Mohammedia23.7631.23183,269355,6360.41
Casablanca153.9169.972,933,4333,318,6510.8
Dakhla3.027.2650,552101,2111.26
Inezgane19.9129.33394,721514,6301.46
Nador21.9230.11216,736267,9721.5
Tinghir5.987.7635,82641,4791.78
Oujda34.1349.72407,299499,2481.85
Tan Tan4.336.2359,44771,9581.91
Zagora3.134.2634,32939,5452.17
Guelmim6.739.12106,062119,4062.56
Beni Mellal10.8318.73171,424208,7202.78
Tetouan8.8714.07318,364374,2892.85
Kenitra16.8631.16366,953451,4672.96
Fes30.4856.291,765,7422,129,0943.28
Ouarzazate6.7117.0785,111108,8753.79
Es Semara1.95.6842,07455,7253.88
Khouribga12.623.22191,724222,7124.08
Meknes2559.45570,068666,8775.52
Sale22.2835.94756,063797,2989.01
Safi7.6617.21282,374306,13210.02
Table 2. Urban Sustainability Status per SDG 11.3.1 by Moroccan Administrative Regions.
Administrative RegionUrban AreasUrban Areas with SDG 11.3.1 < 1Urban Areas with SDG 11.3.1 > 1
Casablanca-SettatCasablanca MohammediaCasablanca MohammediaNone
Tangier-Tetouan-Al HoceimaTangier TetouanTangierTetouan
Marrakech-SafiMarrakech SafiMarrakechSafi
Laayoune-Sakia El HamraLaayoune Es-SemaraLaayouneEs-Semara
Souss-MassaAgadir InezganeAgadirInezgane
L’OrientalOujda Nador BerkaneBerkaneOujda Nador
Dakhla-Oued Eddahab DakhlaNoneDakhla
Guelmim-Oued NounGuelmim Tan TanNoneGuelmim Tan Tan
Beni Mellal-KhenifraBeni Mellal KhouribgaNoneBeni Mellal Khouribga
Fes-MeknesFes Meknes TazaNoneFes Meknes Taza
Rabat-Sale-KenitraRabat Sale KenitraNoneRabat Sale Kenitra
Draa-TafilaletTinghir Zagora OuarzazateNoneTinghir Zagora Ouarzazate
Disclaimer/Publisher’s Note: The statements, opinions and data contained in all publications are solely those of the individual author(s) and contributor(s) and not of MDPI and/or the editor(s). MDPI and/or the editor(s) disclaim responsibility for any injury to people or property resulting from any ideas, methods, instructions or products referred to in the content.

