
Differential Urban Heat Vulnerability: The Tale of Three Alabama Cities


1
Department of Agricultural & Environmental Sciences, Tuskegee University, Tuskegee, AL 36088, USA
2
Mojave Water Agency, Apple Valley, CA 92307, USA
*
Author to whom correspondence should be addressed.
Urban Sci. 2023, 7(4), 121; https://doi.org/10.3390/urbansci7040121
Submission received: 20 October 2023
/
Revised: 28 November 2023
/
Accepted: 29 November 2023
/
Published: 3 December 2023
Abstract
:Urban heat vulnerability varies within and across cities, necessitating detailed studies to understand diverse populations’ specific vulnerabilities. This research assessed urban heat vulnerability at block group level in three Alabama cities: Birmingham, Montgomery, and Auburn-Opelika. The vulnerability index combines exposure, sensitivity, and adaptive capacity subindices, incorporating Landsat 8 satellite-derived Land Surface Temperature (LST), demographic, and socioeconomic data using factor analysis and geospatial techniques. Results showed strong positive correlations between LST and impervious surfaces in Auburn-Opelika and Montgomery, with a moderate correlation in Birmingham. An inverse correlation between LST and Normalized Difference Vegetation Index was observed in all cities. High LST correlated with high population density, varying across cities. Birmingham and Montgomery’s central areas exhibited the highest heat exposure, influenced by imperviousness, population density, and socioeconomic factors. Auburn-Opelika had limited high heat exposure block groups, and high sensitivity did not always align with exposure. Correlations and cluster analysis were used to dissect the heat vulnerability index, revealing variations in contributing factors within and across cities. This study underscores the complex interplay of physical, social, and economic factors in urban heat vulnerability and emphasizes the need for location-specific research. Local governance, community engagement, and tailored interventions are crucial for addressing unique vulnerabilities in each urban context.
1. Introduction
Urbanization has been increasing steadily over the past decades. According to the World Bank, the world’s urban population increased from 33.7% of the total population to 56.6% during the 1960–2020 period. In the United States, the number of people living in cities increased from 70% to 82.7% during the same period. By 2050, 68% of the world’s population is expected to live in urban areas [1]. Although urban centers cover a relatively small area, urbanization constitutes one of the most significant changes of land surface properties. Urbanization significantly impacts the environment in many ways, including a substantial decrease in evapotranspiration and local atmospheric moisture content due to the reduction of vegetative cover; environmental pollution and degradation of air quality caused by industrial and domestic activities; a heavy contribution to the carbon footprint; modification of soil moisture distribution and groundwater availability caused by the expansion of impervious surfaces and subsequent changes in runoff patterns; changes in surface energy partitioning, heat distribution, and wind flow patterns caused by the lay-out of urban structures; and changes in rainfall patterns over urban areas [2,3,4,5,6,7,8,9,10].
One of the most notable effects of urbanization is the emergence of urban heat islands (UHI). In the urbanization process, natural landscapes such as various types of vegetation are replaced with hard, dry, and impervious materials with more heat-absorbing and heat-emitting capacity (e.g., parking lots, buildings/roofs, roads, sidewalks). As a result, urban areas constitute heat islands, since they are much warmer than surrounding rural areas. Both daytime and nighttime temperatures are higher in urban areas, with differences of up to 4 °C during the day, and 2 °C at night [8]; in urban areas of the United States, the heat island effect causes daytime temperatures to be approximately 0.5–4 °C warmer than temperatures in surrounding regions, while nighttime temperatures are about 2–5 °F higher [11]. Other factors contribute to UHIs: human activities generate substantial amounts of heat (anthropogenic heat release) from running engines, air conditioning systems, industrial units, and various other domestic sources [8,12,13,14,15,16]. Recent studies have shown that the drop in human activities during the COVID-19 lockdown has resulted in a significant reduction in UHI intensity [17,18,19,20,21,22]. Urban geometry, street design, size and shape of buildings can modify wind flow, reduce natural ventilation, and influence the way urban heat is released [23,24,25,26,27,28,29,30]. Land cover types constitute another important factor: UHI intensity partly depends on the amount of greenery and the ability of urban surfaces to reflect radiation [31,32,33,34]. Prevailing climate conditions also play an important role in the intensity of UHIs. Depending on the type of climate and geographical settings of urban areas, various levels of UHI intensity have been found [8,35,36,37,38,39,40,41]; heatwaves occurring at a regional scale often amplify UHIs [42,43,44,45,46,47,48].
UHIs can have a significant impact on both the environment and people’s livelihoods. Urban overheating increases energy demand and causes a higher consumption of electricity, which results in increased emission of greenhouse gases from power plants and pollutants such as particulate matter and ground level ozone, which is highly toxic [49,50,51,52,53,54]. UHIs also result in impaired water quality: warm and polluted stormwater runoff from urban impervious materials can cause substantial increase in nearby water bodies’ temperature and harm aquatic life [55,56,57,58].
Urban heat constitutes a major source of health risk for city dwellers. Exposure to heat is associated with a range of adverse health outcomes including dehydration, heat stroke, heat exhaustion, heat cramps, and the exacerbation of comorbid conditions such as various cardiovascular, cardiopulmonary, and cerebrovascular diseases, diabetes, mental and behavioral disorders, and diseases of the digestive system [14,59,60,61,62,63]. The amplification of UHI during periods of heat wave events exacerbates adverse health impacts: surges in demands for emergency and healthcare services (e.g., ambulance calls, hospitalization), increased morbidity, and heat-related deaths [46,64,65,66,67]. This situation is aggravated by the fact that intense urban heat causes increase in concentrations of harmful pollutants, including various types of particulate matter, greenhouse gases (increased demand of electricity generated by fossil fuel power plants), and ground-level ozone (smog), which is strongly related to cardiovascular and respiratory diseases and urban heat-related deaths [49,50,68,69].
UHI adverse impacts affect urban populations differently, and the associated risk is unevenly distributed. Many studies have shown that demographic and socioeconomic factors, which vary considerably between neighborhoods in urban areas, influence the risk of exposure and the capacity to cope with UHI impacts [52,70,71,72,73,74,75]. Older people are among those most likely to be affected by UHI adverse effects and to experience disproportionate risks of mortality related to extreme heat [11,45,72,76,77,78,79,80]. Higher UHI intensity generally occurs over inner cities, where poorer populations tend to be concentrated, leading to disproportionate adverse impacts [70,81,82,83,84]. Such areas are heavily populated and have low vegetation cover; hence, they are much more exposed to urban overheating, in contrast with more recent and affluent neighborhoods located in suburban areas [33,72]. Low-income residents are often unable to access public support systems needed to mitigate UHI adverse effects. In general, they live in the poorest urban zones with low thermal quality houses often lacking air conditioning [82,84,85,86]. Low-income households equipped with air conditioning are found to consume more cooling energy than average due to higher urban heat exposure and poor thermal performance [52,87,88,89,90,91,92]. Other factors further exacerbate the differential vulnerability to urban heat. Low income is often associated with a low level of human capital (low level of education, limited knowledge and expertise in the face of natural hazards), which limits the ability of such populations to (i) effectively communicate, (ii) have a sound understanding of adaptive measures, and (iii) appropriately respond to warnings [83,93,94,95]. The lack of strong social support further contributes to the differential vulnerability to urban heat; studies have found that socially isolated people are the most vulnerable [70,94,95,96,97,98,99].
Although UHI impacts affect urban areas regardless of their size [100,101], most of the studies have focused on major individual cities. As a result, there exists a notable re-search gap regarding various aspects of UHI in mid-sized and small-sized cities [11,14,75]. Moreover, the case of each city is unique, given the varying regional geographic settings, microclimates, heterogeneity and diversity of local urban populations, and the relevance of the socioeconomic drivers of vulnerability to urban heat at a local scale [8,11,17,75,100]. Therefore, although UHIs generally exhibit fairly uniform physical features across urban areas, their impacts may vary significantly, since each city may experience specific types of interaction between environmental and socioeconomic variables, face specific challenges, and require policies that are shaped based on the local context [11,100]. In this study, we examined vulnerability to urban heat for four cities in Alabama: two of the largest cities in the state, namely Birmingham and Montgomery, and two smaller cities which form a conurbation: Auburn and Opelika. Surrounding suburban neighborhoods were included in the analysis. We first extracted the land surface temperature (LST) for each of the cities using Landsat satellite images. Unlike many studies that relied on satellite images capturing surface temperature for a single day to calculate LST, our approach involved utilizing a collection of satellite images spanning several years for each city. We then developed a UHI vulnerability index at block group level by aggregating environmental and socioeconomic variables into three determinants: exposure, sensitivity, and adaptive capacity. The resulting scores were mapped using Geographic Information Systems (GIS) tools. Lastly, we decomposed the resulting index to create for each specific urban area a detailed profile that can serve as the basis for designing policies that consider the local context and effectively address specific challenges.
2. Materials and Methods
2.1. The Cities
Figure 1 shows the location of the four cities involved in this study, along with some of their demographic and socioeconomic characteristics.
Birmingham is located in a hilly area of north-central Alabama. The city’s climate is characterized by mild winters and hot summers: the mean temperature is 6.6 °C in January and 27.3 °C in July [101]. According to the 2020 US Census, with 200,733 people, Birmingham is the second largest city in Alabama, after being recently overtaken by Huntsville. During the past decade, the city has experienced a sharp decline in population (−5.4%). Birmingham is densely populated, with a racial makeup characterized by a strong proportion of minority population, and exhibits, on average, a relatively low household income.
Montgomery is located in south-central Alabama, in a region with gentle slopes and modest variations in topography. Winters are mild and short, but the summer season is much longer and muggy because of the combination of warm temperatures and high humidity. With a population of 200,603 and a density of 1289 people per square mile, it is the third most populous city in the state. However, Montgomery’s population has declined during the 2010–2020 period (−2.5%). The city lies within the southern Black Belt and is mainly populated by minority groups which currently constitute 70% of the population (US Census, 2020).
Auburn and Opelika constitute a metropolitan area located in east-central Alabama. The conurbation lies in a region with diverse topography including rugged foothills of the southern tip of the Appalachian Mountain, rolling plains and sandy coastal plains [102]. The two cities enjoy a short and mild winter, with an average temperature of 6.9 °C in January, which is the coldest month. Summers are hot and muggy, with an average temperature of 26.7 °C in July. According to the 2020 US Census, the two cities have a combined population of 107,138 people. The population of the metropolitan area has considerably increased during the past decade, with the largest gains occurring in Auburn (+3%). Both Auburn and Opelika exhibit a much lower proportion of minority population than Birmingham and Montgomery (31% and 48%, respectively).
2.2. Vulnerability Framework
In this study, vulnerability is considered as a function of three determinants: exposure, sensitivity, and adaptive capacity. This framework, presented by the Intergovernmental Panel on Climate Change in its third Assessment Report [103], is widely used, as attested by many studies [104,105,106,107,108,109,110]. Exposure and sensitivity represent the potential impacts of a hazard (here, urban heat), while adaptive capacity denotes the ability of a system to use its resources and institutions to adapt, mitigate, and cope with impacts. We define vulnerability as follows:
Vulnerability = (Exposure + Sensitivity) − Adaptive Capacity
Typically, a system is vulnerable when it exhibits high values of exposure and sensitivity and low values of adaptive capacity.
2.3. Indicators
Regarding the environmental data, land surface temperatures were derived from Landsat 8 images obtained from the US Geological Survey (USGS). Urban imperviousness data were obtained from the 2019 National Land Cover Database (NLCD) and represent urban impervious surfaces as a percentage of developed surface over every 30 m pixel [111,112]. Urban canopies were derived from the NLCD 2019 Land Cover [111,112,113,114,115]. The demographic and socioeconomic data from the US Census bureau were obtained from the Environmental Systems Research Institute (2021 ESRI Demographics and 2016–2020 American Community Survey—ACS). Each year, ESRI updates the census data and converts it to standard geographies used by the US Census Bureau; the resulting datasets are stored in geodatabase format ready to use for mapping and spatial analysis; ESRI also provides data enrichment by deriving new variables from the original census data, for example, ESRI’s Wealth Index used in this study is derived from various indicators of affluence that include average household income and average net worth [116].
The 24 indicators used in this vulnerability assessment are presented in Table 1, along with related data sources and brief definitions. Although most of the indicators are well-established variables that have already been used in many studies dealing with climatic hazards and social vulnerability, we included new variables that are relevant to urban heat impacts, such as the number of old and new houses and the number of those aged 16+ who walked to the workplace. Overall, high values of indicators denote higher exposure, sensitivity, and adaptive capacity, except for the mean distance to recreational centers and parks; since shorter distances mean higher adaptive capacity, the values of this variable were inverted during the normalization process.
2.4. Data Processing
Our study employed for each city a collection of ten images from Landsat 8 satellite data. These images were obtained over a period of nine years, ranging from 2013 to 2021 (Table 2). All images were acquired during summer months. Landsat 8 bands 4 and 5 and thermal band 10 were used to retrieve LST. All processing steps were completed using various tools in ArcMap, a component of ArcGIS, which is a software developed by the Environmental Systems Research Institute (ESRI). Subsets were created by clipping all satellite images over the urban areas. To eliminate or minimize cloud effect and other residual noise, ArcMap’s Cell Statistics tool was used to create a maximum-value composite (MVC) for band 10 [115,116]. This combination of all bands resulted in a single cloud-free image over the 2013–2021 period. Given that clouds and other atmospheric constituents reduce vegetation index values, MVC was also used after calculating the Normalized Difference Vegetation Index (NDVI) from all pairs of bands 4 and 5 [115].
LST was retrieved from Landsat 8 B and 10 using a well-known algorithm which is detailed in many studies [117,118,119,120,121,122,123]. The steps for retrieving LST are displayed in Figure 2. The dates of acquisition of the satellite images are shown in Table 2, along with the associated metadata used in the algorithm. The main steps are (1) to retrieve from Band 10 (Qcal) the Top of Atmospheric Spectral Radiance (TOA); (2) convert TOA (or L) to Brightness Temperature (BT); (3) compute the Normalized Difference Vegetation Index (NDVI) from Landsat 8 bands 4 and 5; (4) calculate the Proportion of Vegetation (Pv) from NDVI; (5) derive Ground Emissivity (ε) from NDVI and Pv, considering that m and n values are obtained from soil emissivity, vegetation emissivity, and a shape factor whose mean value is 0.55 [124]; and (6) calculate LST using BT and ε, along with λ, which is the wavelength-emitted radiance, and ρ which is computed from the Boltzmann constant, the velocity of light, and the Planck’s constant and has a value of 14,388 [119]. All calculations to retrieve LST from Landsat 8 data were performed using ArcMap’s Raster Calculator. ArcMap’s Zonal Statistics tool was used to compute the average LST for each block group.
Other data processing includes, for each block group, the calculation of percent area covered by trees (urban canopy), the mean distance from parks and recreational centers, and the average percentage of impervious surfaces. The urban canopy layer was obtained by clipping NLCD land use over urban areas, extracting all forest types, and computing for each block group the percent area covered. We used ArcMap’s Euclidean Distance tool to calculate the distance from parks and recreational centers. The output raster indicates the distance of each cell from the source (here, parks and recreational centers). Zonal Statistics was used to compute the mean distance for each block group.
2.5. Statistical Analysis
The statistical analysis steps are shown in Figure 3. The procedures used in this study are described in detail by Fall et al. [108]. Factor analysis (FA) with varimax rotation was used to assign weights to variables for two subindices: sensitivity and adaptive capacity. Before performing FA, the variables were normalized to have an identical range (0, 1) (step 1 of Figure 3, where x’ is the normalized value, and x is an original value). For indicators of the sensitivity subindex, larger (smaller) values indicate high (low) sensitivity. Likewise, larger values of the adaptive capacity subindex denote high adaptive capacity. Since smaller values of the recreational indicator mean shorter distances from parks and other recreational areas, the values were inverted during the normalization process so that small distances were assigned the highest scores. Then, two tests were used to verify whether the data were suited for FA (step 2 of Figure 3). The Kaiser-Meyer-Olkin (KMO) test and Bartlett’s test of sphericity were used to verify whether FA was suitable for the data.
The KMO test measures the sampling adequacy (MSA) of each variable and also returns an overall MSA [123]. KMO values range from 0 to 1, and a value smaller than 0.6 indicates that FA may not be appropriate for the data [124]. The Bartlett’s test of sphericity tests the hypothesis that the individual indicators in the correlation matrix are uncorrelated [125]. Small values of the significance level (p-value less than 0.05) indicate that it is appropriate to use FA. In this study, KMO and Bartlett’s tests for all subindices indicated that it was appropriate to use FA for the data, since all MSA values were larger than 0.6, and all Bartlett’s test p-values were smaller than 0.05, as shown in Table 3.
After running FA with Varimax rotation, the number of factors to retain was determined using parallel analysis (step 3 of Figure 3). The procedure consists in generating random data of the same dimensions as the data being analyzed, extracting eigenvalues from the random data correlation matrix, averaging eigenvalues, comparing the real data set with the parallel random data, and retaining only the factors whose eigenvalues are greater than the eigenvalues from the random data [126,127,128]. The analysis was implemented using the ‘paran’ package in R statistical software [129]. Parallel analysis is recommended as one of the best methods to determine how many factors should be retained [130,131]. Based on the procedure, factors for each determinant were retained as follows: sensitivity: five factors for Birmingham, four for Montgomery, and four for Auburn/Opelika; adaptive capacity: two factors for each urban center. After Varimax rotation, the factor loadings were squared and then scaled to sum to unity using a normalizer (step 4 of Figure 3, where N is the normalizer, and x is an item from the list of numbers to be normalized; next, every number in the list was multiplied by the normalizer, and the resulting total was 1.0). Indicators with the highest loadings (salient loadings) were grouped into intermediate composites, aggregated, and their values were multiplied by corresponding variances. Final weights were obtained by scaling resulting scores to sum to unity.
For each subindex, scores were calculated by multiplying the normalized value of indicators to corresponding final weights, and then summing the resulting values. Finally, to create the final vulnerability index, the scores of the three subindices were combined, as indicated in Equation (1).
2.6. Geospatial Analysis and Visualization
Statistical analysis resulted in tables for each subindex (weighted scores of each indicator and the resulting subindex) and for the overall vulnerability index (scores of subindices and resulting vulnerability index). Each row in the tables represented a block group. The tables were joined to the attribute tables of each city’s shapefile at block group level, using ArcMap. Spatial distribution maps of subindices and vulnerability index were created by classifying subindex and vulnerability index scores using the Quantile method and the graduated colors classification scheme. The spatial distribution of vulnerability index scores was further analyzed with ArcMap using the Cluster and Outlier Analysis tool (Anselin Local Moran’s I) which is a local spatial autocorrelation statistic based on the Moran’s I statistic [132]. The tool outputs z-scores and p-values associated with different types of clusters/outliers: statistically significant cluster of high values (HH), statistically significant cluster of low values (LL), high value surrounded by features with low values (HL), low value surrounded by features with high values (LH), and not statistically significant values (significance based on a 95% confidence level). We further examined the characteristics of block groups with the highest and lowest vulnerability index scores by selecting block groups that fell within HH and LL clusters, averaging their index scores for each indicator, and visualizing the results as spider diagrams. We also overlaid block groups that fall within HH clusters (most vulnerable block groups) with the ones that exhibit the highest exposure to urban heat (LST). The resulting maps showed block groups where high vulnerability and high LST co-occurred, representing areas of high risk that need more attention from urban managers.
3. Results
In this section, we present the results from the statistical analysis and geospatial processing for each subindex and the overall vulnerability index.
3.1. Spatial Patterns of Exposure to Urban Heat
The spatial distribution of LST over the cities is shown in Figure 4. The highest LST values are found in the most urbanized areas of the cities, usually in the central city and adjacent zones, while low LST values are mainly found away from inner cities.
Spatial patterns of LST are generally consistent with the distribution of impervious surfaces and the Normalized Difference Vegetation Index (NDVI, used an indicator of live green vegetation) shown in Figure 5; high exposure to urban heat occur in zones predominantly covered by impervious surfaces which exhibit low NDVI values. Conversely, outlying areas with little to no impervious areas and higher NDVI show much cooler temperatures, indicating that urban canopy constitutes an important mitigating factor. An assessment of the relationship between LST and impervious surfaces pixels shows a strong positive correlation for Auburn-Opelika and Montgomery (0.98 and 0.93, respectively), and a moderate one for Birmingham (0.53). All correlations are significant at the 5% level (p > 0.05). The relationship between LST and NDVI shows a strong inverse correlation for Montgomery (−0.92, p < 0.05), and smaller but statistically significant coefficients values for Birmingham and Auburn-Opelika (−0.42 and −0.38, respectively; 0.16; p < 0.05).
In general, high LST values are associated with areas of high population density (Figure 6). This close coincidence is attested by the statistically significant correlation between mean LST and population density at the block group level. The relationship is much stronger in Auburn-Opelika (0.75) and Birmingham (0.63), while Montgomery exhibits a smaller coefficient (0.43).
3.2. Statistical Analysis for Sensitivity and Adaptive Capacity
3.2.1. Sensitivity
FA results of the sensitivity subindex for Birmingham are summarized in Table 4. The five factors retained after performing parallel analysis explain 21.0, 12.9, 10.7, 0.8, and 7.7% of the total variance. Overall, the retained factors account for 62.1% of the variance. Except for Factor 3, which depicts isolated people, and Factor 4, which is dominated by demographic variables, all other factors are formed by a mix of various socioeconomic indicators. The variables with the highest weights include isolation (non-family households with one person), disability and no insurance. Linguistic isolation, households below poverty level, and walkers (workers aged 16+ who walked to workplace) were assigned the lowest weights.
Table 5 displays the FA results for the city of Montgomery. The first four factors retained explain 63.2% of the variance in the data set. Regarding Factor 1, a meaningful explanation of factor loadings is not straightforward due to a mix of demographic and socioeconomic indicators dominated by no vehicle (0.244) and no diploma (0.203). Factor 2 is formed by isolation of non-family populations and demographic indicators (youth and seniors). Factor 3 is dominated by no social security income (0.563) followed by disability and isolation 65+ (0.179 and 0.164, respectively), while for Factor 4, impervious and density lead other socioeconomic indicators. The highest weights were assigned to no social security income (0.147) and no vehicle (0.115). No insurance and linguistic isolation received the lowest weights (0.003).
FA results for Auburn-Opelika are shown in Table 6. The first factor loads on people without vehicles, with a disability, without social security, living in isolation, and in old houses. This factor clearly relates to social insecurity. Factor 2 is composed of a mix of environmental, demographic, and socioeconomic indicators. It loads heavily on imperviousness, walkers, density, seniors, youth, and household income. Similarly, Factor 3 is composed of a variety of indicators, including minority populations, no insurance, mobile homes, linguistic isolation, and unemployment rate. Indicators with the highest weights loaded on Factor 1 (no vehicles: 0.102; no social security: 0.091; disability: 0.082) and Factor 2 (impervious: 0.086). The lowest weights were assigned to indicators loaded in Factor 3: unemployment rate (0.025) and linguistic (0.026).
3.2.2. Adaptive Capacity
Table 7 summarizes FA results of the adaptive capacity subindex for all cities. After using parallel analysis, two factors were retained for each urban area. The retained factors explain 61% of the total variance for Birmingham, 60.2% for Montgomery, and 66.3% for Auburn-Opelika. FA results for Birmingham show that indicators with the highest loadings and weights are urban canopy and recreational (mean distance to recreational centers and parks). For Montgomery, vehicles and recreational are the predominant indicators, while for Auburn-Opelika, recreational and urban canopy exhibit the highest loadings (0.568 and 0.314, respectively). Overall, across the three urban centers, the most determinant factors are urban canopy, vehicles, and recreational. Vehicles and recreational received the highest weights for both Montgomery and Auburn-Opelika, while for Birmingham, the highest weights were assigned to urban canopy and recreational.
3.3. Spatial Patterns of the Subindices and Final Vulnerability Index
3.3.1. Birmingham
The distribution patterns of sub-indices and index scores for Birmingham are shown in Figure 7. The highest exposure to urban heat occurs in central parts of the city, while exposure decreases away from central urban zones (Figure 7a). As shown in Figure 7b, those areas highly exposed to urban heat also exhibit high sensitivity due to several factors including extensive imperviousness, reduced urban canopy, high population density, and poor socioeconomic conditions. Block groups with the highest adaptive capacity scores are mainly located away from central Birmingham (Figure 7c). As a result, the spatial distribution of vulnerability scores shows clearly that populations living in the inner city are much more vulnerable to urban heat, while less vulnerable populations are found in suburban areas to the north, east, and south (Figure 7d). A more detailed observation shows that very high vulnerability is explained by varying factors; while many block groups exhibit very high exposure, sensitivity, and very low adaptive capacity, various combinations of the three subindices can also lead to very high vulnerability. Although some block groups are only moderately exposed to urban heat, they exhibit a high level of sensitivity and low adaptive capacity, while others are highly exposed to urban heat but have relatively lower sensitivity levels.
3.3.2. Montgomery
Figure 8 shows the spatial distribution of vulnerability components for the city of Montgomery. The block groups mostly exposed to urban heat are mainly found in central Montgomery, although they are less compactly clustered than in Birmingham (Figure 8a). The least exposed block groups extend away from central Montgomery, particularly in the northern, eastern, and southern parts of the city. Highly sensitive block groups are mainly found in west central areas, in contrast with eastern Montgomery where most of the block groups exhibit low sensitivity scores (Figure 8b). This east/west pattern also characterizes the distribution of adaptive capacity scores; while a few scattered spots of high adaptive capacity can be found in the western part of the city, most of block groups with high scores are found in eastern Montgomery (Figure 8c). Relative to Birmingham, the spatial distribution of high vulnerability index scores across Montgomery is heterogeneous; except for a main cluster of 18 block groups located in the west central part of the city, other most vulnerable block groups are found in many smaller spots also dispersed over the western and central areas, and the magnitude of the urban heat vulnerability scores varies rapidly over short distances (Figure 8d). The least vulnerable block groups clearly prevail in the eastern half of the city.
3.3.3. Auburn-Opelika
Figure 9 displays the spatial patterns of vulnerability for Auburn-Opelika. High exposure to urban heat is limited to nine small block groups only: seven form a cluster located in central Auburn, and two individual ones are isolated pockets located in Auburn and Opelika. Block groups with very low exposure are mainly located in northern, western, and southern suburban areas surrounding the central city (Figure 9a). The most prominent pattern of very high sensitivity is a cluster of six small block groups located in Opelika. This single cluster is complemented by one small block group of high sensitivity located in central Auburn (Figure 9b). The least sensitive areas are generally found in the western and southern part of the urban agglomeration. A pattern of spatial heterogeneity characterizes the distribution of adaptive capacity scores; very high, average, as well as very low scores of adaptive capacity are found in small clusters across the whole urban area (Figure 9c). Overall, a noteworthy feature is the spatial heterogeneity in the distribution of scores for all subindices. High exposure scores do not often coincide with high sensitivity, for example, some block groups exhibit very high sensitivity but very low exposure to urban heat; conversely, some block groups are highly exposed but show very low sensitivity. Therefore, determining the impacts of urban heat on populations by just examining score distribution maps is not a straightforward method. The resulting composite vulnerability index is shown in Figure 9d. The main vulnerability hotspot is a small cluster of six block groups located in Opelika. A second cluster of two small block groups is located in central Auburn. Between the two clusters, there is a single block group of high vulnerability located in the central part of the urban agglomeration. In the main cluster located in Opelika, high vulnerability is mainly driven by very high sensitivity and very low adaptive capacity. Average scores (out of 100) for the constituting block groups are as follows: exposure, 44.3; sensitivity, 95.6; adaptive capacity, 26.1. High vulnerability of the smaller cluster in Auburn is explained by very high exposure to urban heat (with an average score of 90.2), moderate to high sensitivity (61.3), and slightly below average adaptive capacity (44.5). Areas of very low vulnerability are generally located in northern and southern suburban areas and surround the inner cities.
3.4. Deconstructing the Heat Vulnerability Index
Deconstructing composite indicators helps policymakers to better understand the scores and rankings of subindices and individual indicators and make more informed decisions. One way to look at the contribution of subindices and associated indicators to the composite index is to use correlations. Moreover, index deconstruction means further analyzing the results and capturing local variations. Results can be further explored by identifying clusters of high and low index scores and analyzing their characteristics.
3.4.1. Correlations
Table 8 summarizes the relative importance of the subindices to the vulnerability index. All correlations are statistically significant at the 5% level. For Birmingham, the index is strongly correlated with the exposure and sensitivity subindices. For Montgomery and Auburn-Opelika, the vulnerability index is more strongly related to sensitivity and adaptive capacity.
Table 9 presents the results of a more detailed examination of the linear relationships between the vulnerability index and all constituting indicators. For Birmingham, 21 indicators (out of 23) are significantly correlated with the Urban Heat Vulnerability index. The index is highly correlated with LST, which is the lone variable of the exposure subindex (0.82) and, to a lesser extent, isolation (0.67), minority (0.65), and impervious (0.64), which are variables of the sensitivity subindex. This indicates that in Birmingham, environmental factors (LST and impervious) contribute greatly to the magnitude of the vulnerability index. In contrast, some of the demographic factors are poorly correlated with the index: youth (0.02), seniors (0.03), and linguistic (0.03). Indicators moderately correlated with the index include old houses (0.58), no vehicle (0.57), isolation 65+ (0.55), urban canopy (0.53), and recreational (0.50).
The results for Montgomery presented in Table 9 show that 16 indicators are significantly correlated with the vulnerability index. Vehicles, which is one of the adaptive capacity subindex indicators, shows the strongest relationship with the vulnerability index (−0.81). Indicators with highest correlation also include impervious, no vehicle, LST, and wealth (0.75, 0.62, 0.60, −0.60, and 0.50, respectively). Hence, the highest correlations involve indicators from all three subindices. The index is weakly correlated with indicators of the sensitivity subindex: no insurance (0.03), isolation (0.04), linguistic (0.05), and no social security (0.07). For the Auburn-Opelika conurbation, the Pearson correlation is statistically significant for 11 indicators. The top correlations with the vulnerability index are vehicles (−0.86) and no vehicle (0.70), followed by moderate ones: impervious (0.62), LST (0.60), minority (0.59), and wealth (−0.57). Like in Montgomery, the possession (or not) of a vehicle contributes substantially to shaping the urban heat vulnerability index. Seniors (−0.04), mobile homes (−0.060, walkers (0.07), and no diploma (0.08) exhibit the weakest correlations with the index. Overall, the indicators that have demonstrated a statistically significant correlation with the index in all three urban centers are as follows: LST (exposure subindex); density, minority, disability, no vehicle, and impervious (sensitivity subindex); wealth, vehicles, new houses, and urban canopy (all adaptive capacity indicators except for recreational). On average, indicators that were more strongly correlated with the vulnerability index are LST, impervious, vehicles, no vehicle, minority, and wealth. The weakest correlations went to seniors, linguistic, and youth.
The analysis can be further extended by decomposing each subindex to better understand the contribution of underlying indicators. Figure 10 displays the results of correlations between the sensitivity subindex and associated indicators. Indicators most strongly correlated with the subindex are isolation (0.82) and minority (0.81) for Birmingham (Figure 10a); old houses (0.78) for Montgomery (Figure 10b); and no vehicle (0.83) and minority (0.70) for Auburn (Figure 10c). Weakly correlated indicators are linguistic isolation (0.05) and seniors (0.05) for Birmingham; isolation 65+ (0.01), mobile homes (−0.03), and linguistic isolation (−0.03) for Montgomery; household income below poverty level (−0.07), and mobile homes (−0.10) for Auburn. Although the strength of the relationship between the subindex and components varies from one urban center to another, there are notable similarities across urban centers; regardless of the city, (i) some indicators are strongly and significantly correlated with the sensitivity subindex (isolation and no vehicle), while some are weakly correlated (mobile homes, linguistic isolation).
The adaptive capacity subindex (Figure 11) is strongly correlated with urban canopy (Birmingham) and vehicles (Montgomery and Auburn-Opelika). Recreational (Birmingham and Montgomery) and urban canopy (Auburn-Opelika) exhibit the lowest correlations. In general, the contribution of indicators to the subindex varies considerably. For example, while urban canopy is the primary contributor to the index for Birmingham, its relationship with the index is weaker in Montgomery and Auburn-Opelika. Correlation analysis can offer some insight into the relationship between variables and indices and their potential impacts on urban heat vulnerability in different cities. However, it is important to note that correlation does not necessarily imply causation. Therefore, more detailed and localized analyses are required to gain a better understanding of the underlying factors that drive the vulnerability to urban heat.
3.4.2. Cluster Analysis
Cluster analysis allows a more precise identification of spatial clusters consisting of block groups exhibiting very high or low vulnerability. It also facilitates a deeper exploration of each subindex score and its corresponding rankings [133,134].
Figure 12 shows the spatial patterns of clusters for Birmingham and spider charts depicting the structure of sensitivity and adaptive capacity subindices in areas of HH and LL clusters (very high and very low vulnerability, respectively). There is a single cluster of block groups with high vulnerability values located in central Birmingham consisting of 32% of the block groups over 7.2% of the total urban area (Figure 12a). This hotspot is surrounded by two large, connected clusters of low vulnerability located in suburban areas to the north and east of central Birmingham, and two smaller ones to the south. The low-vulnerability clusters are composed of 23% of the block groups covering 40.2% of the urban area. Figure 12b,c are spider diagrams that show an example of disaggregation of subindices for a better understanding of the overall composite index. For each subindex, the scores of associated indicators for block groups located in very high- and very low-vulnerability areas (HH and LL clusters, respectively) are displayed along with the sample mean (average for all block groups). Scores of the eighteen indicators for the sensitivity subindex are shown in Figure 12b. Block groups in HH clusters exhibit very high sensitivity to urban heat. All indicators score higher than the sample mean except for no social security and mobile homes. The high sensitivity in HH clusters is mainly explained by the very high score of the minority indicator (93%), followed by isolation (70%), old houses (70%), no social security (61%), and impervious (55%). Block groups in LL clusters show very low sensitivity. Indicators score lower than the sample mean, except for no social security (64%), youth (42%), and seniors (34%). Low-vulnerability areas have no or little concern about all types of isolation, walkers, no vehicle, and density. Indicators with the largest score gaps between HH and LL areas are isolation (difference: 70%), minority (65%), old houses (50%), isolation 65+ (38%), and impervious (38%). Deconstruction of the adaptive capacity subindex is shown on Figure 12c. Block groups in LL areas score higher than the sample mean and block groups in HH areas for all indicators except for recreational (96% in HH areas, 73% in LL areas). One notable feature is the contrast between the very high scores of recreational and the very low scores of urban canopy, new houses and wealth, regardless of the level of vulnerability.
Figure 13 displays the cluster and outlier analysis for Montgomery, along with subindices and indicators associated with each cluster and shown as spider diagrams. There are two well defined clusters: a HH cluster located in the west central city that consists of 39 small block groups, representing 22.5% of the total number of block groups, but only 8.6% of the urban area; a cluster of LL values located in eastern suburban areas that is composed of 16 larger block groups, representing 8.7% of the total number of block groups over 31.4% of the urban area (Figure 13a). Regarding the sensitivity subindex (Figure 13b), HH clusters score higher than LL ones for twelve indices (out of eighteen). The minority and isolation indicators display the highest scores in HH clusters (90% and 89%, respectively), as well as in LL clusters (72% and 88%, respectively). Other relatively high scores in HH areas include impervious (65%) and no social security (61%). Indicators with the highest score difference between HH and LL clusters are impervious (a difference of 45.3%), and, to a lesser extent, density (20.7%), minority (18%), and old houses (16.3%). In general, the contrast between HH and LL clusters is less apparent in Montgomery than in Birmingham; the magnitude of score differences is much smaller in Montgomery. Moreover, up to five sensitivity indicators have scores that are higher in low-vulnerability areas: mobile homes, disability, seniors, youth, and no health insurance. A deconstruction of the adaptive capacity is shown in Figure 13c. Indicators have higher scores in low-vulnerability areas (LL clusters), except for recreational. Block groups in those areas are wealthier and have more urban canopy, new houses, and vehicles.
Spatial patterns of high- and low-vulnerability clusters and associated spider diagrams for Auburn-Opelika are shown in Figure 14. A group of nine east-central block groups (19.6% of the total number of block groups) centered over Opelika form one HH cluster (high vulnerability), covering 9.7% of the urban area (Figure 14a). Cluster and outlier analysis (Anselin Local Moran’s I) did not yield any LL cluster. Only two block groups exhibited relatively low vulnerability but were classified as low–high outliers (LH) which are low values surrounded by features with high values. Therefore, those block groups were retained as low-vulnerability areas. Figure 14b displays the scores of sensitivity indicators for HH and LH clusters, along with average scores of all block groups. In HH areas, no social security is the indicator which scores higher (83%), followed by impervious (68%), isolation (68%), and household income below poverty level (55%). Linguistic isolation, mobile homes, and isolation 65%+ exhibit lowest scores (1%, 3%, and 9%, respectively). In LH areas, the sensitivity subindex is mainly explained by isolation (87%), no social security (67%), youth (63%), and seniors (50%). Therefore, two indicators have high scores in both HH and LH clusters: no social security and isolation. Figure 14b paints a mixed picture; it is generally expected that sensitivity indicators score much higher in most vulnerable areas, but this is not the case in Auburn-Opelika. Only eight indicators (out of eighteen) score higher in HH areas. The impervious indicator takes the lead with a score 61% higher in HH areas, followed by walkers (43%), density (37%), and household income below poverty level (32%). Uncharacteristically, a majority of sensitivity indicators (ten) score higher in low-vulnerability areas. The largest differences (HH scores minus LH scores) include demographic indicators (youth: −31%; seniors: −30%), mobile homes (−26%), no diploma (−22%), and isolation (−20%). These atypical differences suggest that vulnerability index structure may vary substantially depending on the size of urban areas. Figure 14c displays the scores of the adaptive capacity subindex in HH and LH areas, along with the overall average. The graph depicts patterns that resemble those observed in Birmingham and Montgomery, with higher scores in LH areas, except for the recreational indicator. Indicators with the largest score differences are urban canopy (55% in LH areas, 5% in HH areas, hence a difference of 50%) and recreational, which scores much higher in HH areas (a difference of 43%).
The above method, which consists of deconstructing subindices and visualizing the results using spider diagrams, can be applied at individual unit level; a spider diagram can be created for each block group and compared with the overall average. The diagram can be displayed alongside the associated vulnerability index and subindex, as shown in Figure 15. This information can be complemented with demographic and socioeconomic original values of each indicator. In addition to the block group’s data, the average for all block groups can be added as a reference. Such a combination will result in the creation of a block group profile that can be very useful for policymakers.
Cluster analysis can be used to find which highly vulnerable block groups are more exposed to urban heat by overlaying HH clusters of vulnerability with HH clusters of LST. Block groups where high vulnerability and high heat exposure co-occur, referred to as “hot hotspots” [104], should be given priority when implementing urban heat risk management plans. Figure 16 displays the results of the spatial overlay.
In Birmingham, co-occurrence happens for 164 block groups (87.2% of highly vulnerable block groups) located in the central part of the city. To the south of this cluster, a smaller one formed by 29 block groups exhibits high heat exposure but is not highly vulnerable. Block groups classified as highly vulnerable but not exposed to high urban heat are adjacent to and mainly located to the north of the central cluster (Figure 16a). In Montgomery, the spatial overlay revealed a west central cluster of 21 highly vulnerable block groups exposed to high urban heat (53.8% of all highly vulnerable block groups). Two clusters of high heat exposure but not high vulnerability (a total of 29 block groups) are located in east central Montgomery (Figure 16b). There is no co-occurrence in the Auburn-Opelika conurbation. Highly vulnerable block groups are clustered over Opelika, while high urban heat exposure occurs over Auburn (Figure 16c).
4. Discussion and Conclusions
The world is experiencing a sustained wave of urban growth associated with increased levels of socioeconomic disparities and environmental hazards, not the least of which is urban heat. Although it is difficult to find consistent baselines due to (i) the differences in methods used to quantify urban heat and assess the vulnerability of urban populations, and (ii) the specific characteristics of each city (environmental, structural, and demographic patterns), a substantial majority of studies concur that poorest urban neighborhoods face higher exposure to heat and have less capacity to cope with it compared to wealthier areas. Vulnerable populations such as the elderly, young children, those with pre-existing medical conditions, and populations of lower socioeconomic conditions are the most affected. For example, Chakraborty et al. [14] used NASA’s Moderate Resolution Imaging Spectroradiometer (MODIS) data to (i) calculate UHI intensity as the area-averaged differential in LST between urban neighborhoods and their corresponding rural reference, and (ii) combine it with NDBI, NDVI, and albedo and merge the resulting data with urban neighborhood-scale income and population data. Their analysis showed that in 72% of cases across twenty-five cities, neighborhoods with lower socioeconomic status encounter higher heat exposure, in accordance with the distribution of income within cities. De La Barrera et al. [135] combined LST obtained from Landsat 15, NDVI, and normalized difference of built-up index (NDBI) with socioeconomic data at a census track level in Santiago (Chile). They found that temperatures in low-income neighborhoods were 2.5 °C to 3.3 °C higher than those in high-income districts. Jenerette et al. [136] combined satellite-derived surface temperature and vegetation data from an early summer day with US Census and topographic data. Their research demonstrated that in Phoenix, for every USD 10,000 increase in the annual median household income of a neighborhood, there was an associated decrease of 0.28 °C in summer surface temperature. Voelkel et al. [137] collected urban temperature data for the City of Portland (Oregon) using a vehicle traverse collection method (cars with a mounted temperature sensor and global positioning system), then used ArcGIS Zonal Statistics to compute the average temperature at census block group level. The resulting data were combined with socioeconomic data including income, race, education, English speaking ability, and the presence of affordable housing. They found that groups with limited adaptive capacity, including those in poverty and non-white populations, were at higher risk for heat exposure. Dialesandro et al. [73] investigated thermal inequities by retrieving LST from Landsat 8 data for twenty southwestern U.S. urban regions and using spatial regression models to analyze the variation of urban heat according to income and race at the census block group level. They found that, on average, the poorest 10% of urban neighborhoods were 2.2 °C to 3.7 °C hotter than the wealthiest 10%. Such results are consistent with our findings. Like Dialesandro et al. [73], we calculated LST from Landsat 8 images and conducted a vulnerability assessment at block group level. After classifying block groups based on ESRI’s Wealth Index and computing the average LST for each block group using the ArcGIS Zonal Statistics tool, we compared the top 10% wealthiest and poorest block groups and found that (i) for Auburn-Opelika, LST was 3.4 °C higher in the poorest block groups. The differences were 3.6 °C for Birmingham and 2.1 °C for Montgomery.
In addition to the previously mentioned examples, various approaches have been employed to evaluate vulnerability to urban heat. Most of these studies have observed noticeable inequalities in exposure to urban heat. However, heat distribution patterns vary between cities and within each urban area due to several factors, including local climate conditions, urban configuration and size, urban canopy density, the presence of water bodies, and the extent of impervious areas. Additionally, the demographic and socioeconomic makeup of cities can vary considerably. As a result, vulnerability to urban heat depends on a complex interplay of physical, social, and economic factors. To develop effective strategies to mitigate the impacts of urban heat on people’s health and well-being, it is crucial to conduct vulnerability assessments at individual city and granular scales. In this study, we utilized a collection of Landsat 8 satellite images to derive LST and created a UHI vulnerability index for three cities in Alabama at a block group level. This level of analysis is much more refined than the typical scales usually employed in comparable studies.
Distinct disparities in the spatial distribution of urban heat vulnerability are already evident among the three cities. Spatial patterns suggest that the distribution of vulnerability scores is significantly influenced by urban configuration. The city of Birmingham displays a noticeable difference between the densely packed buildings and pavements in its central area and the suburbs which consist of a combination of residences and green cover. The central part of the city forms a compact cluster of highly vulnerable block groups (high exposure to urban heat associated with high sensitivity and low adaptive capacity). Compared to Birmingham, the combination of impermeable surfaces and urban greenery in Montgomery is more notable. The distribution of high vulnerability index scores exhibits heterogeneity, with a prominent cluster of block groups concentrated in the west-central region of the city, alongside smaller dispersed clusters found throughout the western and central areas. As a result, the magnitude of the urban heat vulnerability scores can vary greatly over short distances. In Auburn-Opelika, the distribution of scores for all sub-indices displays a marked spatial variability. High scores of exposure do not always concur with high sensitivity. Thus, interpreting the impacts of urban heat on populations merely by examining the distribution of scores on maps is not a straightforward task.
Considering the variations observed across different cities, a deconstruction of the vulnerability index becomes even more valuable. Analysis of the correlation between the vulnerability index and its constituting indicators shows that there were both consistent and varying indicators associated with the heat vulnerability index across the cities of Birmingham, Montgomery, and Auburn-Opelika. Variables which consistently showed a strong relationship with the vulnerability index across all three cities included impervious, LST, no vehicle, minority, and wealth. On the other hand, some indicators demonstrated weak and non-significant correlations with the vulnerability index across all cities: linguistic, youth, and seniors are prominent examples. In terms of the variation among cities, certain variables displayed varying levels of correlation with the vulnerability index in different cities. For example, the variable vehicles exhibited a strong relationship with the vulnerability index in Auburn-Opelika and Montgomery but showed a weak correlation with the index in Birmingham. Similarly, the variable isolation was significantly correlated with the vulnerability index in Birmingham but did not display a significant relationship with the index in Auburn-Opelika and Montgomery.
Further, the cluster analysis and associated spider charts consist of a more detailed and localized analysis which aimed at identifying block groups with high and low urban heat vulnerability and decomposing the index to analyze the contribution of each indicator. Such an analysis enables a more pointed examination of the contributing factors specific to each city, ultimately leading to tailored policy recommendations for addressing urban heat vulnerability at local scale. Like the correlation analysis, the cluster analysis found consistent patterns across all cities regarding the indicators contributing to high urban heat vulnerability, as well as variations in the importance of certain indicators between cities. Consistent across all cities, highly vulnerable areas were characterized by high sensitivity, which was mainly explained by indicators such as minority, isolation, impervious surfaces, and no social security. These indicators consistently contributed to the high sensitivity in block groups across all cities. Additionally, low adaptive capacity was consistently associated with weak scores in wealth and urban canopy. Interestingly, across all cities, the recreational indicator exhibited the strongest adaptive capacity score in highly vulnerable block groups. This suggests that access to recreational spaces might not be a major contributing factor to urban heat vulnerability in those specific locations. Therefore, policymakers may not need to prioritize increasing the number of recreational areas in those areas, as they might already have sufficient access to such spaces. Minority was the strongest contributor to the sensitivity subindex in Birmingham and Montgomery, but its contribution was modest in Auburn-Opelika. Similarly, old houses had higher scores and contributed more significantly to sensitivity in Birmingham and Montgomery compared to Auburn-Opelika. In contrast, no social security prominently contributed to sensitivity in Auburn-Opelika but scored much lower in Birmingham and Montgomery. In summary, despite the existence of consistent indicators that contribute to high urban heat vulnerability across all cities, variations in the importance of certain indicators between cities suggest that policymakers should consider city-specific factors when developing targeted interventions to address urban heat vulnerability. These findings can guide policymakers in prioritizing resources and implementing tailored strategies to mitigate the specific vulnerabilities observed in each city. For example, the results of our analysis indicate that minority populations and old houses emerge as more significant factors contributing to urban heat vulnerability in larger urban areas such as Montgomery and Birmingham. However, these factors do not appear to have the same level of prominence in smaller cities such as Auburn-Opelika.
Overall, the development of the Urban Heat Index for three different cities based on the aggregation of subindices, along with the subsequent deconstructions, yielded significant knowledge. Information obtained from the cluster analysis and associated spider charts can be further scaled down to a block group level to detect strengths and weaknesses of each unit, identify indicators that are relevant or less important, and develop block group profiles that will guide decision makers. However, it is important to consider the potential limitations associated with such an approach. The choice of underlying indicators and the statistical methods used to normalize the data, assign weights, and aggregate the results involve making certain assumptions, simplifications, and subjective judgements. Some of the statistical limitations are well documented, and there is no perfect solution for building a composite index [133,138,139]. Moreover, it is necessary to consider the dynamics of vulnerability. Various factors may cause vulnerability to change over time, including urban development and other land use changes, environmental changes, demographic shifts, socioeconomic dynamics, and long-lasting or compounding disasters [140,141,142]. In addition, with the increasing implementation of adaptation and resilience-building measures by urban planners, the capacity to handle heat stress is enhanced, leading to a reduction in vulnerability in targeted areas.
This study emphasizes the importance of conducting more comprehensive and location-specific research, which plays a critical role in the development of efficient mitigation strategies. It should be noted that the study’s findings may not be readily applicable to other cities or regions due to the unique characteristics exhibited by each city or neighborhood. These distinctive attributes stem from a variety of factors, including demographics, environmental conditions, infrastructure, urban configuration, and socioeconomic conditions [143]. Therefore, such studies provide a granular understanding of urban heat vulnerability through the identification of localized hotspots which allows the determination of targeted and priority interventions that address the specific vulnerabilities. They also allow a better identification of local governance structures and facilitate community engagement and participation, since local populations will accept to implement strategies that are based on local knowledge and aim at addressing community needs.
The statistical approach used to construct our vulnerability index incorporates established procedures commonly utilized in the development of widely recognized indices, such as the Product Market Regulation Index [144], the Internal Market Index [145], the Business Climate Indicator [146], the Environmental Sustainability Index [147,148], the General Indicator of Science and Technology [149], and the Socioeconomic Status Index [150]. Various studies have conducted uncertainty and sensitivity analyses and other validation tests on these indices, as documented in numerous works [133,138,151,152]. To enhance the quality of this study, future efforts should involve two key aspects. Firstly, an uncertainty analysis and/or sensitivity analysis should be incorporated to further evaluate the robustness of the composite index. Secondly, a comprehensive review of the indicators can be conducted by engaging stakeholders and communities, including the insights of subject matter experts, and considering the removal of less significant indicators while introducing new relevant ones. By regularly updating and refining the outputs of this study, decision makers will be empowered to take data-driven actions based on the underlying factors influencing the composite index and subindices. Integrating this tool within the broader framework of urban management will enable the development of tailored strategies for each block group, facilitate targeted resource allocation, and assist local communities in building resilience to urban heat challenges.
Author Contributions
Conceptualization: S.F. Methodology: S.F., K.C., J.Q. and G.E.A. Software: S.F. Validation: S.F., K.C., J.Q. and G.E.A. Formal analysis: S.F. Investigation, S.F. Resources: S.F., G.E.A. and J.Q. Data curation: S.F. and K.C. Writing—original draft preparation: S.F. Writing—review and editing K.C., J.Q. and G.E.A. Visualization: S.F. Supervision: S.F. Project administration: S.F. All authors have read and agreed to the published version of the manuscript.
Funding
This study was supported by USDA-NIFA #1001194 and NOAA #NA22NWS4320003.
Institutional Review Board Statement
Not applicable.
Informed Consent Statement
Not applicable.
Data Availability Statement
This research did not include any data through intervention or interaction with individuals. There was no identifiable private information disclosed. The data used are publicly available and the sources are already clearly indicated in the manuscript (see Table 1).
Acknowledgments
We are grateful for the administrative and technical support provided by Tuskegee University’s College of Agriculture, Environment, and Nutrition Sciences. We also gratefully acknowledge the support from Tuskegee University’s George Washington Carver Agricultural Experiment Station.
Conflicts of Interest
The authors declare no conflict of interest. The funders had no role in the design of the study; in the collection, analyses, or interpretation of data; in the writing of the manuscript; or in the decision to publish the results.
References
- United Nations, Department of Economic and Social Affairs, Population Division. World Urbanization Prospects: The 2018 Revision (ST/ESA/SER.A/420); United Nations: New York, NY, USA, 2019; 126p, Available online: https://population.un.org/wup/Publications/Files/WUP2018-Report.pdf (accessed on 21 January 2022).
- Shepherd, J.M.; Ferrier, B.S.; Ray, P.S. Rainfall morphology in Florida convergence zones: A numerical study. Mon. Wea. Rev. 2001, 129, 177–197. [Google Scholar] [CrossRef]
- Mindali, O.; Raveh, A.; Salomon, I. Urban density and energy consumption: A new look at old statistics. Transp. Res. Part A Policy Pract. 2004, 38, 143–162. [Google Scholar] [CrossRef]
- Kaufmann, R.K.; Seto, K.C.; Schneider, A.; Liu, Z.; Zhou, L.; Wang, W. Climate response to rapid urban growth: Evidence of a human-induced precipitation deficit. J. Clim. 2007, 20, 2299–2306. [Google Scholar] [CrossRef]
- Jones, C.; Kammen, D.M. Spatial Distribution of U.S. Household Carbon Footprints Reveals Suburbanization Undermines Greenhouse Gas Benefits of Urban Population Density. Environ. Sci. Technol. 2014, 48, 895–902. [Google Scholar] [CrossRef] [PubMed]
- Tana, S.; Yang, J.; Yan, J. Development of the Low-carbon City Indicator (LCCI) Framework. In Proceedings of the 7th International Conference on Applied Energy—ICAE2015, Abu Dhabi, United Arab Emirates, 28–31 March 2015; pp. 2516–2522. [Google Scholar]
- Bounoua, L.; Zhang, P.; Mostovoy, G.; Thome, K.; Masek, J.; Imhoff, M.; Shepherd, M.; Quattrochi, D.; Santanello, J.; Silva, J.; et al. Impact of urbanization on US surface climate. Environ. Res. Lett. 2015, 10, 084010. [Google Scholar] [CrossRef]
- Hibbard, K.A.; Hoffman, F.M.; Huntzinger, D.; West, T.O. Changes in land cover and terrestrial biogeochemistry. In Climate Science Special Report: Fourth National Climate Assessment; Wuebbles, D.J., Fahey, D.W., Hibbard, K.A., Dokken, D.J., Stewart, B.C., Maycock, T.K., Eds.; U.S. Global Change Research Program: Washington, DC, USA, 2017; Volume I, pp. 277–302. [Google Scholar]
- Moran, D.; Kanemoto, K.; Jiborn, M.; Wood, R.; Többen, J.R.; Seto, K.C. Carbon footprints of 13,000 cities. Environ. Res. Lett. 2018, 13, 064041. [Google Scholar] [CrossRef]
- Liu, J.; Niyogi, D. Identification of linkages between urban heat island magnitude and urban rainfall modification by use of causal discovery algorithms. Urban Clim. 2020, 33, 100659. [Google Scholar] [CrossRef]
- Environmental Protection Agency. Learn about Heat Islands. 2022. Available online: https://www.epa.gov/heatislands/learn-about-heat-islands (accessed on 22 July 2022).
- Stewart, I.D.; Oke, T.R. Local climate zones for urban temperature studies. Bull. Am. Meteorol. Soc. 2012, 93, 1879–1900. [Google Scholar] [CrossRef]
- Debbage, N.; Shepherd, J.M. The urban heat island effect and city contiguity. Comput. Environ. Urban Syst. 2015, 54, 181–194. [Google Scholar] [CrossRef]
- Chakraborty, T.; Hsu, A.; Manya, D.; Sheriff, G. Disproportionately higher exposure to urban heat in lower-income neighborhoods: A multi-city perspective. Environ. Res. Lett. 2019, 14, 105003. [Google Scholar] [CrossRef]
- Li, Y.; Schubert, S.; Kropp, J.P.; Ribsky, D. On the influence of density and morphology on the Urban Heat Island intensity. Nat. Commun. 2020, 11, 2647. [Google Scholar] [CrossRef] [PubMed]
- Intergovernmental Panel on Climate Change. Climate Change 2021: The Physical Science Basis. Contribution of Working Group I to the Sixth Assessment Report of the Intergovernmental Panel on Climate Change; Masson-Delmotte, V., Zhai, P., Pirani, A., Connors, S.L., Péan, C., Berger, S., Caud, N., Chen, Y., Goldfarb, L., Gomis, M.I., et al., Eds.; Cambridge University Press: Cambridge, UK, 2021. [Google Scholar]
- Roshan, G.; Sarli, R.; Grab, S.W. The case of Tehran’s urban heat island, Iran: Impacts of urban “lockdown” associated with the COVID-19 pandemic. Sustain. Cities Soc. 2021, 75, 103263. [Google Scholar] [CrossRef] [PubMed]
- Kenawy, A.M.; Lopez-Moreno, J.I.; McCabe, M.F.; Domínguez-Castro, F.; Peña-Angulo, D.; Gaber, I.M.; Vicente-Serrano, S.M. The impact of COVID-19 lockdowns on surface urban heat island changes and air-quality improvements across 21 major cities in the Middle East. Environ. Pollut. 2021, 288, 117802. [Google Scholar] [CrossRef] [PubMed]
- Liu, Z.; Lai, J.; Zhan, W.; Bechtel, B.; Voogt, J.; Quan, J.; Hu, L.; Fu, P.; Huang, F.; Li, L.; et al. Urban heat islands significantly reduced by COVID-19 lockdown. Geophys. Res. Lett. 2022, 49, e2021GL096842. [Google Scholar] [CrossRef]
- Jamei, E.; Jamei, Y.; Seyedmahmoudian, M.; Horan, B.; Mekhilef, S.; Stojcevski, A. Investigating the impacts of COVID-19 lockdown on air quality, surface Urban Heat Island, air temperature and lighting energy consumption in City of Melbourne. Energy Strategy Rev. 2022, 44, 100963. [Google Scholar] [CrossRef]
- Lokoshchenko, M.A.; Enukova, E.A. Surface Urban Heat Island in Moscow During The COID-19 Pandemic Lockdown in 2020. Geogr. Environ. Sustain. 2023, 15, 134–144. [Google Scholar] [CrossRef]
- Mijani, N.; Firozjaei, M.K.; Mijani, M.; Khodabakhshi, A.; Qureshi, S.; Arsanjani, J.J.; Alavipanah, S.K. Exploring the effect of COVID-19 pandemic lockdowns on urban cooling: A tale of three cities. Adv. Space Res. 2023, 71, 1017–1033. [Google Scholar] [CrossRef]
- Pincetl, S.; Chester, M.; Eisenman, D. Urban Heat Stress Vulnerability in the U.S. Southwest: The Role of Sociotechnical Systems. Sustainability 2016, 8, 842. [Google Scholar] [CrossRef]
- Filho, L.W.; Echevarria Icaza, L.; Emanche, V.O.; Quasem Al-Amin, A. An Evidence-Based Review of Impacts, Strategies and Tools to Mitigate Urban Heat Islands. Int. J. Environ. Res. Public Health 2017, 14, 1600. [Google Scholar] [CrossRef]
- Guo, A.; Yang, J.; Xiao, X.; Xia, J.; Jin, C.; Li, X. Influences of urban spatial form on urban heat island effects at the community level in China. Sustain. Cities Soc. 2019, 53, 101972. [Google Scholar] [CrossRef]
- Yue, W.; Liu, X.; Zhou, Y.; Liu, Y. Impacts of urban configuration on urban heat island: An empirical study in China mega-cities. Sci. Total Environ. 2019, 671, 1036–1046. [Google Scholar] [CrossRef]
- Shaker, R.R.; Altman, Y.; Deng, C.; Vaz, E.; Forsythe, K.W. Investigating urban heat island through spatial analysis of New York City streetscapes. J. Clean. Prod. 2019, 233, 972–992. [Google Scholar] [CrossRef]
- Antonopoulos, C.; Trusty, A.; Shandas, V. The role of building characteristics, demographics, and urban heat islands in shaping residential energy use. City Environ. 2019, 3, 100021. [Google Scholar] [CrossRef]
- Soltanifard, H.; Aliabadi, K. Impact of urban spatial configuration on land surface temperature and urban heat islands: A case study of Mashhad, Iran. Theor. Appl. Climatol. 2019, 137, 2889–2903. [Google Scholar] [CrossRef]
- Terfa, B.K.; Chen, N.; Zhang, X.; Niyogi, D. Spatial Configuration and Extent Explains the Urban Heat Mitigation Potential due to Green Spaces: Analysis over Addis Ababa, Ethiopia. Remote Sen. 2020, 12, 2876. [Google Scholar] [CrossRef]
- Hu, Y.; Hou, M.; Jia, G.; Zhao, C.; Zhen, X.; Xu, Y. Comparison of surface and canopy urban heat islands within megacities of eastern China. ISPRS J. Photogramm. Remote Sens. 2019, 156, 160–168. [Google Scholar] [CrossRef]
- Varentsov, M.; Samsonov, T.; Demuzere, M. Impact of urban canopy parameters on a megacity’s modelled thermal environment. Atmosphere 2020, 11, 1349. [Google Scholar] [CrossRef]
- Sangiorgio, V.; Fiorito, F.; Santamouris, M. Development of a holistic urban heat island evaluation methodology. Sci. Rep. 2020, 10, 17913. [Google Scholar] [CrossRef]
- Dutta, K.; Basu, D.; Agrawal, S. Evaluation of seasonal variability in magnitude of urban heat islands using local climate zone classification and surface albedo. Int. J. Environ. Sci. Technol. 2021, 19, 8677–8698. [Google Scholar] [CrossRef]
- Ramakreshnan, L.; Aghamohammadi, N.; Fong, C.S.; Ghaarianhoseini, A.; Wong, L.P.; Sulaiman, N.M. Empirical study on temporal variations of canopy-level urban heat island effect in the tropical city of greater Kuala Lumpur. Sustain. Cities Soc. 2019, 44, 748–762. [Google Scholar] [CrossRef]
- Quan, J. Multi-Temporal Effects of Urban Forms and Functions on Urban Heat Islands Based on Local Climate Zone Classification. Int. J. Environ. Res. Public Health 2019, 16, 2140. [Google Scholar] [CrossRef] [PubMed]
- Ayanlade, A.; Aigbiremolen, M.I.; Oladosu, O.R. Variations in urban land surface temperature intensity over four cities in different ecological zones. Sci. Rep. 2021, 11, 20537. [Google Scholar] [CrossRef] [PubMed]
- Mills, G.; Stewart, I.D.; Niyogi, D. The origins of modern urban climate science: Reflections on ‘A numerical model of the urban heat island’. Prog. Phys. Geogr. 2022, 46, 649–656. [Google Scholar] [CrossRef]
- Cao, Q.; Huang, H.; Hong, Y.; Huang, X.; Wang, S.; Wang, L.; Wang, L. Modeling intra-urban differences in thermal environments and heat stress based on local climate zones in central Wuhan. Build Environ. 2022, 225, 109625. [Google Scholar] [CrossRef]
- Geng, X.; Zhang, D.; Li, C.; Yuan, Y.; Yu, Z.; Wang, X. Impacts of climatic zones on urban heat island: Spatiotemporal variations, trends, and drivers in China from 2001–2020. Sustain. Cities Soc. 2022, 89, 104303. [Google Scholar] [CrossRef]
- Fernandes, R.; Nascimento, V.; Freitas, M.; Ometto, J. Local Climate Zones to Identify Surface Urban Heat Islands: A Systematic Review. Remote Sens. 2023, 15, 884. [Google Scholar] [CrossRef]
- Founda, D.; Santamouris, M. Synergies between Urban Heat Island and Heat Waves in Athens (Greece), during an extremely hot summer (2012). Sci. Rep. 2017, 7, 10973. [Google Scholar] [CrossRef]
- Li, D.; Bou-Zeid, E. Synergistic Interactions between Urban Heat Islands and Heat Waves: The Impact in Cities Is Larger than the Sum of Its Parts. J. Appl. Meteorol. Climatol. 2013, 52, 2051–2064. [Google Scholar] [CrossRef]
- Dong, L.; Mitra, C.; Greer, S.; Burt, E. The dynamical linkage of atmospheric blocking to drought, heatwave and urban heat island in southeastern US: A multi-scale case study. Atmosphere 2018, 9, 33. [Google Scholar] [CrossRef]
- Leal Filho, W.; Icaza, L.E.; Neht, A.; Klavins, M.; Morgan, E.A. Coping with the impacts of urban heat islands. A literature based study on understanding urban heat vulnerability and the need for resilience in cities in a global climate change context. J. Clean. Prod. 2018, 171, 1140–1149. [Google Scholar] [CrossRef]
- Zhao, L.; Oppenheimer, M.; Zhu, Q.; Baldwin, J.W.; Ebi, K.; Bou-Zeid, E.; Guan, K.; Liu, X. Interactions between urban heat islands and heat waves. Environ. Res. Lett. 2018, 13, 034003. [Google Scholar] [CrossRef]
- García, D.H. Analysis of Urban Heat Island and Heat Waves Using Sentinel-3 Images: A Study of Andalusian Cities in Spain. Earth Syst. Environ. 2022, 6, 199–219. [Google Scholar] [CrossRef] [PubMed]
- Cecilia, A.; Casasanta, G.; Petenko, I.; Conidi, A.; Argentini, S. Measuring the urban heat island of Rome through a dense weather station network and remote sensing imperviousness data. Urban Clim. 2023, 47, 101355. [Google Scholar] [CrossRef]
- Yoshikada, H.; Tsuchida, M. High levels of winter air pollution under the influence of the urban heat island along the shore of Tokyo Bay. J. Appl. Meteorol. Climatol. 1996, 35, 1804–1813. [Google Scholar] [CrossRef]
- Lai, L.W.; Cheng, W.L. Air quality influences by urban heat island coupled with synoptic weather patterns. Sci. Total Environ. 2009, 407, 2724–2732. [Google Scholar] [CrossRef]
- Zamuda, C.; Bilello, D.E.; Conzelmann, G.E.; Mecray, E.; Satsangi, A.; Tidwell, V.; Walker, B.J. Energy supply, delivery, and demand. In Impacts, Risks, and Adaptation in the United States: Fourth National Climate Assessment; Reidmiller, D.R., Avery, C.W., Easterling, D.R., Kunkel, K.E., Lewis, K.L.M., Maycock, T.K., Stewart, B.C., Eds.; U.S. Global Change Research Program: Washington, DC, USA, 2018; Volume II, pp. 174–201. [Google Scholar]
- Santamouris, M. Recent progress on urban overheating and heat island research. Integrated assessment of the energy, environmental, vulnerability and health impact. Synergies with the global climate change. Energy Build. 2020, 207, 109482. [Google Scholar] [CrossRef]
- Bermejo, L.; Gil-Alana, L.A.; Del Rio, M. Time trends and persistence in PM2.5 in 20 megacities: Evidence for the time period 2018–2020. Environ. Sci. Pollut. Res. 2022, 30, 5603–5620. [Google Scholar] [CrossRef]
- Singh, M.; Sharston, R. Quantifying the dualistic nature of urban heat Island effect (UHI) on building energy consumption. Energy Build. 2022, 255, 111649. [Google Scholar] [CrossRef]
- Hester, E.T.; Bauman, K.S. Stream and retention pond thermal response to heated summer runoff from urban impervious surfaces. J. Am. Water Resour. Assoc. 2013, 49, 328–342. [Google Scholar] [CrossRef]
- Somers, K.A.; Berhnardt, E.S.; McGlynn, B.L.; Urban, D.L. Downstream dissipation of storm flow heat pulses: A case study and its landscape-level implications. J. Am. Water Resour. Assoc. 2016, 52, 281–297. [Google Scholar] [CrossRef]
- Environmental Protection Agency. Heat Island Impacts. Last Updated on 2 September 2022. Available online: https://www.epa.gov/heatislands/heat-island-impacts (accessed on 21 January 2023).
- Simperler, L.; Ertl, T.; Matzinger, A. Spatial Compatibility of Implementing Nature-Based Solutions for Reducing Urban Heat Islands and Stormwater Pollution. Sustainability 2020, 12, 5967. [Google Scholar] [CrossRef]
- Milan, B.F.; Creutzig, F. Reducing urban heat wave risk in the XXI century. Curr. Opin. Environ. Sustain. 2015, 14, 221–231. [Google Scholar] [CrossRef]
- Buchin, O.; Hoelscher, M.-T.; Meier, F.; Nehls, T.; Ziegler, F. Evaluation of the health-risk reduction potential of countermeasures to urban heat islands. Energy Build. 2016, 114, 27–37. [Google Scholar] [CrossRef]
- Heaviside, C.; Macintyre, H.; Vardoulakis, S. The Urban Heat Island: Implications for Health in a Changing Environment. Curr. Environ. Health Rep. 2017, 4, 296–305. [Google Scholar] [CrossRef] [PubMed]
- Vaidyanathan, A.; Malilay, P.J.; Schramm, P.; Saha, S. Heat-related deaths—United States, 2004–2018. Morb. Mortal. Wkly Rep. 2020, 69, 729–734. [Google Scholar] [CrossRef] [PubMed]
- Tewari, K.; Tewari, M.; Niyogi, D. Need for considering urban climate change factors on stroke, neurodegenerative diseases, and mood disorders studies. Comput. Urban Sci. 2023, 3, 4. [Google Scholar] [CrossRef]
- Thornes, J.E.; Fisher, P.; Rayment-Bishop, T.; Smith, C. Ambulance call-outs and response times in Birmingham and the impact of extreme weather and climate change. Emerg. Med. 2013, 31, 220–228. [Google Scholar] [CrossRef] [PubMed]
- Wald, A. Emergency Department Visits and Costs for Heat-Related Illness Due to Extreme Heat or Heat Waves in the United States: An Integrated Review. Nurs. Econ. 2019, 37, 35. [Google Scholar]
- Venter, Z.S.; Krog, N.H.; Barton, D.N. Linking green infrastructure to urban heat and human health risk mitigation in Oslo, Norway. Sci. Total Environ. 2020, 709, 136193. [Google Scholar] [CrossRef]
- Tong, S.; Prior, J.; McGregor, G.; Shi, X.; Kinney, P. Urban heat: An increasing threat to global health. BMJ 2021, 375, n2467. [Google Scholar] [CrossRef]
- Reid, C.E.; Snowden, J.M.; Kontgis, C.; Tager, I.B. The role of ambient ozone in epidemiologic studies of heat-related mortality, Environ. Health Perspect. 2012, 120, 1627–1630. [Google Scholar] [CrossRef] [PubMed]
- Wang, T.; Xue, L.; Brimblecombe, P.; Lam, Y.F.; Li, L.; Zhang, L. Ozone pollution in China: A review of concentrations, meteorological influences, chemical precursors, and effects. Sci. Total Environ. 2017, 575, 1582–1596. [Google Scholar] [CrossRef] [PubMed]
- Harlan, S.; Brazel, A.J.; Darrel Jenerette, G.; Jones, N.S.; Larsen, L.; Prashad, L.; Stefanov, W.L. In the shade of affluence: The inequitable distribution of the urban heat island. Res. Soc. Probl. Public Policy 2007, 15, 173–202. [Google Scholar]
- Taylor, J.; Wilkinson, P.; Davies, M.; Armstrong, B.; Chalabi, Z.; Mavrogianni, A.; Bohnenstengel, S.I. Mapping the effects of urban heat island, housing, and age on excess heat-related mortality in London. Urban Clim. 2015, 14, 517–528. [Google Scholar] [CrossRef]
- Heaviside, C.; Vardoulakis, S.; Cai, X.M. Attribution of mortality to the urban heat island during heatwaves in the West Midlands, UK. Environ. Health 2016, 15, S27. [Google Scholar] [CrossRef] [PubMed]
- Dialesandro, J.; Brazil, N.; Wheeler, S.; Abunnasr, Y. Dimensions of Thermal Inequity: Neighborhood Social Demographics and Urban Heat in the Southwestern U.S. Int. J. Environ. Res. Public Health 2021, 18, 941. [Google Scholar] [CrossRef] [PubMed]
- Hsu, A.; Sheriff, G.; Chakraborty, T.; Manya, D. Disproportionate exposure to urban heat island intensity across major US cities. Nat. Commun. 2021, 12, 2721. [Google Scholar] [CrossRef] [PubMed]
- Benz, S.A.; Burney, J.A. Widespread race and class disparities in surface urban heat extremes across the United States. Earth’s Future 2021, 9, e2021EF002016. [Google Scholar]
- Ebi, K.; Meehl, G.; Bachelet, D.; Twilley, R.R.; Boesch, D.F. The Heat is on: Climate Change and Heatwaves in the Midwest. (Regional Impacts of Climate Change: Four Case Studies in the United States); VAPew Center on Global Climate Change: Arlington, TX, USA, 2007; Available online: https://www.c2es.org/wp-content/uploads/2007/12/regional-impacts-climate-change-four-case-studies-united-states.pdf (accessed on 4 May 2022).
- Oudin Åström, D.; Bertil, F.; Joacim, R. Heat wave impact on morbidity and mortality in the elderly population: A review of recent studies. Maturitas 2011, 69, 99–105. [Google Scholar] [CrossRef]
- Gamble, J.L.; Hurley, B.J.; Schultz, P.A.; Jaglom, W.S.; Krishnan, N.; Harris, M. Climate Change and Older Americans: State of the Science. Environ. Health Perspect. 2013, 121, 15–22. [Google Scholar] [CrossRef]
- Oudin Åström, D.; Schifano, P.; Asta, F.; Lallo, A.; Michelozzi, P.; Rocklöv, J.; Forsberg, B. The effect of heat waves on mortality in susceptible groups: A cohort study of a mediterranean and a northern European City. Environ. Health 2015, 14, 30. [Google Scholar] [CrossRef]
- Cleland, S.E.; Steinhardt, W.; Neas, L.M.; West, J.J.; Rappold, A.G. Urban heat island impacts on heat-related cardiovascular morbidity: A time series analysis of older adults in US metropolitan areas. Environ. Int. 2023, 178, 108005. [Google Scholar] [CrossRef] [PubMed]
- Gamble, J.L.; Ebi, K.L.; Sussman, F.G.; Wilbanks, T.J.; Reid, C.; Thomas, J.V.; Weaver, C.P.; Harris, M.; Freed, R. Executive Summary. In Analyses of the Effects of Global Change on Human Health and Welfare and Human Systems; Gamble, J.L., Ed.; U.S. Environmental Protection Agency: Washington, DC, USA, 2008; p. ES-1-14. [Google Scholar]
- Ebi, K.L.; Balbus, J.; Kinney, P.L.; Lipp, E.; Mills, D.; O’Neill, M.S.; Wilson, M. Effects of global change on human health. In Analyses of the Effects of Global Change on Human Health and Welfare and Human Systems; Gamble, J.L., Ed.; Synthesis and Assessment Product 4.6; U.S. Environmental Protection Agency: Washington, DC, USA, 2008; pp. 39–87. [Google Scholar]
- Vardoulakis, S.; Dear, K.; Wilkinson, P. Challenges and opportunities for urban environmental health and sustainability: The HEALTHY-POLIS initiative. Environ. Health 2016, 15, S30. [Google Scholar] [CrossRef] [PubMed]
- Gronlund, C.J. Racial and socioeconomic disparities in heat-related health effects and their mechanisms: A review. Curr. Environ. Health Rep. 2014, 1, 165–173. [Google Scholar] [CrossRef] [PubMed]
- Moghadamnia, M.T.; Ardalan, A.; Mesdaghinia, A.; Keshtkar, A.; Naddafi, K.; Yekaninejad, M.S. Ambient temperature and cardiovascular mortality: A systematic review and meta-analysis. PeerJ 2017, 5, e3574. [Google Scholar] [CrossRef] [PubMed]
- Berger, T.; Chundeli, F.A.; Pandey, R.U.; Jain, M.; Tarafdar, A.K.; Ramamurthy, A. Low-income residents’ strategies to cope with urban heat. Land Use Policy 2022, 119, 106192. [Google Scholar] [CrossRef]
- Asimakopoulos, D.A.; Santamouris, M.; Farrou, I.; Laskari, M.; Saliari, M.; Zanis, G.; Giannakidis, G.; Tigas, K.; Kapsomenakis, J.; Douvis, C.; et al. Modelling the energy demand projection of the building sector in Greece in the 21st century. Energy Build. 2012, 49, 488–498. [Google Scholar] [CrossRef]
- Santamouris, M.; Kolokotsa, D. On the impact of urban overheating and extreme climatic conditions on housing, energy, comfort and environmental quality of vulnerable population in Europe. Energy Build. 2015, 98, 125–133. [Google Scholar] [CrossRef]
- Gouveia, J.P.; Seixas, J.; Long, G. Mining households’ energy data to disclose fuel poverty: Lessons for Southern Europe. J. Clean. Prod. 2018, 178, 534–550. [Google Scholar] [CrossRef]
- Battista, G.; Evangelisti, L.; Guattari, C.; Roncone, M.; Constantinos, A.B. Space-time estimation of the urban heat island in Rome (Italy): Overall assessment and effects on the energy performance of buildings. Build Environ. 2023, 228, 109878. [Google Scholar] [CrossRef]
- Cutter, S.L.; Boruff, B.J.; Shirley, W.L. Social Vulnerability to Environmental Hazards. Soc. Sci. Q. 2003, 84, 242–261. [Google Scholar] [CrossRef]
- Grambsch, A.; Menne, B. Adaptation and adaptive capacity in the public health context. In Climate Change and Human Health: Risks and Responses; McMichael, A.J., Campbell-Lendrum, D.H., Corvalan, C.F., Ebi, K.L., Githeko, A., Scheraga, J.D., Woodward, A., Eds.; World Health Organization: Geneva, Switzerland, 2003; pp. 220–236. [Google Scholar]
- Browning, C.R.; Wallace, D.; Feinberg, S.L.; Cagney, K.A. Neighborhood Social Processes, Physical Conditions, and Disaster-Related Mortality: The Case of the 1995 Chicago Heat Wave. Am. Sociol. Rev. 2006, 71, 661–678. [Google Scholar] [CrossRef]
- Semenza, J.C.; Rubin, C.H.; Falter, K.H.; Selanikio, J.D.; Flanders, W.D.; Howe, H.L.; Wilhelm, J.L. Heat-related deaths during the July 1995 heat wave in Chicago. N. Engl. J. Med. 1996, 335, 84–90. [Google Scholar] [CrossRef] [PubMed]
- Adger, W.N. Social Capital, Collective Action, and Adaptation to Climate Change. Econ. Geogr 2003, 79, 387–404. [Google Scholar] [CrossRef]
- Fouillet, A.; Rey, G.; Wagner, V.; Laaidi, K.; Empereur-Bissonnet, P.; Le Tertre, A.; Frayssinet, P.; Bessemoulin, P.; Laurent, F.; De Crouy-Chanel, P.; et al. Has the impact of heat waves on mortality changed in France since the European heat wave of summer 2003? A study of the 2006 heat wave. Int. J. Epidemiol. 2008, 37, 309–317. [Google Scholar] [CrossRef] [PubMed]
- Rohat, G.; Wilhelmi, O.; Flacke, J.; Monaghan, A.; Gao, J.; van Maarseveen, M.; Dao, H. Assessing urban heat-related adaptation strategies under multiple futures for a major US city. Clim. Change 2021, 164, 61. [Google Scholar] [CrossRef]
- Oke, T.R. City size and the urban heat island. Atmos. Environ. 1973, 7, 769–779. [Google Scholar] [CrossRef]
- Park, H.S. Features of the heat island in Seoul and its surrounding cities. Atmos. Environ. 1986, 20, 1859–1866. [Google Scholar] [CrossRef]
- Ellena, M.; Breil, M.; Soriani, S. The heat-health nexus in the urban context: A systematic literature review exploring the socio-economic vulnerabilities and built environment characteristics. Urban Clim. 2020, 34, 100676. [Google Scholar] [CrossRef]
- National Oceanic and Atmospheric Administration. U.S. Climate Normals 2020: U.S. Monthly Climate Normals (1991–2020). 2021. Available online: https://www.ncei.noaa.gov/access/services/data/v1?dataset=normals-monthly-1991-2020&startDate=0001-01-01&endDate=9996-12-31&stations=USW00013876&format=pdf (accessed on 5 July 2022).
- The Encyclopedia of Alabama (EOA). 2007. Available online: https://encyclopediaofalabama.org/category/geography-environment (accessed on 22 July 2022).
- Intergovernmental Panel on Climate Change. Climate Change 2001: The Scientific Basis. Contribution of Working Group I to the Third Assessment Report of the Intergovernmental Panel on Climate Change; Houghton, J.T., Ding, Y., Griggs, D.J., Noguer, M., van der Linden, P.J., Dai, X., Maskell, K., Johnson, C.A., Eds.; Cambridge University Press: Cambridge, UK; New York, NY, USA, 2001. [Google Scholar]
- Wolf, T.; McGregor, G.R. The development of a heat wave vulnerability index for London, United Kingdom. Weather Clim. Extrem. 2013, 1, 59–68. [Google Scholar] [CrossRef]
- Loughnan, M.E.; Tapper, N.J.; Phan, T.; Lynch, K.; McInnes, J.A. A Spatial Vulnerability Analysis of Urban Populations during Extreme Heat Events in Australian Capital Cities. National Climate Change Adaptation Research Facility, Gold Coast; National Climate Change Adaptation Research Facility: Southport, QLD, Australia, 2013; 128p. [Google Scholar]
- Manik, T.K.; Syaukat, S. The Impact of Urban Heat Islands: Assessing Vulnerability in Indonesia; Asian Cities Climate Resilience Working Paper Series, 13; International Institute for Environment and Development: London, UK, 2015. [Google Scholar]
- Inostroza, L.; Palme, M.; de la Barrera, F. A heat vulnerability index: Spatial patterns of exposure, sensitivity and adaptive capacity for Santiago de Chile. PLoS ONE 2016, 11, e0162464. [Google Scholar] [CrossRef]
- Fall, S.; Abdalla, E.; Quansah, J.; Franklin, M.J.; Whaley-Omidire, T. County-Level Assessment of Vulnerability to COVID-19 in Alabama. ISPRS Int. J. Geo-Inf. 2022, 11, 320. [Google Scholar] [CrossRef]
- Yang, L.; Huang, C.; Homer, C.; Wylie, B.; Coan, M. An approach for mapping large-area impervious surfaces: Synergistic use of Landsat 7 ETM+ and high spatial resolution imagery. Can. J. Remote Sens. 2003, 29, 230–240. [Google Scholar] [CrossRef]
- Xian, G.; Homer, C.; Dewitz, J.; Fry, J.; Hossain, N.; and Wickham, J. The change of impervious surface area between 2001 and 2006 in the conterminous United States. Photogramm. Eng. Remote Sens. 2011, 77, 758–762. [Google Scholar]
- Homer, C.G.; Dewitz, J.A.; Jin, S.; Xian, G.; Costello, C.; Danielson, P.; Gass, L.; Funk, M.; Wickham, J.; Stehman, S.; et al. Conterminous United States land cover change patterns 2001–2016 from the 2016 National Land Cover Database. ISPRS J. Photogramm. Remote Sens. 2020, 162, 184–199. [Google Scholar] [CrossRef] [PubMed]
- Dewitz, J.; U.S. Geological Survey. National Land Cover Database (NLCD) 2019 Products (Ver. 2.0, June 2021): U.S. Geological Survey Data Release; U.S. Geological Survey: Reston, VA, USA, 2021. [Google Scholar]
- Wickham, J.; Stehman, S.V.; Sorenson, D.G.; Gass, L.; Dewitz, J.A. Thematic Accuracy assessment of the NLCD 2016 land cover for the conterminous United States. Remote Sens. Environ. 2021, 257, 112357. [Google Scholar] [CrossRef]
- ESRI. Esri Demographics. 2021. Available online: https://doc.arcgis.com/en/esri-demographics/reference/essential-vocabulary.htm (accessed on 2 June 2022).
- Viovy, N.; Arino, O.; Belward, A.S. The best index slope extraction (BISE): A method for reducing noise in NDVI time series. Int. J. Remote Sens. 1992, 13, 1585–1590. [Google Scholar] [CrossRef]
- Jonsson, P.; Eklundh, L. TIMESAT-a program for analyzing time-series of satellite sensor data. Comput. Geosci. 2004, 30, 833–845. [Google Scholar] [CrossRef]
- Sun, Q.; Tan, J.; Xu, Y. An ERDAS Image Processing Method for Retrieving LST and Describing Urban Heat Evolution: A Case Study in the Pearl River Delta Region in South China. Environ. Earth Sci. 2009, 59, 1047–1055. [Google Scholar] [CrossRef]
- Rajeshwari, A.; Mani, N.D. Estimation of land surface temperature of Dindigul district using Landsat 8 data. Int. J. Eng. Res. Technol. 2014, 3, 122–126. [Google Scholar]
- Avdan, U.; Jovanovska, G. Algorithm for automated mapping of land surface temperature using LANDSAT 8 satellite data. J. Sens. 2016, 2016, 1480307. [Google Scholar] [CrossRef]
- Rosado, R.M.G.; Guzmán, E.M.A.; Lopez, C.J.E.; Molina, W.M.; García, H.L.C.; Yedra, E.L. Mapping the LST (Land Surface Temperature) with Satellite Information and Software ArcGis. IOP Conf. Ser. Mater. Sci. Eng. 2020, 811, 012045. [Google Scholar] [CrossRef]
- Taloor, A.K.; Manhas, D.S.; Kothyari, G.C. Retrieval of land surface temperature, normalized difference moisture index, normalized difference water index of the Ravi basin using Landsat data. Comput. Geosci. 2021, 9, 100051. [Google Scholar] [CrossRef]
- Sobrino, J.A.; Jiménez-Muñoz, J.C.; Paolini, L. Land surface temperature retrieval from LANDSAT TM 5. Remote Sens. Environ. 2004, 90, 434–440. [Google Scholar] [CrossRef]
- Jolliffe, I.T. Principal Component Analysis, 2nd ed.; Springer: New York, NY, USA, 2002; 488p. [Google Scholar]
- Everitt, B.S.; Hothorn, T. Principal Component Analysis. A Handbook of Statistical Analyses Using R; Chapman and Hall/CRC: London, UK, 2006; 348p. [Google Scholar]
- Kuhn, M. Building Predictive Models in R Using the caret Package. J. Stat. Softw. 2008, 28, 1–26. [Google Scholar] [CrossRef]
- Horn, J.L. A rationale and test for the number of factors in factor analysis. Psychometrika 1965, 30, 179–185. [Google Scholar] [CrossRef] [PubMed]
- Hayton, J.C.; Allen, D.G.; Scarpello, V. Factor Retention Decisions in Exploratory Factor Analysis: A Tutorial on Parallel Analysis. Organ. Res. Methods 2004, 7, 191–205. [Google Scholar] [CrossRef]
- Ledesma, R.D.; Valero-Mora, P. Determining the Number of Factors to Retain in EFA: An easy-to-use computer program for carrying out Parallel Analysis. Pract. Assess. Res. Eval. 2007, 12, 2. [Google Scholar]
- Dinno, A. Implementing Horn’s parallel analysis for principal component analysis and factor analysis. Stata J. 2009, 9, 291–298. [Google Scholar] [CrossRef]
- Çokluk, Ö.; Duygu, K. Using Horn’s Parallel Analysis Method in Exploratory Factor Analysis for Determining the Number of Factors. Educational Sciences. Theory Pract. 2016, 16, 537–551. [Google Scholar]
- Lim, S.; Jahng, S. Determining the number of factors using parallel analysis and its recent variants. Psychol. Methods 2019, 24, 452. [Google Scholar] [CrossRef]
- Anselin, L. Local Indicators of Spatial Association—LISA. Geogr. Anal. 1995, 27, 93–115. [Google Scholar] [CrossRef]
- Nardo, M.; Saisana, M.; Saltelli, A.; Tarantola, S. Tools for Composite Indicators Building; EUR 21682 EN. 2005. JRC31473; European Communities: Brussels, Belgium, 2005. [Google Scholar]
- Dillard, M.K.; Goedeke, T.L.; Lovelace, S.; Orthmeyer, A. Monitoring Well-Being and Changing Environmental Conditions in Coastal Communities: Development of an Assessment Method; Technical Memorandum NOS NCCOS 174; National Oceanic and Atmospheric Administration: Silver Spring, MD, USA, 2013; p. 176. [Google Scholar]
- De la Barrera, F.; Henriquez, C.; Ruiz, V.; Inostroza, L. Urban Parks and Social Inequalities in the Access to Ecosystem Services in Santiago, Chile. Mater. Sci. Eng. 2019, 471, 102042. [Google Scholar]
- Jenerette, G.D.; Miller, G.; Buyantuev, A.; Pataki, D.E.; Gillespie, T.W.; Pincetl, S. Urban vegetation and income segregation in drylands: A synthesis of seven metropolitan regions in the southwestern United States. Environ. Res. Lett. 2013, 8, 044001. [Google Scholar] [CrossRef]
- Voelkel, J.; Hellman, D.; Sakuma, R.; Shandas, V. Assessing vulnerability to urban heat: A study of disproportionate heat exposure and access to refuge by socio-demographic status in Portland, Oregon. Int. J. Environ. Res. Public Health 2018, 15, 640. [Google Scholar] [CrossRef] [PubMed]
- Sharpe, A.; Andrews, B. An Assessment of Weighting Methodologies for Composite Indicators: The Case of the Index of Economic Well-Being; Research Report No. 201-10; Centre for the Study of Living Standards: Ottawa, ON, Canada, 2012; p. 49. [Google Scholar]
- Becker, W.; Saisana, M.; Paruolo, P.; Vandecasteele, I. Weights and importance in composite indicators: Closing the gap. Ecol. Indic. 2017, 80, 12–22. [Google Scholar] [CrossRef]
- Revi, A.; Satterthwaite, D.E.; Aragón-Durand, F.; Corfee-Morlot, J.; Kiunsi, R.B.R.; Pelling, M.; Roberts, D.C.; Solecki, W. Urban areas. In Climate Change 2014: Impacts, Adaptation, and Vulnerability. Part A: Global and Sectoral Aspects. Contribution of Working Group II to the Fifth Assessment Report of the Intergovernmental Panel on Climate Change; Field, C.B., Barros, V.R., Dokken, D.J., Mach, K.J., Mastrandrea, M.D., Bilir, T.E., Chatterjee, M., Ebi, K.L., Estrada, Y.O., Genova, R.C., et al., Eds.; Cambridge University Press: Cambridge, UK; New York, NY, USA, 2014; pp. 535–612. [Google Scholar]
- Zscheischler, J.; Westra, S.; van den Hurk, B.J.J.M.; Seneviratne, S.I.; Ward, P.J.; Pitman, A.; AghaKouchak, A.; Bresch, D.N.; Leonard, M.; Wahl, T.; et al. Future climate risk from compound events. Nat. Clim. Change 2018, 8, 469–477. [Google Scholar] [CrossRef]
- de Ruiter, M.C.; van Loon, A.F. The challenges of dynamic vulnerability and how to assess it. iScience 2022, 25, 104720. [Google Scholar] [CrossRef]
- Hondula, D.M.; Davis, R.E.; Leisten, M.J.; Saha, M.V.; Veazey, L.M.; Wegner, C.R. Fine-scale spatial variability of heat-related mortality in Philadelphia County, USA, from 1983–2008: A case-series analysis. Environ. Health 2012, 11, 16. [Google Scholar] [CrossRef]
- Nicoletti, G.; Scarpetta, S.; Boylaud, O. Summary Indicators of Product Market Regulation with an Extension to Employment Protection Legislation; Economics Department Working Papers, NO. 226, ECO/WKP(99)18; OECD Publishing: Paris, France, 2000. [Google Scholar]
- Tarantola, S.; Liska, R.; Saltelli, A. The Internal Market Index 2004; European Commission, DG Joint Centre: Ispra, Italy, 2004; 22p. [Google Scholar]
- European Commission. Business Climate Indicator. DG ECFIN; European Commission: Brussels, Belgium, 2000; 14p, Available online: https://ec.europa.eu/economy_finance/db_indicators/surveys/documents/studies/bci_presentation_paper.pdf. (accessed on 1 October 2023).
- Yale Center for Environmental Law and Policy—YCELP—Yale University; Center for International Earth Science Information Network—CIESIN—Columbia University; World Economic Forum—WEF; Joint Research Centre—JRC—European Commission. 2005 Environmental Sustainability Index (ESI); NASA Socioeconomic Data and Applications Center (SEDAC): Palisades, NY, USA, 2005; 54p. [Google Scholar]
- Saisana, M. Environmental Sustainability Index (ESI). In Encyclopedia of Quality of Life and Well-Being Research; Michalos, A.C., Ed.; Springer: Dordrecht, The Netherlands, 2014; pp. 1926–1931. [Google Scholar]
- National Institute of Science and Technology Policy (NISTEP). Science and Technology Indicators; NISTEP Report No. 37; NISTEP: Tokyo, Japan, 1995; 14p. [Google Scholar]
- Diez-Roux, A.V.; Kiefe, C.I.; Jacobs, D.R., Jr.; Haan, M.; Jackson, S.A.; Nieto, F.J.; Paton, C.C.; Schulz, R. Area characteristics and individual-level socioeconomic position indicators in three population-based epidemiologic studies. Ann. Epidemiol. 2001, 11, 395–405. [Google Scholar] [CrossRef]
- Saisana, M.; Saltelli, A.; Tarantola, S. Uncertainty and sensitivity analysis techniques as tools for the quality assessment of composite indicators. J. R. Statist. Soc. 2005, 168, 307–323. [Google Scholar] [CrossRef]
- Nardo, M.; Saisana, M.; Saltelli, A.; Tarantola, S.; Hoffmann, A.; Giovannini, E. Handbook on Constructing Composite Indicators: Methodology and User Guide; JRC47008; OECD Publishing: Paris, France, 2008; 162p. [Google Scholar]
Figure 1.
Location of the Alabama cities investigated in this study and associated demographic characteristics (based on 2020 Census).
Figure 1.
Location of the Alabama cities investigated in this study and associated demographic characteristics (based on 2020 Census).
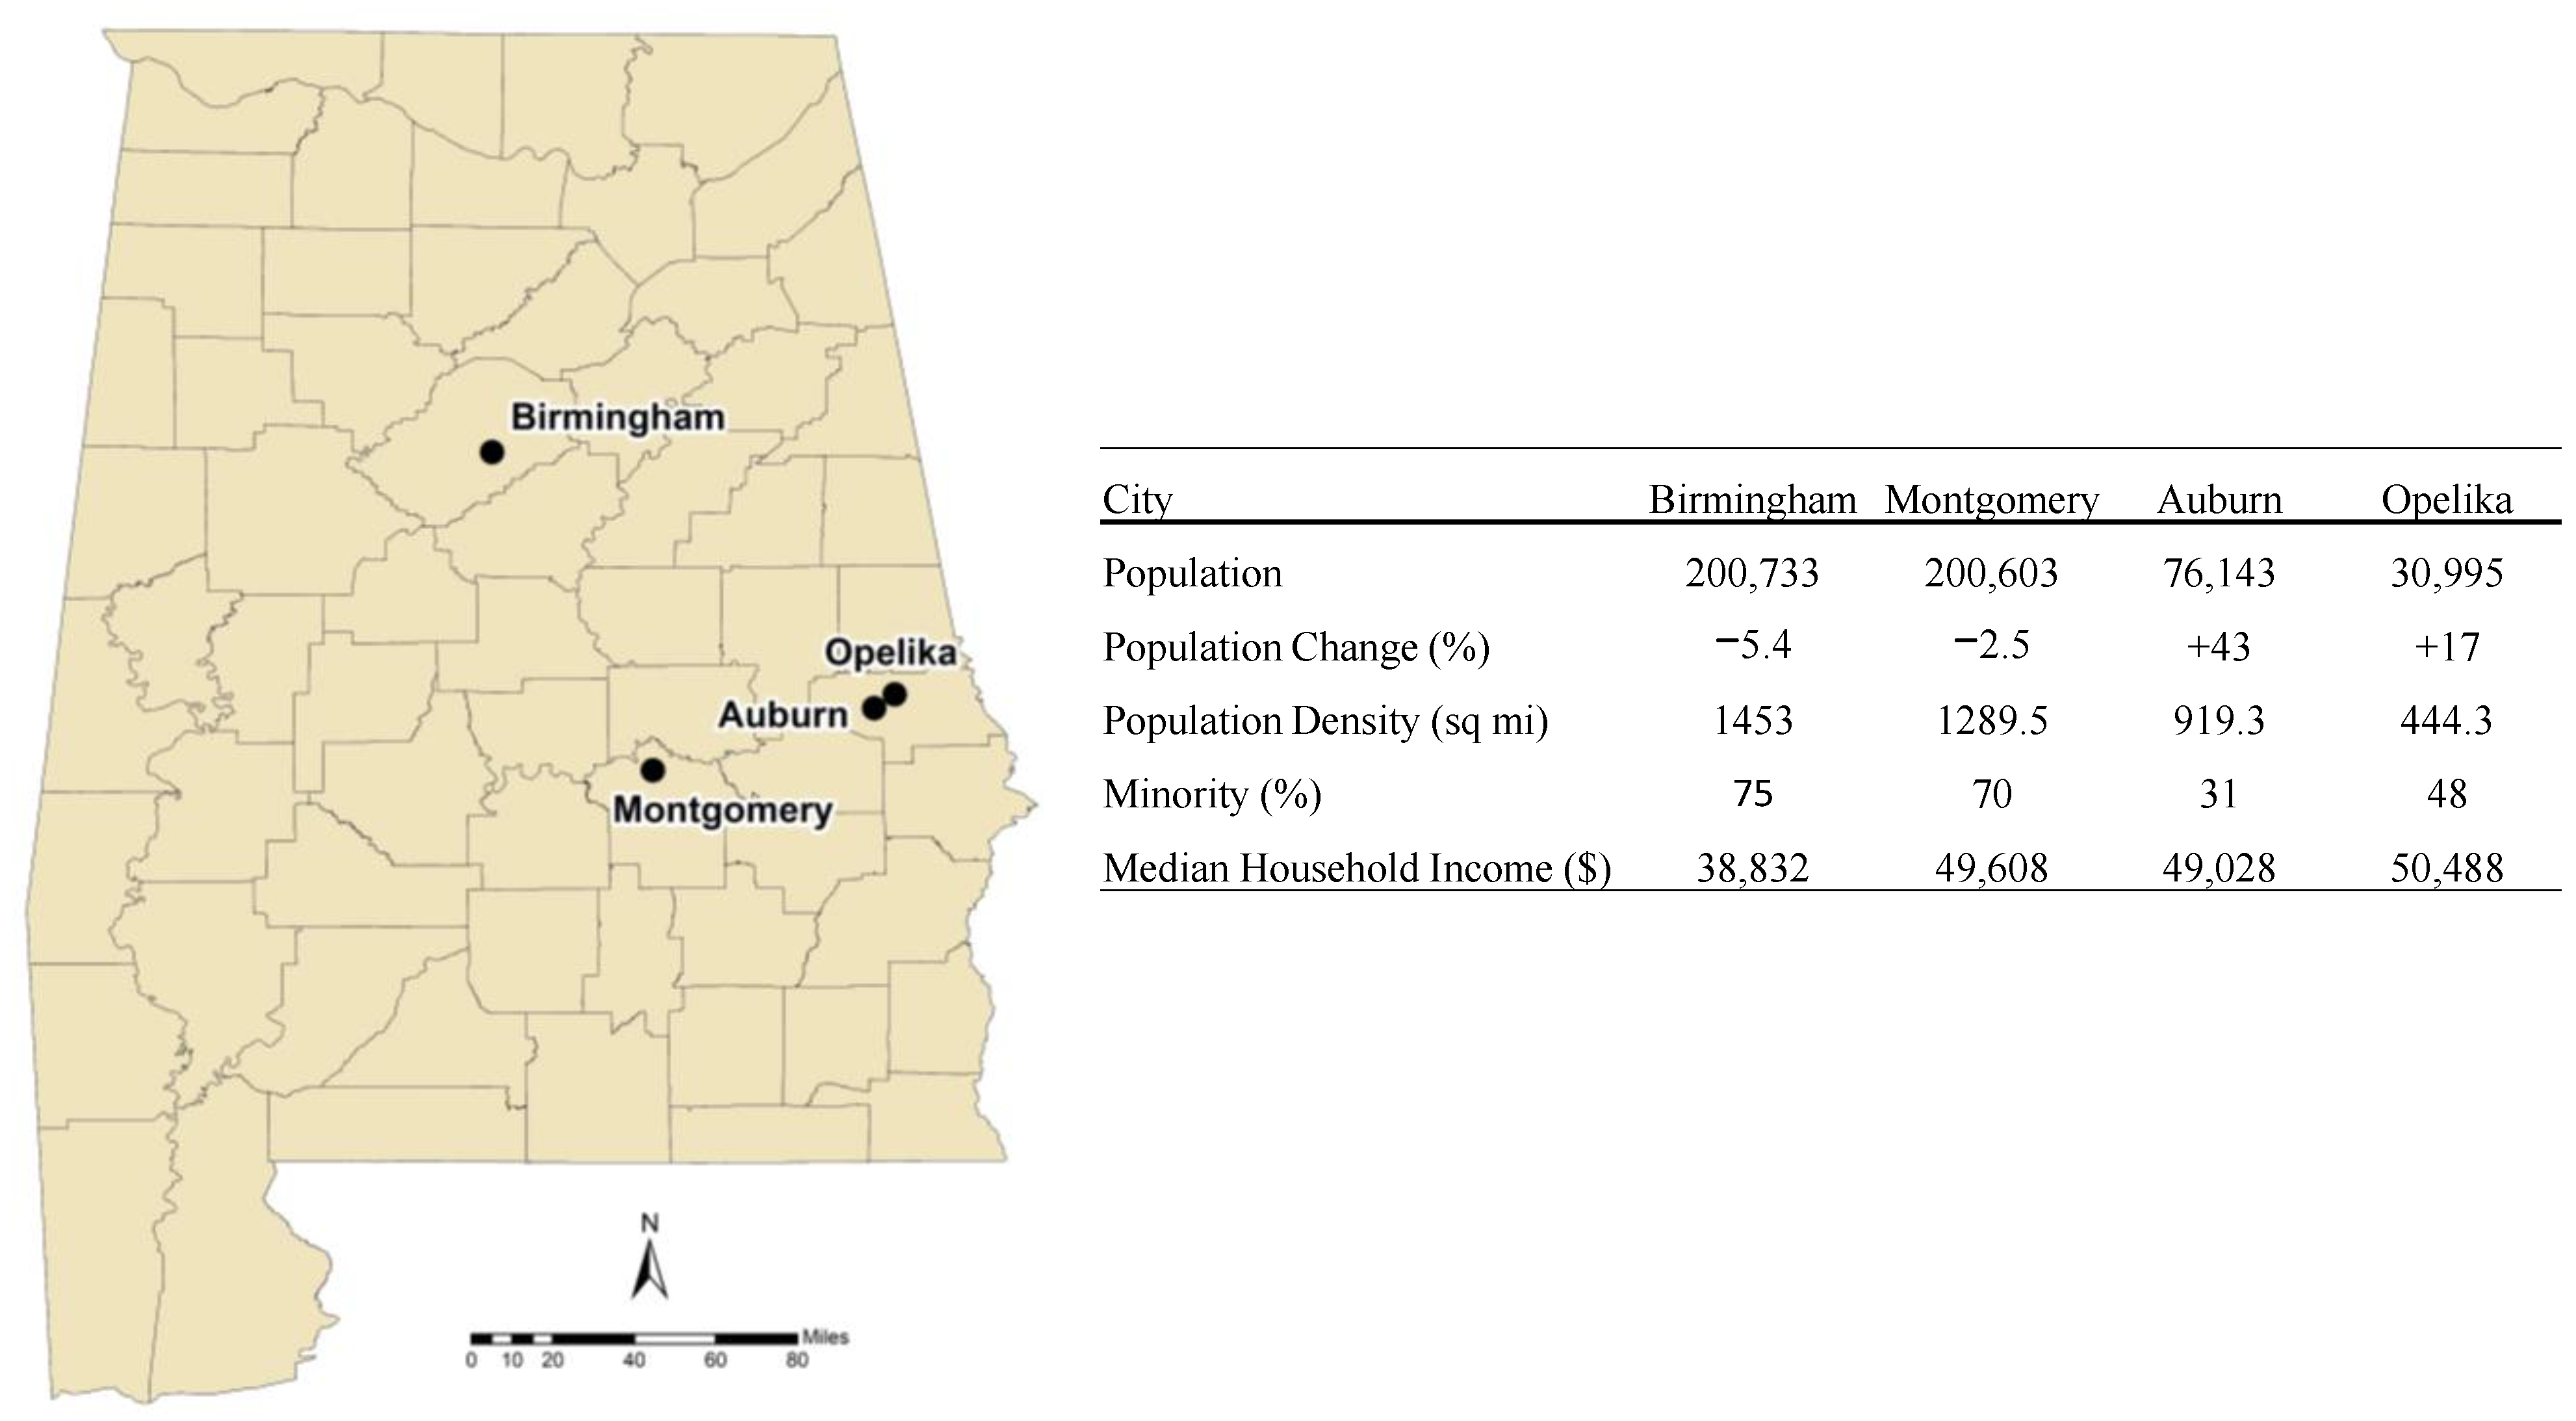
Figure 2.
Methods for LST retrieval from Landsat 8 bands.
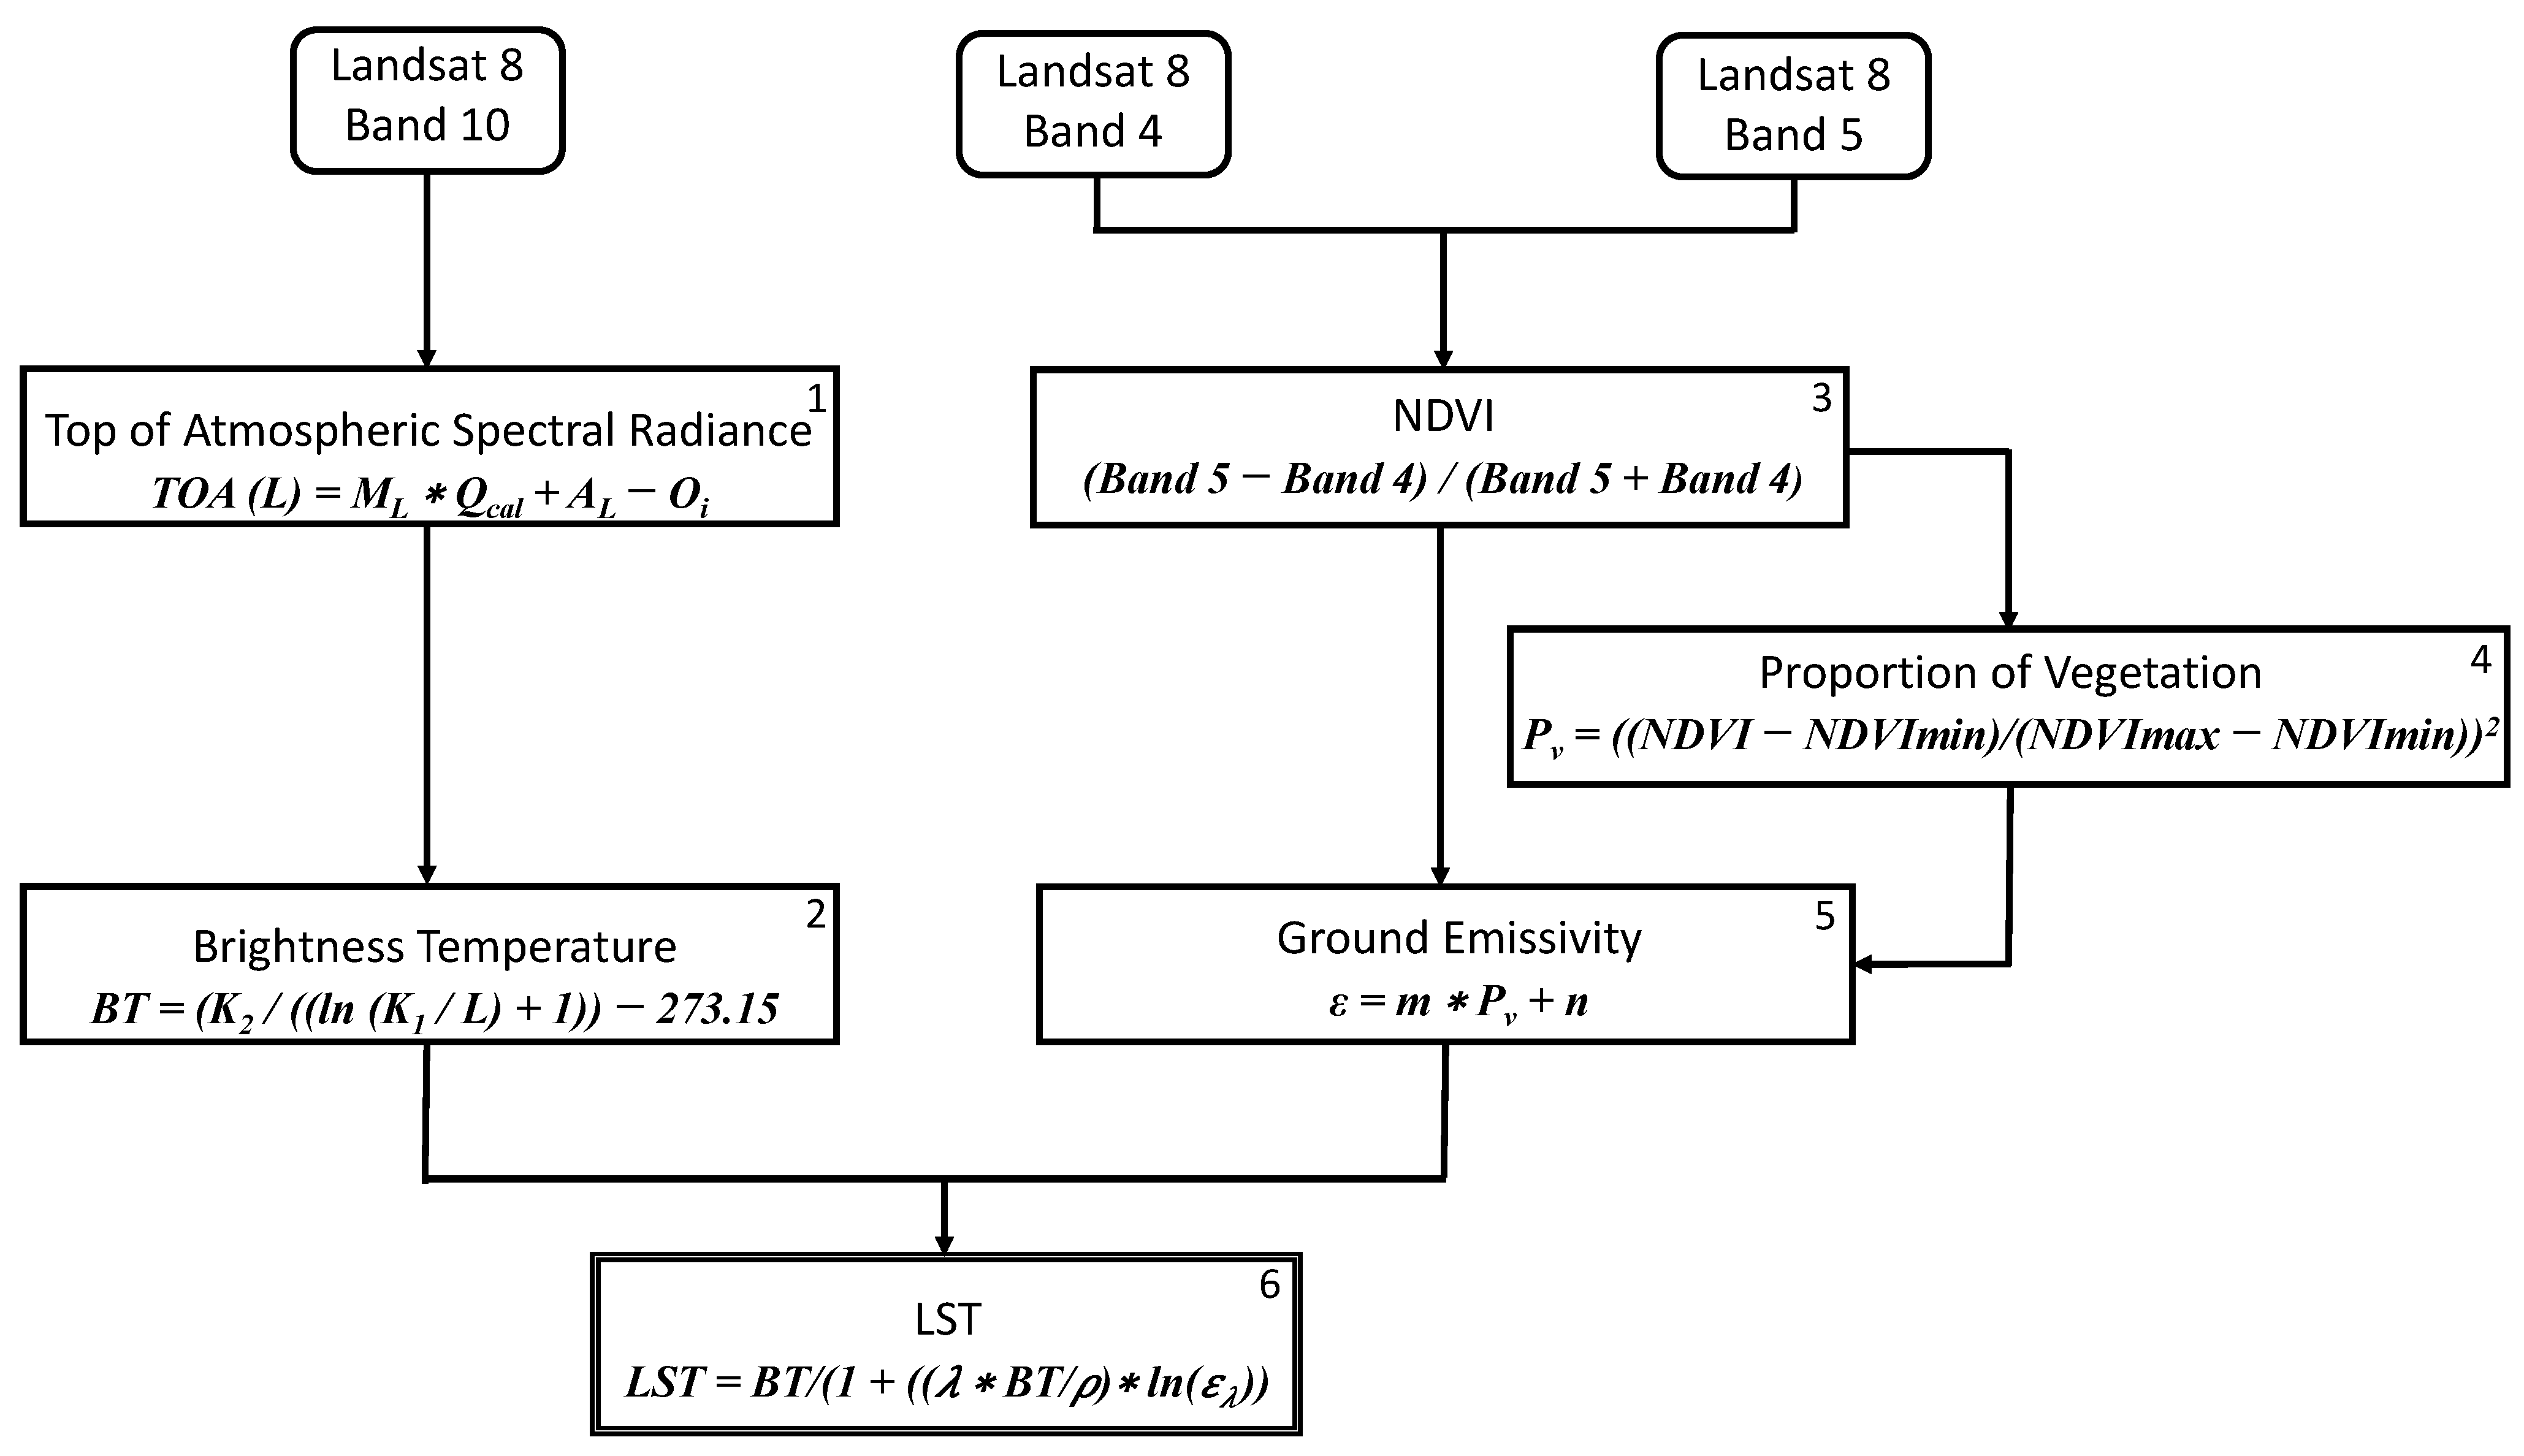
Figure 3.
Statistical and geospatial analysis steps.
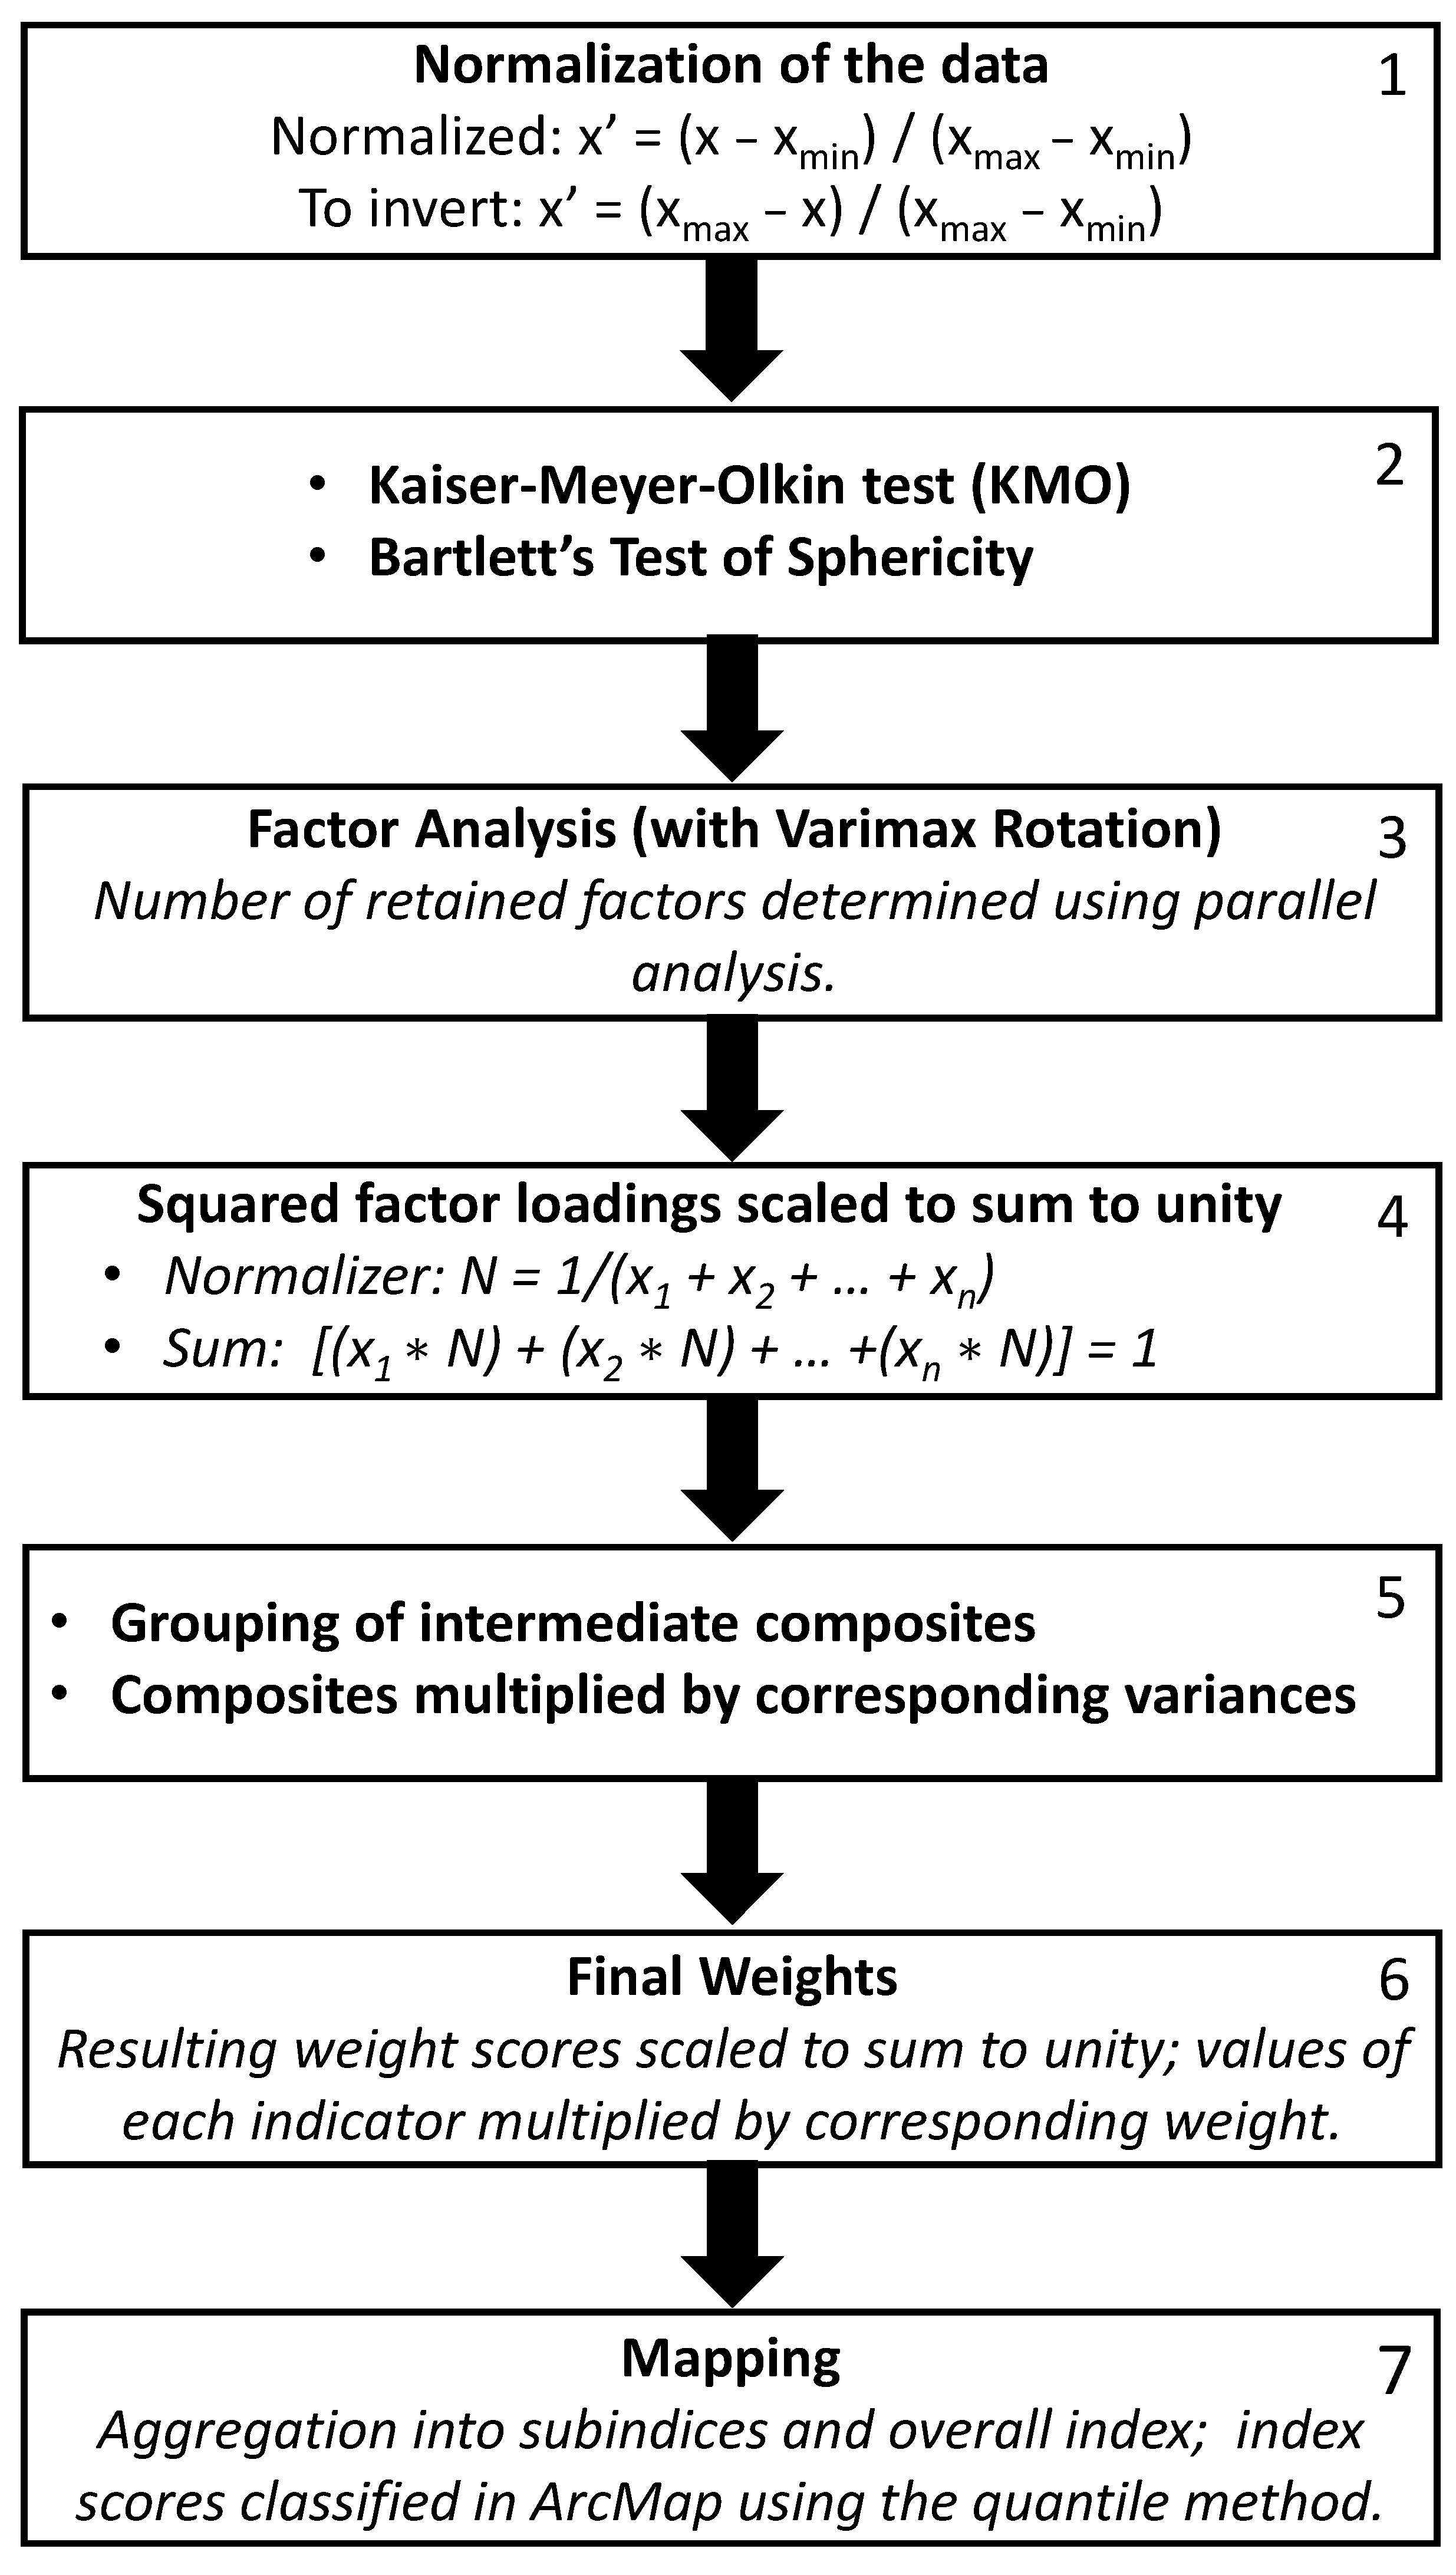
Figure 4.
Spatial distribution of LST over the cities: (a) Birmingham; (b) Montgomery; (c) Auburn-Opelika. Black lines denote the boundaries of block groups.
Figure 4.
Spatial distribution of LST over the cities: (a) Birmingham; (b) Montgomery; (c) Auburn-Opelika. Black lines denote the boundaries of block groups.
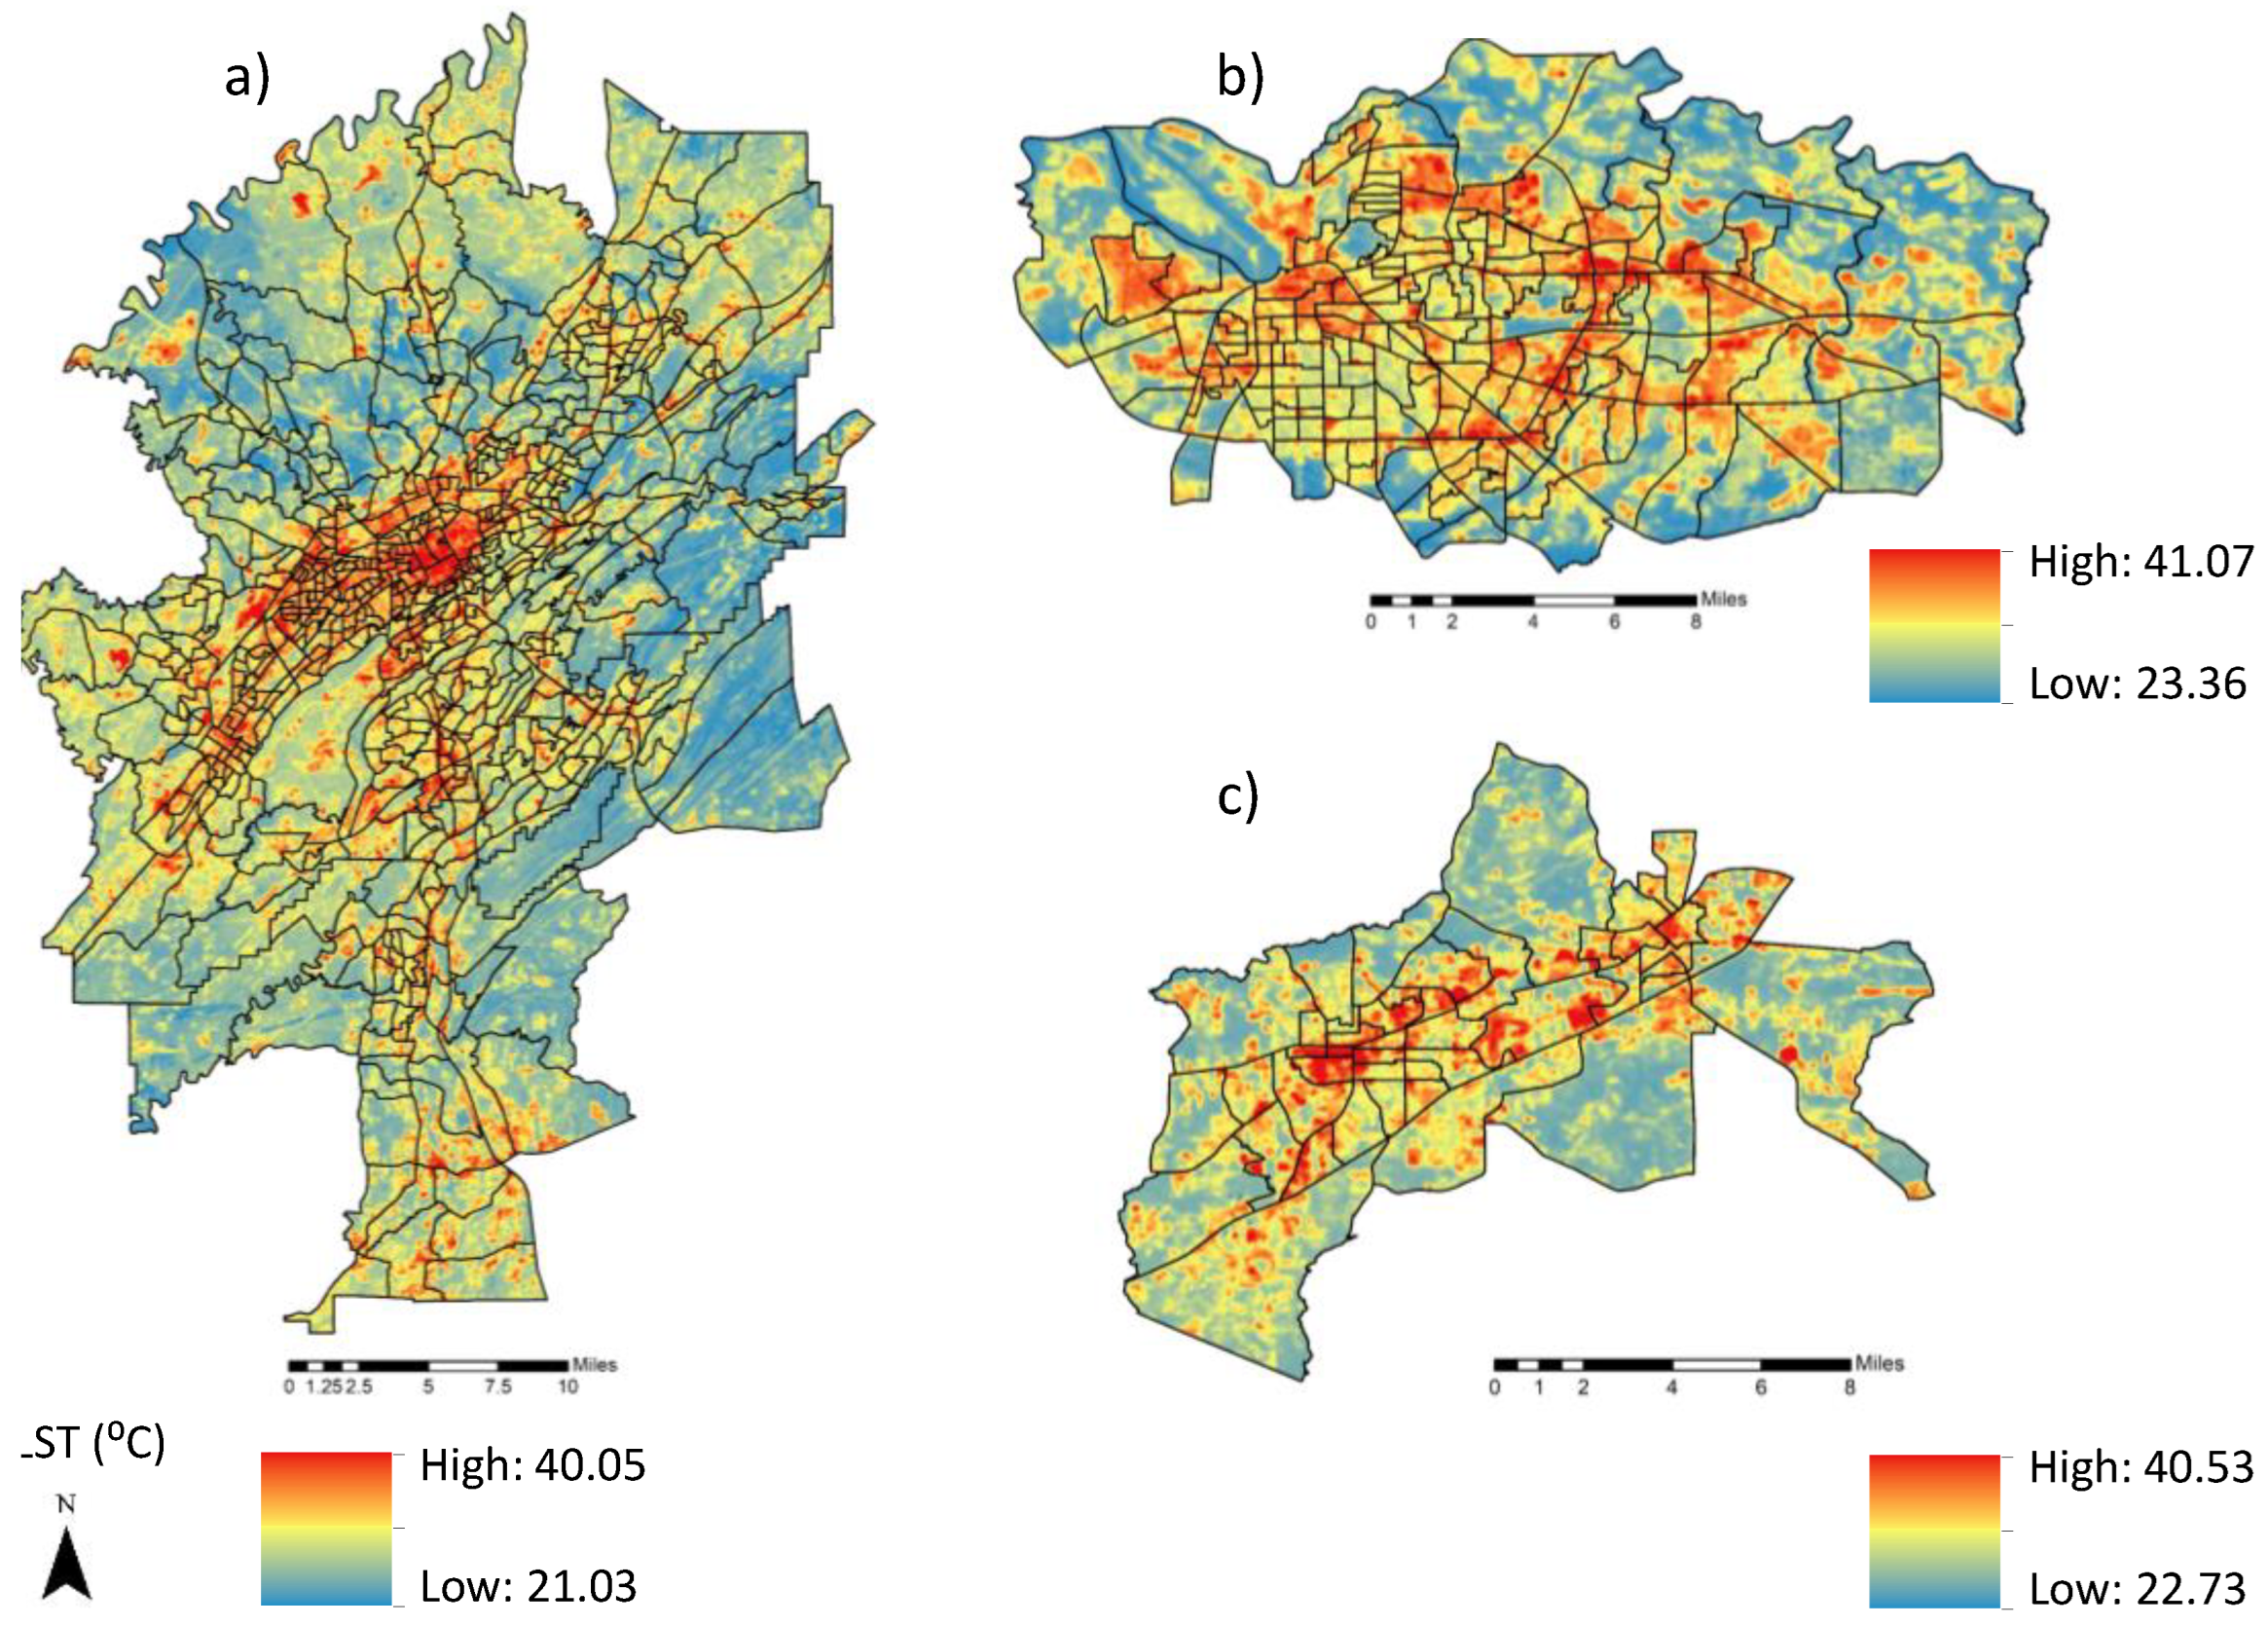
Figure 5.
Urban imperviousness (from the National Land Cover Database—NLCD, 2019) and Normalized Difference Vegetation Index (NDVI, from Landsat 8 composite [images from 2013 to 2021]): (a) Birmingham; (b) Montgomery; (c) Auburn-Opelika. Black lines denote the boundaries of block groups.
Figure 5.
Urban imperviousness (from the National Land Cover Database—NLCD, 2019) and Normalized Difference Vegetation Index (NDVI, from Landsat 8 composite [images from 2013 to 2021]): (a) Birmingham; (b) Montgomery; (c) Auburn-Opelika. Black lines denote the boundaries of block groups.
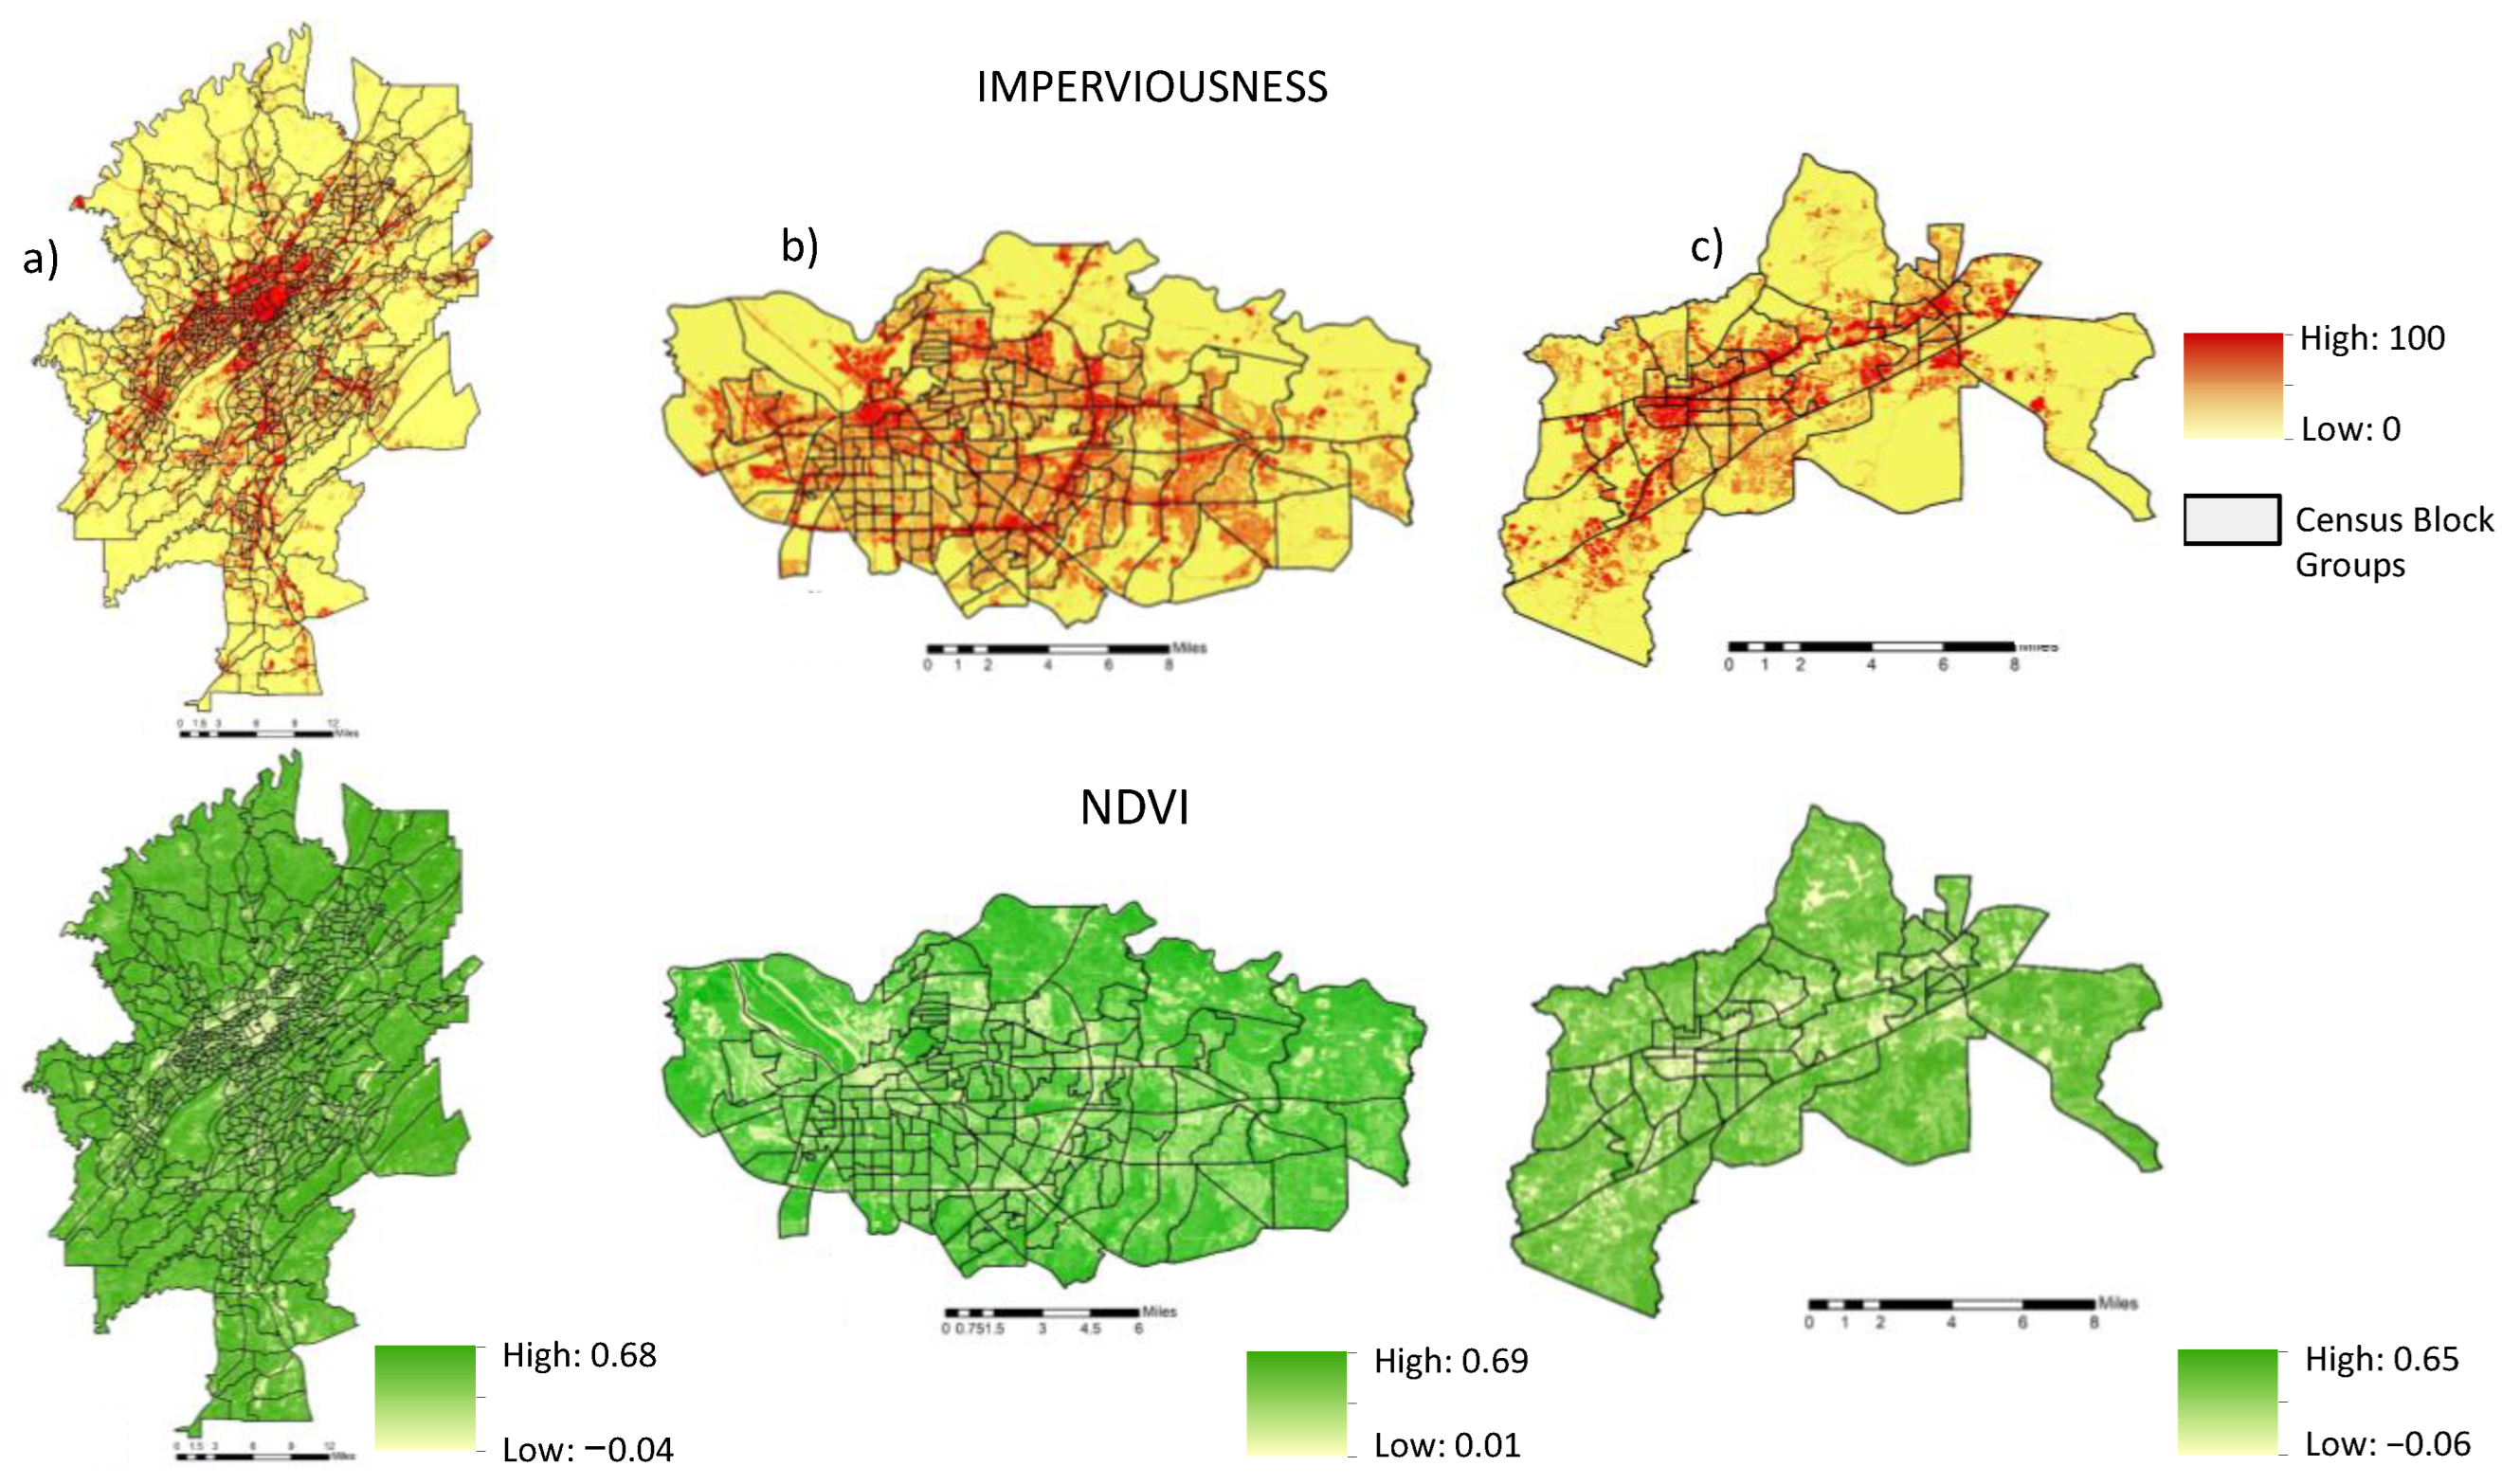
Figure 6.
Population density per square mile at block group level (2020 Census): (a) Birmingham; (b) Montgomery; (c) Auburn-Opelika.
Figure 6.
Population density per square mile at block group level (2020 Census): (a) Birmingham; (b) Montgomery; (c) Auburn-Opelika.
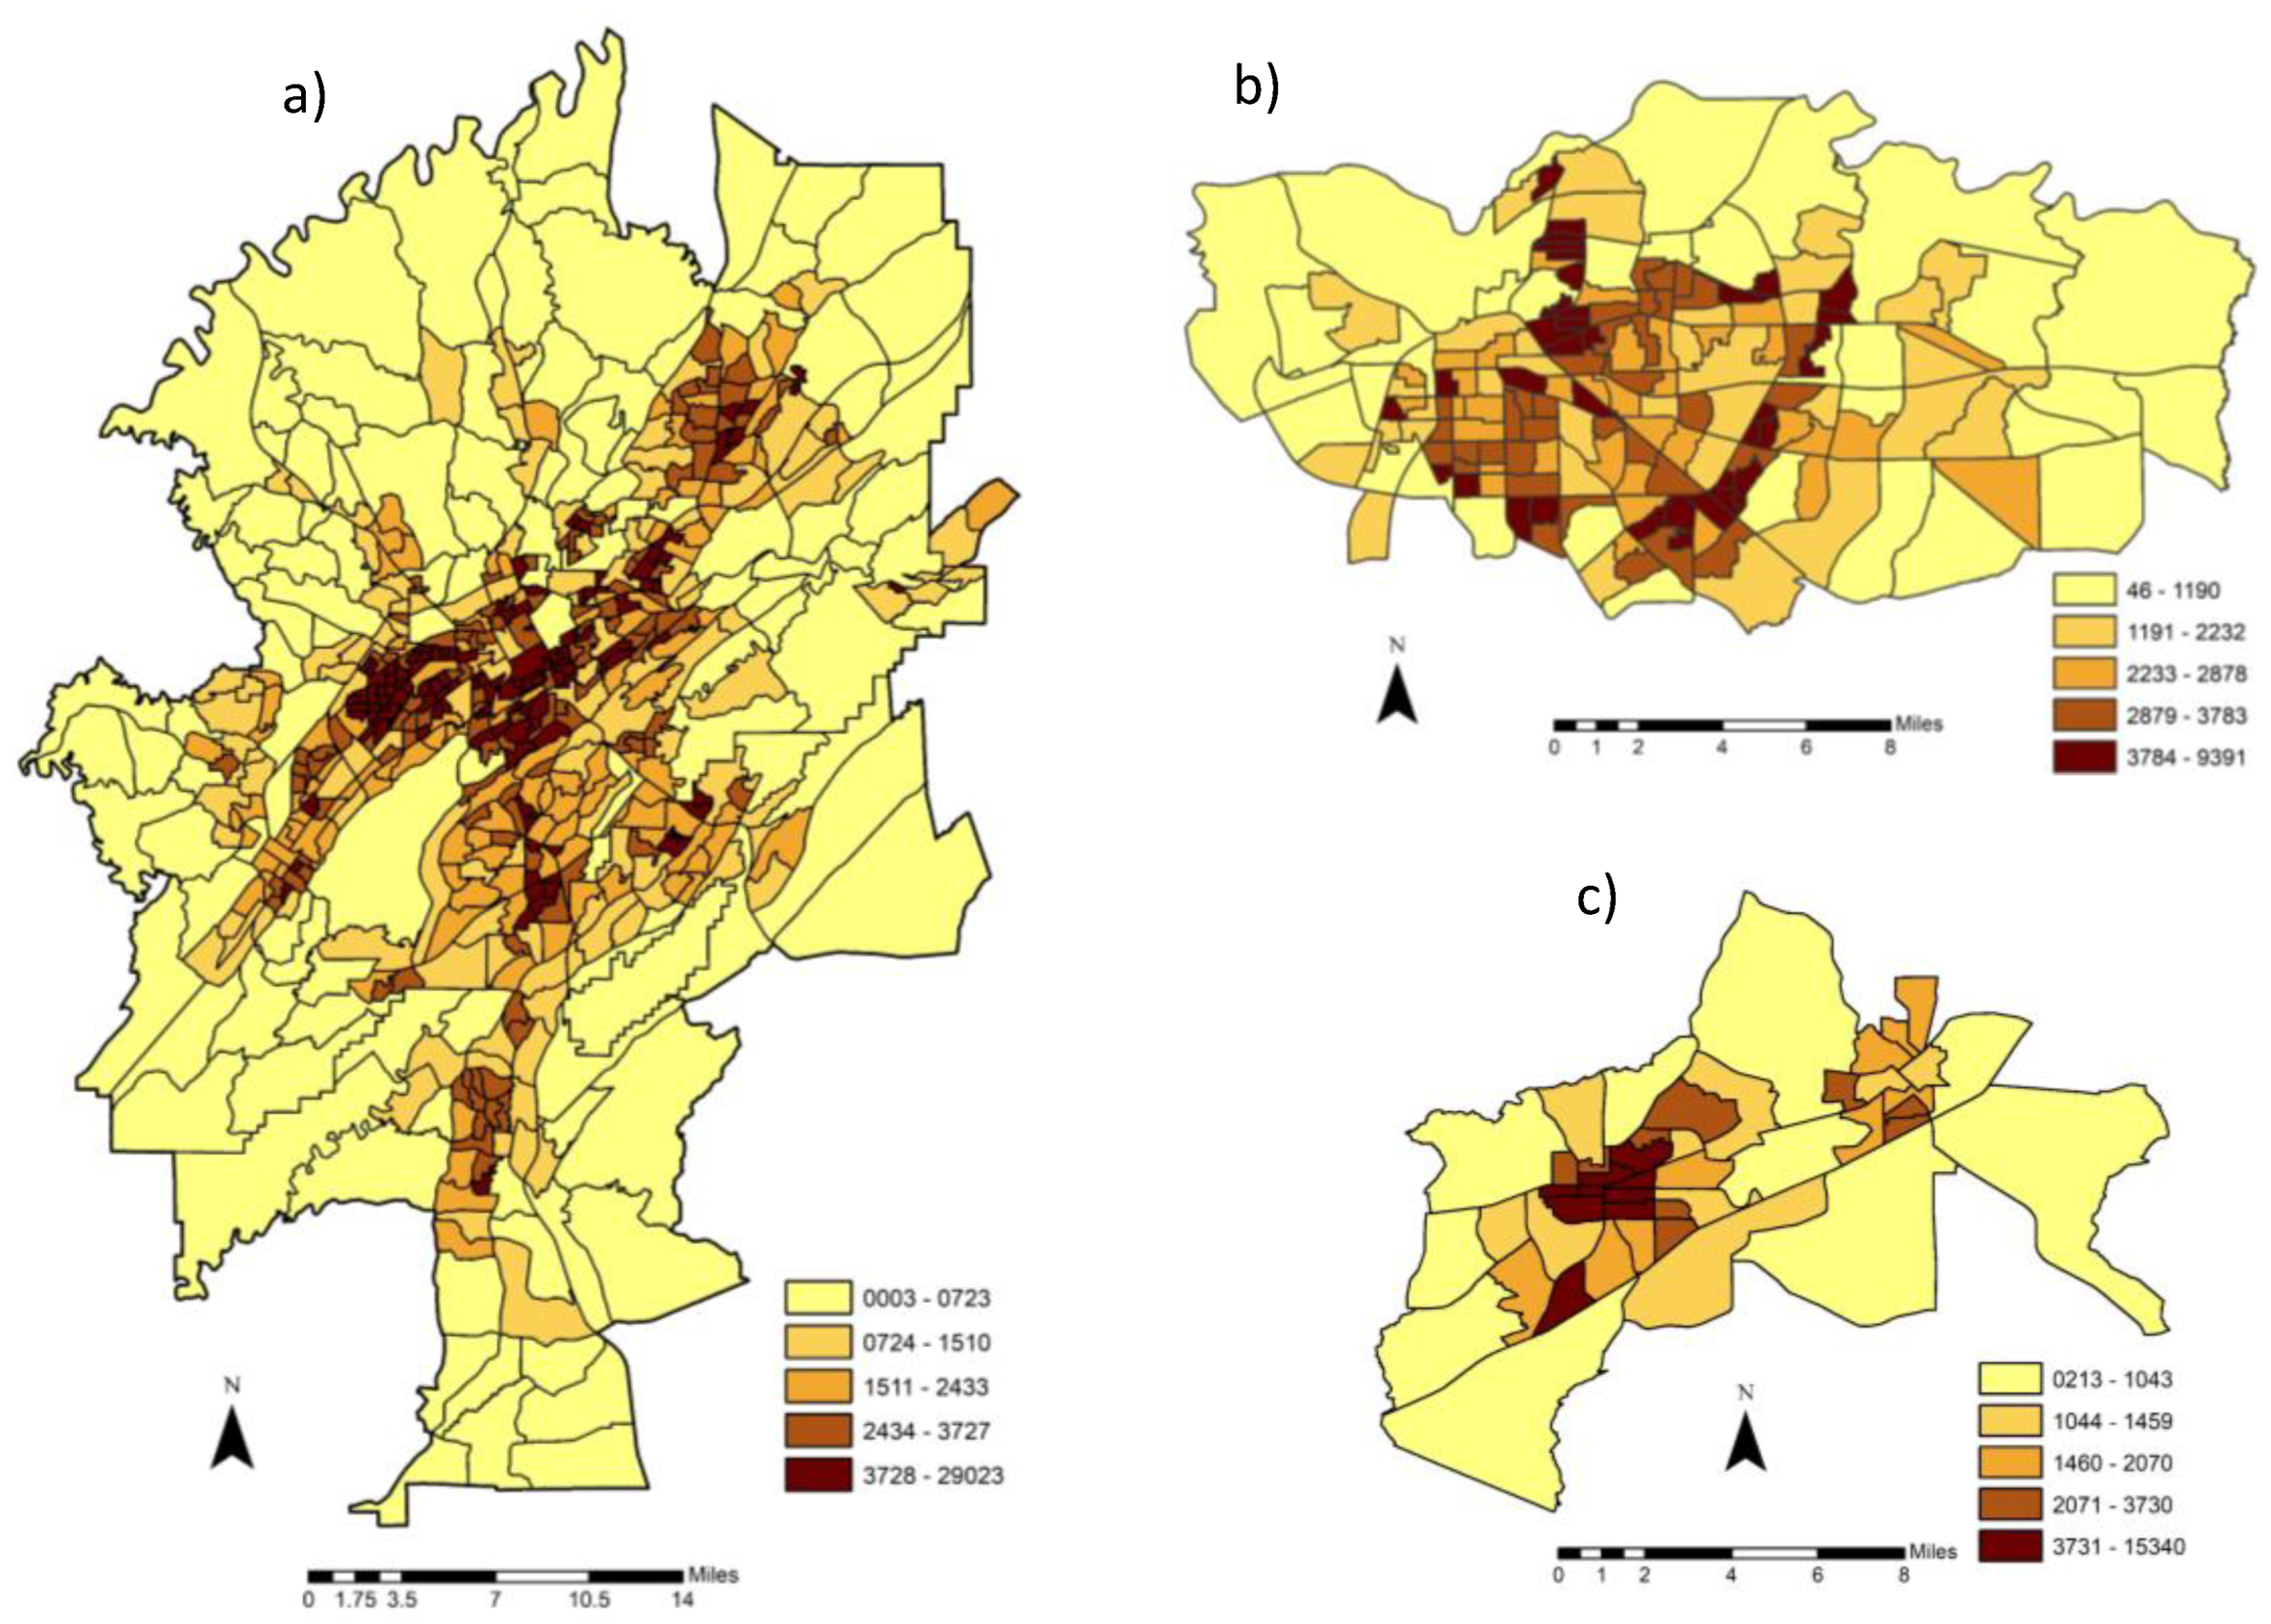
Figure 7.
Spatial distribution of the subindices and vulnerability index scores for the City of Birmingham (Alabama) at block group level: (a) exposure; (b) sensitivity; (c) adaptive capacity; (d) vulnerability index.
Figure 7.
Spatial distribution of the subindices and vulnerability index scores for the City of Birmingham (Alabama) at block group level: (a) exposure; (b) sensitivity; (c) adaptive capacity; (d) vulnerability index.
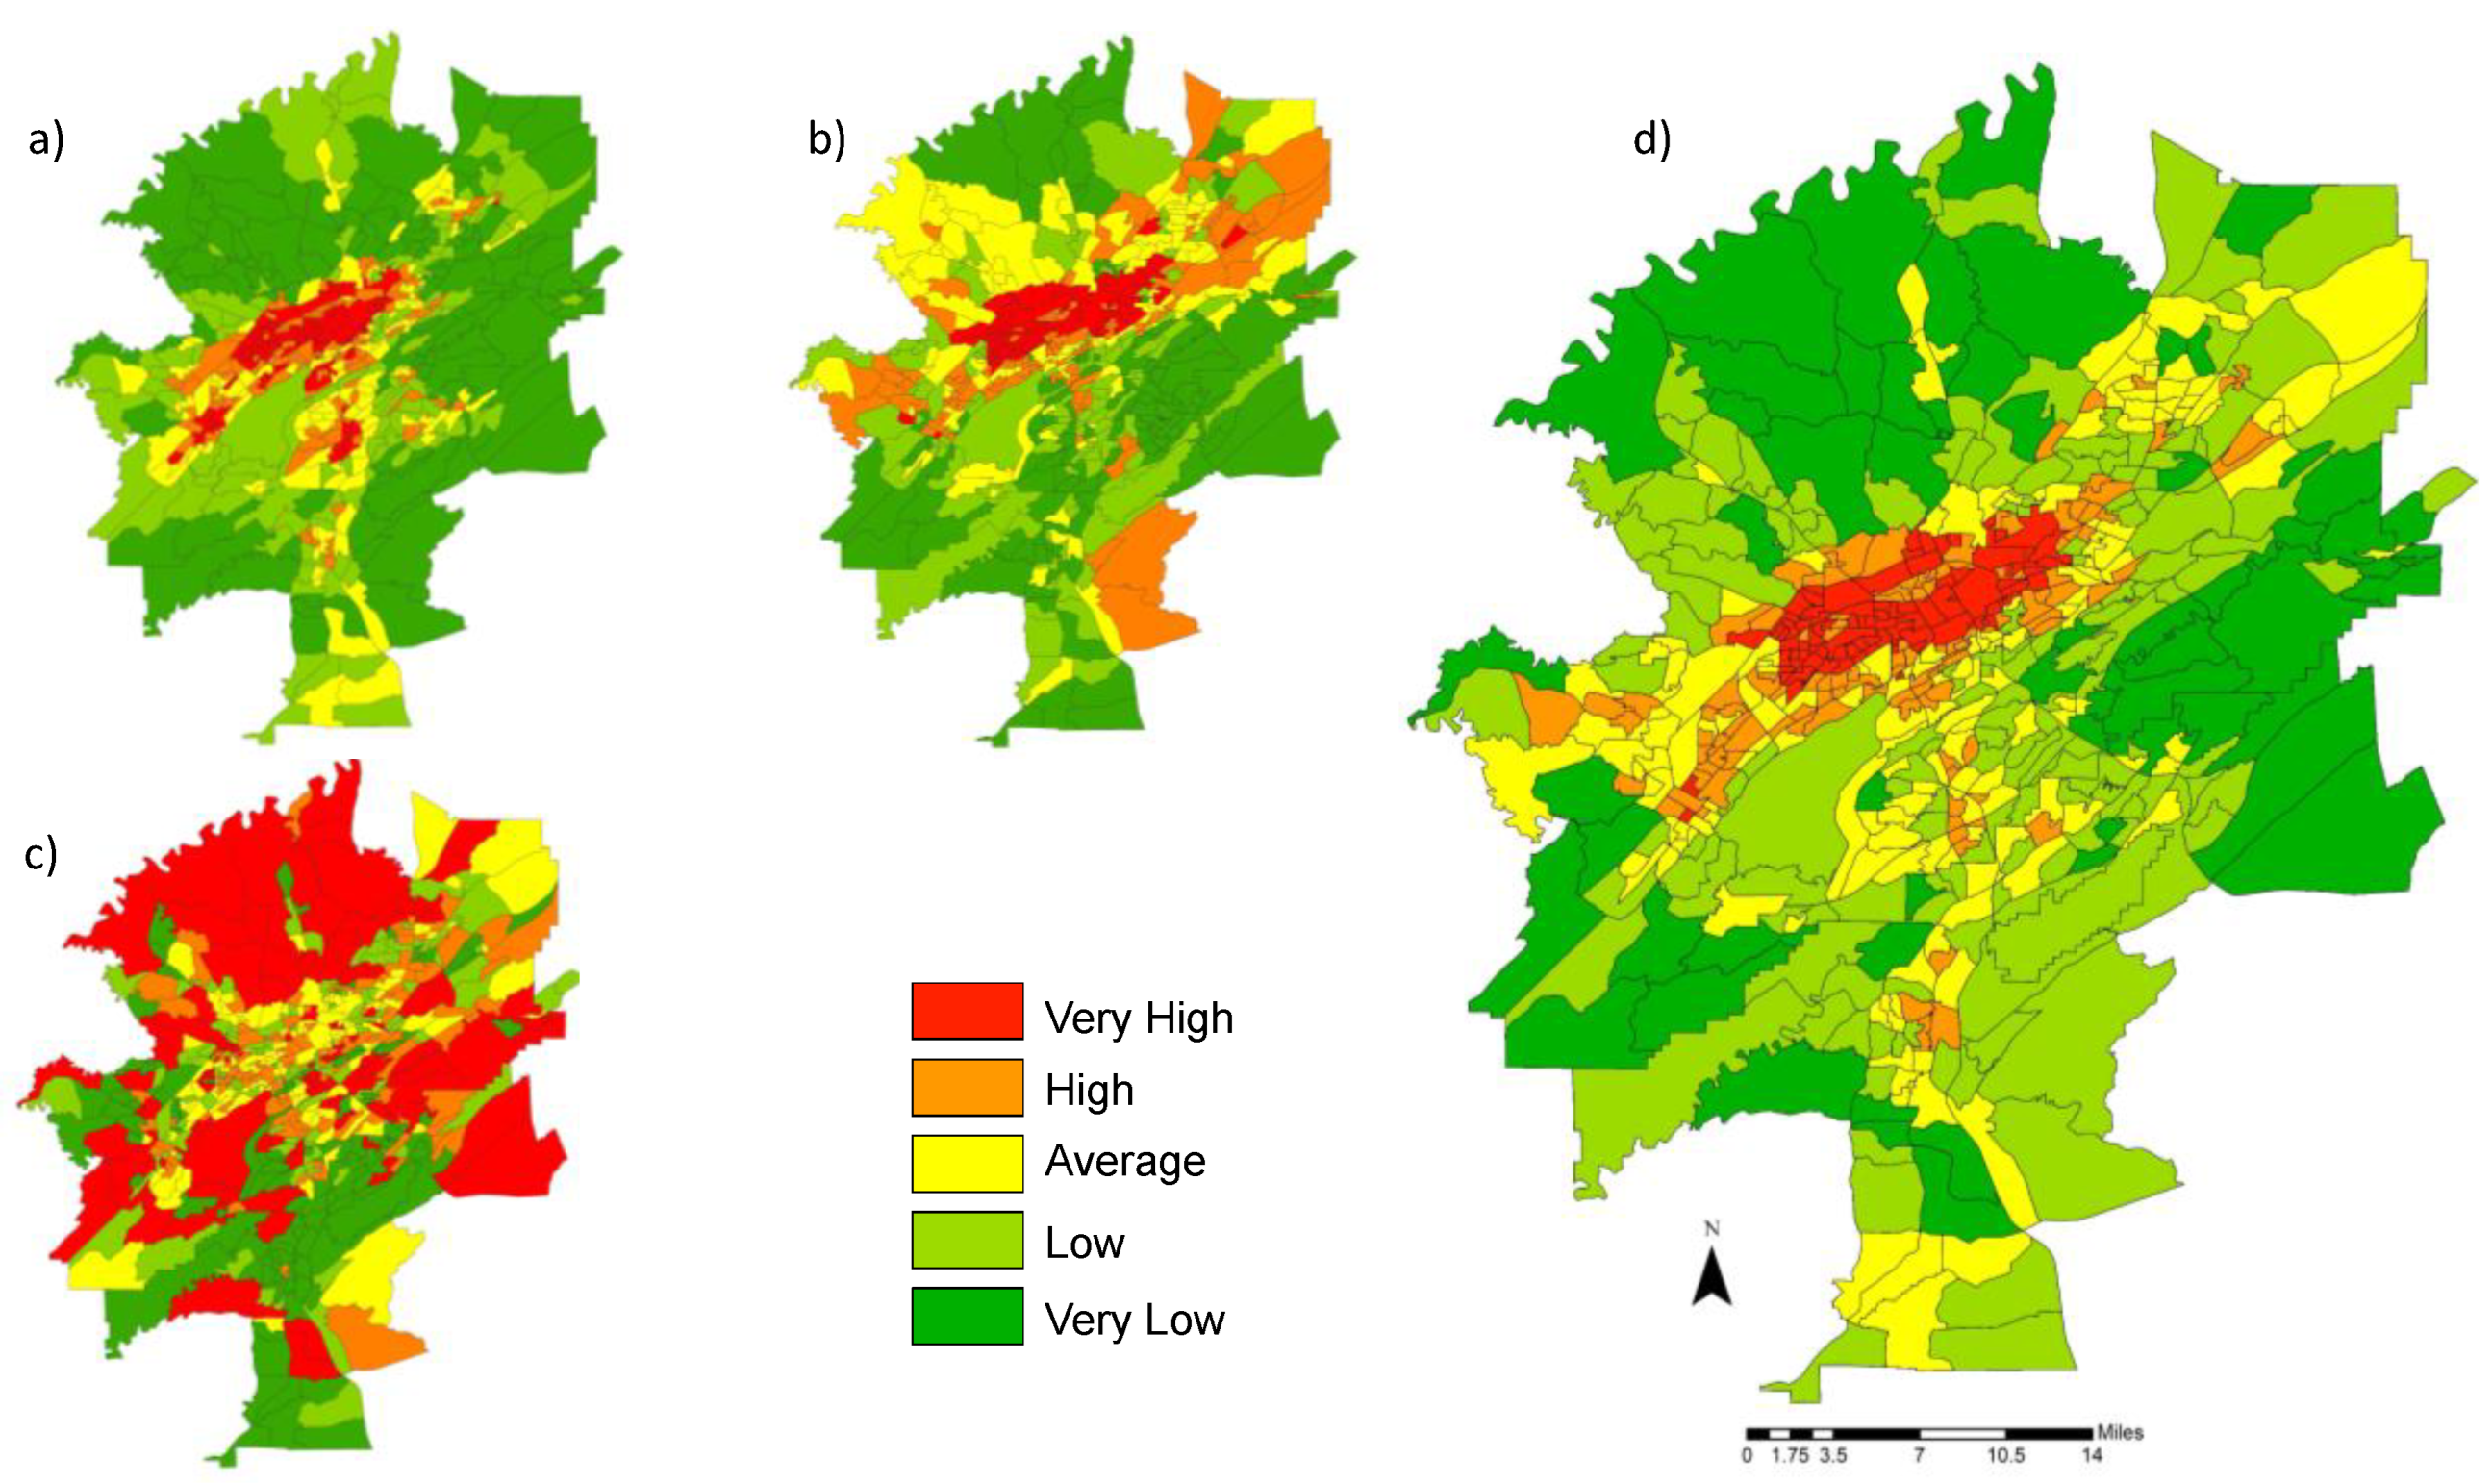
Figure 8.
Spatial distribution of the subindices and vulnerability index scores for the City of Montgomery (Alabama) at block group level: (a) exposure; (b) sensitivity; (c) adaptive capacity; (d) vulnerability index.
Figure 8.
Spatial distribution of the subindices and vulnerability index scores for the City of Montgomery (Alabama) at block group level: (a) exposure; (b) sensitivity; (c) adaptive capacity; (d) vulnerability index.
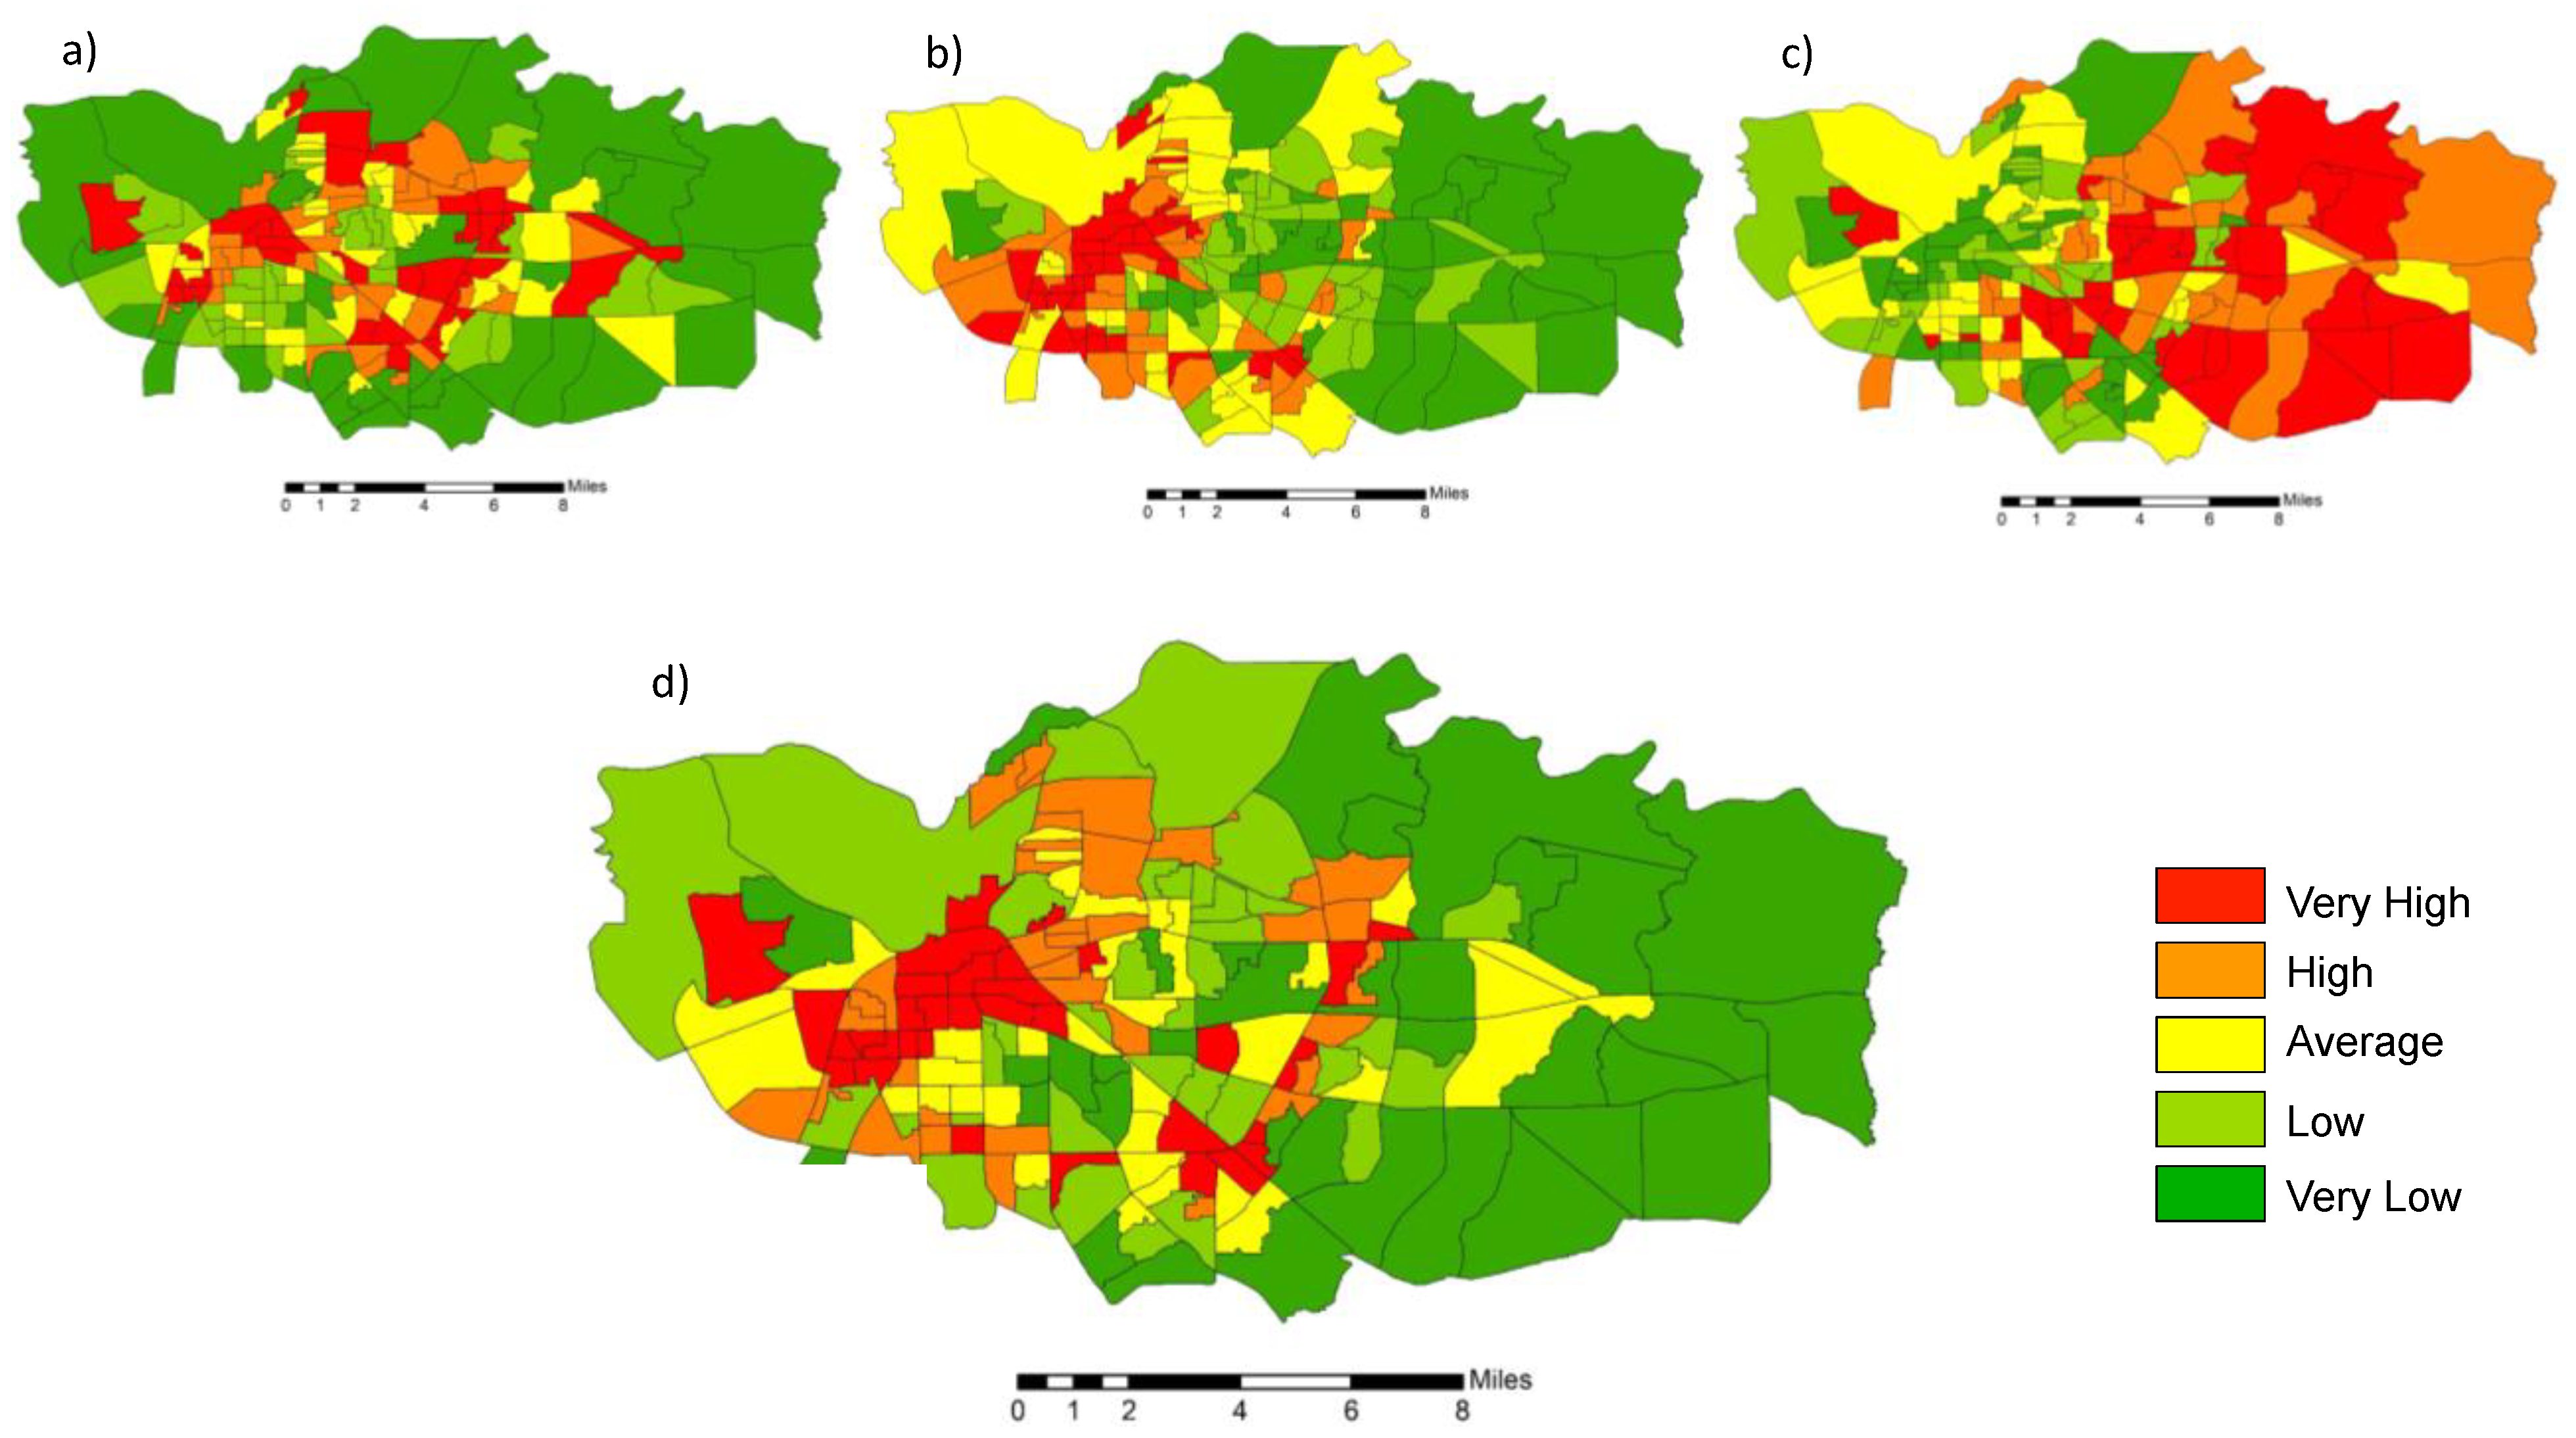
Figure 9.
Spatial distribution of the subindices and vulnerability index scores for the Cities of Auburn and Opelika (Alabama) at block group level: (a) exposure; (b) sensitivity; (c) adaptive capacity; (d) vulnerability index.
Figure 9.
Spatial distribution of the subindices and vulnerability index scores for the Cities of Auburn and Opelika (Alabama) at block group level: (a) exposure; (b) sensitivity; (c) adaptive capacity; (d) vulnerability index.
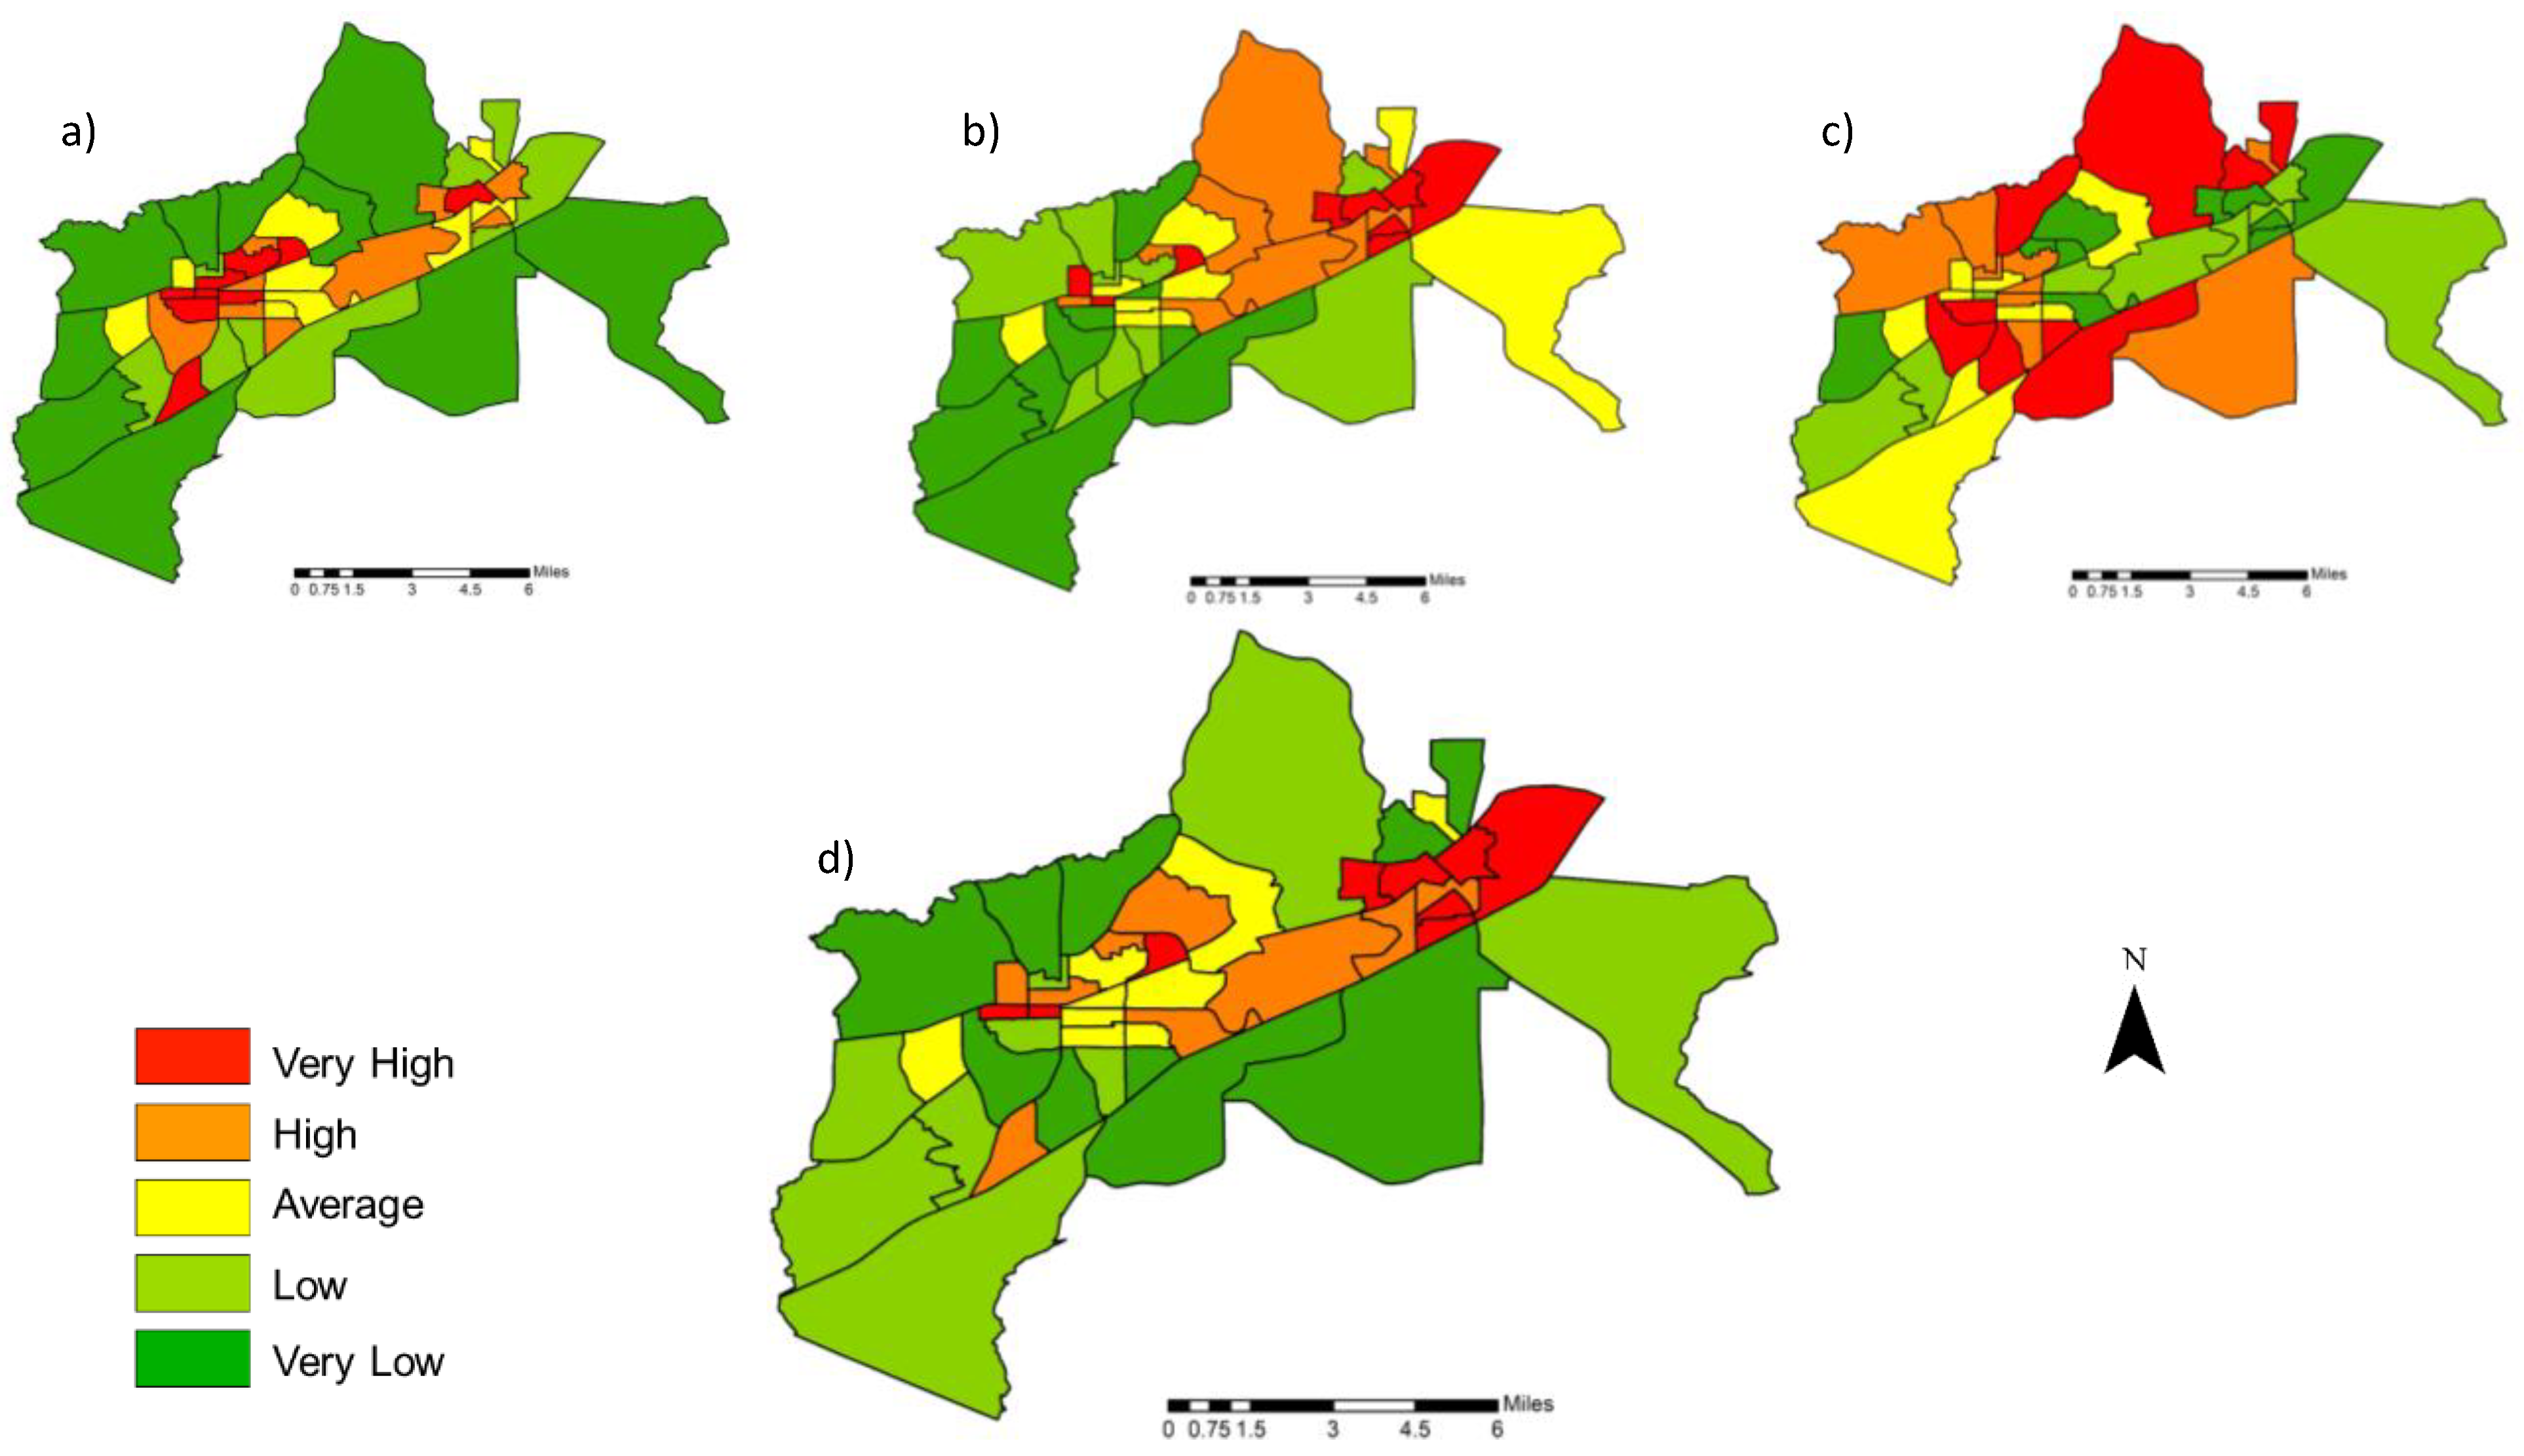
Figure 10.
Correlation of the sensitivity subindex with its indicators: (a) Birmingham; (b) Montgomery; (c) Auburn-Opelika. All correlation coefficients are significant at the 5% level, except for those marked with an asterisk.
Figure 10.
Correlation of the sensitivity subindex with its indicators: (a) Birmingham; (b) Montgomery; (c) Auburn-Opelika. All correlation coefficients are significant at the 5% level, except for those marked with an asterisk.
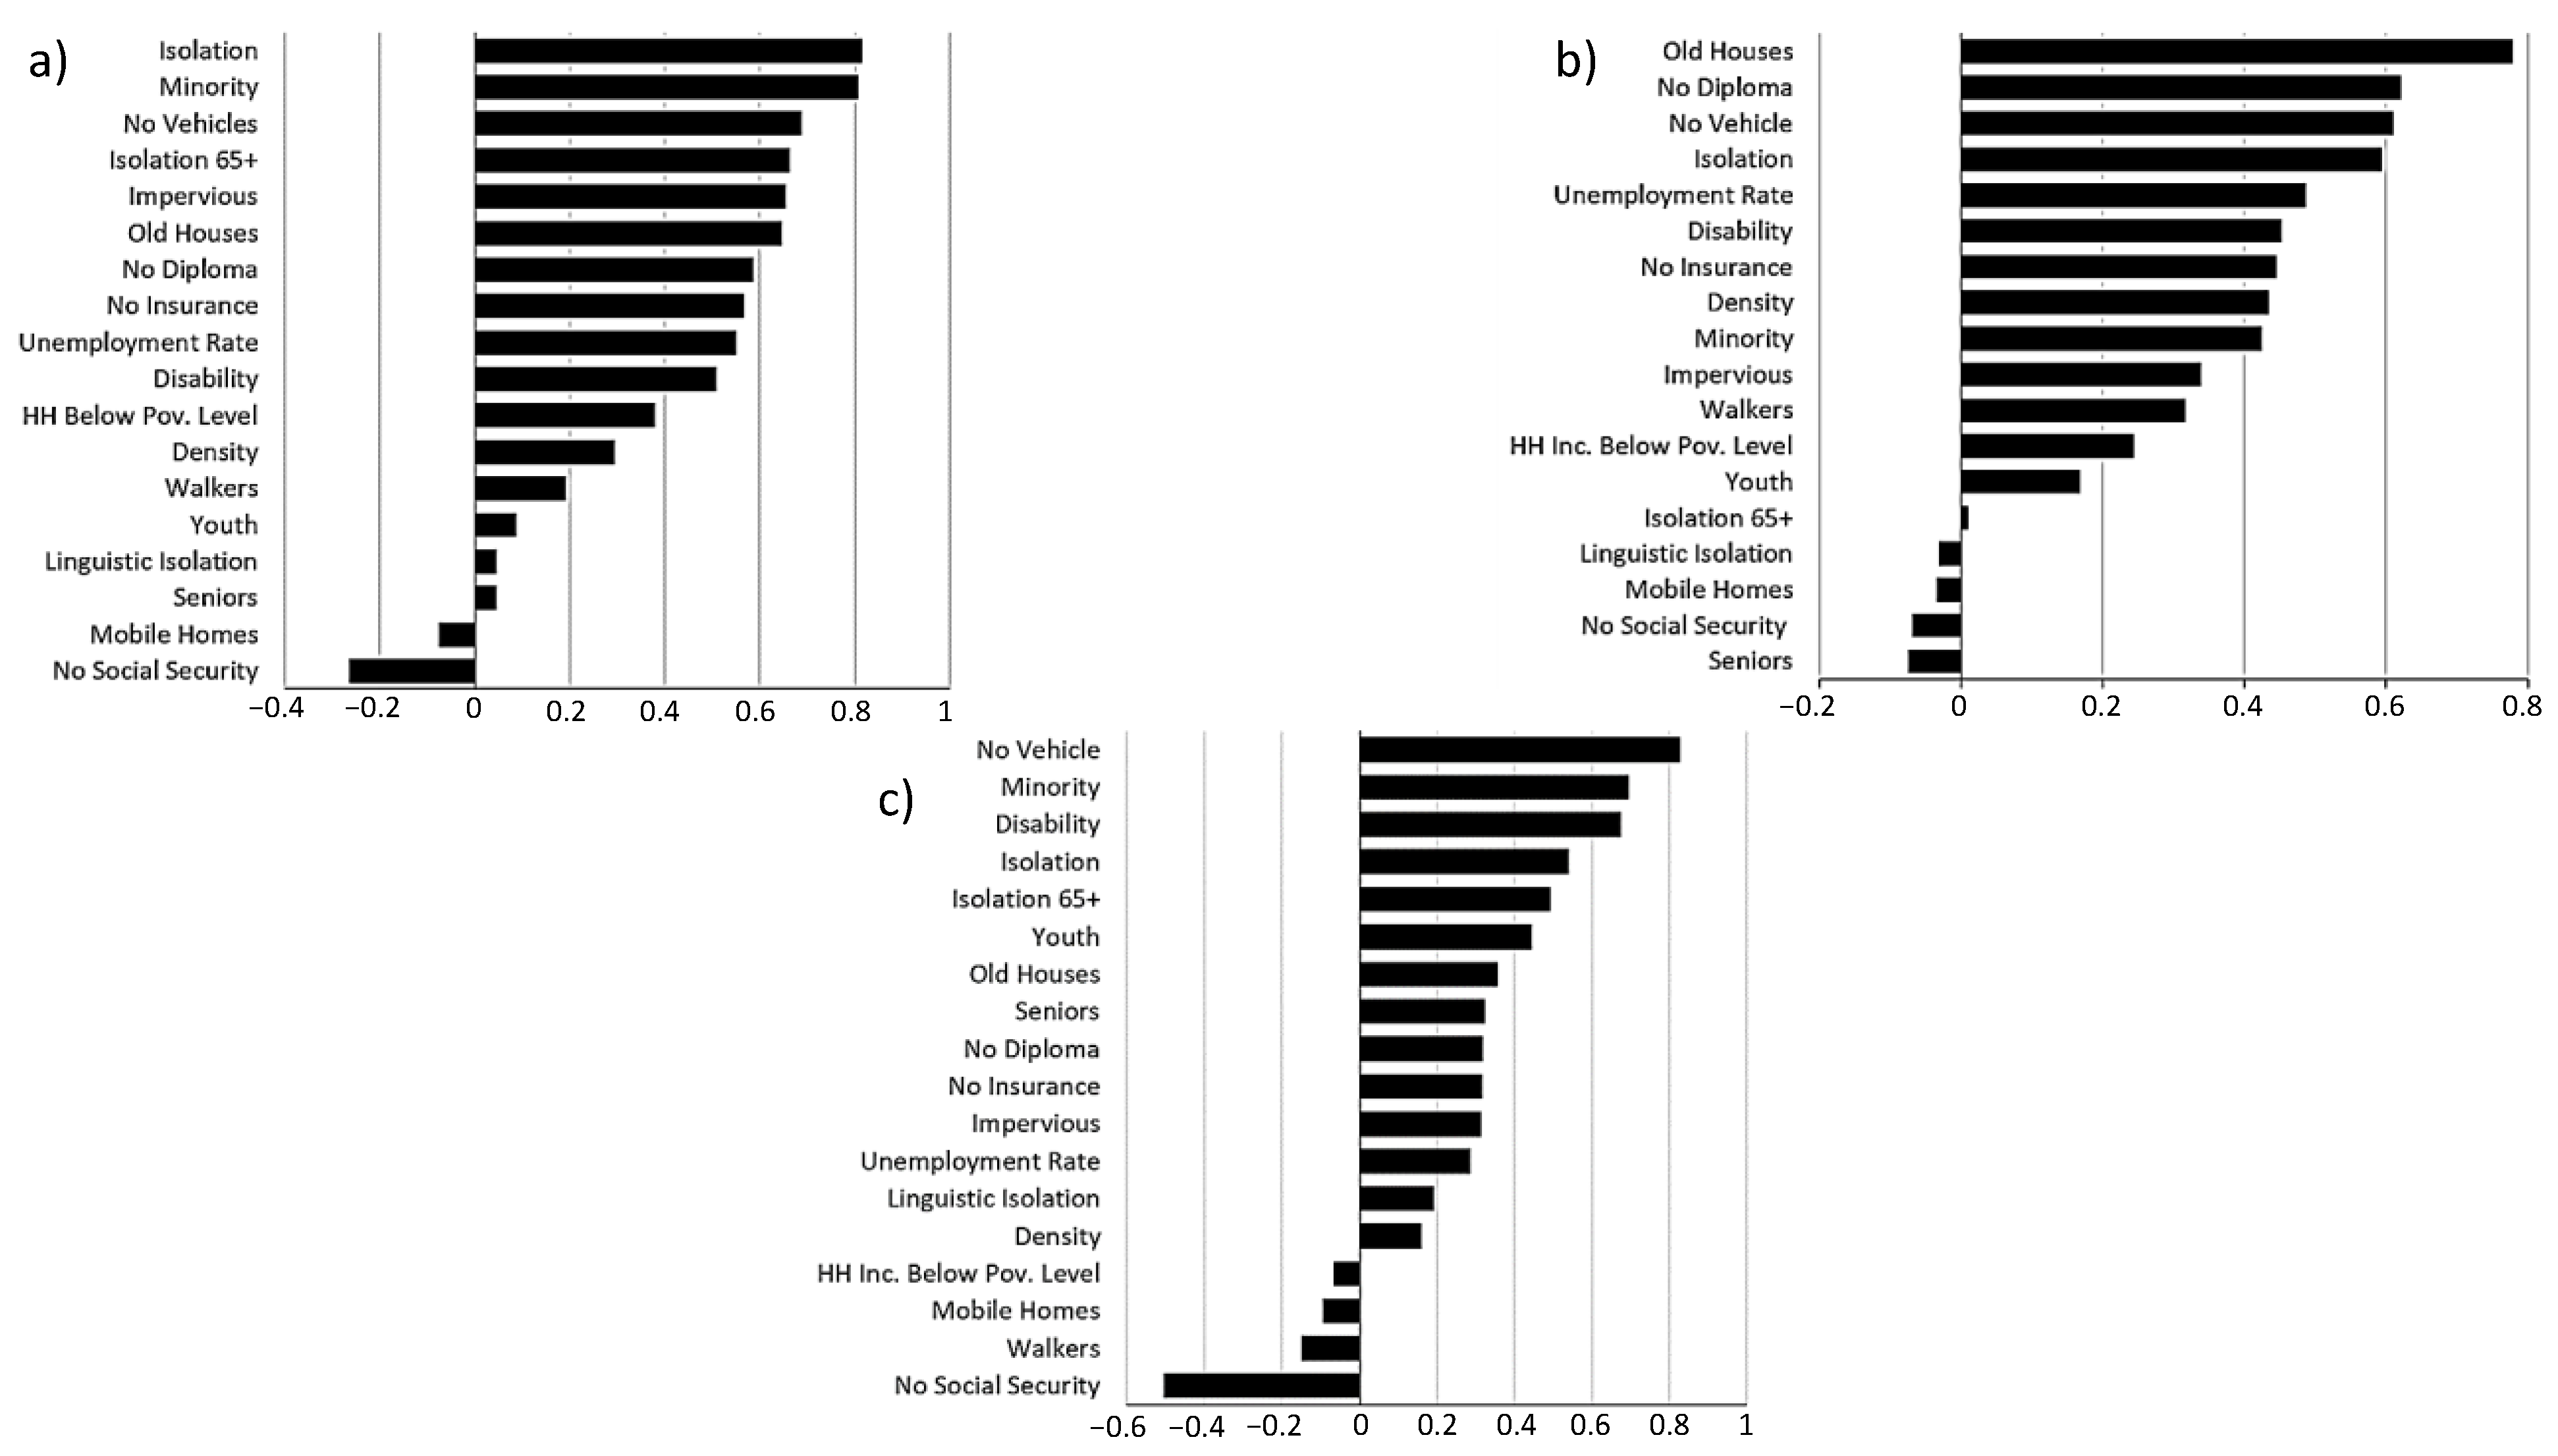
Figure 11.
Correlation of the adaptive capacity subindex with its indicators: (a) Birmingham; (b) Montgomery; (c) Auburn-Opelika. All correlation coefficients are significant at the 5% level, except for those marked with an asterisk.
Figure 11.
Correlation of the adaptive capacity subindex with its indicators: (a) Birmingham; (b) Montgomery; (c) Auburn-Opelika. All correlation coefficients are significant at the 5% level, except for those marked with an asterisk.
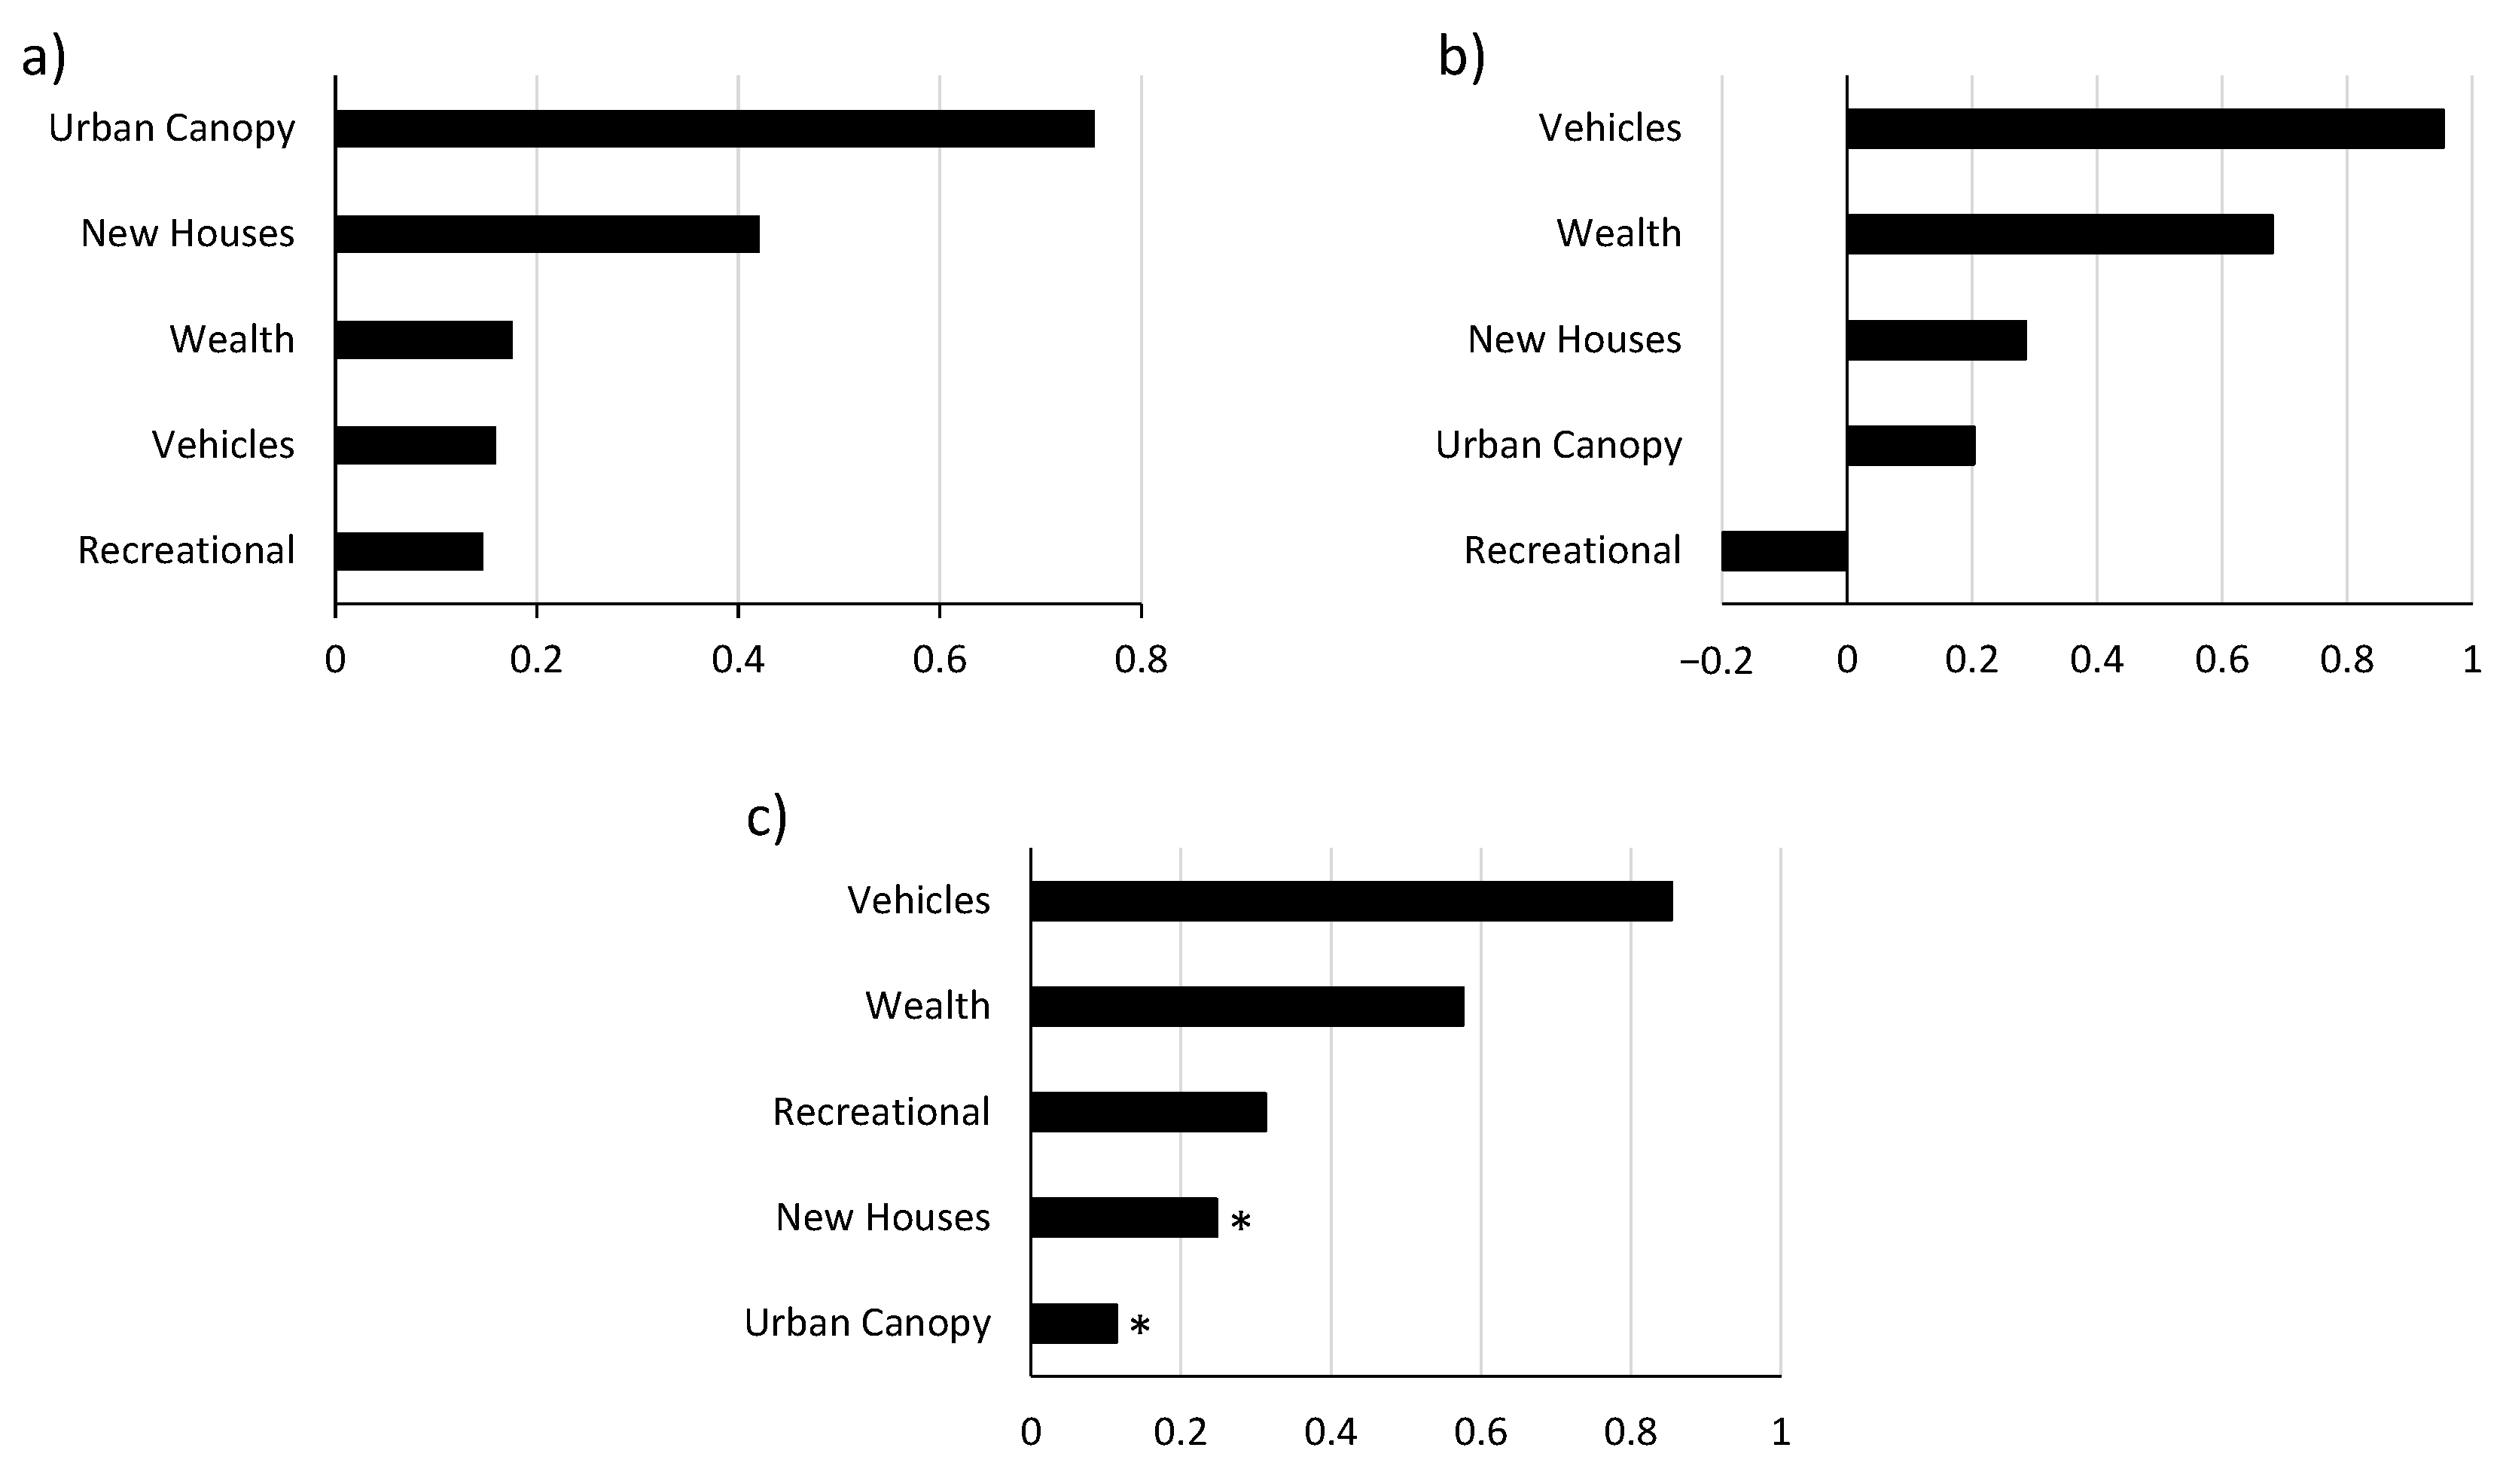
Figure 12.
Cluster analysis for the city of Birmingham and spider diagrams representing the deconstruction of subindices associated with HH and LL clusters (clusters with higher and lower vulnerability scores): (a) spatial patterns of the cluster analysis; (b) deconstruction of the sensitivity subindex; (c) deconstruction of the adaptive capacity subindex. Values of indicators are scaled between 0 (lowest performance) and 100 (highest performance).
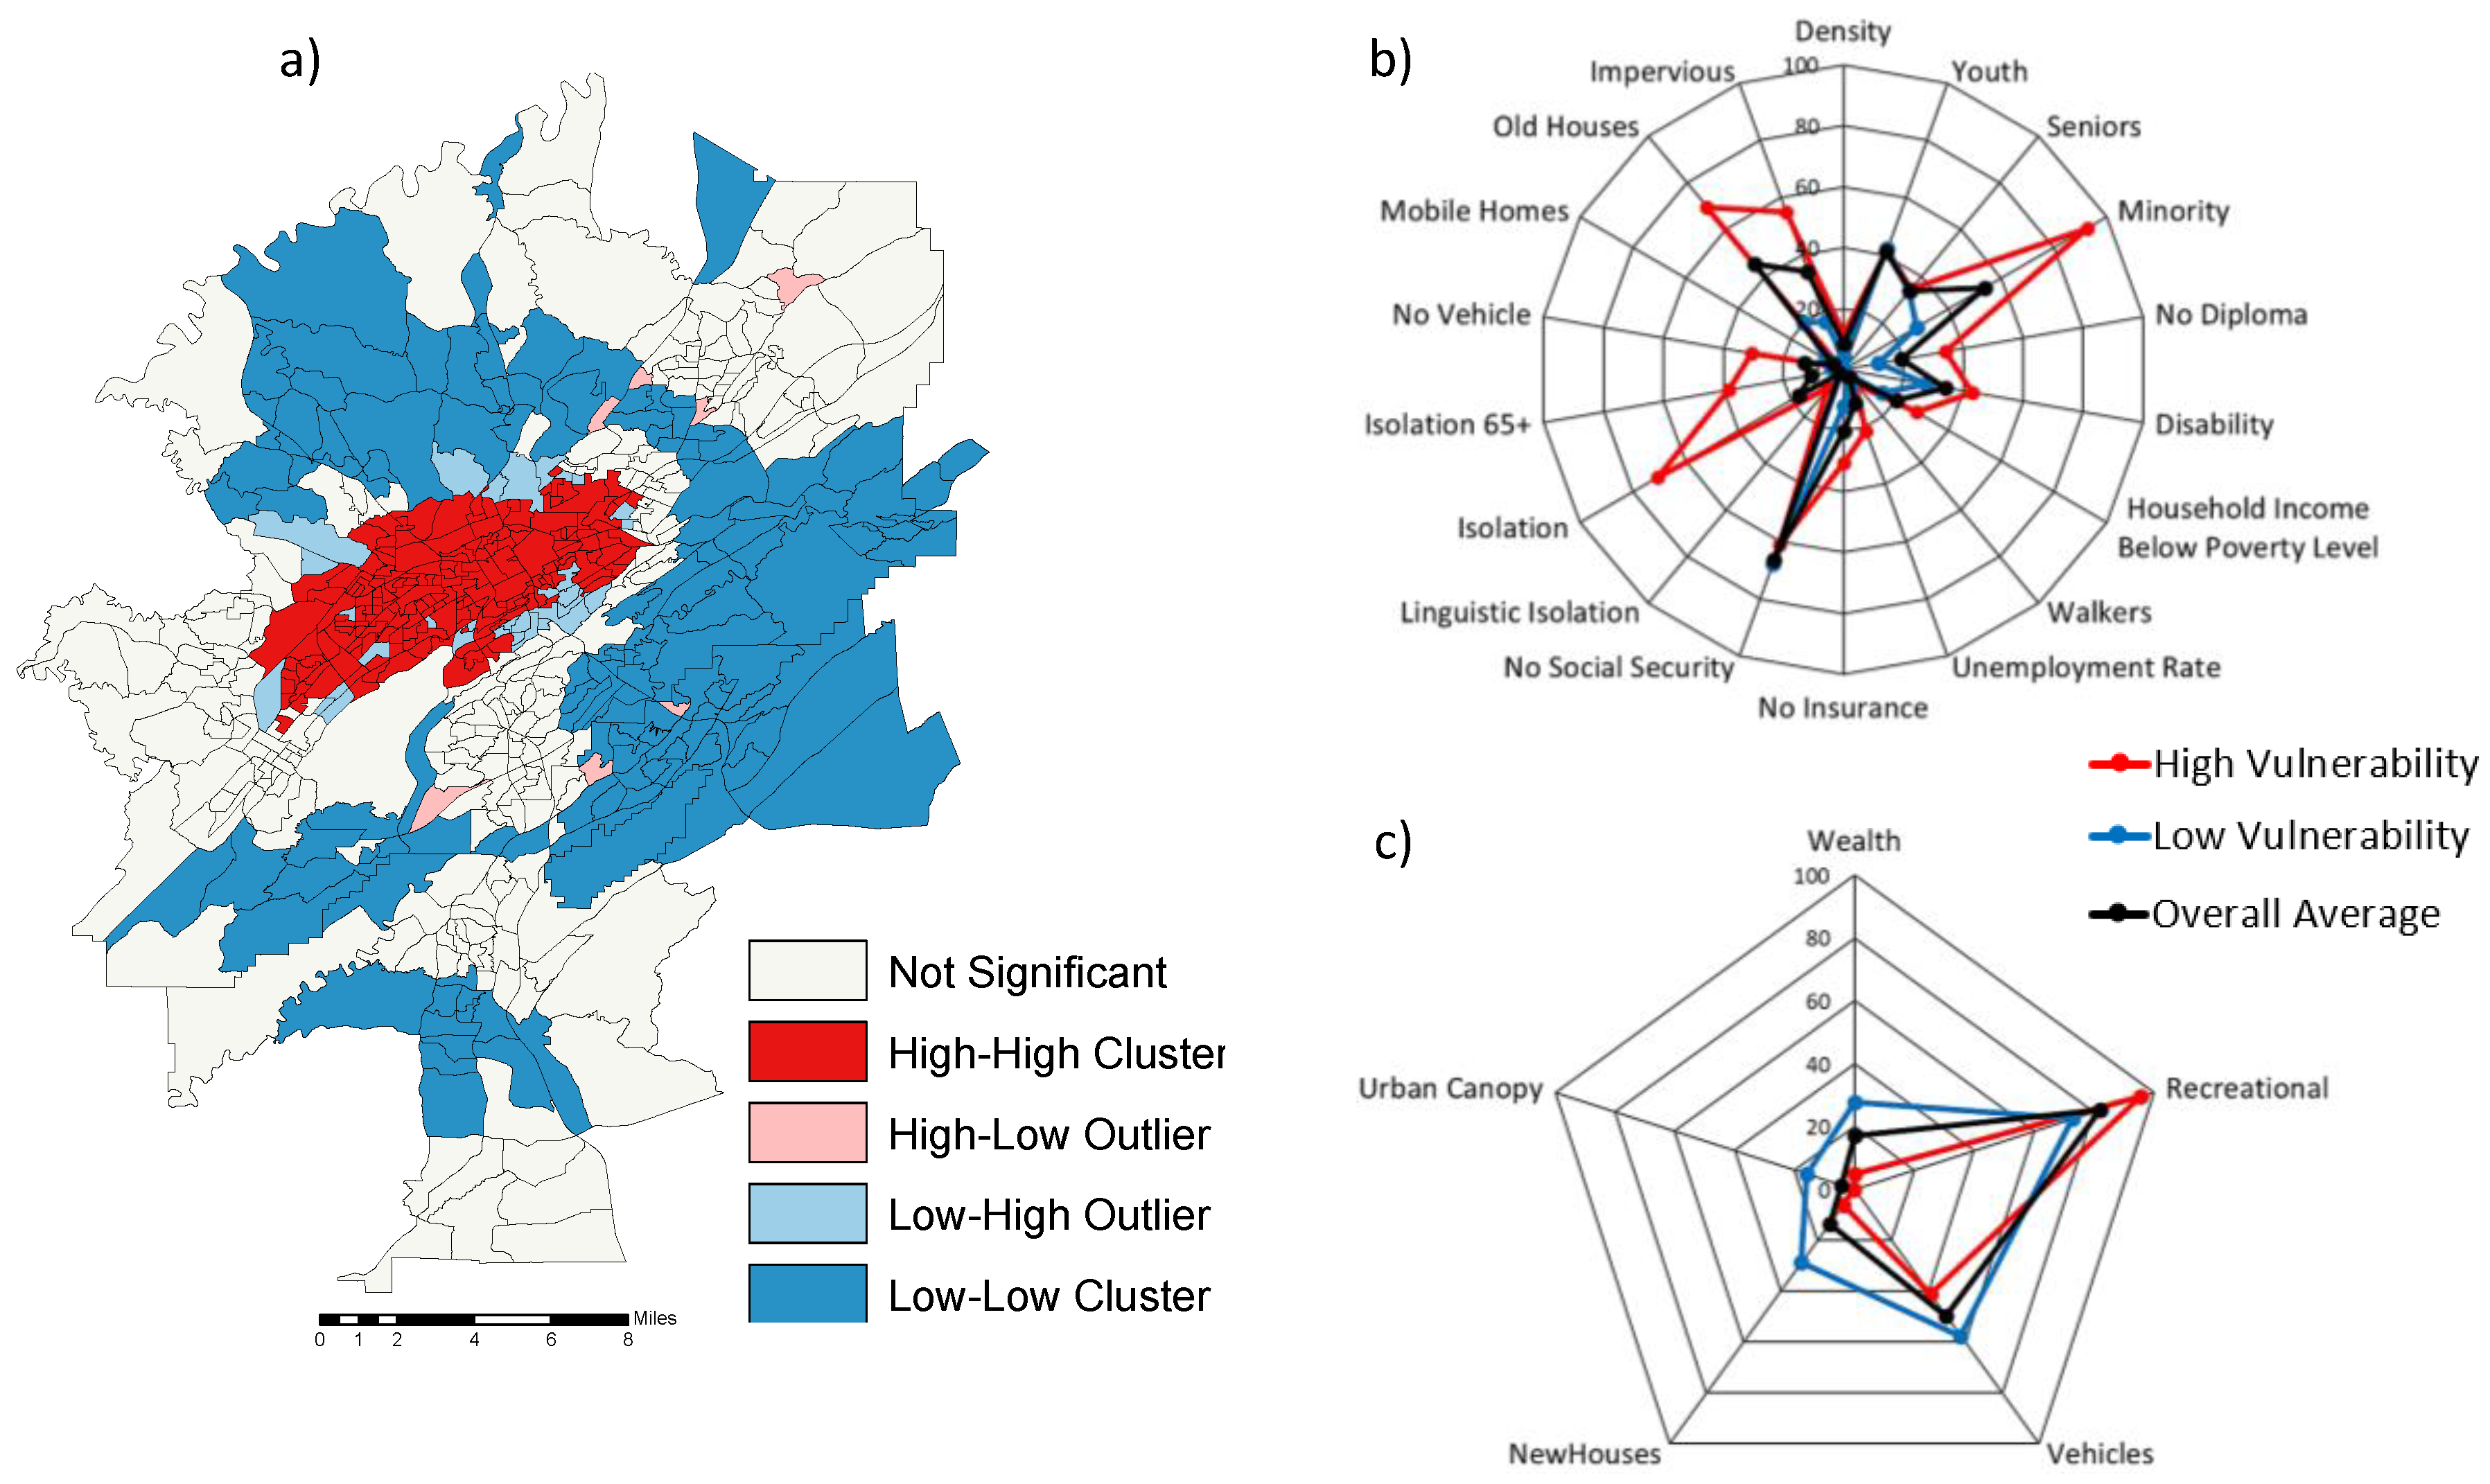
Figure 13.
Cluster analysis for the city of Montgomery and spider diagrams representing the deconstruction of subindices associated with HH and LL clusters (clusters with higher and lower vulnerability scores): (a) spatial patterns of the cluster analysis; (b) deconstruction of the sensitivity subindex; (c) deconstruction of the adaptive capacity subindex. Values of indicators are scaled between 0 (lowest performance) and 100 (highest performance).
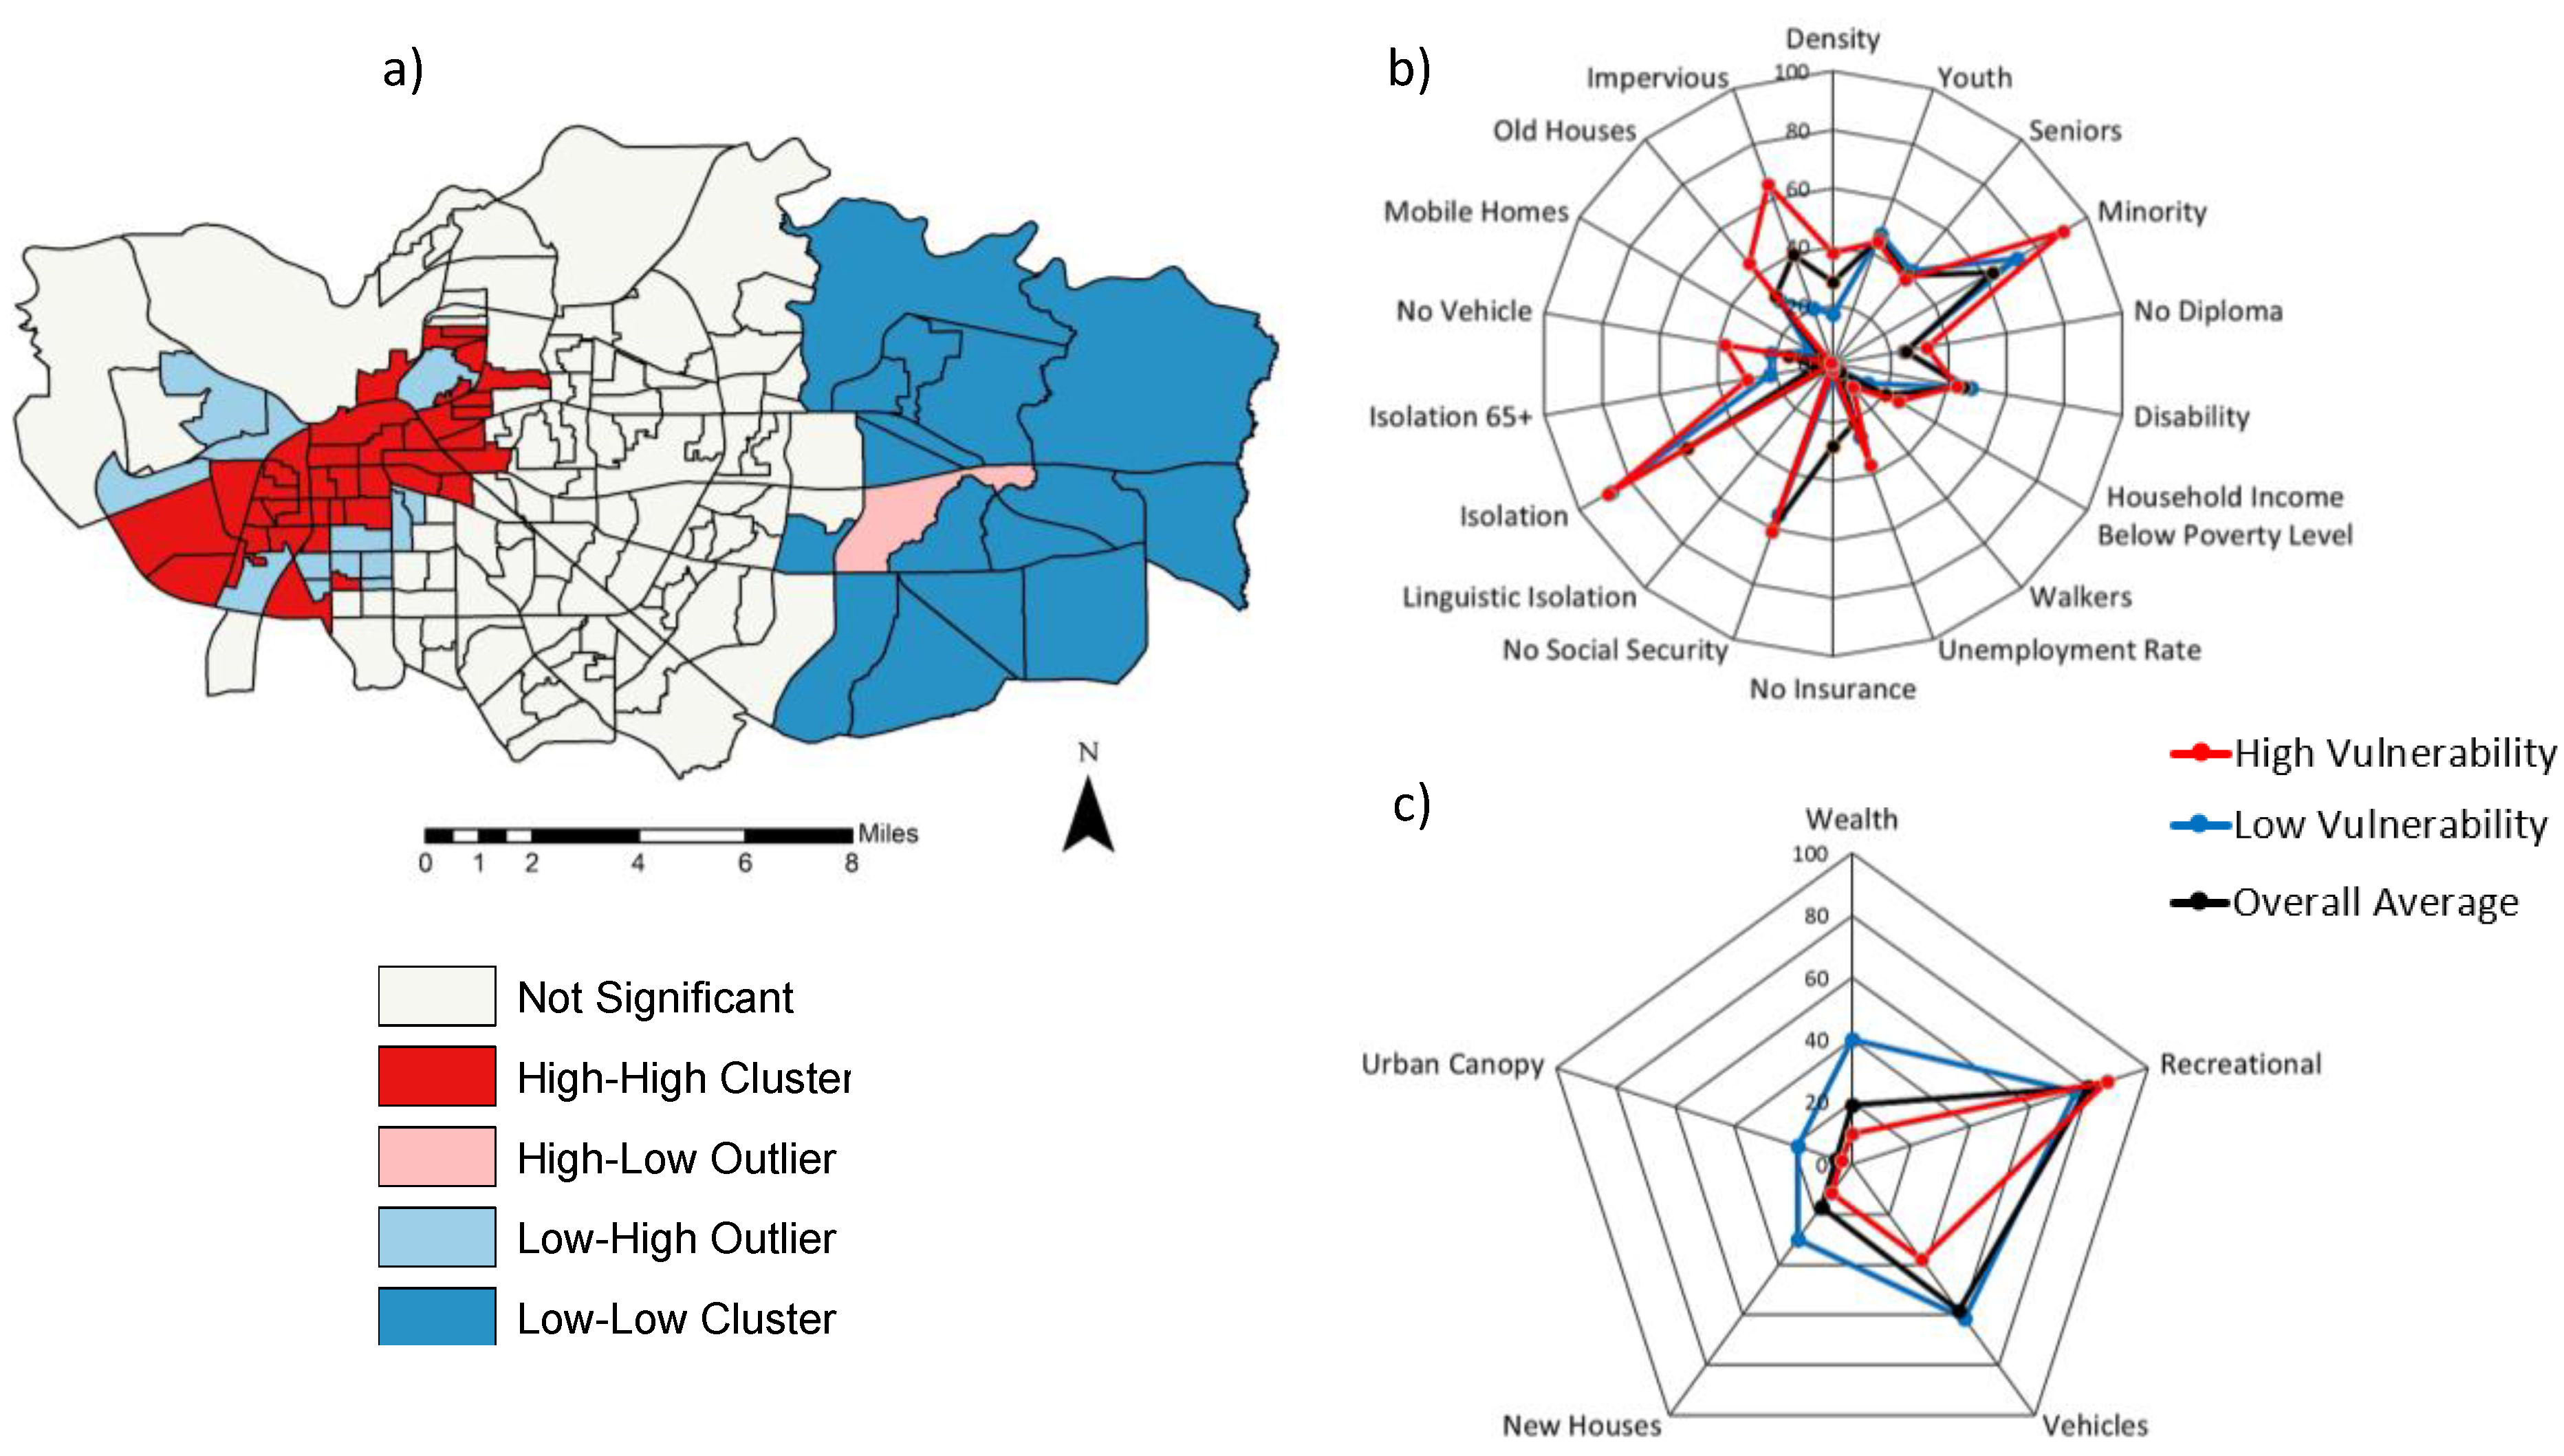
Figure 14.
Cluster analysis for the cities of Auburn and Opelika and spider diagrams representing the deconstruction of subindices associated with HH and LL clusters (clusters with higher and lower vulnerability scores): (a) spatial patterns of the cluster analysis; (b) deconstruction of the sensitivity subindex; (c) deconstruction of the adaptive capacity subindex. Values of indicators are scaled between 0 (lowest performance) and 100 (highest performance).
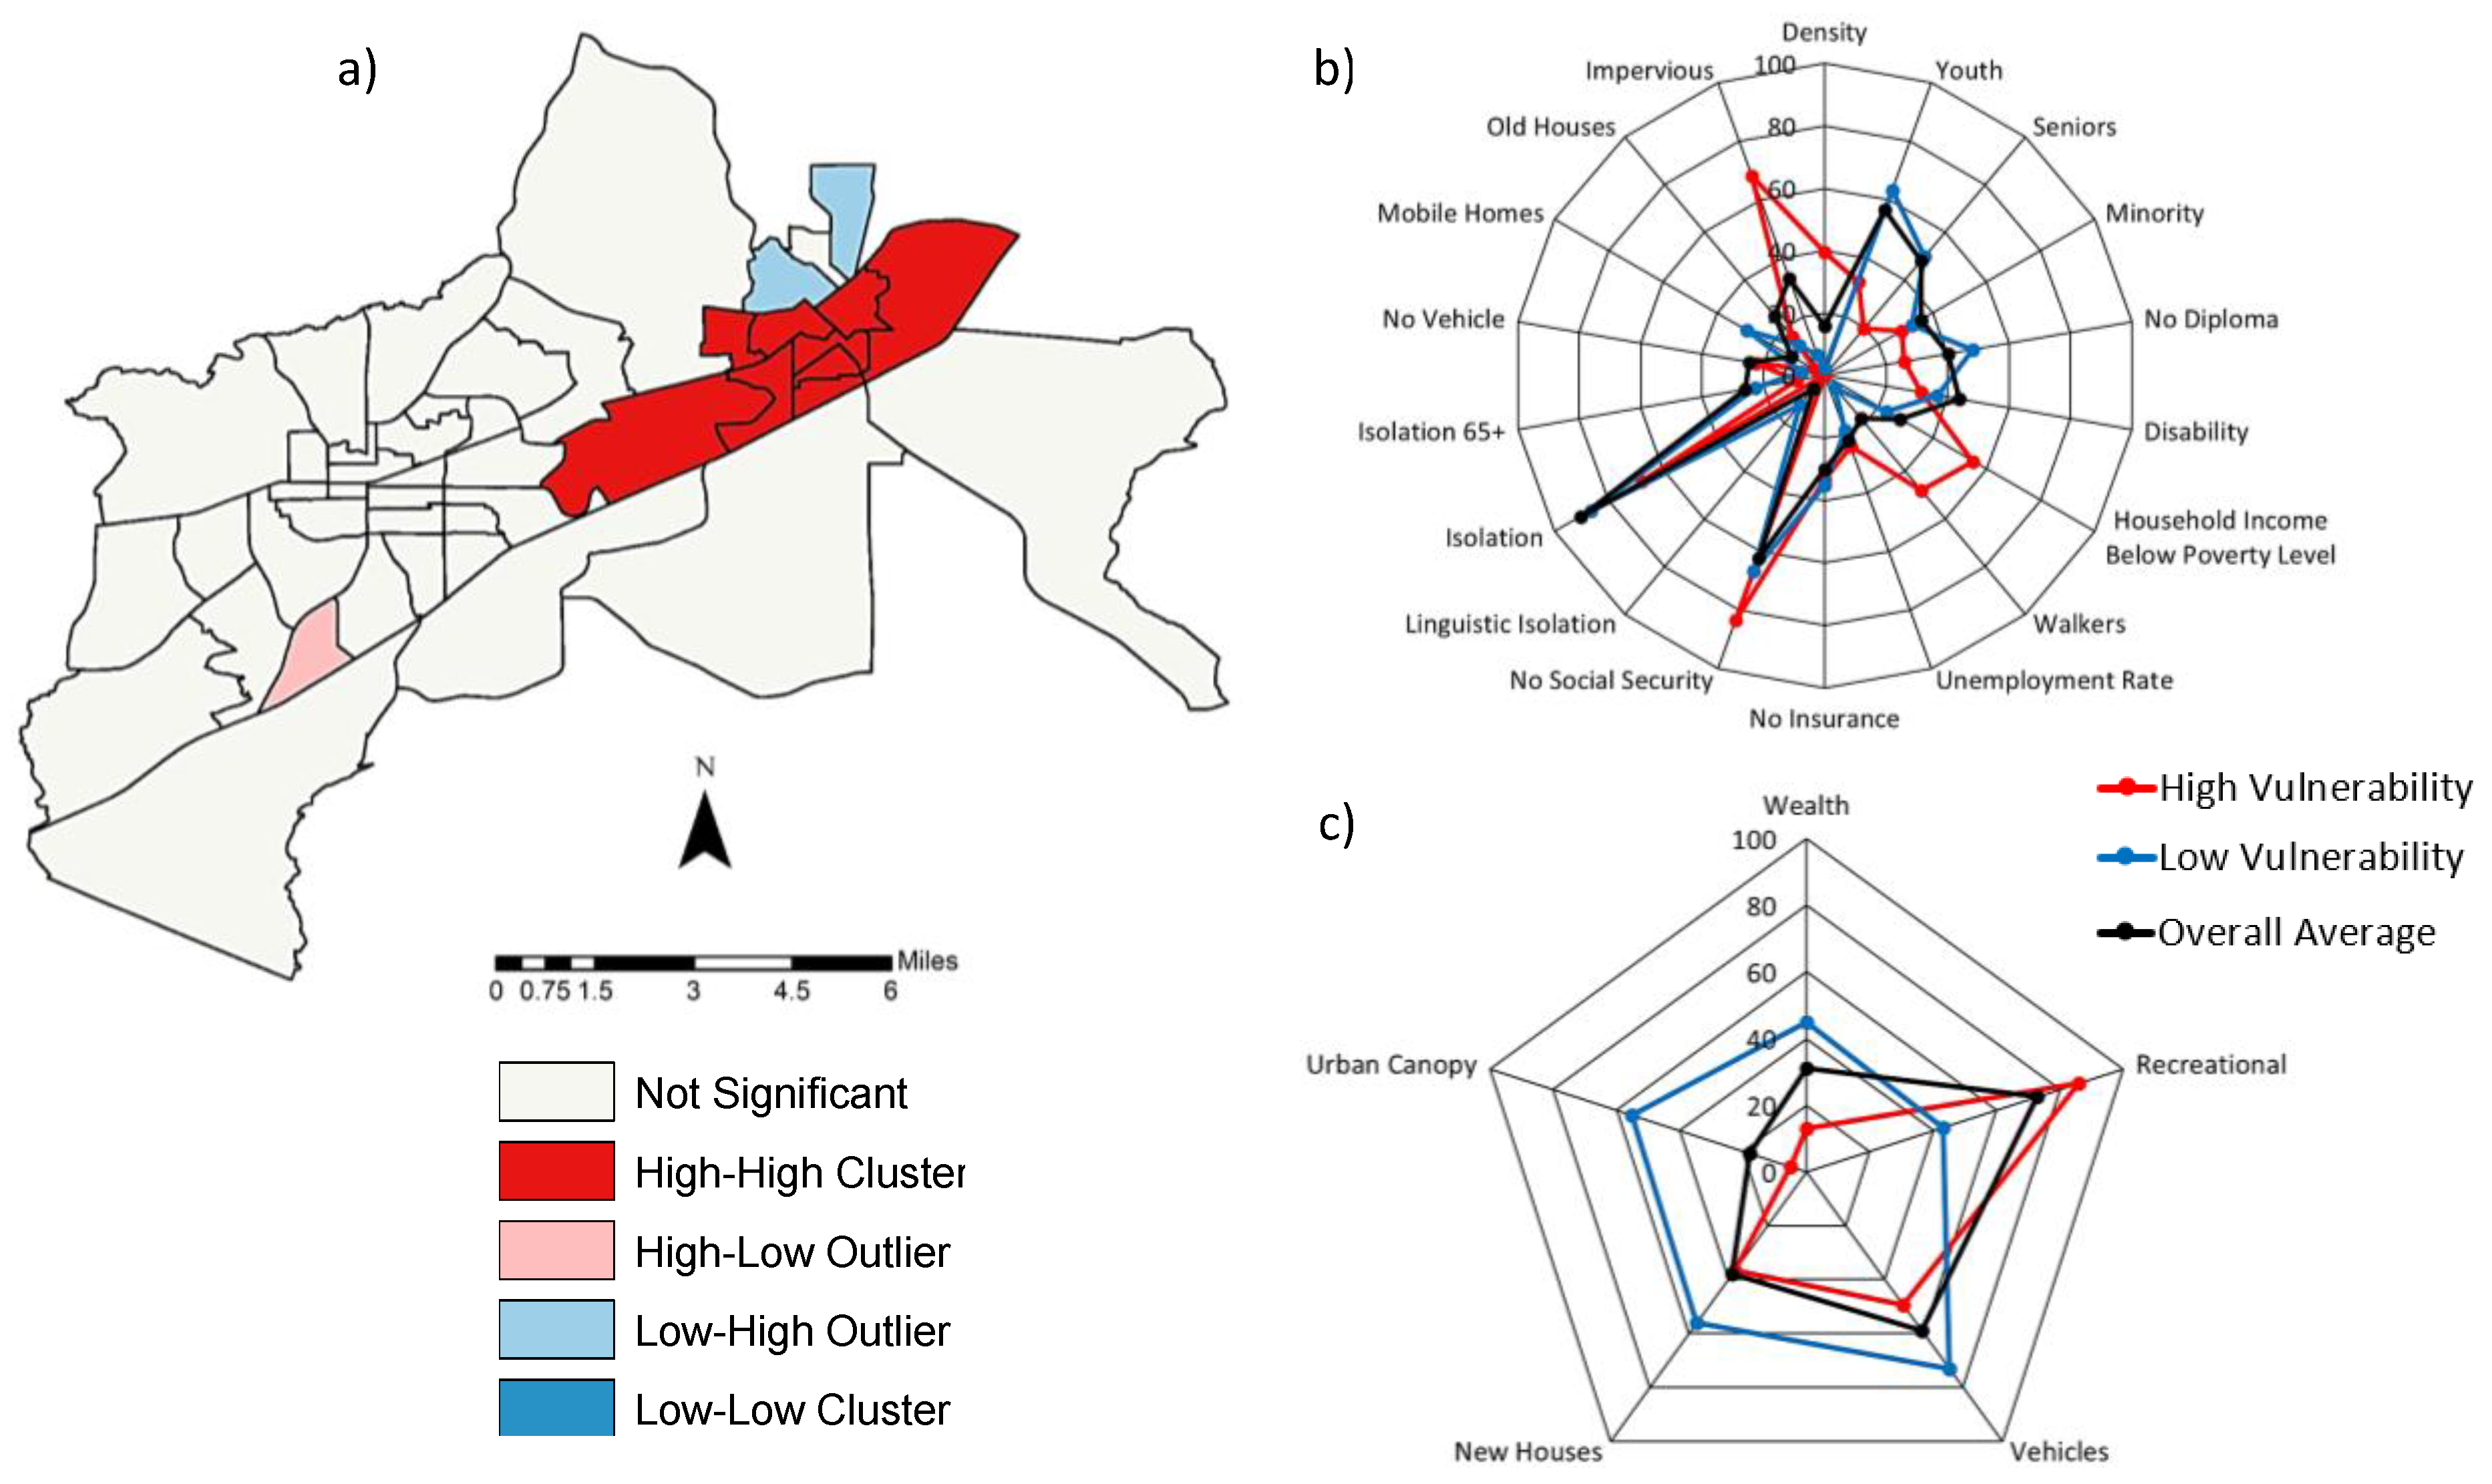
Figure 15.
Example of a Montgomery block group profile. Values of the block group’s indicators are compared with the average for all the city’s other block groups.
Figure 15.
Example of a Montgomery block group profile. Values of the block group’s indicators are compared with the average for all the city’s other block groups.
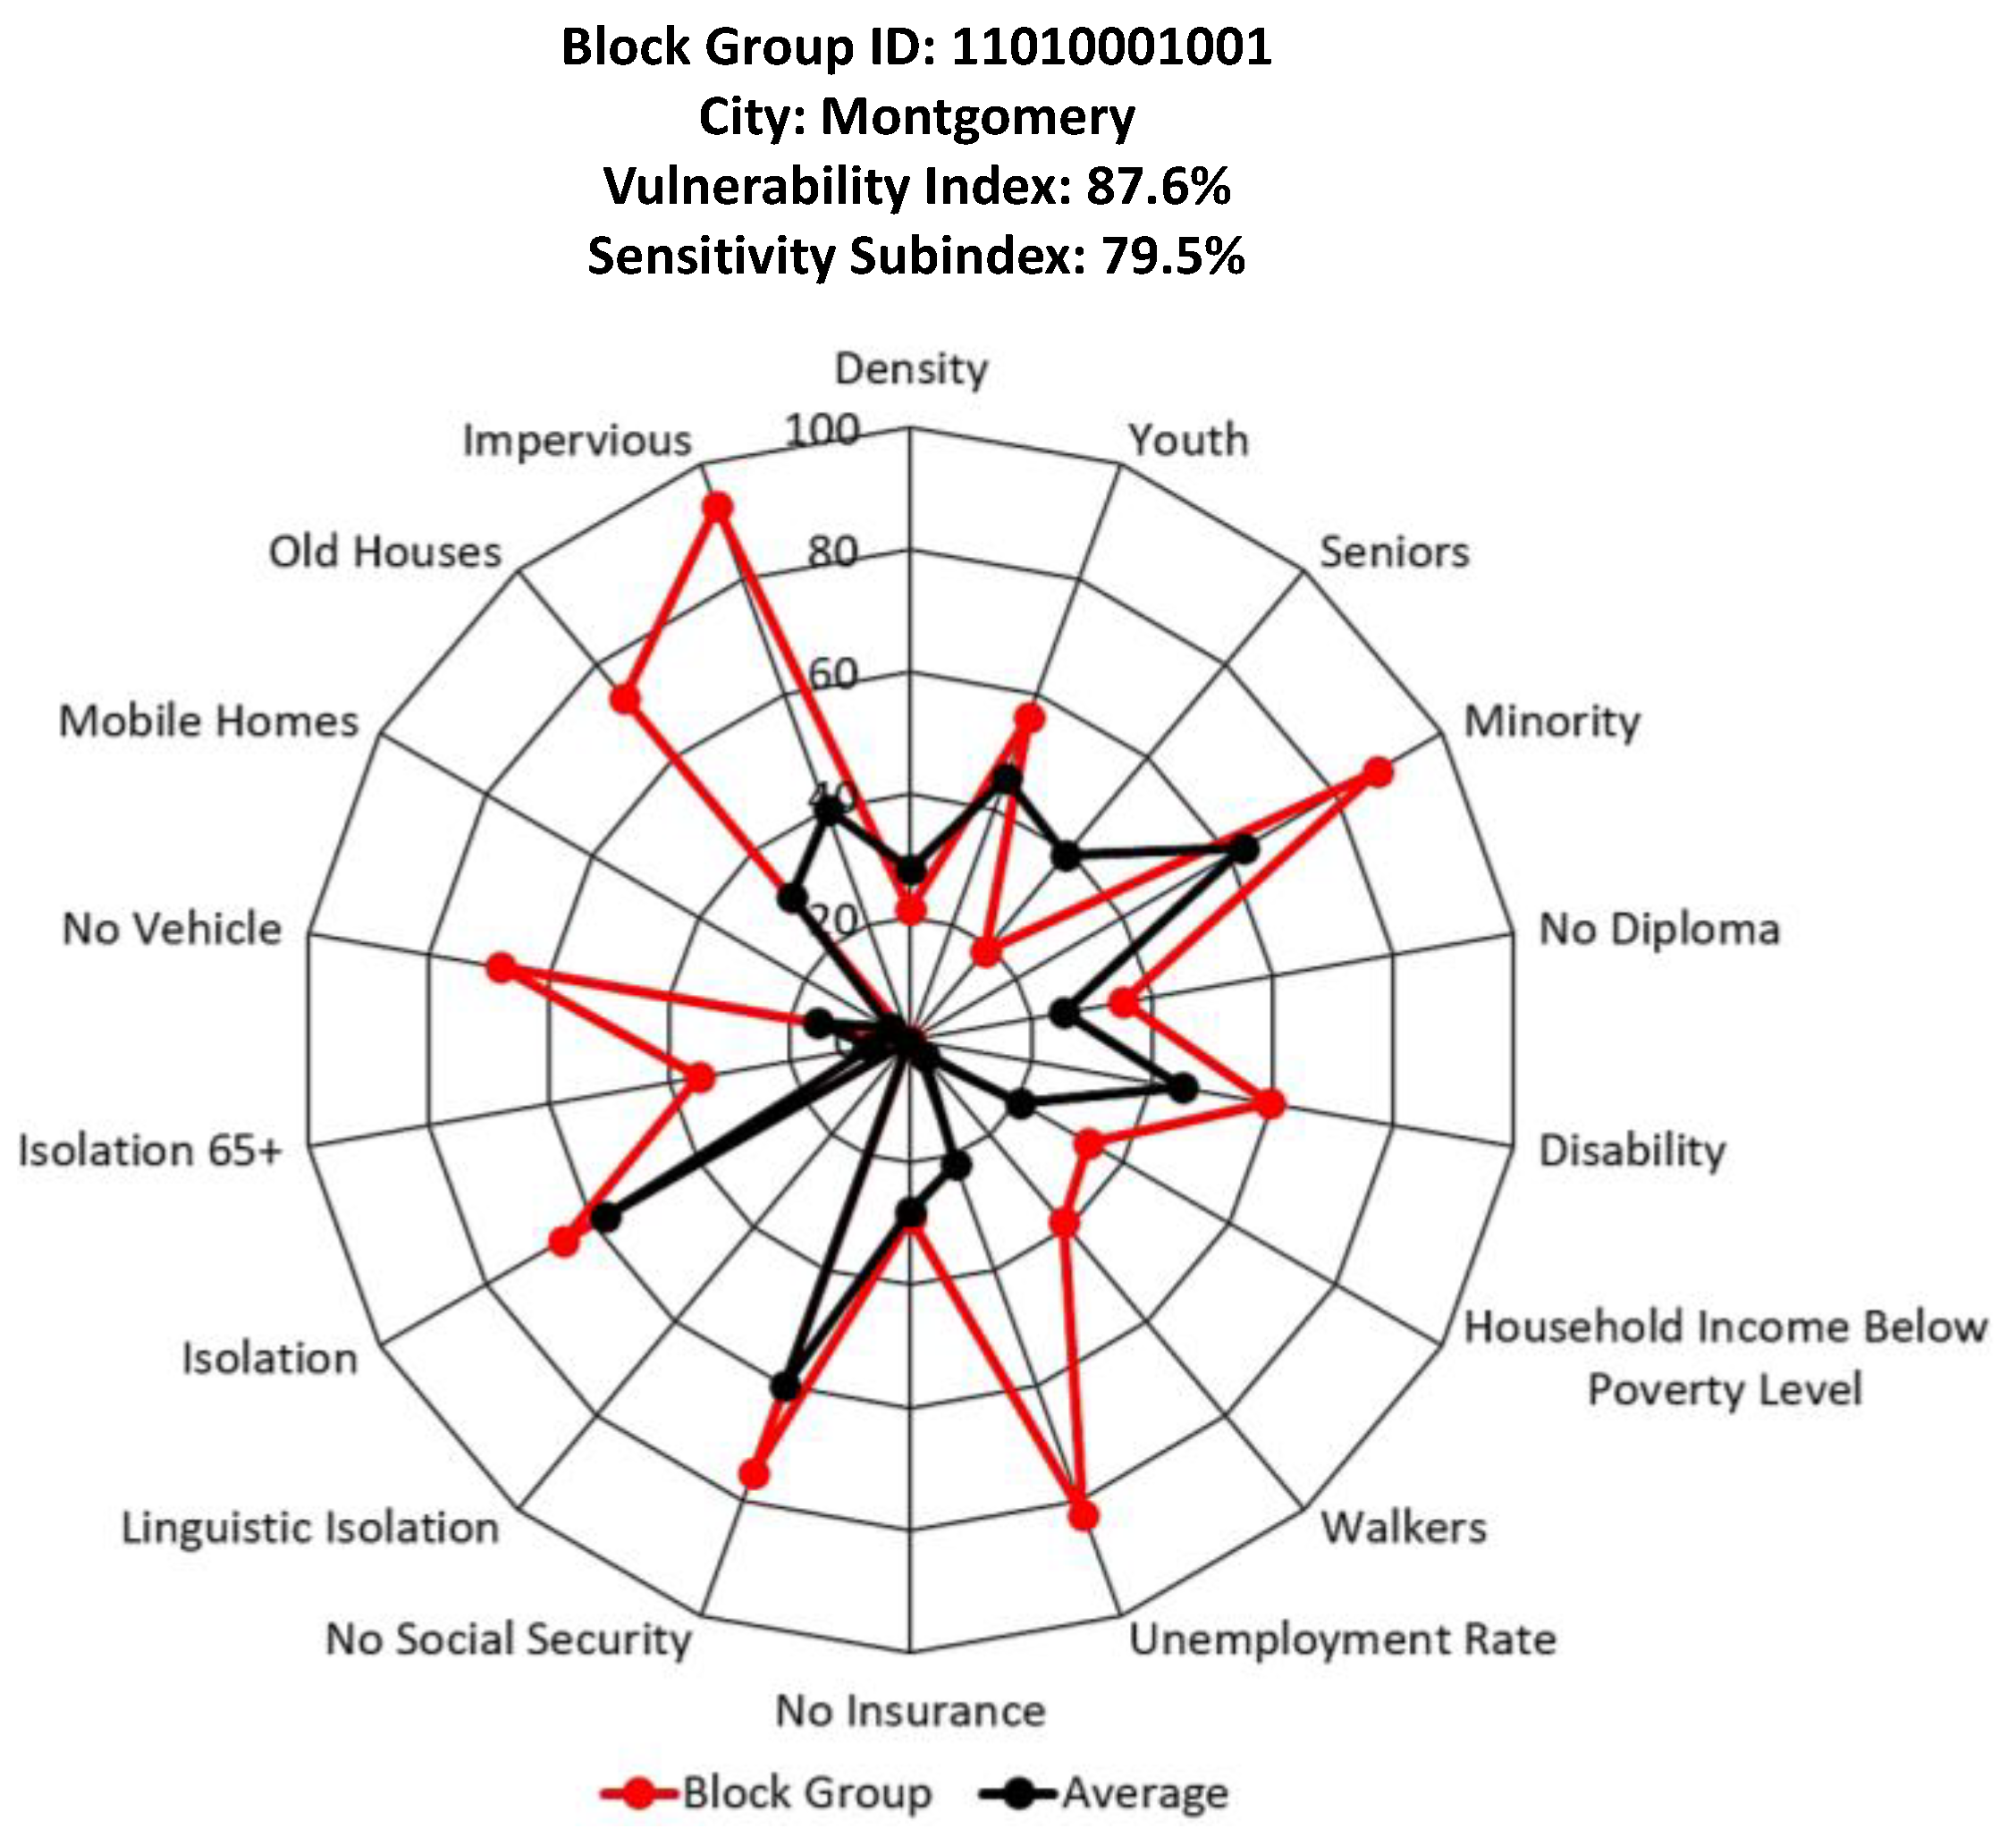
Figure 16.
Overlay of block groups of high vulnerability (HH clusters of vulnerability) and block groups of high LST (HH clusters of LST) for (a) Birmingham; (b) Montgomery; (c) Auburn-Opelika. Co-occurrence is observed in Birmingham and Montgomery, but not in Auburn-Opelika.
Figure 16.
Overlay of block groups of high vulnerability (HH clusters of vulnerability) and block groups of high LST (HH clusters of LST) for (a) Birmingham; (b) Montgomery; (c) Auburn-Opelika. Co-occurrence is observed in Birmingham and Montgomery, but not in Auburn-Opelika.
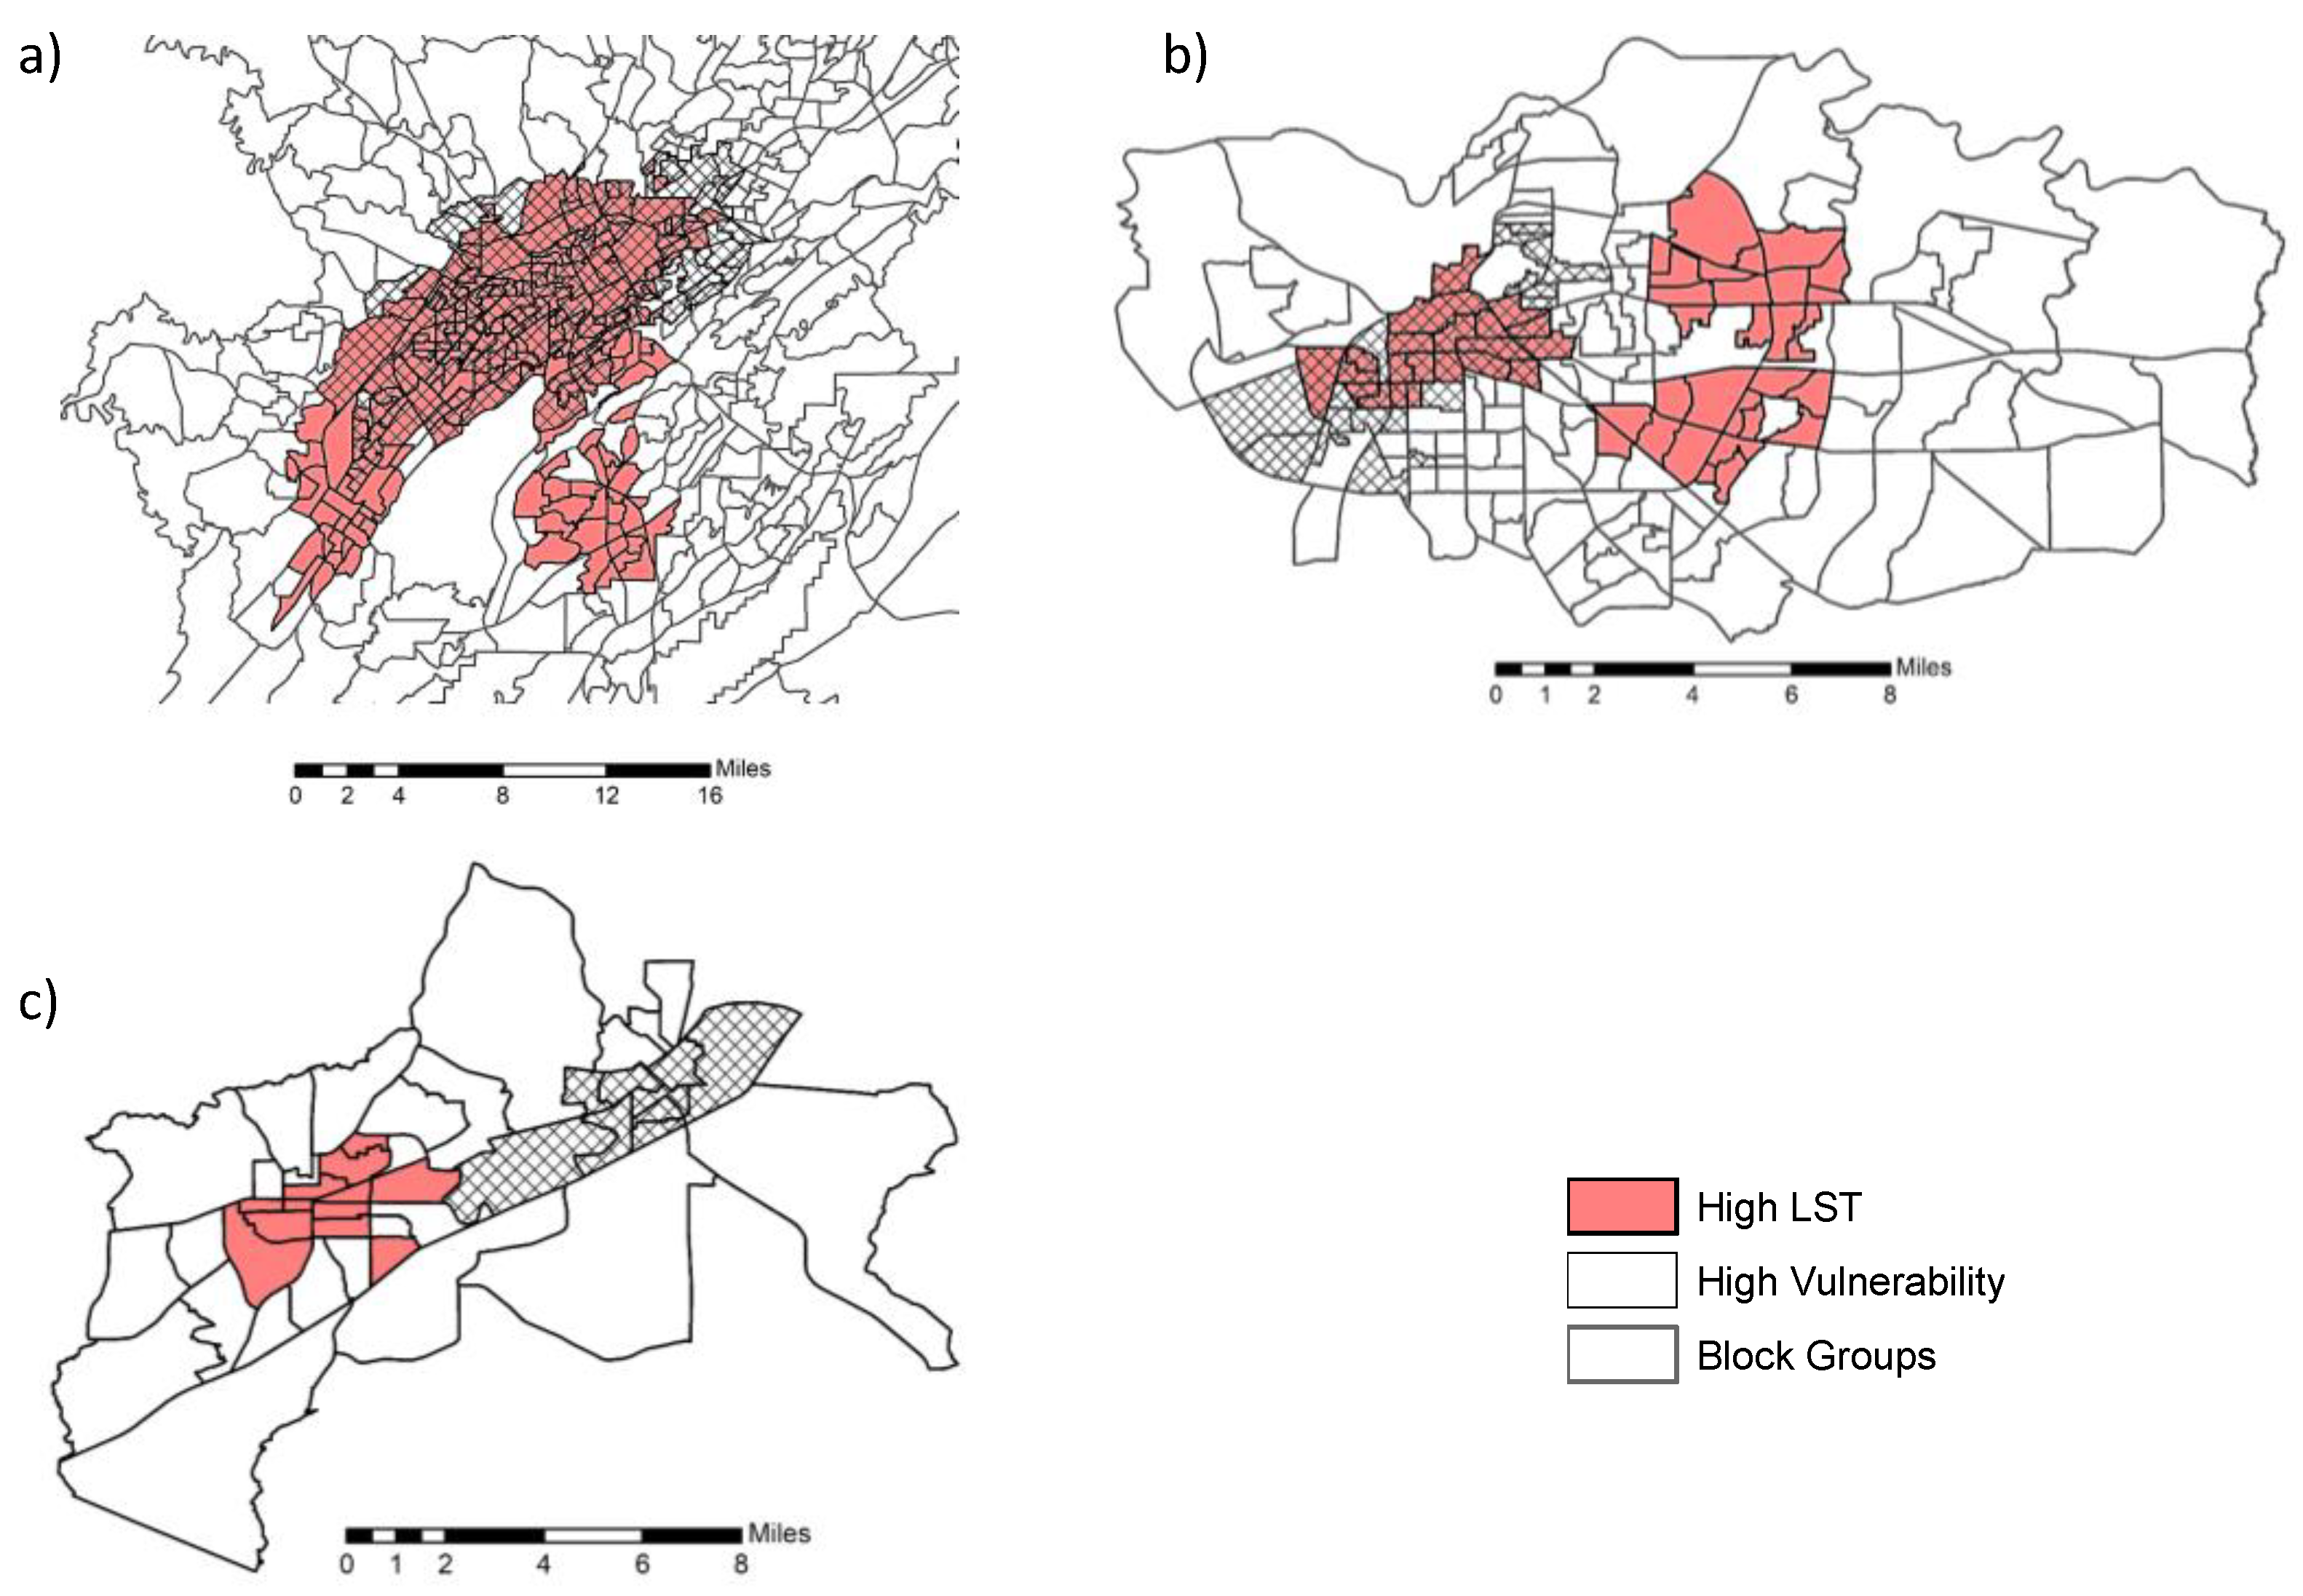

Table 1.
Indicators, description, and data sources for the sensitivity and adaptive capacity indices.
Table 1.
Indicators, description, and data sources for the sensitivity and adaptive capacity indices.
| Indicators | Description | Source |
|---|---|---|
| Exposure | ||
| Land Surface Temperature (LST) | Radiative skin temperature of the land surface | Landsat 8 thermal band (USGS) |
| Sensitivity | ||
| Impervious | Area covered by urban imperviousness (%) | NLCD |
| Seniors | Senior population, age 65+ (%) | ESRI Demographics |
| Youth | Child population, age < 18 (%) | ESRI Demographics |
| Minority | Minority population (%) | ESRI Demographics |
| Density | Population Density | ESRI Demographics |
| Isolation | Non-family household with one person (%) | ACS and ESRI |
| Isolation Pop 65+ | One-person household, 65+ (%) | ACS and ESRI |
| Linguistic Isolation | Population speaking other language but no English (‰) | ACS and ESRI |
| Disability | Households with 1+ person with disability (%) | ACS and ESRI |
| Unemployment | Unemployment rate | ESRI Demographics |
| No Social Security | Households with no social security income (%) | ACS and ESRI |
| No Insurance | Population with no health insurance (%) | ACS and ESRI |
| HH Below Poverty | Households Below the Poverty Level (%) | ACS and ESRI |
| No HS Diploma | Some high school but no diploma (%) | ESRI Demographics |
| No Vehicle | Households with no vehicle (%) | ACS and ESRI |
| Old Houses | Housing units before 1960 (%) | ACS and ESRI |
| Mobile Homes | Housing units that are mobile homes (%) | ACS and ESRI |
| Walkers | Workers aged 16+ who walked to go to workplace (%) | ACS and ESRI |
| Adaptive Capacity | ||
| Recreational | Mean distance to recreational centers and parks | City websites |
| Urban Canopy | Area covered by trees (%) | NLCD |
| New Houses | Housing units built in 2000 or later (%) | ACS and ESRI |
| Wealth | Wealth Index | ESRI Demographics |
| Vehicles | Households with 2+ vehicles (%) | ACS and ESRI |
USGS: US Geological Survey; NLCD: National Land Cover Database; ACS: American Community Survey (US Census Bureau); ESRI: Environmental Systems Research Institute.
Table 2.
Metadata of Landsat 8 images.
| Date of Acquisition | |
|---|---|
| Birmingham Montgomery | Auburn Opelika |
| 29 July 2013 | 23 August 2013 |
| 16 August 2014 | 9 July 2014 |
| 4 July 2015 | 13 August 2015 |
| 19 June 2016 | 12 June 2016 |
| 10 September 2017 | 18 August 2017 |
| 27 July 2018 | 18 June 2018 |
| 28 June 2019 | 20 August 2019 |
| 14 June 2020 | 6 May 2020 |
| 16 July 2020 | 10 August 2020 |
| 21 July 2021 | 28 July 2021 |
| Band 10 (Qcal) Thermal Constant | |
| K1 | 774.8853 |
| K2 | 1321.0789 |
| Band 10 Rescaling Factor | |
| ML | 0.0003342 |
| AL | 0.1 |
| Band 10 Correction | |
| Oi | 0.29 |
Table 3.
Results of the Kaiser–Meyer–Olkin (KMO) test and Bartlett’s test of sphericity for all subindices.
Table 3.
Results of the Kaiser–Meyer–Olkin (KMO) test and Bartlett’s test of sphericity for all subindices.
| City | Subindex | MSA | BTS p-Values |
|---|---|---|---|
| Birmingham | Sensitivity | 0.81 | 4.61 × 10⁻⁹ |
| Adaptive Capacity | 3.92 × 10⁻¹³ | ||
| Montgomery | Sensitivity | 0.68 | 2.20 × 10⁻¹⁶ |
| Adaptive Capacity | 0.64 | 2.26 × 10⁻⁸ | |
| Auburn-Opelika | Sensitivity | 0.75 | 0.014 |
| Adaptive Capacity | 0.62 | 0.039 |
MSA: Measure of sampling adequacy; BTS: Bartlett’s test of sphericity.
Table 4.
Squared factor loadings (scaled to sum to unity), variances, and resulting weight scores of the sensitivity subindex for Birmingham.
Table 4.
Squared factor loadings (scaled to sum to unity), variances, and resulting weight scores of the sensitivity subindex for Birmingham.
| Variables | Factor 1 | Factor 2 | Factor 3 | Factor 4 | Factor 5 | Combined Factors | Variance | Weight Score | Final Weight |
|---|---|---|---|---|---|---|---|---|---|
| Density | 0.207 | 0.026 | 0.207 | 0.129 | 0.027 | 0.059 | |||
| Youth | 0.003 | 0.007 | 0.361 | 0.361 | 0.098 | 0.035 | 0.078 | ||
| Seniors | 0.019 | 0.021 | 0.349 | 0.049 | 0.349 | 0.098 | 0.034 | 0.075 | |
| Minority | 0.134 | 0.063 | 0.049 | 0.022 | 0.020 | 0.134 | 0.210 | 0.028 | 0.062 |
| No Diploma | 0.121 | 0.013 | 0.090 | 0.121 | 0.210 | 0.026 | 0.056 | ||
| Disability | 0.194 | 0.194 | 0.210 | 0.041 | 0.090 | ||||
| HH B. Pov. * | 0.028 | 0.070 | 0.068 | 0.013 | 0.070 | 0.129 | 0.009 | 0.020 | |
| Walkers | 0.071 | 0.071 | 0.129 | 0.009 | 0.020 | ||||
| Unemp. Rate ** | 0.105 | 0.020 | 0.008 | 0.025 | 0.105 | 0.210 | 0.022 | 0.049 | |
| No Insurance | 0.056 | 0.015 | 0.016 | 0.009 | 0.471 | 0.471 | 0.077 | 0.036 | 0.080 |
| No S. Security *** | 0.111 | 0.018 | 0.115 | 0.057 | 0.115 | 0.098 | 0.011 | 0.025 | |
| Linguistic | 0.108 | 0.108 | 0.077 | 0.008 | 0.018 | ||||
| Isolation NF **** | 0.023 | 0.006 | 0.534 | 0.534 | 0.107 | 0.057 | 0.126 | ||
| Isolation 65+ | 0.007 | 0.058 | 0.244 | 0.009 | 0.244 | 0.107 | 0.026 | 0.057 | |
| No Vehicles | 0.095 | 0.073 | 0.040 | 0.095 | 0.210 | 0.020 | 0.044 | ||
| Mobile Homes | 0.068 | 0.151 | 0.151 | 0.077 | 0.012 | 0.026 | |||
| Old Houses | 0.084 | 0.030 | 0.042 | 0.017 | 0.084 | 0.210 | 0.018 | 0.039 | |
| Impervious | 0.018 | 0.272 | 0.054 | 0.042 | 0.272 | 0.129 | 0.035 | 0.077 | |
| Proportion Var (%) | 21.0 | 12.9 | 10.7 | 9.8 | 7.7 | ||||
| Cumulative Var (%) | 21.0 | 33.9 | 44.6 | 54.4 | 62.1 |
* Households below poverty level; ** Unemployment rate; *** No social security; **** NF: Non-Family households.
Table 5.
Squared factor loadings (scaled to sum to unity), variances, and resulting weight scores of the sensitivity subindex for Montgomery.
Table 5.
Squared factor loadings (scaled to sum to unity), variances, and resulting weight scores of the sensitivity subindex for Montgomery.
| Variables | Factor 1 | Factor 2 | Factor 3 | Factor 4 | Combined Factors | Variance | Weight Score | Final Weight |
|---|---|---|---|---|---|---|---|---|
| Density | 0.010 | 0.265 | 0.265 | 0.098 | 0.026 | 0.053 | ||
| Youth | 0.233 | 0.007 | 0.233 | 0.175 | 0.041 | 0.083 | ||
| Seniors | 0.290 | 0.042 | 0.036 | 0.290 | 0.175 | 0.051 | 0.103 | |
| Minorities | 0.120 | 0.113 | 0.016 | 0.020 | 0.120 | 0.231 | 0.028 | 0.057 |
| No Diploma | 0.203 | 0.009 | 0.203 | 0.231 | 0.047 | 0.096 | ||
| Disability | 0.087 | 0.179 | 0.042 | 0.179 | 0.128 | 0.023 | 0.047 | |
| HH B. Pov. | 0.031 | 0.080 | 0.159 | 0.159 | 0.098 | 0.016 | 0.032 | |
| Walkers | 0.034 | 0.029 | 0.034 | 0.231 | 0.008 | 0.016 | ||
| Unemployment | 0.162 | 0.027 | 0.162 | 0.231 | 0.037 | 0.076 | ||
| No Insurance | 0.008 | 0.013 | 0.013 | 0.098 | 0.001 | 0.003 | ||
| No S. Security | 0.006 | 0.060 | 0.563 | 0.009 | 0.563 | 0.128 | 0.072 | 0.147 |
| Linguistic | 0.013 | 0.013 | 0.098 | 0.001 | 0.003 | |||
| Isolation NF | 0.030 | 0.012 | 0.030 | 0.175 | 0.005 | 0.011 | ||
| Isolation 65+ | 0.019 | 0.114 | 0.164 | 0.164 | 0.128 | 0.021 | 0.043 | |
| No Vehicle | 0.244 | 0.006 | 0.022 | 0.244 | 0.231 | 0.056 | 0.115 | |
| Mobile Homes | 0.017 | 0.040 | 0.040 | 0.098 | 0.004 | 0.008 | ||
| Old Houses | 0.083 | 0.014 | 0.083 | 0.231 | 0.019 | 0.039 | ||
| Impervious | 0.011 | 0.007 | 0.352 | 0.352 | 0.098 | 0.034 | 0.070 | |
| Proportional Var (%) | 23.1 | 17.5 | 12.8 | 9.8 | ||||
| Cumulative Var (%) | 23.1 | 40.6 | 53.4 | 63.2 |
Table 6.
Squared factor loadings (scaled to sum to unity), variances, and resulting weight scores of the sensitivity subindex for Auburn/Opelika.
Table 6.
Squared factor loadings (scaled to sum to unity), variances, and resulting weight scores of the sensitivity subindex for Auburn/Opelika.
| Variables | Factor 1 | Factor 2 | Factor 3 | Combined Factors | Variance | Weight Score | Final Weight |
|---|---|---|---|---|---|---|---|
| Density | 0.134 | 0.134 | 0.238 | 0.032 | 0.071 | ||
| Youth | 0.082 | 0.093 | 0.014 | 0.093 | 0.238 | 0.022 | 0.050 |
| Seniors | 0.079 | 0.103 | 0.047 | 0.103 | 0.238 | 0.024 | 0.055 |
| Minority | 0.086 | 0.173 | 0.173 | 0.122 | 0.021 | 0.047 | |
| No Diploma | 0.026 | 0.082 | 0.082 | 0.238 | 0.019 | 0.044 | |
| Disability | 0.127 | 0.019 | 0.127 | 0.287 | 0.036 | 0.082 | |
| HH B. Pov. | 0.014 | 0.058 | 0.036 | 0.058 | 0.238 | 0.014 | 0.031 |
| Walkers | 0.018 | 0.136 | 0.020 | 0.136 | 0.238 | 0.032 | 0.072 |
| Unemp. Rate | 0.090 | 0.090 | 0.122 | 0.011 | 0.025 | ||
| No Insurance | 0.156 | 0.156 | 0.122 | 0.019 | 0.043 | ||
| No S. Security | 0.143 | 0.039 | 0.143 | 0.287 | 0.041 | 0.091 | |
| Linguistic | 0.008 | 0.097 | 0.097 | 0.122 | 0.012 | 0.026 | |
| Isolation NF | 0.076 | 0.061 | 0.076 | 0.287 | 0.022 | 0.049 | |
| Isolation 65+ | 0.086 | 0.019 | 0.009 | 0.086 | 0.287 | 0.025 | 0.055 |
| No Vehicles | 0.159 | 0.009 | 0.041 | 0.159 | 0.287 | 0.046 | 0.102 |
| Mobile Homes | 0.026 | 0.017 | 0.144 | 0.144 | 0.122 | 0.018 | 0.039 |
| Old Houses | 0.052 | 0.026 | 0.052 | 0.287 | 0.015 | 0.034 | |
| Impervious | 0.161 | 0.161 | 0.238 | 0.038 | 0.086 | ||
| Proportion Var (%) | 28.7 | 23.8 | 12.2 | ||||
| Cumulative Var (%) | 29.7 | 52.5 | 64.7 |
Table 7.
Squared factor loadings, variances, and resulting weight scores of the adaptive capacity subindex for Birmingham, Montgomery, and Auburn-Opelika.
Table 7.
Squared factor loadings, variances, and resulting weight scores of the adaptive capacity subindex for Birmingham, Montgomery, and Auburn-Opelika.
| Birmingham | ||||||
|---|---|---|---|---|---|---|
| Variables | Factor 1 | Factor 2 | Combined Factors | Variance | Weight Score | Final Weight |
| Wealth | 0.135 | 0.135 | 0.218 | 0.029 | 0.061 | |
| Recreational | 0.058 | 0.540 | 0.540 | 0.218 | 0.118 | 0.245 |
| Vehicles | 0.024 | 0.024 | 0.309 | 0.008 | 0.016 | |
| New Houses | 0.065 | 0.282 | 0.282 | 0.218 | 0.062 | 0.128 |
| Urban Canopy | 0.853 | 0.043 | 0.853 | 0.309 | 0.264 | 0.550 |
| Proportion Var (%) | 33.5 | 27.5 | ||||
| Cumulative Var (%) | 33.5 | 61.0 | ||||
| Montgomery | ||||||
| Wealth | 0.251 | 0.251 | 0.276 | 0.069 | 0.118 | |
| Recreational | 0.489 | 0.031 | 0.489 | 0.326 | 0.159 | 0.271 |
| Vehicles | 0.011 | 0.709 | 0.709 | 0.276 | 0.196 | 0.333 |
| New Houses | 0.250 | 0.008 | 0.250 | 0.326 | 0.082 | 0.139 |
| Urban Canopy | 0.250 | 0.250 | 0.326 | 0.081 | 0.139 | |
| Proportion Var (%) | 32.6 | 27.6 | ||||
| Cumulative Var (%) | 32.6 | 60.2 | ||||
| Auburn-Opelika | ||||||
| Wealth | 0.209 | 0.209 | 0.278 | 0.058 | 0.085 | |
| Recreational | 0.568 | 0.568 | 0.385 | 0.219 | 0.318 | |
| Vehicles | 0.025 | 0.912 | 0.912 | 0.278 | 0.253 | 0.369 |
| New Houses | 0.093 | 0.088 | 0.093 | 0.385 | 0.036 | 0.052 |
| Urban Canopy | 0.314 | 0.314 | 0.385 | 0.121 | 0.176 | |
| Proportion Var (%) | 38.5 | 27.8 | ||||
| Cumulative Var (%) | 38.5 | 66.3 | ||||
Table 8.
Correlation between subindices and the Urban Heat Vulnerability Index. Values are correlation coefficients (correlation method: Pearson’s R). All values are statistically significant at the 5% level.
Table 8.
Correlation between subindices and the Urban Heat Vulnerability Index. Values are correlation coefficients (correlation method: Pearson’s R). All values are statistically significant at the 5% level.
| Birmingham | Montgomery | Auburn-Opelika | |
|---|---|---|---|
| Exposure | 0.8 | 0.7 | 0.6 |
| Sensitivity | 0.8 | 0.8 | 0.9 |
| Adaptive Capacity | −0.4 | −0.8 | −0.8 |
Table 9.
Correlation between the Urban Heat Vulnerability Index and all constituting indicators. Values are correlation coefficients (correlation method: Pearson’s R). Bold values are statistically significant at the 5% level.
Table 9.
Correlation between the Urban Heat Vulnerability Index and all constituting indicators. Values are correlation coefficients (correlation method: Pearson’s R). Bold values are statistically significant at the 5% level.
| Sub-Indices | Variables | Birmingham | Montgomery | Auburn Opelika |
|---|---|---|---|---|
| Exposure | LST | 0.82 | 0.60 | 0.60 |
| Sensitivity | Density | 0.34 | 0.47 | 0.41 |
| Youth | 0.02 | 0.12 | 0.10 | |
| Seniors | 0.03 | −0.12 | −0.04 | |
| Minority | 0.65 | 0.50 | 0.59 | |
| No Diploma | 0.43 | 0.45 | 0.08 | |
| Disability | 0.35 | 0.16 | 0.41 | |
| HH Below Pov Lev | 0.26 | 0.46 | 0.16 | |
| Walkers | 0.17 | 0.30 | 0.07 | |
| Unemployment Rate | 0.44 | 0.43 | 0.28 | |
| No Insurance | 0.44 | 0.03 | 0.35 | |
| No Social Security | −0.17 | 0.07 | −0.21 | |
| Linguistic | 0.03 | 0.05 | 0.12 | |
| Isolation | 0.67 | 0.04 | 0.26 | |
| Isolation 65+ | 0.55 | 0.13 | 0.28 | |
| No Vehicle | 0.57 | 0.62 | 0.70 | |
| Mobile Homes | −0.17 | −0.14 | −0.06 | |
| Old Houses | 0.58 | 0.31 | 0.13 | |
| Impervious | 0.64 | 0.75 | 0.62 | |
| Adaptive Capacity | Wealth | −0.45 | −0.60 | −0.57 |
| Recreational | 0.50 | 0.44 | 0.12 | |
| Vehicles | −0.23 | −0.81 | −0.86 | |
| New Houses | −0.45 | −0.30 | −0.32 | |
| Urban Canopy | −0.53 | −0.42 | −0.36 |
Disclaimer/Publisher’s Note: The statements, opinions and data contained in all publications are solely those of the individual author(s) and contributor(s) and not of MDPI and/or the editor(s). MDPI and/or the editor(s) disclaim responsibility for any injury to people or property resulting from any ideas, methods, instructions or products referred to in the content. |
© 2023 by the authors. Licensee MDPI, Basel, Switzerland. This article is an open access article distributed under the terms and conditions of the Creative Commons Attribution (CC BY) license (https://creativecommons.org/licenses/by/4.0/).
Share and Cite
MDPI and ACS Style
Fall, S.; Coulibaly, K.; Quansah, J.; El Afandi, G. Differential Urban Heat Vulnerability: The Tale of Three Alabama Cities. Urban Sci. 2023, 7, 121. https://doi.org/10.3390/urbansci7040121
AMA Style
Fall S, Coulibaly K, Quansah J, El Afandi G. Differential Urban Heat Vulnerability: The Tale of Three Alabama Cities. Urban Science. 2023; 7(4):121. https://doi.org/10.3390/urbansci7040121
Chicago/Turabian StyleFall, Souleymane, Kapo Coulibaly, Joseph Quansah, and Gamal El Afandi. 2023. "Differential Urban Heat Vulnerability: The Tale of Three Alabama Cities" Urban Science 7, no. 4: 121. https://doi.org/10.3390/urbansci7040121