1. Introduction
Travel demand emerges from individual decisions. Travelers make decisions according to individual objectives, preferences, experiences, and knowledge. Furthermore, previous decisions provide travelers with unique experience and spatial knowledge, and thus influence subsequent decisions. Therefore, travelers’ decisions are both heterogeneous and evolutionary [
1,
2,
3,
4]. There has been a long-established effort both by practitioners and researchers to bridge the gap by mapping individual travel decisions onto a macroscopic context. Because of the behavioral nature of travel decisions, it is widely believed that travel demand models should treat the individual traveler as the basic unit of analysis [
5,
6,
7,
8]. Mainstream research and practice, however, has treated trips as the units of analysis since the 1950s, in part due to the lack of deep understanding of the mechanisms of travel behavior, as well as limitations in data, computational power, and algorithms. By assuming homogeneity, these models simplify the object of study to analyze large networks. Consequently, these models were highly popular in practice during the second half of the twentieth century and many algorithms and commercial software packages were developed to implement these aggregate models.
However, this trip-based modeling paradigm encounters great difficulty when it tries to describe and evaluate toll roads and advanced traveler information systems (ATIS). For example, managed toll lanes differentiate levels of service on the supply side (travelers may pay more to travel faster). As travelers who have distinct attributes (value of time (VOT), willingness to pay, travel budgets, etc.) and behavioral preferences (e.g., willingness to switch routes with potential savings) adjust their travel decisions in a differentiated market, the network can exhibit new traffic patterns, which will further affect pricing strategies and investment decisions. Traditional trip-based models cannot provide an accurate description of this complex mechanism, so they are incapable of addressing important issues such as equity. Many researchers [
9,
10,
11,
12] have emphasized the importance of equity as a consequence of road pricing and pointed out “equity is an individual, not a group, problem” [
13]. To account for this complexity, transport economists and policy makers have long advanced their focus from first-best prices with homogeneous network assumptions to second-best prices under heterogeneity for both network users and service providers [
14,
15,
16,
17,
18,
19,
20], which requires explicitly modeling individual travelers’ route choice behavior. Although some researchers have studied these problems on small networks, a behaviorally based model, which is not only sufficiently accurate but also applicable on a large network, does not exist [
8].
It is crucial to recognize that travel decisions are based on travelers’ knowledge about the network. Travelers, limited in their capability of acquiring, processing and storing spatial knowledge, can only consider the routes they know. This is the very reason that engineers try to assist travelers to make decisions by providing additional information about the network through technologies like ATIS. As indicated by [
2], ATIS cannot be well evaluated without explicitly accounting for the “heterogeneity in behavior” and “the presence of dynamic learning and adjustment processes in user behavior”. Other researchers [
21,
22] also emphasized the role of information and learning in traveler behavior such as route choice decisions. However, limited work has been done to systematically model the mechanism of acquiring, processing, storing of spatial knowledge and its communication among travelers.
The route choice model maps travel demand (traditionally defined by an origin-destination (OD) trip table, or in more recent research and practice as a list of travelers with particular attributes going between two points) into a link flow pattern or “assignment” of traffic. Theoretical research in this field has a long history. Varying in assumptions of route choice behavior, many assignment models and corresponding algorithms have been proposed. All-or-nothing is a simple route choice model that assumes travelers minimize some disutility (usually travel time) while ignoring what other travelers are doing. If we take other travelers into account, this minimization assumption, known as Wardrop’s first principle [
23], leads to the user equilibrium (UE) model (which is a network analog to the contemporaneously but independently developed Nash equilibrium in game theory) [
24]. The original UE models assumed perfect knowledge of the network by travelers and also assumed all travelers were identical (homogeneous). As concerns about the heterogeneity problem increased (see e.g., [
20]), some researchers tried to solve the heterogeneity problem employing discrete choice models. Introducing a random perception error in travel time and treating it with discrete choice models, Daganzo and Sheffi [
25] proposed the stochastic user equilibrium (SUE) model. While multinomial logit models suffer from the so-called independence of irrelevant alternative problem and many alternatives, including nested logit, probit and logit kernel model, have been proposed to mitigate this problem [
5]. Although individual differences may be considered in these models, those differences are often simplified, and distributions (typically normal or extreme-value distribution) among population are assumed, ignoring complexity in choice behavior.
Applications such as road pricing require explicit consideration of individual characteristics and fast solutions on large networks. Although some researchers introduced the bi-criteria or multi-class assignment [
4,
26] and partly solved the heterogeneity problem within a trip-based modeling framework, the rapidly increasing complexity when further subdividing traveler population limits its flexibility and potential for real-network applications. The potential for new individual-based route choice models is driven not only by policy applications, but also due to advances in understanding of the mechanisms of travel behavior, fast-growing computational power, and increasing data availability. Many route choice models have been developed and integrated into travel demand models applicable on regional networks [
2,
27,
28,
29,
30,
31,
32,
33,
34]. The most frequently cited models in the literature are summarized and compared in
Table 1.
Although the models summarized in
Table 1 are exclusively individual-based, they diverge in details, representing different assumptions about traveler behavior and modeling strategies. Route choice is usually modeled as a two-step process [
36], including choice set generation and choosing among alternatives. Travelers, limited in their capability of acquiring, processing and storing spatial knowledge, can only consider the routes they know. This is the very reason that engineers try to assist travelers to make decisions by providing additional information about the network through technological innovations such as ATIS. DynaMIT and DYNASMART explicitly model information provision from ATIS and investigate its influence on traffic flow patterns. However, most vehicles are not equipped with information devices, and those devices remain limited in their ability to use what real-time information exists, and instead travelers rely on personal knowledge to make decisions (e.g., among the respondents of a survey conducted by the authors, after the I-35W Mississippi River Bridge collapsed, 59 percent claimed that they chosen alternative routes based on personal experience). Limited work has been done to model systematically how such personal knowledge or experience is acquired, processed, stored and communicated [
37]. Instead, many models enumerate and choose the shortest path, implicitly assuming perfect knowledge. For example, Jha et al. [
38] assume drivers are provided with travel time information on five shortest paths when investigating day-to-day dynamics using DYNASMART. Some models such as MATSIM [
35] generate a pre-determined choice set, using the K-shortest path algorithms [
39]. Examples of such algorithms include link elimination [
40], link penalty [
41], branching [
42] and recent random loading and mutating [
35]. Bekhor et al. [
36] provides empirical studies for those algorithms. Many researchers criticize these models for generating routes by the network, not the agents [
37,
43], arguing that a mental map that is built successively over time should be introduced to model the incremental learning and generate choice sets.
In terms of choosing among alternatives, mainstream models such as DynaMIT [
27] and DYNASMART [
2,
30] employ the random utility maximization (RUM) framework, which has been widely used in economics. Some researchers [
44] criticize RUM, suggesting it describes how travelers should choose routes instead of how they actually do. Other critiques concern the complete knowledge assumption under RUM. However, researchers such as McFadden [
3] suggest it is more promising to improve RUM rather than discard it completely in modeling traveler behavior. For example, Arentze and Timmermans [
37,
45] model the information gain as a factor that motivates travelers to choose otherwise unfamiliar or unfavorable routes. Chorus et al. [
46] introduced the concept of regret minimization to model both maximizers and satisfiers with travel time uncertainty under an integrated framework. An alternative decision-making strategy is the rule-based formalism adopted in ALBATROSS [
34]. It assumes that travelers follow some satisfactory and habitual process, which is constrained by their social economic status and can be captured by a decision tree. Rules are exhaustive and mutually exclusive, each representing certain choice habit existing in the population. This process is more intuitive since many behavioral studies (Golledge et al., 2002) suggest decisions are guided by simple rules rather than a complex evaluation process. However, the number of possible rules increases rapidly under multi-dimension choice situations and a large data set is required to capture underlying rules. Both modeling strategies exhibit strengths and weaknesses and there is currently on consensus on which is superior.
Operational models of choice set generation and route choice can inform but cannot replace theoretical and empirical investigation and modeling of travel information. For example, if a road is expanded or the toll rate is increased, how does this information spread across the population and how does network performance evolve? Studies in behavioral geography [
47,
48] and cognitive science [
49] shed light on this issue. Cognitive map theory indicates that routes must be either experienced or learned before being repeatedly used over time. Environmental anchors, including landmarks, choice points (e.g., transfer center), important path segments, and distinct areas (e.g., shopping centers) are crucial for both cognitive mapping and way-finding. Route storage is hierarchical and it is much easier to combine road segments among those anchors to encode new routes (an “integration” process). Route selection criteria are surprisingly diverse, and include minimizing actual or perceived cost, avoiding congestion, selecting the route with the fewest stop signs, and avoiding left turns. Information-processing theories of choices also suggest decision makers’ choice strategies are simple, local and myopic when facing complex systems [
50,
51,
52]. Moreover, Bandura learning theory [
53] suggested that travelers could learn routes from each other through observing or communicating. Route learning could also be trial-and-error, characterized by evolutionary development of knowledge and adjustments in behavior over time. Some researchers [
37,
43,
45] have emphasized the role of cognitive mapping theory in modeling route choice. However, the exchange of information, or “social contact” [
45], has been ignored for simplicity.
Some previously mentioned models have explored this research direction. For example, METROPOLIS assumed that the perception of network conditions follows Bayes’ Law [
31,
32] and a Markov process of order one has been introduced to combine historical and instantaneous information. An information center is introduced to process travel knowledge and provides travelers with the expected journey travel time, which represents the collective history of all travelers. Travelers are assumed to switch to alternatives according to an exogenous vanishing probability, which is arbitrarily assumed to enforce a convergence in day-to-day dynamics. Chorus et al. [
46] introduced an abstract information service in their model to provide both travel time and associated uncertainty (variance) on predetermined alternative routes to all travelers. Although the universal accessibility to the pooled information when generating alternatives represents an exaggerated learning probability, it provides a good start to explicitly model information spreading. In contrast, the learning process in Albatross [
34] relies on individual history. Information about one particular route can only be enhanced through repeated observations (also known as reinforcement learning). Travelers can only indirectly access other travelers’ information through network feedback (e.g., congestion) and no direct information exchange is assumed. These models represent two extremes in modeling information spread on the network. Ideally, if we can correctly capture the formation of knowledge and decision-making process, it is possible to model the spreading of knowledge and evolving network performance over time due to changes on the network. Modeling of the transitional state could provide more guidance to long-term planning than equilibrium analysis, especially when network performance could be history-dependent or ever-changing in reality. Advancement in these research directions would also promote the development of dynamic models of urban systems, which currently rely heavily on the user equilibrium assumption [
54,
55]. He et al. [
56] examines day-to-day traffic assignment. Tilahun and Levinson [
57] showed that people choose work/home pairs based on social networks, which implies learning and exchange of information. This structure was modeled in [
58].
To bridge the gap between the aforementioned need and current practice in modeling, this paper explicitly models the formation and spread of spatial knowledge (route information) among travelers and tracks the choices of each decision-maker on a road network over time. Individual travelers are treated as the unit of analysis, and extending previous work [
7], an agent-based route choice (ARC) model is built to map individual choices into system flow patterns. Given a set of system parameters, the modeled road network can evolve a specific flow pattern, replicating real-world network changes. This agent-based approach, representing a significant departure from much previous literature that has primarily relied on equilibrium analysis, is also applicable on large real-world transportation networks. The ARC model is next introduced, addressing issues found in the comparison of models presented in this section. Its properties are discussed and demonstrated with application on the Chicago sketch network. Models such as ARC produce insights that may have significant implications for a more comprehensive agent-based travel demand model.
2. Materials and Methods
2.1. Model Framework
As presented, cognitive mapping and way-finding theory suggests (1) travelers learn routes through experiencing and communicating with others; (2) spatial knowledge has hierarchy and can be updated through an integration process; and (3) travelers’ capability of processing spatial knowledge is bounded and a trial-and-error process may be involved. Based on these assumptions, together with the assumptions of heterogeneous travelers, the ARC model is developed in this section.
ARC simulates spatial learning, tracks evolutionary route choices, and generates macroscopic flow patterns, which may be used to evaluate policy initiatives or be used as input for a more comprehensive travel demand model. Travelers acquire spatial information through traveling and experience, and then spread that information (and receive other information) through communication across a social network. Although travelers also decide on destination, time schedule, mode and travel route (all of which comprise the demand side of travel activities) all but route are taken as given in this paper to avoid confounding factors. Nevertheless, these demands are constrained by the supply: network capacity and tolls, which are also taken as given in this paper. Although assumptions about a priori network knowledge can be made (people may learn the network skeleton through media such as maps when first arriving), this paper excludes such possibilities. Travelers have to explore the network and knowledge can be acquired, processed, accumulated, and enriched through communication. As suggested by cognitive mapping theory, environmental anchors help to construct new routes by integrating existing knowledge. Since the networks used in this study are incomplete representations of actual transportation networks, all nodes are regarded as anchors and can be used for constructing new routes. Travelers interact at many frequently visited locations (e.g., neighborhood centers, workplaces, shopping centers, etc.), and it is natural to assume network knowledge can only be communicated at centroids (representing important locations in currently planning practice). Information pools will be built for each centroid to represent the collective historical experience for visiting travelers and to simulate information processing and communication.
Given personalized information decision-makers will make route choices according to their individual attributes, goals and behavior rules. Considering these heterogeneities, it is intuitive to follow an agent-based modeling strategy, by which it means each object behaves by following certain rules as if it makes judgments intelligently (Transportation Research Part C (2002) dedicated a special issue to this topic). Integrated with other agent-based models, including residential and job location choice, land use, and infrastructure investment models, ARC could enable a wide spectrum of studies in transportation and land-use related topics. The following sections describe the modeling framework in detail.
2.2. Agents
The model contains three types of interactive agents: travelers, nodes, and links, all of which have individual attributes and rules.
Travelers are characterized by their willingness to pay (
u), value of time (
v) and capability of getting information (
s). Willingness to pay reflects how many resources have been allocated to travel and thus determines how far a traveler could travel. Individual value of time provides travelers’ an impetus to choose routes with different travel time and toll combinations. Travelers with a larger social network and better information resources distinguish themselves in their ability to gain information from their peers who have a less effective social network and less exposure to new information. Although many route choice preference rules have been studied in the literature [
36], there is currently no consensus about their distribution among the population. Limited by data currently available and considering application possibilities on road-pricing studies, this paper assumes travelers prefer to reduce their personal expense on travel.
Consistent with current practice in planning, there are two categories of nodes: network vertices and centroids. While vertices represent starting and ending points of links, centroids represent residential locations and workplaces. Applying social learning theory, centroids are also where people interact with each other and communicate spatial information. For example, people can learn travel information from their colleagues at the workplace or from neighbors meeting in a grocery store. Suggested by cognitive map theory, traffic information can only be generated through experience. However, information brought to centroids will be pooled and shared by all frequent visitors (e.g., people who live or work there). Consequently, information pools are introduced to simulate such knowledge merging and sharing process. New routes can be constructed by integrating existing ones through segment commuting. Travelers get exposed to such information according to a possibility distribution, which defines the speed of information spreading. This speed defines an important characteristic (communication intensity) of our society and could significantly influence network performance. Moreover, information availability is limited and only information of value (e.g., useful shortcuts) tends to be spread. Therefore, only up to K paths from every other node on the network to the current node will be kept. This pooled knowledge is updated as new information is available and fed back to subsequent visiting travelers.
Links represent directed roads and are labeled with the origin, destination, capacity (C), free flow travel time (to), and toll rate (p). Link travel time (t) and generalized link cost (c) can be derived given the traffic flow and link cost function. The BPR function is employed in the model to map flows to travel time. And the toll rate can be set according to the application environment.
2.3. Rules
ARC simulates individual route choices and determines the flow pattern on the network subject to a given OD distribution.
As previously discussed, the initial route choice can be either given or generated by a random walk route searching process at iteration 0. In the random walk scenario, travelers set off from their origins and travel in a randomly chosen direction, updating directions after arriving at each node. Each link chosen on this walk is determined randomly (from a uniform distribution) at the immediately upstream node. However, directed cycles and U-turns are prevented. Once travelers arrive at the destination, their travel routes become the initial travel route and will be updated in subsequent iterations. The randomness of searching direction and the large number of travelers will ensure the diversity of initial route choices, which comprises the knowledge-base for subsequent iterations.
On subsequent iterations, each traveler follows a fixed route chosen at the end of the previous iteration. Once arriving at a destination centroid, travelers will enrich the information set with their individual knowledge while benefiting from the pooled knowledge at the same time by exchanging both shortest path and toll information with centroids. Those travelers will also bring that updated information back to their origin and repeat the exchange process. The information exchange mechanism is illustrated by
Figure 1.
As illustrated in
Figure 1, suppose that the traveler originating at node 1 is traveling to node 5, initially via node 4. His initial shortest path knowledge is 1–3–4–5. Suppose the shortest path information stored at node 5 is 4–5, 3–5, 2–3–5 and 1–2–3–5, respectively from nodes 4, 3, 2 and 1. The comparison starts from the node closest to the current node along the path chain in the traveler’s memory and repeats for each node on this chain until reaching the origin. After comparing the path from node 3 to 5, the traveler’s path information is updated to 1–3–5 since the shortest path for this path segment proposed by the node is shorter than that held by the traveler. Notice that this improvement has also changed the shortest path from node 1 to 5 in the traveler’s memory. Consequently, the node will adopt the path from node 1 proposed by the traveler since 1–3–5 is better than 1–2–3–5. The updated path from node 1 to 5 then becomes part of the traveler’s shortest path information. This information exchange mechanism will naturally mutate the path chain and generate the most efficient route, sometimes better than all known existing routes. Since nodes store
K alternative paths, nodes will insert the path proposed by the visitor in their information pool as long as this path is better than the longest path stored. This information will also be shared with those travelers visiting node 5 at subsequent steps.
After stopping at the destination node, travelers compare their travel route determined at the end of previous iterations and shortest path learned during the currently iteration. The path length is evaluated in dollar value by each traveler, considering their individual value of time and the toll charged by each link segment. Since travelers have different values of time, the cost of
K alternatives should be reevaluated and sorted for each traveler. If the path suggested by the destination node is better than their current route, the travelers have a probability (
P) to switch to the better route of that iteration. In general,
To apply this model, we choose a specific form of probability (
p):
where:
b represents the potential benefit by switching routes, which is defined as the time or money saving by choosing a route proposed by the destination node instead of sticking to the current route.
T is the threshold of benefit perception, which reflects both the incapability of perceiving a small benefit and the inertia for people to change route. Future research could test a relative threshold, where, e.g., T is a function of trip distance or duration or benefit.
s denotes the probability of perceiving an existing better route in a given day, and captures the differentiation in the effectiveness of social networks.
γ defines the shape of the probability curve.
ARC simulates the day-to-day route choice behavior of travelers and this probability curve must account for two factors: (1) the probability a traveler perceives this better path once its information is available and (2) the probability a traveler takes this path once it is learned. It should be noted that information spreading takes time and not everyone learns immediately. Travelers with more effective social networks are more likely to be exposed to such information and thus have a higher probability of learning the better path. Once a new road opens, it takes weeks or even months before the flow reaches a stable level. Even when people learn a better alternative, route change involves a certain switching cost preventing travelers from changing routes immediately. Or travelers may just resist changing because of inertia. Considering these factors, this curve should increase as benefits increase and reach some upper limit predicted by the willingness to learn. Estimation of this curve through surveys or other psychological studies will enhance the empirical foundation of the model.
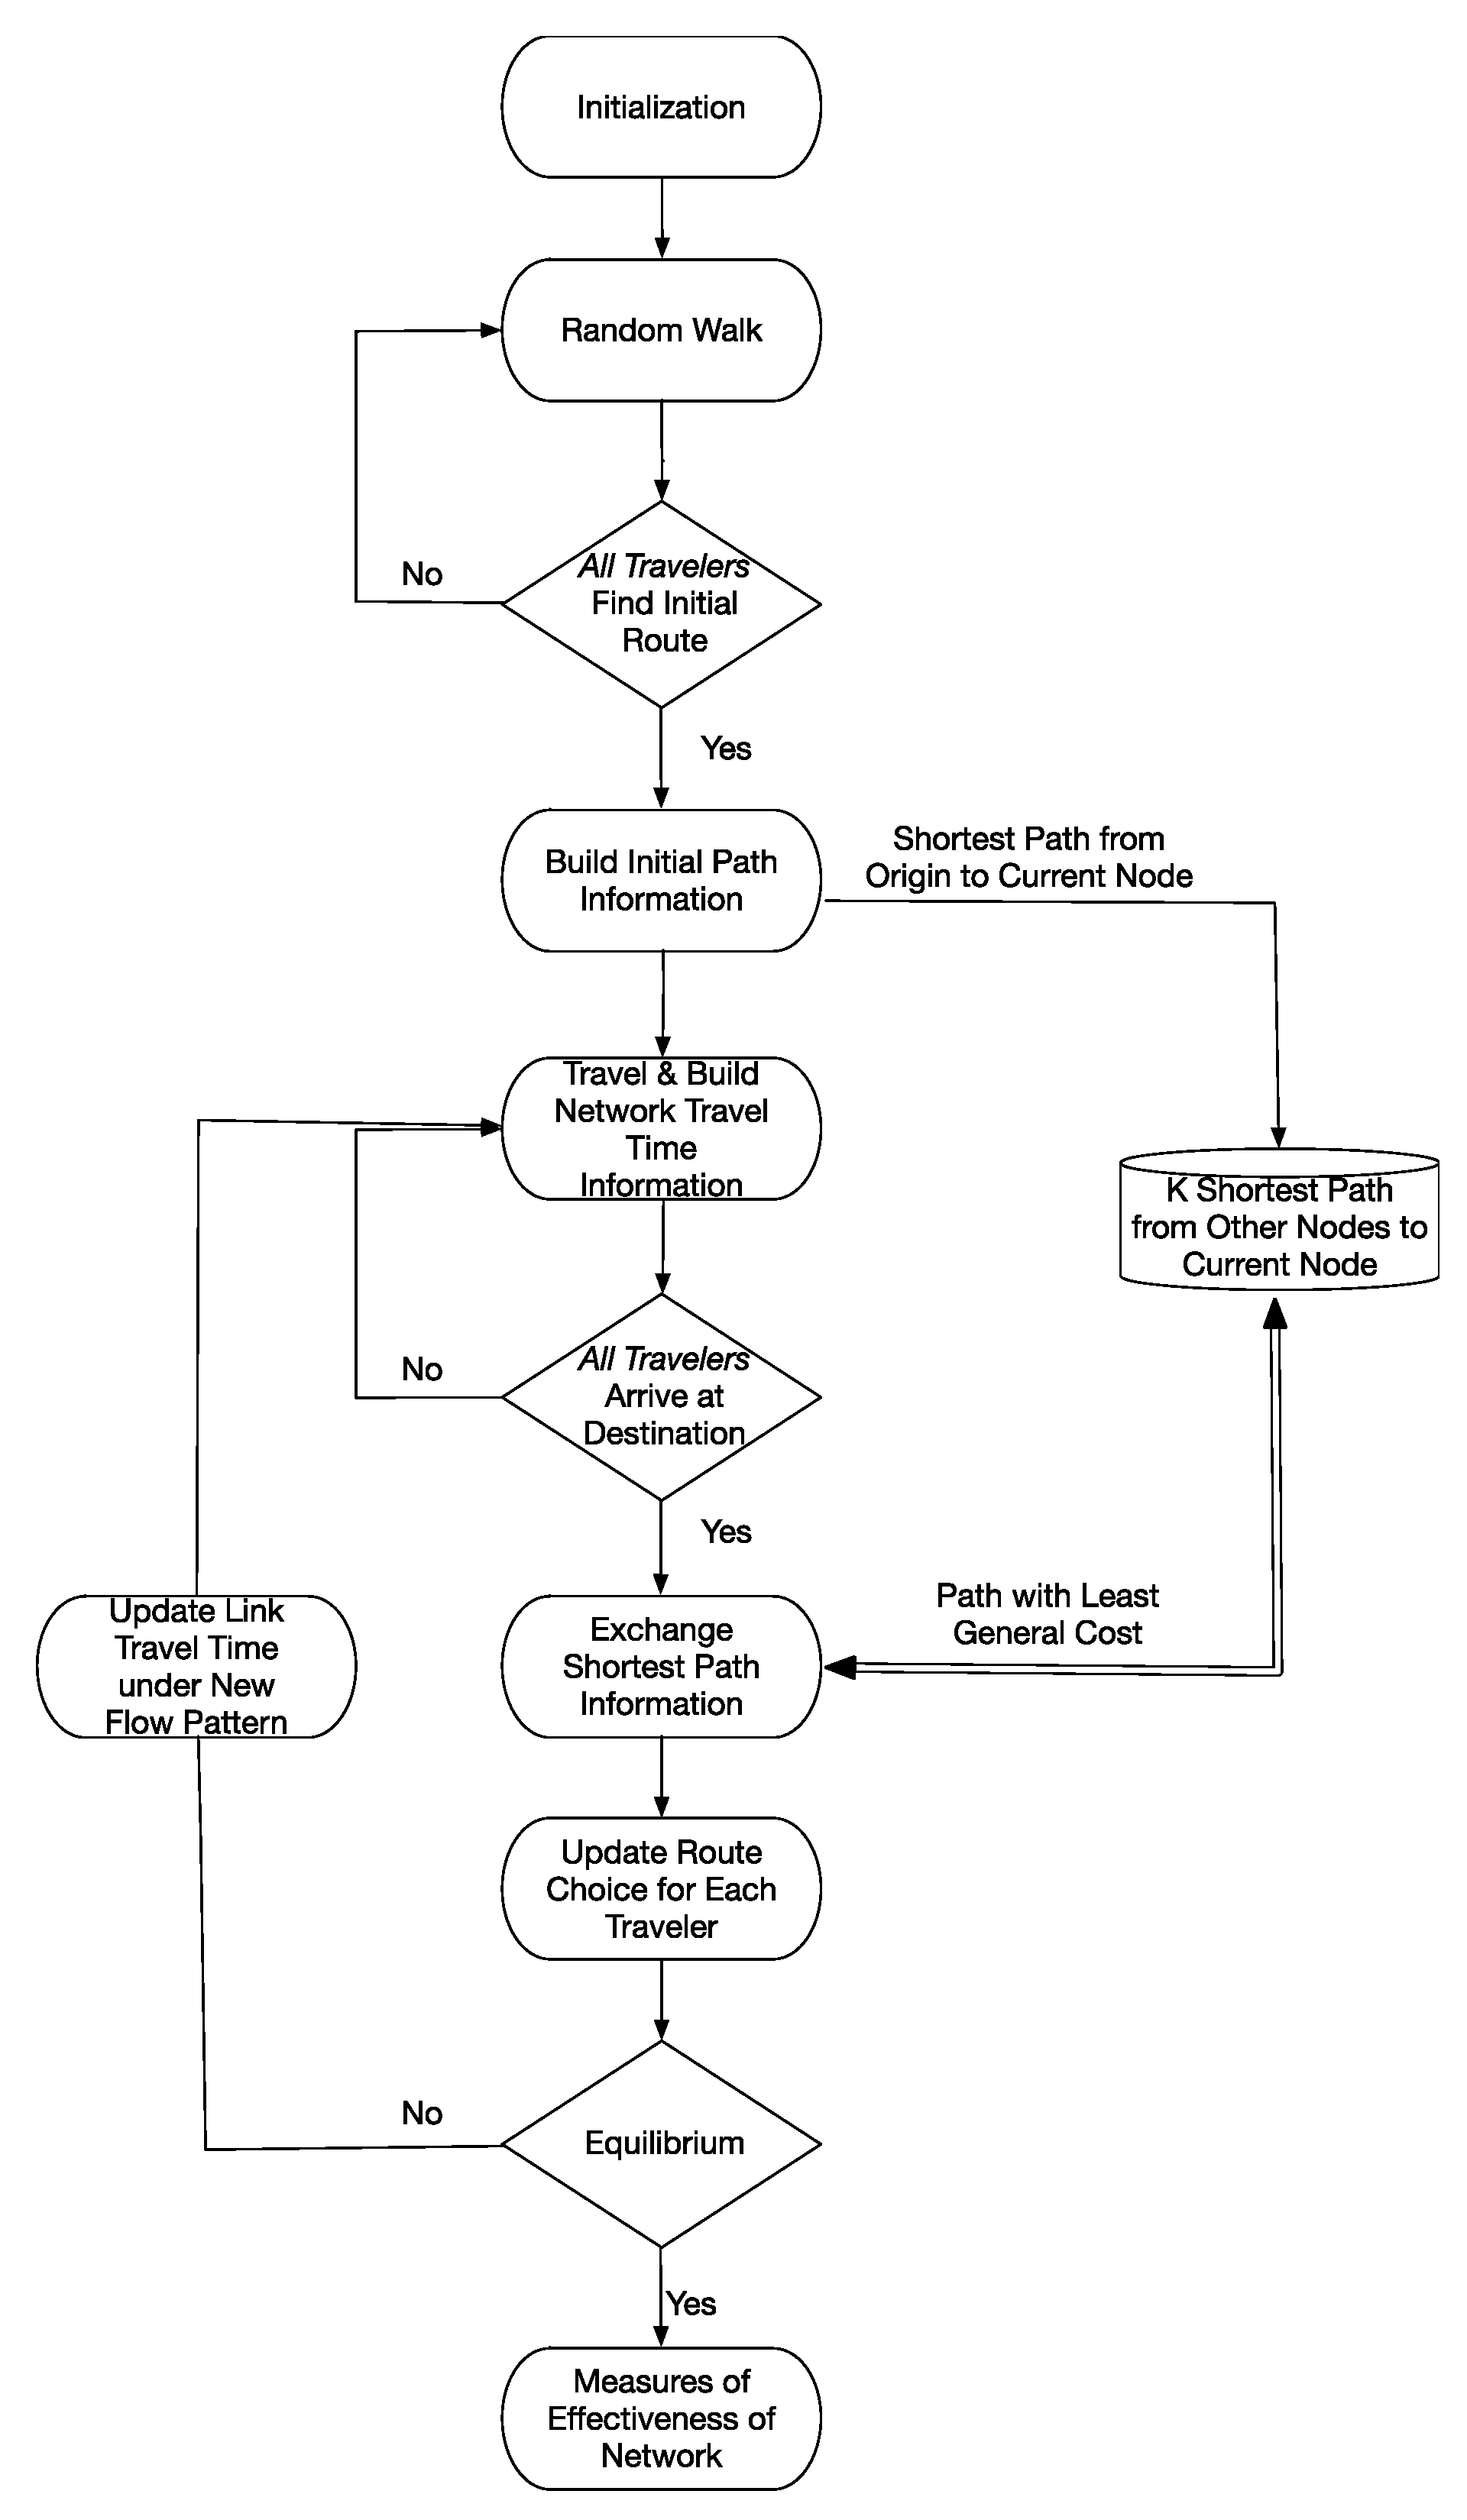
Figure 2 illustrates the flow chart of ARC. After travelers choose their routes according to the aforementioned probability, link flow and link travel time will be updated. Consequently, the cost of all possible paths stored both at nodes and travelers will be updated without changing the choice set. Then travelers will follow their new route and repeat the described process until an equilibrium pattern is reached (equilibrium is defined here as link flow variance smaller than a pre-determined threshold ε; we arbitrarily choose ε = 5, any convergence criteria can be used, and would be equally arbitrary, simply reflecting willingness to tolerate variability in the neighborhood of equilibrium). Once this equilibrium is reached, no traveler has the incentive to change their travel route according to their behavioral rules and available information. Thus, a link flow pattern would be reached and could be provided to other models under a more comprehensive framework.
3. Results
Numerical experiments were conducted on the Sioux Falls network, a widely-used test network. The Sioux Falls network contains 24 nodes and 76 links, and there are 336,400 daily trips [
59]. The number of trips between OD pairs has been rounded to integers.
The value of time is an important characteristic of travelers and can be derived from survey data. This study assumes that value of time follows a normal distribution with a mean of $10/h and a standard error of $2/h. Again, the values are arbitrary for proof of concept, typical USDOT values of time are on the order $15/h. We then generate our traveler agents by randomly assigning this characteristic subject to the chosen distribution.
Travelers’ route choice decisions regarding benefits generated from route switching is the behavioral foundation of ARC and is crucial to determine the overall performance of our traffic assignment model. A route switching probability insensitive to potential benefits leads to premature convergence, which is far from user equilibrium and generates unrealistic flow distribution among links. In this case, the final flow pattern is primarily determined by the initial route choice of travelers. However, an overly sensitive probability will lead travelers jumping between alternative paths. This flip-flop phenomenon prevents the model from approaching equilibrium and the flow pattern is also unrealistic. A feasible distribution of route choice should follow in between and can be derived from a survey or more ideally, from an experiment conducted in the field. After testing different parameter combinations, we choose the values (γ = 1, T = 0.1 min, and s = 0.333 uniform for all travelers) ensuring fast convergence and accuracy equivalent to UE assignments.
3.1. Comparison to User Equilibrium (UE) and Stochastic User Equilibrium (SUE) Assignments
UE assignment (Frank–Wolfe algorithm) and SUE assignment (Dial’s (1971) [
59] algorithms with a
θ (the path diversion probability) of 1 and standard method of successive averages (MSA)) are common practices in transportation studies. Despite starting from a different modeling philosophy, ARC should be able to generate results similar to those classical assignment problems with reasonable computing time to validate its applicability in practice. To make these models comparable, we assume the tolls on all links equal zero in this initial example (we vary them later), keeping other attributes such as capacity and free flow travel time the same [
60]. We also adopted BPR function as our flow-cost function. It takes 35 iterations for ARC to reach equilibrium when simulating 336,400 daily trips on the Sioux Falls network. The three models have been coded in Java and were implemented on an Apple PowerMac G5 2.7GHz.
Table 2 summarizes the difference in link flow compared to the best-known result proposed by Bar-Gera and Boyce [
60] (according to UE principle) and corresponding running time. This comparison indicates that the macroscopic link flow pattern emerging from the individual decision-making process modeled in this study is very close to the UE link flow pattern. Since both SUE and ARC assume the existence of perception error and probability in route choice, it is not a surprise to observe that ARC generates a flow pattern very similar to that of SUE, which further implies that our assumption in terms of route switch probability is reasonable. Therefore, if we incorporate tolls on links and assume static conditions, we could expect a link flow pattern close to a UE or SUE assignment based on generalized cost.
Although the running time of ARC looks much longer than that of UE and SUE, we must realize that ARC generates much more information at the expense of running time. Actually, we could trace the route choices of individual travelers over time and generate various statistics (e.g., average value of time) of users on links and paths, by zone, or for the network, which enables the study of questions such as equity or market differentiation. Moreover, ARC is more sensitive to the number of travelers than the scale of the network. Noting that the real network contains many more nodes and links but slightly more trips compared to the simplified Sioux Falls network, ARC shows advantages when applied in practice, which will be demonstrated in the following section.
3.2. Sensitivity Analysis
There are several variables in the model that may significantly affect the results. Sensitivity tests are conducted on these variables: size of information set, sensitivity to route switching, and perception threshold. These are discussed in turn for both the Sioux Falls and Chicago networks.
The size of information sets kept on centroids, or the number of alternative paths (
K), reflects the diversity of path information available and the extent of people’s information-processing capability when making the route choice. Some destinations, such as downtown transportation hubs, are able to provide more choices than others because of their affluence of information. They are also the most frequently visited nodes. This model assumes a uniform size of choice set through the whole network for simplicity and the network performance with different sizes is summarized in
Table 3. A larger
K means more alternatives are available when making a route choice and consequently it results in an assignment more comparable to the UE assignment, with other factors controlled. However, more alternatives may lead to more trial-and-error cycles and consequently it may take more iterations to achieve convergence. As illustrated by
Table 3, the difference is less significant when
K is larger than 4. We may conclude that four alternatives for each OD is a large enough choice set on the Sioux Falls network. However, whether this conclusion still holds on a larger network is still an open question and needs further tests.
The changing of route imposes some costs and thus travelers may ignore those routes bringing a trivial reduction in travel cost. This reluctance to switch routes is captured by the perception threshold
T in the model. Outcomes under different threshold choices are summarized in
Table 4. A larger threshold means travelers are more reluctant to switch routes and the model will consequently converge faster. However, since UE assignment assumes perfect travel cost perception and absolute equilibrium, a larger threshold will also lead to a more significant deviation from UE assignments. Experiments reveal that link flows with a threshold larger than
T = 0.2 min are significantly different from those generated by UE assignment.
3.3. Demonstration on Larger Network
Although ARC consumes many computational resources in tracking the decisions of individual travelers, it is still tractable on large real networks. A demonstration has been conducted on the Chicago sketch network (CHS), a fairly realistic yet aggregated representation of the Chicago region developed by the Chicago Area Transportation Study (CATS). As an agent-based model, ARC does not deal with fractional demand. Consequently, the original OD table provided by Bar-Gera [
59] has been rounded to integer trips. In this study, ARC simulates the decision-making process of 1.13 million traveler agents on a network with 387 centroids, 933 nodes, and 2950 links. To evaluate the emerging pattern predicted by ARC, the same OD has been assigned using the origin-based assignment (OBA) algorithm [
61] and this assignment is taken as the best known assignment according to Wardrop’s principle. All of the three models, ARC, UE (Frank–Wolfe), and SUE (Dial’s algorithm with a
θ of 1 and MSA), have been coded in Java and run on the same computer for 100 iterations each. The link flow comparison is summarized in
Table 5.
As indicated in
Table 5, ARC generates a flow pattern with a smaller discrepancy compared to the OBA assignment than the alternatives, while UE and SUE have very similar results.
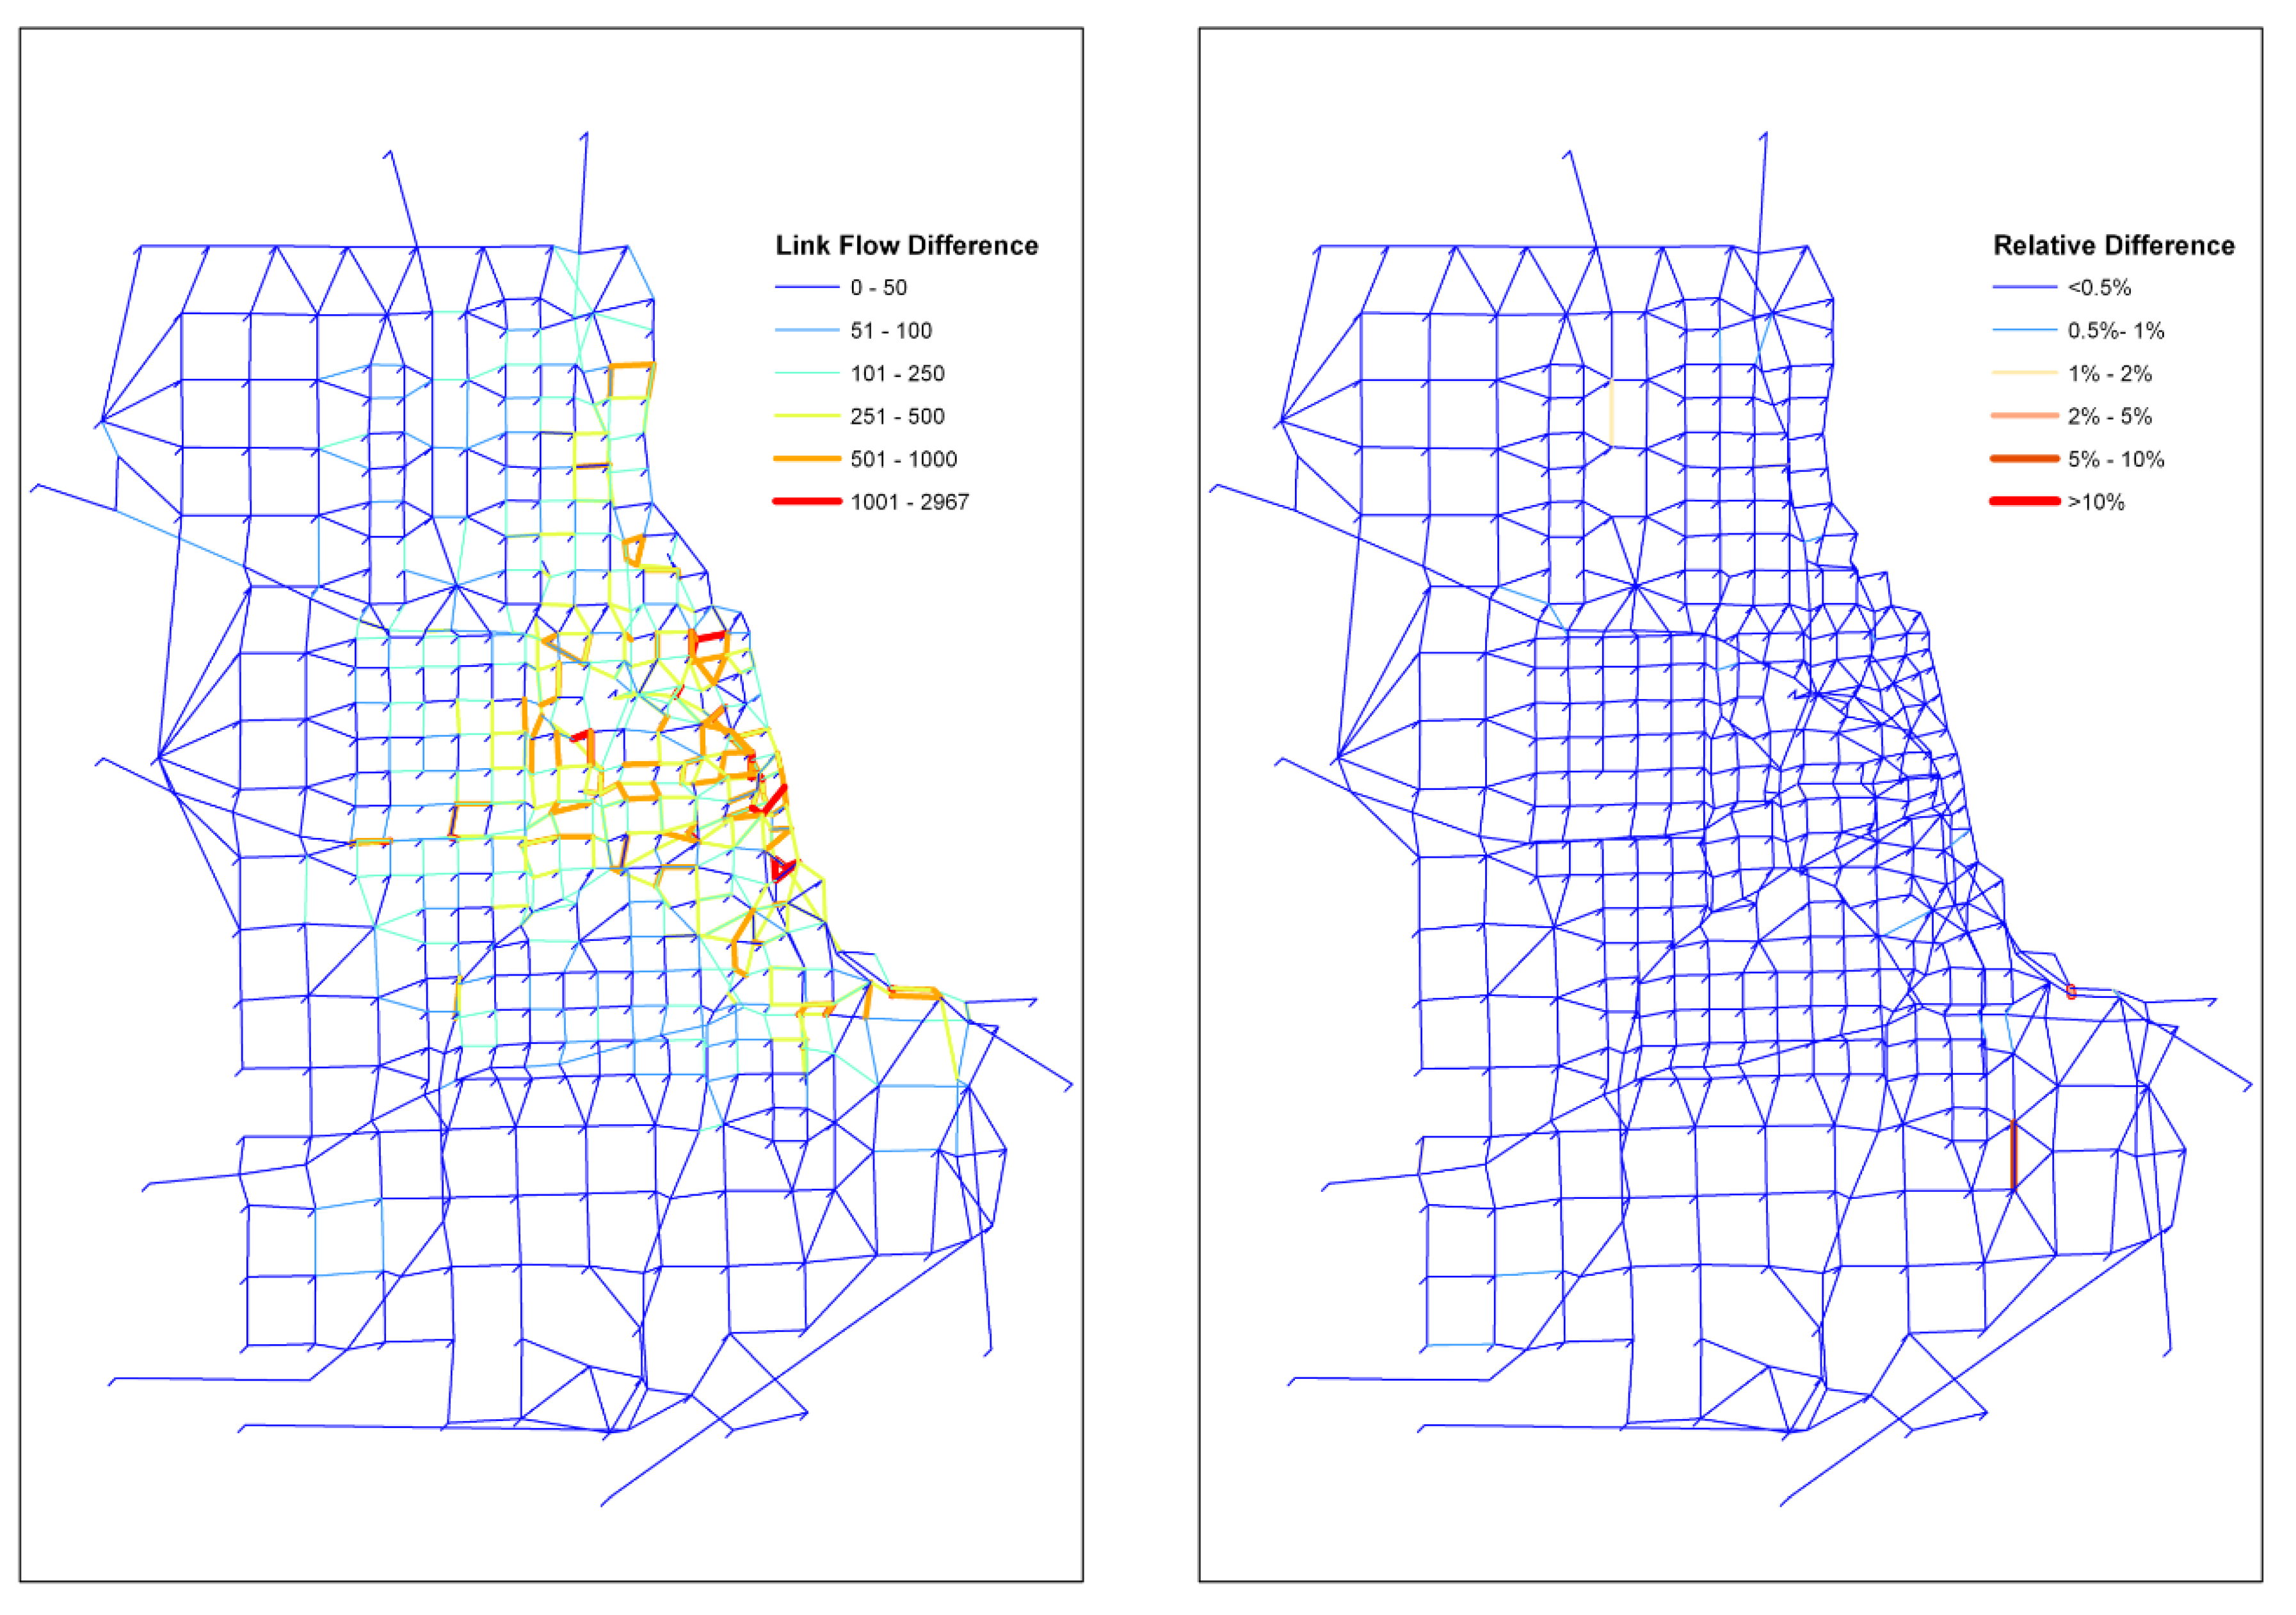
Figure 3 further illustrates that the flows on most links are very consistent with the best-known assignment generated by OBA. This comparison suggests that ARC has very good performance on large networks and this advantage is more significant if we consider the details ARC can provide and its solid behavioral foundation.
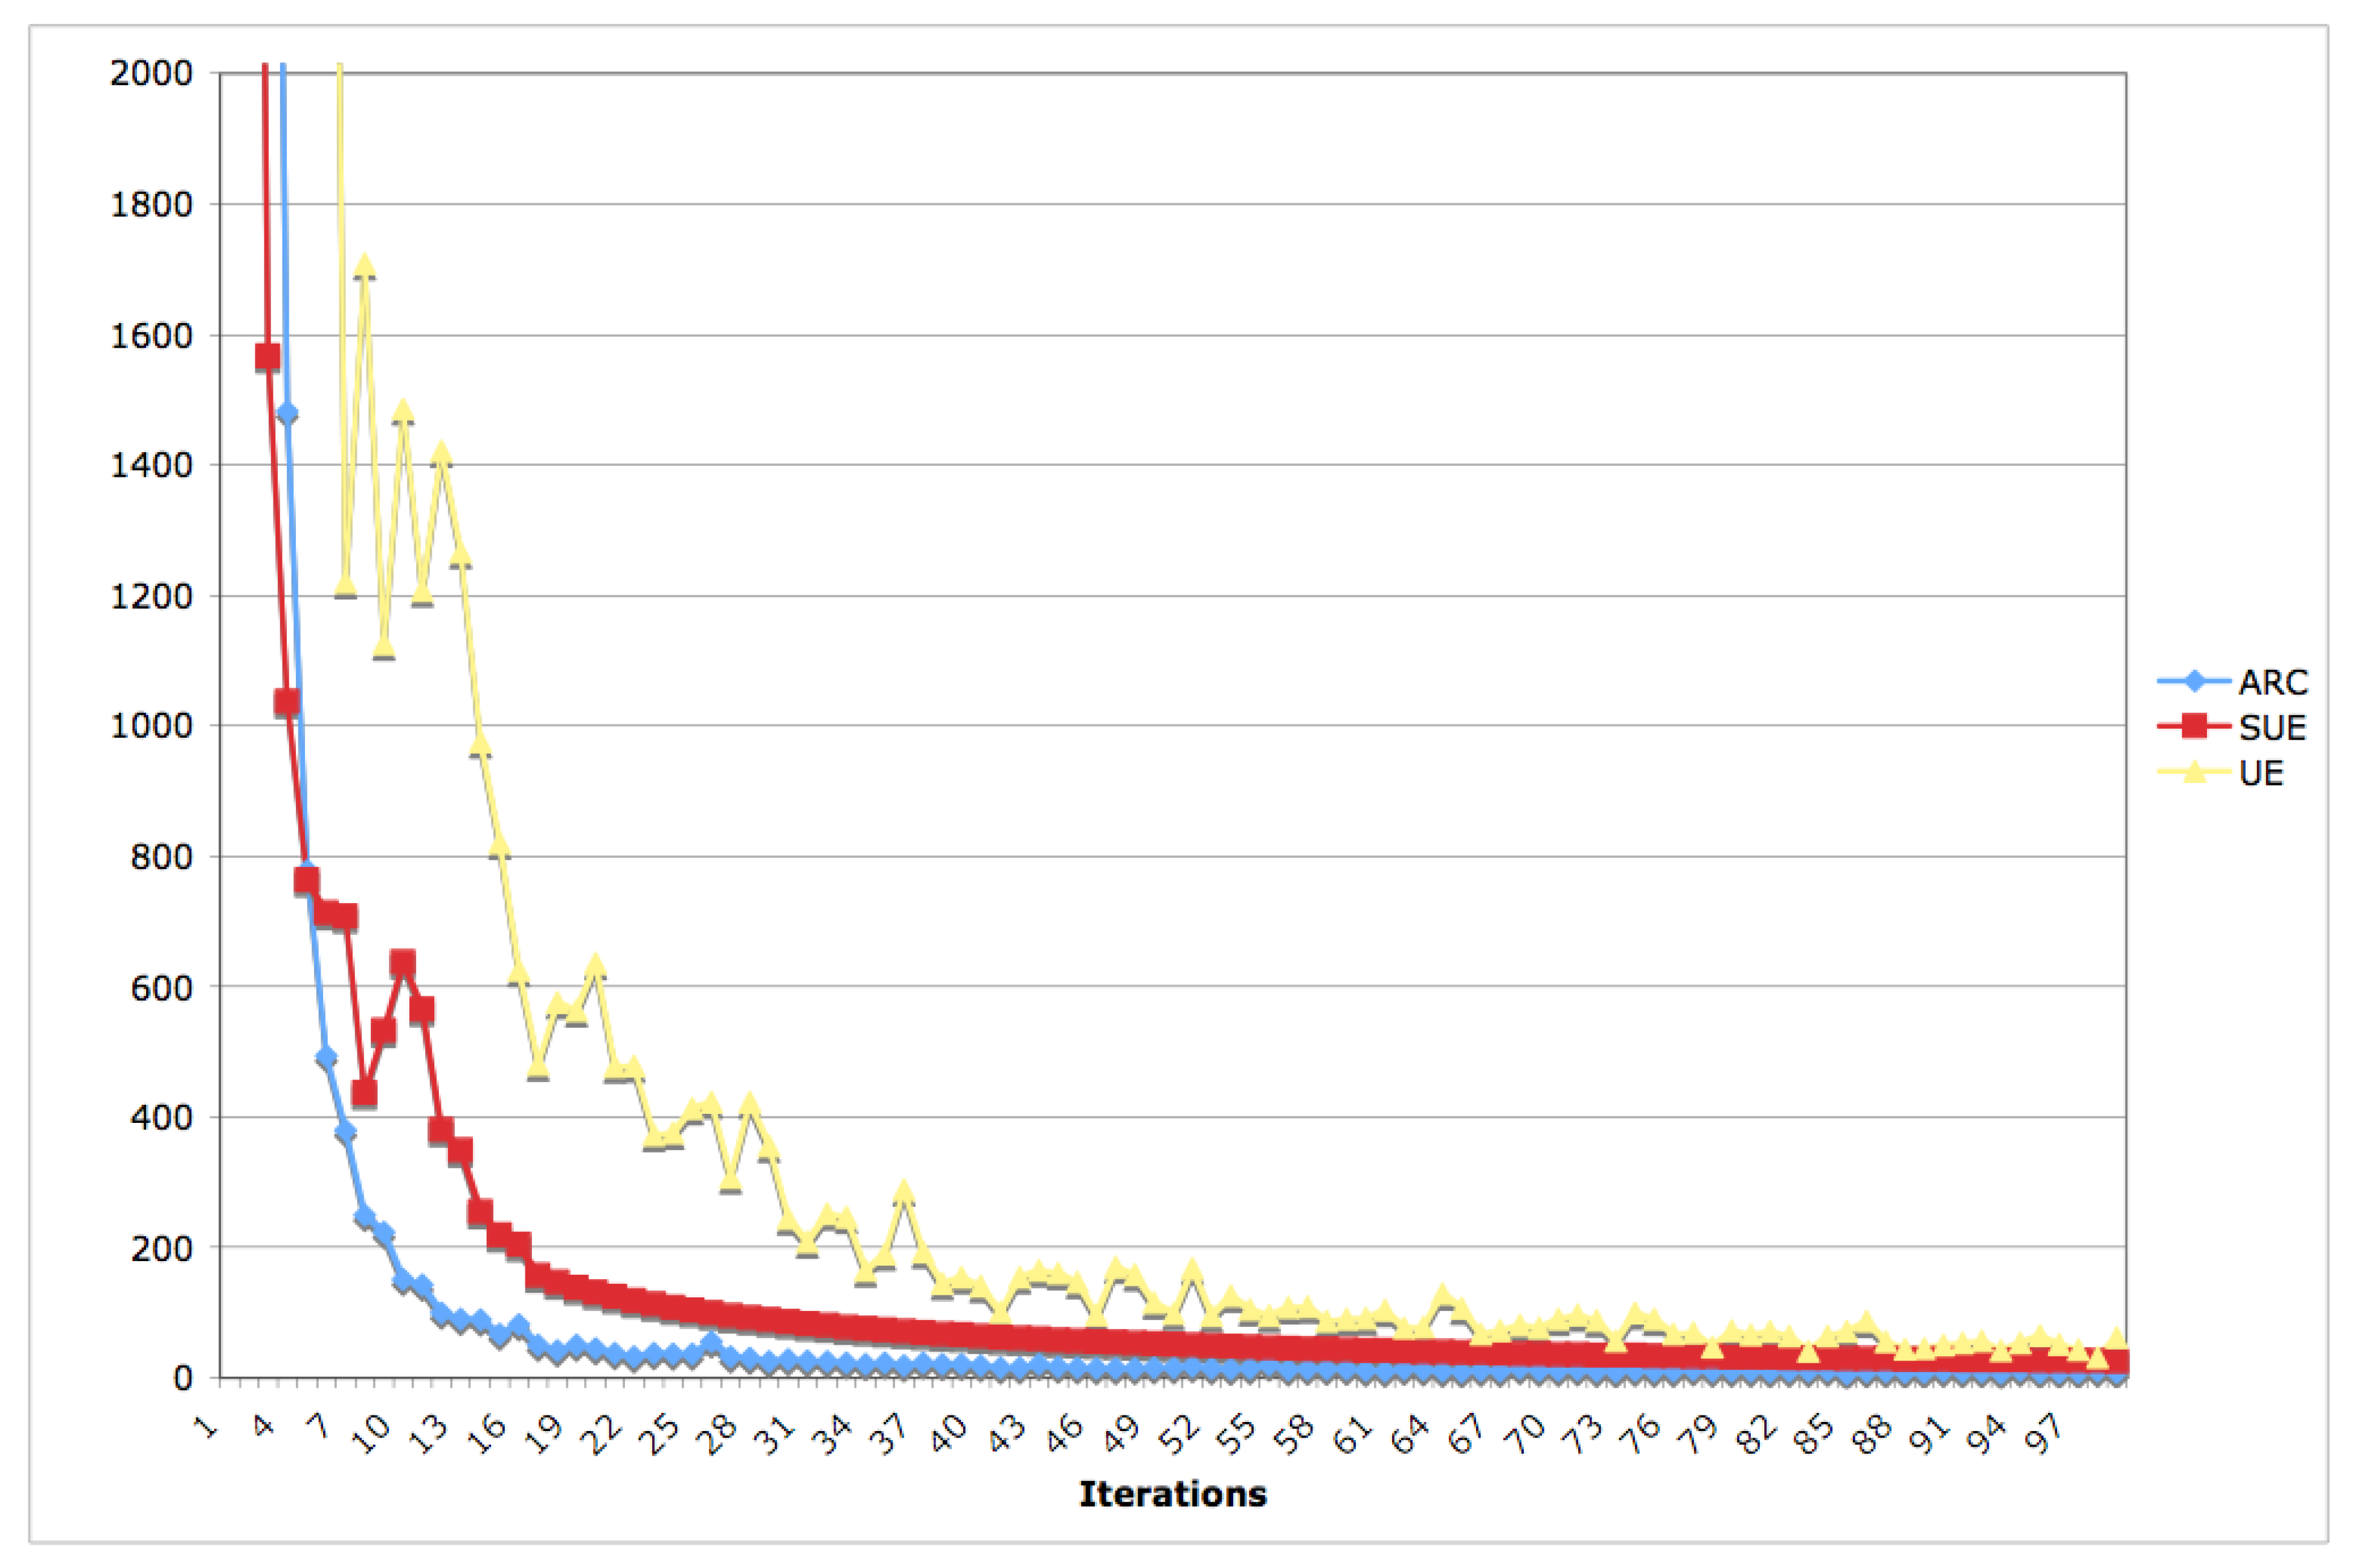
Figure 4 illustrates how maximum link flow difference between consecutive iterations, the indicator of convergence criterion adopted in this research, evolves over time for three assignment algorithms. Although the difference compared to the other two algorithms decreases over iterations, ARC converges much faster at the first few iterations and exhibits more stable flow patterns. This is partly due to the behavioral assumptions such as information spreading speed and inertia of changing route assumed in ARC, which is more consistent with the real world.
Table 6 compares computational efficiency on different networks. Although ARC is still more time-consuming compared to UE and SUE, the difference reduces rapidly as the scale of network increases. However, we must indicate that this running time for ARC is based on the simplification of uniform traveler characteristics in order to be comparable with UE or SUE. If we consider heterogeneity in travelers, each iteration of ARC consumes 5.5 min and it takes 85 iterations to converge, according to a criterion that the maximum relative link flow error between two consecutive iterations should be 5 or fewer vehicles.
3.4. Applications
The introduction of toll road and price setting is a comprehensively debated topic. One concern about toll roads is their potential inequity. It is intuitive to think that travelers with high value of time would be more likely to take toll roads (or take them more often), than the general population. While this is a common argument when people discuss the equity of road pricing, the extent of the differentiation on large networks is seldom studied. Because of its capacity to model each individual traveler, ARC has advantages in revealing the relationship between toll rates and traveler differentiation. This paper only illustrates this idea with a simple network, containing only one OD and two alternative routes (A and B). The demand is assumed 2000 veh/h and each alternative route has a capacity of 800 veh/h. We assume route B is toll-free and travelers’ reactions with different toll rates on route A are studied.
As illustrated in
Table 7, if we charge a higher toll rate on route A, travelers exhibit more significant differentiation: fewer travelers would take route A and those users have a higher value of time, while route B is more congested and serves those travelers with a lower value of time. The extent of differentiation depends on the toll rate charged on route B and the distribution of value of time among travelers. For instance, the last row shows a higher toll, but more notably, a higher value of time, which is reflected by users on both routes. The value of time remains higher on the toll road (A) than the untolled route (B).
4. Discussion
Starting from theory about how spatial knowledge is generated, refined and spread among travelers, the ARC model differs from previous research by generating a route choice set using a behavioral framework. Parameters describe how travelers perceive the available information and make route choice decisions. Upon estimation and calibration of those parameters, a fully behaviorally based traffic assignment model can be established. ARC simulates how travelers make route choice decisions over time and how the product of those individual decisions evolves into a static (and near-equilibrium) pattern if network conditions hold constant. Numerical experiments suggest that ARC is realistic, and also feasible even on large networks.
Compared to a traditional UE or SUE assignment, the advantage of ARC relies on its ability to track evolutionary decisions made by heterogeneous travelers, particularly on networks with differentiated levels of service provided by tolls. It is highly likely that travelers with higher values of time will take those paths with higher tolls but faster speeds, while those less wealthy travelers prefer free public routes. Therefore, this model allows the investigation of issues involving traveler differentiation, such as equity, marketing, and toll and investment strategies.
Adopting the evolutionary modeling approach, ARC can account for the presence of exogenous information or non-static network conditions, in which case the equilibrium modeling paradigm may not apply, since no equilibrium exists in these cases.
More importantly, ARC provides a new modeling platform based on the acquisition and processing of spatial information, which is behaviorally sounder than modeling based on shortest path searching [
62]. Following the same agent-based modeling paradigm and focusing on travel behavior, we could revisit the problems of travel demand modeling, including residential, job, and non-work location choice, mode choice, activity generation, and departure time and scheduling. Since we deal with individual travelers, a single traveler agent in these models can carry identical personal characteristics and preferences through all of the modeling components. Thus, this modeling framework exhibits the potential to solve the travel demand and routing problems consistently, which has long been proposed by researchers.


