1. Introduction
Investment in fixed rail transit systems is often promoted as a tool to shape urban form, facilitate more intensive land uses and stimulate real estate activity. This popular policy approach raises a key question: To what degree does investment in transit systems promote market-led real estate development that favors Transit Oriented Development (TOD) goals of increased housing density and mixed land uses? Location theory proposes that increases in accessibility that stem from transportation improvements produce higher land costs near transit stations [
1,
2]. In response to these higher costs, developers will increase the density of the structures they build, spreading costs across more tenants while also facilitating greater density and more productive uses near transport investments like rail stations. This simplified understanding of urban development is affected in practice by regulatory constraints, such as zoning codes and building regulations, as well as market constraints, such as project financing, that influence real estate development.
The appeal of fixed rail transit—as opposed to other, often less expensive transit technologies such as Bus Rapid Transit (BRT)—is that the permanence of tracks purportedly attracts developers to the proximity of new investments, thereby capitalizing perceived permanent accessibility improvements into the development of mixed-use neighborhoods, reducing transportation costs, and enhancing urban revitalization and economic development [
3]. To what degree accessibility improvements are actually capitalized into real estate development outcomes is unclear. Existing research features a wide range of results that both support and undermine such claims. This suggests that causal relationships between transit investment and desired land-use outcomes may not be as clear (or at least as easy to predict or model) as policy advocates contend [
4]. The impact of other public policies, such as real estate subsidies and zoning constraints, on the outcomes is not well known, although many studies argue that local development policy is a key factor in the success of transit-oriented development (for example see [
5]).
How land use regulations promote development near rail transit is important to fully understanding expected benefits and financial implications of rail investment. Typically, public project evaluation processes accrue benefits primarily to riders through mobility and accessibility improvements. The value of improvements is often represented by mobility-based metrics, such as travel time savings, that are aggregated across all riders to estimate total benefits. If mobility improvements offset the costs of project construction and operation, then the project is justified. Common methods for valuing direct travel-derived benefits often are of an insufficient magnitude to offset project costs, however, leading planners to look for other areas of measurable impact, such as increased real estate value [
6,
7]. The inclusion of real estate development as an outcome metric creates favorable cost-benefit ratios that (among other things) qualify fixed rail transit projects for federal funding while also allowing localities to muster support for specific transit projects from a wider range of local actors who are not primarily concerned with improving transport mobility. However, when zoning is changed as part of a TOD strategy tied to rail development, disentangling the effects of zoning changes and rail investment is difficult. It may be that in some, if not all, cases relaxing zoning constraints to allow for more profitable development is the primary causal factor behind property value increases.
There is empirical support for including real estate value benefits in the evaluation process, as some investigations have found higher real estate values near transit stations than at similar parcels farther away [
8]. In other cases, the land use mix and zoning overlay districts have been associated with increased property values [
9]. In San Diego, one study suggests that condominium prices increased with proximity to rail transit stations in areas that were pedestrian friendly, and declined where station areas were auto oriented [
10]. This suggests that, in some cases, transit access may be a secondary factor to land use patterns.
In areas where land values have increased near transit investments, households should be able to offset higher housing costs with lower transportation costs that come from not owning a personal vehicle. In practice, however, this rarely happens [
11]. Local regulations often conflict with transit-supportive development goals, for instance by mandating the inclusion of parking spaces in new residential development regardless of its proximity to transit [
12]. In a recent study of Houston, Texas, the largest city in the United States without zoning regulations, scholars found that development near new light rail transit stations was not measurably different than new development that occurred elsewhere in the city [
13]. Even when local policies do not directly conflict with the aims of transit supportive development, public subsidies and incentives are often necessary to achieve land use changes near new transit [
14,
15].
In areas where transit investments have not clearly affected development, scholars have argued for patience, noting that the slow pace of urban change in some areas may require years or even decades for anticipated effects to come to fruition [
5,
16]. As Marlon Boarnet and Nicholas Compin write:
The TOD implementation process is by its nature a slow one. Officials should realize that if TOD can enhance the prospects of rail transit, the benefits may take years or even decades to be realized. The evidence from San Diego County is that, over fifteen years after light rail service began, the number of existing TOD projects is small, and concentrated either in a city where TOD was consistent with other goals or in the region’s largest city.
In support of patience, zoning is a pliable tool that changes over time. Economists have shown that as land values increase, zoning rules do sometimes change to allow higher value development [
17,
18]. In the case of development near rail transit, we would expect that over time zoning near stations will change in response to higher land prices as zoning reflects planning ideals of increasing density and productive uses near transit investments and is not exogenous to the development process. As a publicly informed political process, however, zoning regulations may not always reflect a move toward the highest and most productive uses.
This paper explores the “timeframe” critique of change by focusing on the long-term, almost 25-year zoning changes associated with a modern rail transit system in a developed region. While much of the existing literature considers housing values and land costs near new transit stations, which are market responses to rail station investment and access, this paper examines whether rail stations act as a catalyst for change in zoning controls relative to other areas of the city over a period of decades. This is an examination of the regulatory response to transit investment. The paper is structured as follows. The remainder of this section introduces the San Diego case. The following section then describes the data collected from the San Diego Association of Governments. These land use data are from two periods—1986 and 2008—and are used in OLS regression. Of note, the study period includes a 2006 major zoning revision in San Diego that is reflected in 2008 data. The analysis evaluates zoning changes near station areas compared with changes in land use regulations in areas not proximate to rail three decades after initial rail investment.
Section 3 presents the results of the OLS regression models, followed by a discussion of the results in
Section 4 and conclusions in
Section 5.
The San Diego Case
San Diego is a coastal city region at the southern edge of California immediately north of the Mexican border. The region has grown at a faster rate than the country as a whole for many decades, increasing from a population of about 1.8 million in 1980 to 3.1 million in 2010, and with expectations for as many as 500,000 new jobs by 2030. Growth pressures in the region are heightened as easily developable land becomes scarcer in areas served by existing transport networks. While the regional agency, SANDAG, has encouraged higher density and mixed land uses in areas served by the regional transit network, land regulations remain the purview of municipalities and are updated according to local schedules and political needs that may not fully reflect regional priorities.
San Diego opened its locally funded Blue Line light rail system in 1981 and a second, Orange Line, in 1986. More recently, the Green Line began operations in 2005. Since this paper is specifically interested in long-term land use effects, we intentionally omitted station areas on the Green Line. As part of a regional strategy to integrate transportation and land use planning the city of San Diego adopted transit-oriented development guidelines in 1992, more than a decade after their first rail line began operations [
19]. Zoning codes in regional municipalities were updated based on local schedules but all municipalities conducted some type of update between 1992 when regional TOD guidelines where proposed, and the 2008 issuance of the SANDAG data employed in this paper. Perhaps most notable was the city of San Diego’s comprehensive zoning update adopted in 2006, the first major revision to the city’s zoning map since the early 1980s [
20]; this update documented lot-level use and density regulations that were in place in 2003 and 2004 thus reflecting regulatory conditions on the ground. When re-development activity occurred near regional rail stations, TOD guidelines appear to have influenced development, though it has been common for the process to take a decade (in the case of La Mesa Transit Village) or far longer (in the case of Barrio, which ultimately resulted in a development conceived a decade before the light rail system opened).
There are a number of studies that examine the light rail system in the San Diego region, which is officially called the San Diego Trolley. As one of the oldest light rail systems in the US, scholars began looking at potential effects on ridership [
21], land values, land use changes [
16,
22,
23] and other measurable outcomes shortly after the system opened in the early 1980s. Research found an increase in commercial activities near stations but also found that dense residential development did not typically materialize near stations. This suggests that municipal finance concerns, namely a reliance on sales taxes for public revenue, lead cities to promote commercial activities even when residential construction was prioritized in local and regional plans [
16,
23].
Collectively, these studies do not paint a consistent picture of land use effects associated with light rail transit investments in the San Diego region. There appear to be opposing forces at work. While proponents of TOD argue that multi-family housing is important for supporting higher density development that raises transit ridership [
24], local policymakers have incentives to promote commercial development that maximizes sales tax revenues or fiscal zoning [
23]. Further conflicts emerge when profit-oriented real estate development goals conflict with social equity goals of increasing access, improving quality of life for disadvantaged populations or addressing inequality in the distribution of public resources across demographic groups [
25]. Although this paper does not specifically consider the local decision-making processes related to land use near transit investments, the potentially conflicting policy programs pursued by different local actors may serve as a causal explanation for the policy inertia and observed outcomes.
2. Materials and Methods
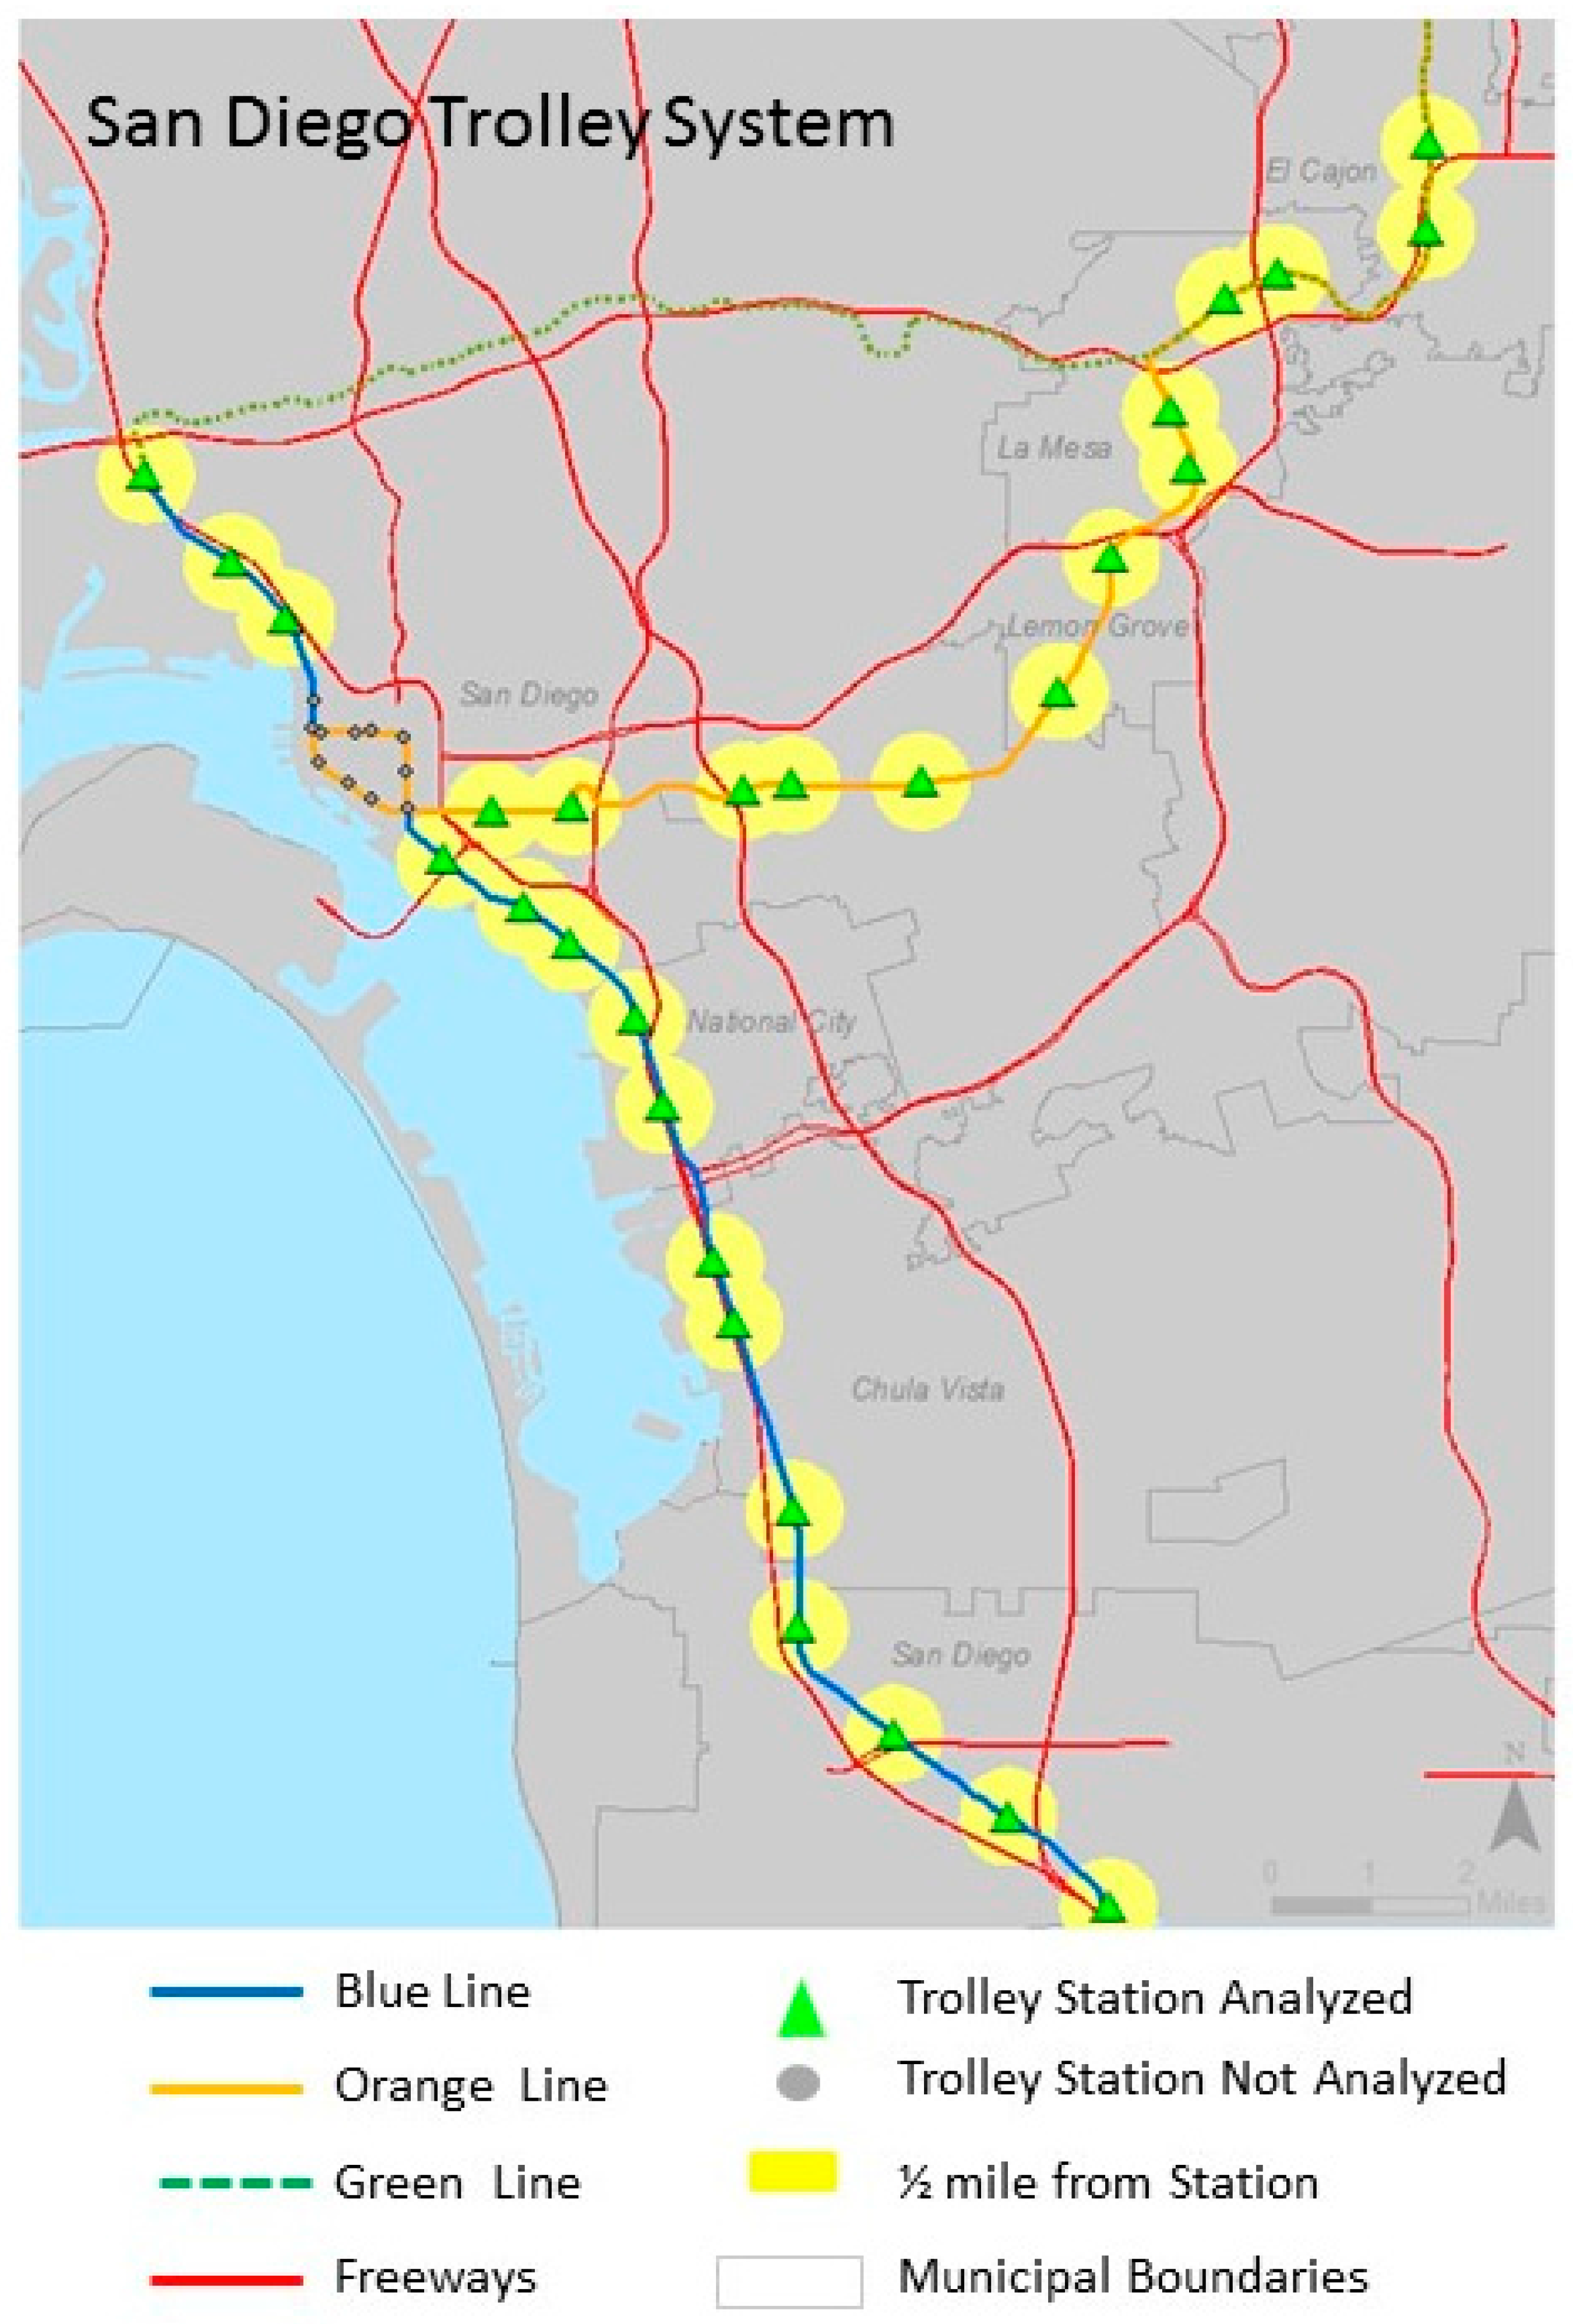
We use data from the San Diego Association of Governments (SANDAG, San Diego, CA, USA) for 1986 and 2008 which allows for a detailed analysis of regional changes in land use patterns by category near and away from rail stations. The SANDAG land use data is compiled from the land regulations of municipalities located in the San Diego region and is standardized to reflect a limited number of land use categories. As a result, the data does not reflect the full range of land regulations utilized by local municipalities, such as mixed-use overlays, but it does allow for a comparison of basic land use regulations across regional municipalities. For our purposes, the data provides information on land use near 39 light rail stations located on the Blue and Orange lines. Of these stations, 23 opened in 1981 and 16 opened in 1986 satisfying our interest in land use patterns near established but modern stations that have been in operation for more than 20 years. Stations analyzed had a wide range of characteristics: urban and suburban locations, inside and outside the central business district, with different levels of accessibility to other light rails lines and other forms of public transit. Stations also differed in whether they provided parking for commuters. The stations examined are to the south and east of downtown San Diego on the blue and orange lines (see
Figure 1). The green line stations were omitted from the analysis, as discussed above. In general, San Diego is an area where we would expect to see many gains from transit investments, given its location in a growing economic region and fairly aggressive implementation of land use regulations that coincided with light rail development.
A challenge for evaluating land use changes associated with transit investments is the absence of counterfactual examples that show what would have developed if transit investments had not been made in a given location. In the absence of reliable counterfactuals, longitudinal research designs that utilize data from before and after an investment is made allow researchers to draw conclusions about the spatial impacts of transit investments [
26]. Longitudinal approaches also have drawbacks, however, as development patterns near stations can change prior to the commencement of station operations [
8,
27,
28]. Changes in land use that preceded increases in transit accessibility result from private real estate speculation, as well as construction and government initiatives made in proximity to stations prior to opening. For that reason, it is preferable to consider data from at least one year prior to station openings in order to understand the full economic impacts. Unfortunately, the earliest data available for San Diego is from 1986, the same year that the transit system commenced operations. The data utilized in this paper, although not ideal, is still relevant as station benefits do not often materialize until at least four years after investments are made [
29]. Although some land use changes may have occurred prior to 1986, we anticipate that the majority of changes would have occurred in the years following station openings or in the years after 1992 when San Diego adopted transit oriented development guidelines. More importantly, we are curious if rail stations have a sustained and cumulative effect on land use patterns, which the data allows us to examine. If the permanence of rail is as important as proponents claim, then the impact of rail investment on land use should in fact promote stronger cumulative responses (i.e., increasingly intensive development patters radiating from station nodes outwards).
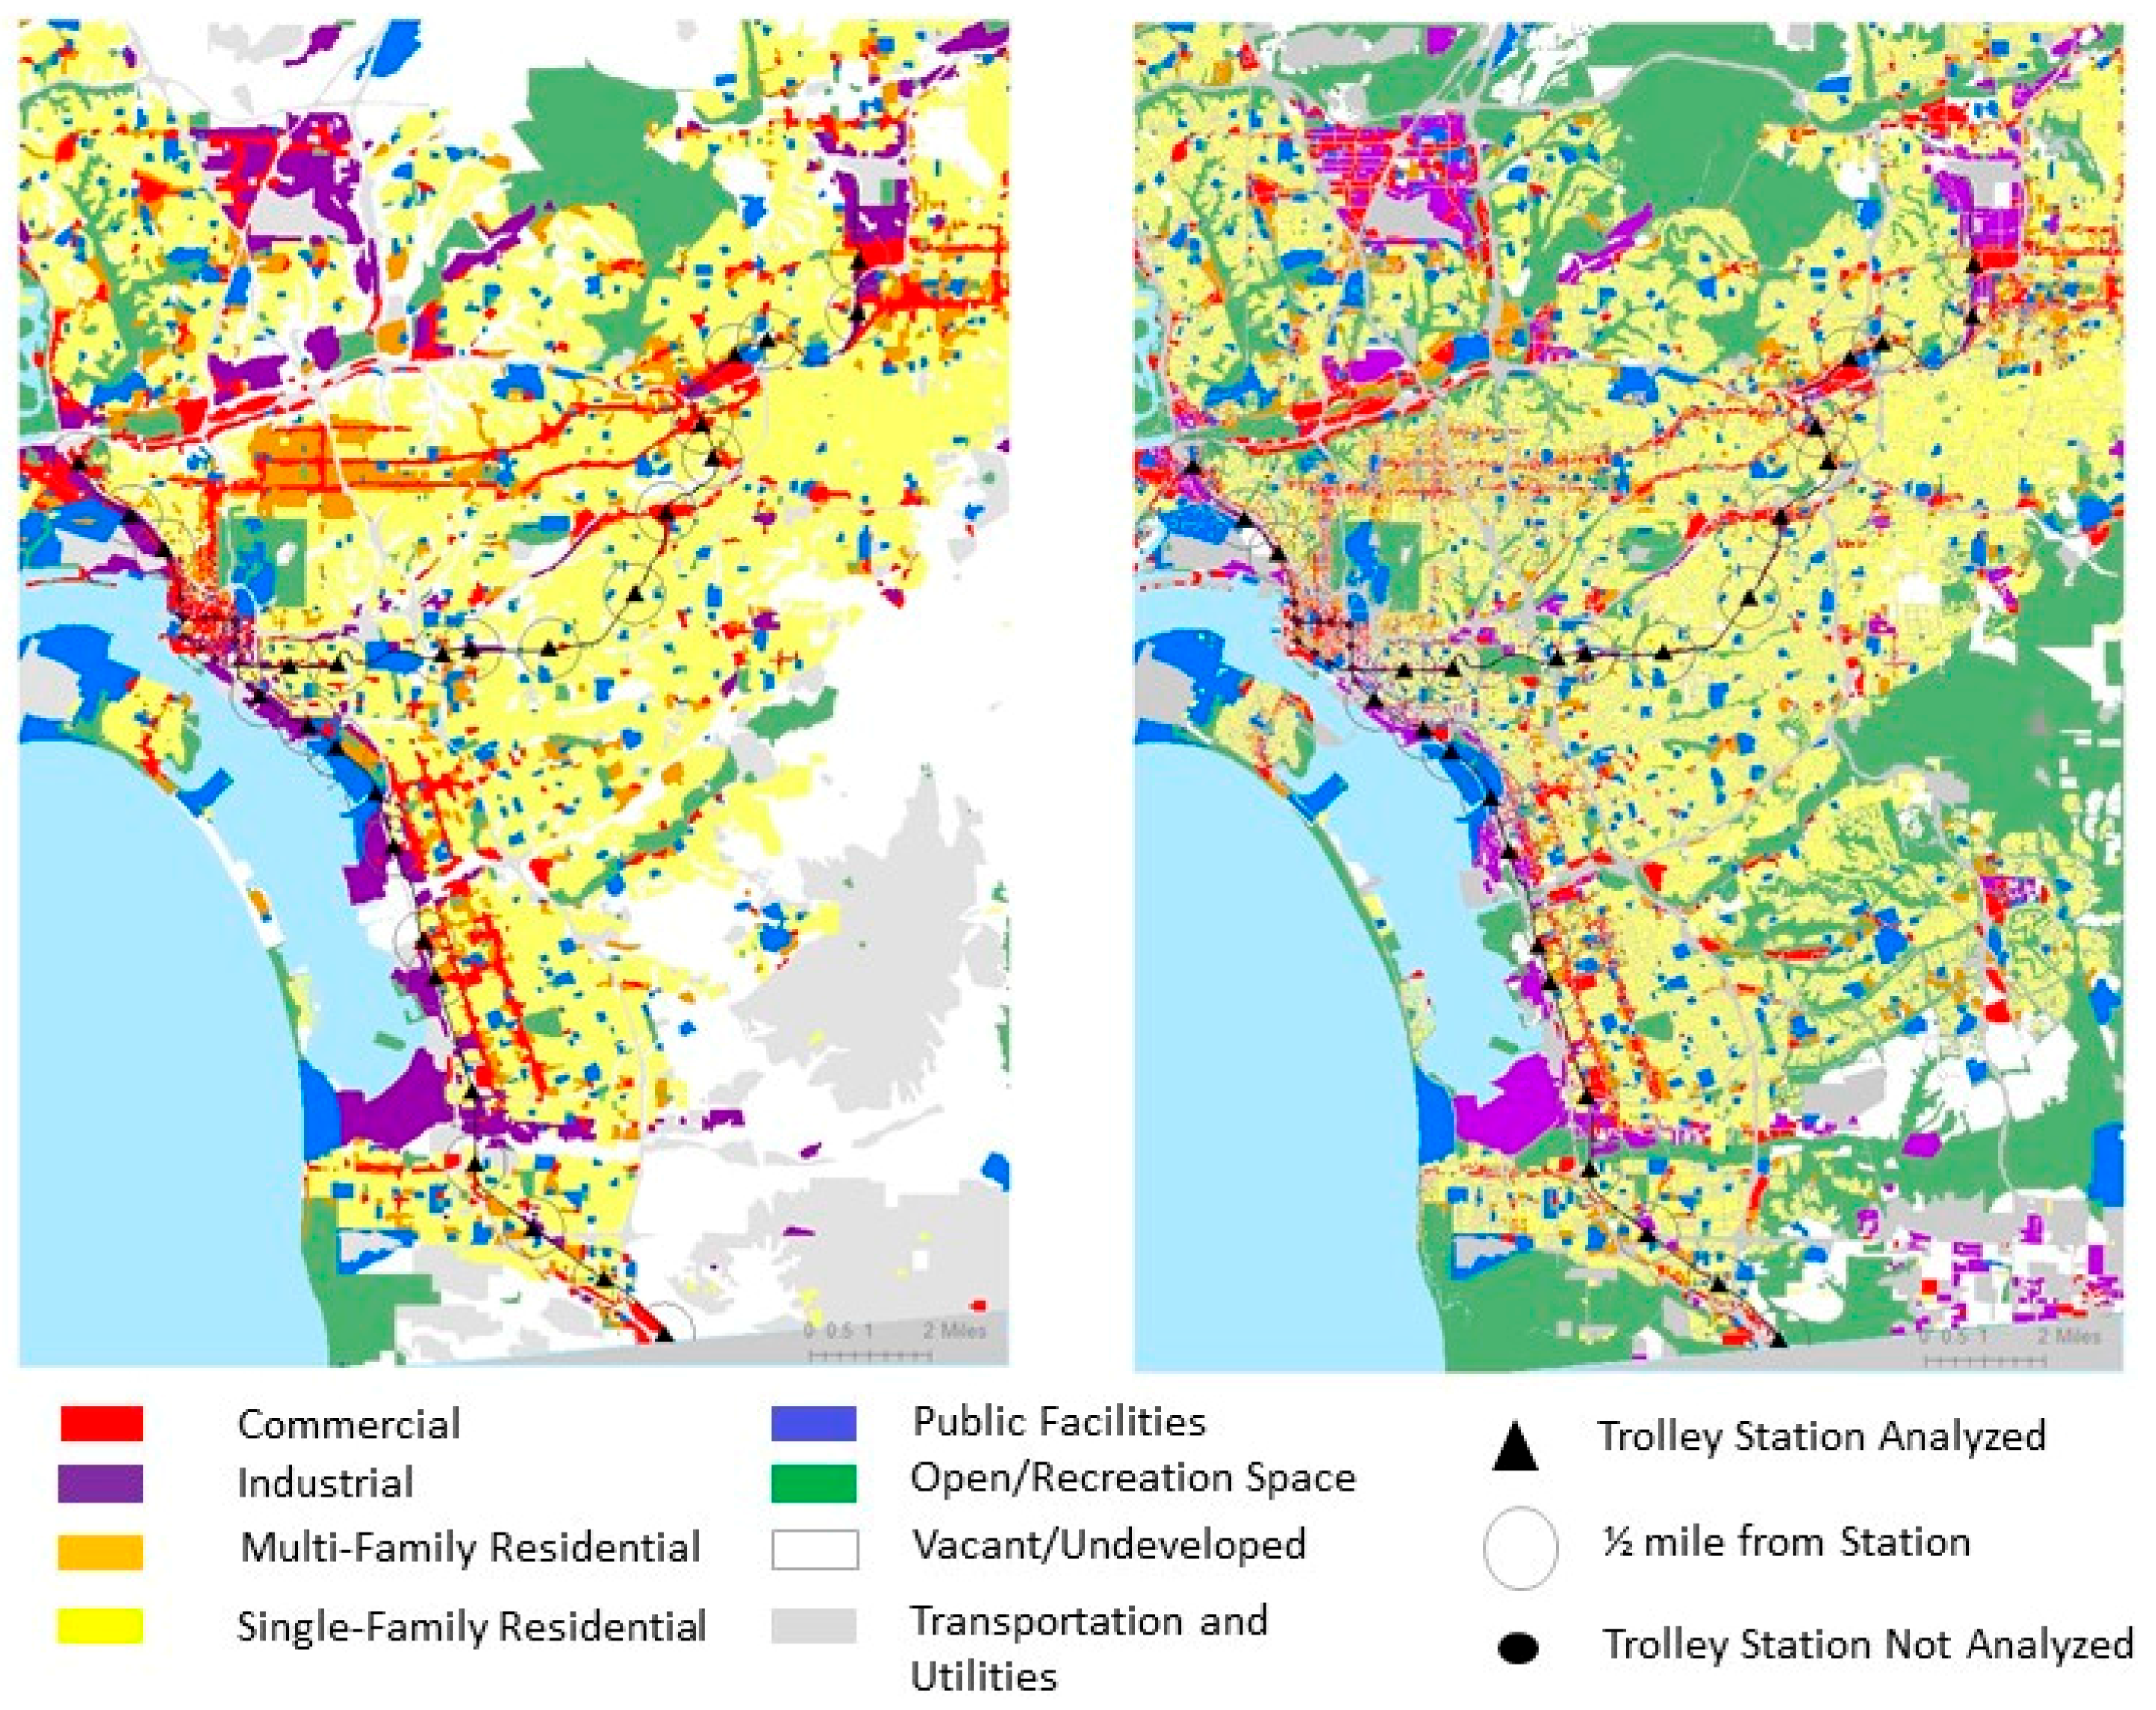
The land use data was imported into ArcGIS where buffer tools were used to compile land uses by total area for 800 m (0.5 miles) and 3.2 km (2 miles) radiuses around each station for each time period (1986 and 2008). The data reflects seven land use classifications provided by SANDAG: Commercial, Industrial/Manufacturing, Multi-family Residential, Open Space/Recreation, Public, Single-family Residential, and Vacant. Data was also compiled for Agricultural and Under Construction land use categories but these were excluded from the analysis due to the small amount of land devoted to each in the catchment and control areas. The radii around stations in the downtown core overlapped, meaning that the land use in some locations was counted more than once (i.e., it appears for each station whose radius covers the location in question). This lessened the relevance of the 800 m catchment area and the 3.2 km control area for these stations. Given the methodology selected, this was unavoidable since it is impossible to “assign” land use of a given parcel to a specific station when stations are in close proximity. To rectify this, the 11 downtown stations were excluded from the analysis, leaving a total of 28 stations whose land use regulations were analyzed using both regression and location quotients.
2.1. Aggregated Models
We first analyzed rail stations on the two lines (Blue and Orange) that were operational in 1986, using two difference-in-difference outcome variables to evaluate overall patterns of land use regulatory change. The first, Area Difference, represents the change in total area (measured in square feet) devoted to a particular land use at a given station geography (800 M vs. 3.2 km) over the 22-year period. The second, Percentage Difference, represents the change in the percentage of land in an area devoted to a particular zoning use at a given geography over the same time period. The difference-in-difference approach compliments the longitudinal data and allows us to diagnose patterns of land use change near and away from stations while also controlling for pre-existing land use patterns. Additional characteristics of the 28 stations were captured by the use of four dummy variables: City Location, Multi-modal service available, Served by Multi-light rail lines, and Commuter Parking available. Another dummy variable, Geo, was used to indicate whether an observation occurred within an 800 m of a rail station or whether it was located in the 3.2 km control geography. Distance from downtown (in kilometers based on the routes provided for driving) was also included as an independent variable. Descriptive statistics for the variables are provided in
Table 1.
We ran multiple OLS regression models using the difference-in-difference outcome variables described above. Our first question of interest was, are the magnitudes of land use changes during the 22-year period greater in proximity to transit stations? To examine this, we used Area Difference as our dependent variable, which captures changes in the space devoted to a single use rather than comparing changes across uses. We expected that changes in land use patterns would be greater near transit stations than in the 3.2 km control areas, since rail stations are intended to act as a catalyst for development and property values [
28]. In addition, we anticipated that dummy variables associated with station characteristics and proximity to downtown would have a significant impact on observed land use classifications. The regression output confirmed that the location of an observation (whether it was within 800 m of a transit station) was a significant predictor of change in the area devoted to a particular land use, with observations located near a station experiencing an 271,205 square meter increase in the area devoted to a particular land use Whether the station was located within San Diego city boundary was also a significant but negative predictor of change in land use patterns over time, perhaps signifying that land use regulations in the central city were already oriented toward more higher density and/or that land uses in the city are less prone to change than those in suburban areas.
In addition to the geographic proximity of an observation, we also expected that the amount of land devoted to a particular use at the starting year (1986) would have an impact on whether the amount of land devoted to that use changed over the 22-year period. Indeed, the area of a particular land use at the starting time (Area_86) was a significant predictor of the level of change observed, with a one square meter increase in starting area resulting in a reduction of that land use by an average of 0.9 square meter. While this variable was statistically significant the low magnitude of its coefficient makes the finding of less import, although it does suggest that areas dominated by a single use may be diversifying in terms of the types of uses allowed by regulation. Furthermore, including this variable in the model changed the significance of the dummy variables capturing the level of geography and the station’s location with the city. This indicates that aggregated statistical analysis of land use change near stations may be concealing trends in land use change at particular stations, which can vary greatly [
30,
31]. In sum, the average land use change does not appear to be a relevant index for understanding the differences in land use pattern change near and away from stations in the San Diego region.
Similar models were constructed for each land use classification, and show that the starting area devoted to land use (Area_86) was the best predictor of change in the classification over time. For most land uses, a one square foot increase at the initial observation resulted in a reduction of less than one square foot in the change in land use on average. The station characteristic dummy variables were not significant in any of the models, with the exception of City location exerting a positive influence on the Open Space/Recreational land use model. For the Open Space and Single family residential models, the distance to downtown was also significant, with greater distances associated with greater land use change.
It seems clear from the models discussed above that the difference-in-difference outcome variable based on Area (square meters) of a particular land use is best explained by the Area of that land use at the starting year (1986) and to a lesser degree by proximity to light rail transit. The use of area, however, fails to capture the relative distribution of land uses by category in a given area. The difference in the percentage of land in an area devoted to a particular category is a better measure because it captures the relative distribution of land uses and more directly answers the question of interest: Does the relative amount of a particular land use change in different ways near a station than it does in parts of the region not served by light rail transit? Is this trend in favor of more intensive, mixed land uses?
Using the “difference in a percentage of land use” as the outcome variable in the models discussed above produces similar results to the Area difference outcome variable. The amount of land devoted to a particular land use in 1986 is the only consistently statistically significant variable, with proximity to transit (Geo) playing a secondary role. Again, there is concern that reliance on aggregated statistical averages may conceal the detail changes occurring at each station over time. For that reason, we looked for other metrics that could be used to analyze land use change near San Diego light rail stations.
2.2. Location Quotients
The aggregated data approach, utilized in the modeling sequence above, failed to produce conclusive results about trends in land use near and away from stations, probably because of the complexity involved—i.e., there are a range of different trends in different land uses occurring at different stations in the sample. The inconclusive models—along with literature stating that trends are probably not consistent across stations in a single system [
15]—encouraged us to look for different metrics to assess land use changes near stations. To assess the concentration of particular land uses near transit stations, we calculated a Land Use location quotient for each land use type. Location quotients were based on the percentage of land devoted to a particular use (i.e., commercial) within the 800-m radius (area of impact) divided by the percentage of land devoted to that same use within 3.2 km radius (area of control). The 800-m radius represents the area we would expect to be influenced by the transit investment while the larger radius provides a control that accounts for locational characteristics other than proximity to transit that may influence land use patterns. The control denominator excludes land uses covered by the 800-m geography.
Land Use location quotients were useful for identifying the relative change in concentration of particular land uses between 1986 and 2008. We interpreted location quotients in the following manner: Values greater than 1 represent a concentration of a particular land use near the transit station in comparison to the control geography while values less than 1 indicate no concentration of a particular land use near stations. Based on the prevailing theory discussed above, we expected location quotients for commercial and multi-family land uses to increase during the study period, and less intensive, less profit-oriented land uses such as public facilities, open space and vacant land to decrease.
3. Results
Table 2 provides location quotients for commercial and multi-family land uses surrounding the 28 stations. These calculations represent the relative intensity of land use within the study areas. While it is possible that areas near stations increased their share of land for specific uses in absolute terms while diminishing the relative intensity with regard to the control area, we did not find this to be the case in practice. The data presented in the table shows no universal association between rail stations and commercial or multifamily residential land use when the 28 stations are considered together. We calculated correlation coefficients for the two types of land between 1986 and 2008 and found a correlation coefficient of 0.78 for commercial land use and −0.08 for multifamily residential, suggesting that commercial land uses are more stable than multifamily uses in our study area.
This does not imply that the amount of multifamily housing has decreased in the San Diego region over time, although that trend would help explain the low correlation between the percentage of land devoted to multifamily residential at the start and end time periods. Regionally, the percentage of housing units devoted to multi-family residential changed little between 1990 and 2012. Data from the 1990 Census of Population and Housing shows that 35 percent of housing in the San Diego region was considered multi-family while in 2012 that number had changed minimally, increasing to 36 percent despite an almost 25 percent regional population growth during this period [
32]. Although the calculated location quotients are not indicative of a general region-wide trend away from multi-family residential they also do not indicate a concentration of multi-family development in proximity to rail transit.
Furthermore, although the percentage of multi-family units did not decrease there were significantly more single family residential units built during this period. Between 1990 and 2012, 219,578 units of housing were added in the San Diego region. Of these, 144,107 units (65.6%) were single-family and 85,418 units (38.9%) were multi-family residential. This trend supports market preference for single-family homes during San Diego’s rapid development, although market preferences are necessarily constrained by allowable zoning [
33,
34]. Regional and station area trends highlight how the policy goals of higher density housing and mixed-use development, typically associated with Transit-Oriented Development projects, may be difficult to implement in practice even when localities adopt specific TOD development guidelines.
Consistent with the work of Boarnet and Crane [
23], we find that commercial, industrial and manufacturing uses increased their share of land near stations relative to the control area. This is likely because of economic and fiscal conditions unique to California that force local governments to rely on sales taxes as a source of revenue. Although commercial, industrial and manufacturing land uses are often associated with jobs, development within these land uses may not actually be increasing total employment. Kolko [
35] studied employment near new transit stations in California and found mixed results. In many cases employment density declined once transit opened nearby. That said, employment near transit stations is a much better predictor of ridership (not considered in this paper) so that a shift toward more employment-oriented land uses, as we observe in the San Diego case, may be a net positive for the system.
Our results are also consistent with previous studies in that there is no observable shift toward multi-family residential housing near rail stations. This is somewhat surprising as the dual factors of regulatory frameworks supporting TOD and strong population growth in the region support an increased demand for multi-family housing that, we expect, would produce an effect on land uses near stations. To probe our initial results more thoroughly, we used a Tobit regression model to examine correlated factors including the dummy variables discussed above, plus dummy variables for select municipalities (Chula Vista (CV), National City (NC), La Mesa (LM), Lemon Grove (LG), El Cajon (ElC)) in order to capture effects across local land use codes. Tobit regression analyses have been used to study zoning in other cities. For instance, McMillian and McDonald [
36] used these methods to study zoning near rail in Chicago and found that areas near rail were more likely to be zoned for multi-family housing, commercial and manufacturing land uses.
Table 3 shows the regression results for the 2008 data. These results suggest is that there are some differences across municipalities, such as National City’s association with less multi-family housing land use, and Chula Vista, La Mesa and El Cajon’s association with less public land near rail stations. Downtown areas are more likely to have multifamily housing, but this was true without rail investment. The distance from downtown did not have a noticeable effect on land uses. The cities of Chula Vista, La Mesa and El Cajon are associated with a smaller share of land developed as public facilities near stations, and Chula Vista and National City are associated with lower shares of land devoted to single family housing near stations. Other station-level transportation characteristics including the presence of parking and the number of transit lines and modes were not statistically significant in the model. The land use in the initial year was statistically significant, as it has been for most of the models. Although results are generally in the directions expected, the statistical significance of most variables is weak or non-existent.
5. Conclusions
This paper examines long-term changes in land use regulations near rail stations in the San Diego region. In a region experiencing solid population and economic growth in the more than two decades since a modern rail system was built, we anticipated that the San Diego Trolley would create a market for new development that takes advantage of the rail amenity and favors higher intensity land uses. The promotion of Transit-Oriented Development through zoning codes and regulatory changes made by cities within the San Diego metropolitan area was also thought to be a factor that would support changes in land use regulations over time. Our results, however, largely confirm previous studies about the land use implications of rail investment, i.e., that there are not universal responses to new rail investment even after several decades. While many of the scholars who have examined TOD and related developments in San Diego noted that the full implications may take years to develop, the work we present here suggests that after thirty years many of the promises of market-led shifts toward multi-family and mixed-use development immediately surrounding transit remain unfulfilled. Part of the reason for this is that underlying zoning regulations have not shifted to favor such types of development.
A key take away supported by this paper is that reliance on market-led shifts in land use patterns is a faulty public strategy for realizing TOD-related goals of higher intensity land uses near transit stations in part because land use regulations may act as a constraint. A more active public presence is necessary to both coordinate intergovernmental actors (across governmental levels and functions) and provide incentives for desired private sector behavior. This is not a question of whether transit investments influence economic development. It is a question of how public actors can facilitate public-public and public-private coordination to develop preferred land use patterns near transit stations. Aggregated analysis cannot tell us anything about this; indeed, reliance on such models in academic studies reinforce the idea that the “free market” and transportation infrastructure interact in some pre-determined manner that public actors can only modify or mitigate, not directly control. The result of this idea is that many cities building new transit investments fail to take the policy initiatives that would result in the goals they desire—specifically zoning reform—choosing instead to rely on the natural forces of the market to provide, which are inhibited by land use regulations. As Curtis concludes in her work on implementation, “Achieving sustainable accessibility requires new planning practices (tools and methods), new stakeholder relationships and both of these demand new skills of planners” [
15] (p. 110). We would be wise to guide public actors toward these issues prior to discussing the locations and need for new public transport investments in US cities with sufficient infrastructure.


