1. Introduction
The urban heat island (UHI) effect is a phenomenon that the land surface temperature in urban areas is apparently higher than that in rural areas [
1]. The causes of UHI are diverse, including natural factors and human factors, whose root cause is the change of land use. Additionally, the factors such as urban configuration, heat release from anthropogenic heat source, atmospheric pollution, geographic location, and climate also affect the UHI [
2]. With the development of urbanization, urban built-up areas, namely, impervious surfaces, including roads and buildings, instead of green lands and water bodies, are rapidly sprawling and, thus, the city will suffer from the UHI effect [
3]. Shenzhen, a main financial center in Southern China, increased its urban areas from around 3.06% to 39.3% from 1986 to 2005 [
4]; Hong Kong is a metropolis with a high population density filled with high-rise buildings and has a lack of public open spaces in urban areas [
5]; therefore, the urban areas in Shenzhen and Hong Kong suffer from a severe UHI effect.
The traditional method for UHI study relies on meteorology data derived from urban and rural weather stations. It is difficult to obtain abundant meteorology data and impossible to acquire surface meteorology data, aside from dotted meteorology data [
6,
7]. After the launch of the first artificial Earth satellite, Sputnik, in 1957, satellite images have been widely applied in various fields. The satellite images with a thermal infrared band, such as the images of Landsat TM, Landsat OLI, ASTER (Advanced Spaceborne Thermal Emission and Reflection Radiometer) and MODIS (Moderate Resolution Imaging Spectroradiometer), can be converted to land surface temperature (LST) to study the UHI. In 1972, Rao firstly proposed that remote sensing could be applied to study the UHI and produced a land surface thermal distribution graph by the thermal infrared data from satellite images [
8,
9]. After that, satellite images have been widely used to study the LST and UHI. Therefore, various algorithms, such as the mono-window algorithm (MWA), single-channel method (SCM) and split-window algorithm (SWA) were proposed for LST estimation.
Howard firstly discovered the temperature in the center of London was obviously higher than that in its suburbs [
10,
11]. In China, the LST and land use classification were first applied in Guangzhou, China using the Landsat TM data from 1985 to 2000 to compare the correlation between the UHI and land use types, and suggested that the urban greening and landscape designs in Guangzhou should consider more about vegetation types, namely forest, shrubs, and lawns, to control the UHI [
12]. In Canada, the temperature difference among different land use types in Toronto on 3 September 2008 using the Landsat TM data discovered that the higher urban utilization corresponded to higher UHI intensity [
13]. Recently, the correlations among UHI intensity index, normalized difference vegetation index (NDVI), normalized difference water index (NDWI), and difference vegetation index (DVI) from Landsat TM data were used in Beijing, and the results show that if the UHI intensity index was less than 0.1, the correlation between the UHI intensity index and DVI was positive, and vice versa [
14]. In addition, the UHI intensity of Seoul, Tokyo, and Beijing from April 2011 to March 2012 using the Communication, Ocean, and Meteorological Satellite (COMS) data was studied and compared to discover that the UHI intensity was strongest at noon during summer and weakest at night during all seasons, and the correlation between UHI intensity and vegetation activity was strongly negative during the day, but no such correlation existed during the night [
15].
The MWA was applied to convert the LST in the Israel-Egypt border area using the Landsat TM data and discovered that although the vegetation coverage in Israeli side was higher than that on the Egyptian side, the LST on the Israeli side was higher than that of the Egyptian side [
16]. This method was examined to derive the LST in Hong Kong using the Landsat TM data and then estimated the UHI by NDVI, normalized difference build-up index (NDBI), and urban thermal field variance index (UTFVI) [
17]. In addition, an improved MWA was developed to estimate the LST using Landsat 8 band 10 and applied to retrieve the LST in Nanjing and its surrounding areas in Eastern China [
18]. The MWA was also used to retrieve the LST in Xuzhou in Jiangsu, China from Landsat 8 data and then applied the urban land surface moisture (ULSM) index to evaluate the UHI in Xuzhou and found that an area with high ULSM had a cooling effect on its surrounding area within 150 m [
19].
SCM was applied to estimate LST in that it did not need in situ radio soundings and mean atmospheric temperature compared with other SCMs to evaluate the LST using data of different thermal sensors, including AVHRR-4, AVHRR-5, ATSR2-11, ATSR2-12, and Landsat TM [
20]. Later on, an improved SCM was developed to adopt five different atmospheric sounding datasets to derive the atmospheric functions and applied to convert the LST in Barrax, Albacete in Spain using the Landsat TM data [
21]. This method was recently applied to convert the LST in Shenzhen, China using Landsat 5 TM data, and indicated that the LST had a negative correlation with the vegetation fraction and a positive correlation with the impervious surface area [
22]. It is said that the SCM can be used to convert the LST in several study sites using the Landsat 8 data, comparing the satellite-derived LST results with the in situ LST results, with a high accuracy of the root mean square error (RMSE) of 0.83 °C [
23].
In addition, the LST can be estimated using AVHRR data via an SWA which only needs two parameters, namely, the atmospheric transmittance and land surface emissivity, improving the accuracy to 0.24 °C [
24]. This means that SWA could be applied to retrieve the LST using several low-resolution thermal infrared sensors data. Although the precision of this method was not very high, it was convenient to apply at a global scale [
25]. It is reported that this method improved the accuracy of an SWA via parameter adjustment, including the atmospheric transmittance, land surface emissivity, and water vapor content, and finally decreased the RMSE to 0.9 °C [
26]. In recent years, a practical SWA was developed to convert the LST in Taiyuan-Yuci, China using the Landsat 8 data and improved the RMSE to 0.51 °C [
27].
In most studies, SWA and SCM were applied and compared to derive the LST using Landsat 8 data and illustrated that the mean errors of both SWA and SCM were lower than 1.5 °C, while the precision of SWA was slightly higher than the SCM [
28]. However, when the radiative transfer equation-based method (RTEBM), SWA, and SCM were applied to assess the LST using Landsat 8 data and compared the accuracy among these three methods, it is found that the accuracy of these three methods in descending order was the RTEBM, SWA, and SCM [
29]. In addition, a practical SWA was applied to retrieve the LST in urban area of Beijing and Gobi, China using the Landsat 8 data, and it was found that the precision of the practical SWA, lower than 1.0 °C, is the best method [
30].
Although there are a large number of studies to estimate LST using Landsat data, there has been few reports of Landsat 8 data being applied to the comparison of the difference and similarity of LST and assessing UHI in Shenzhen and Hong Kong. This study presents the UHI assessment using Landsat 8 as a case study in Shenzhen and Hong Kong.
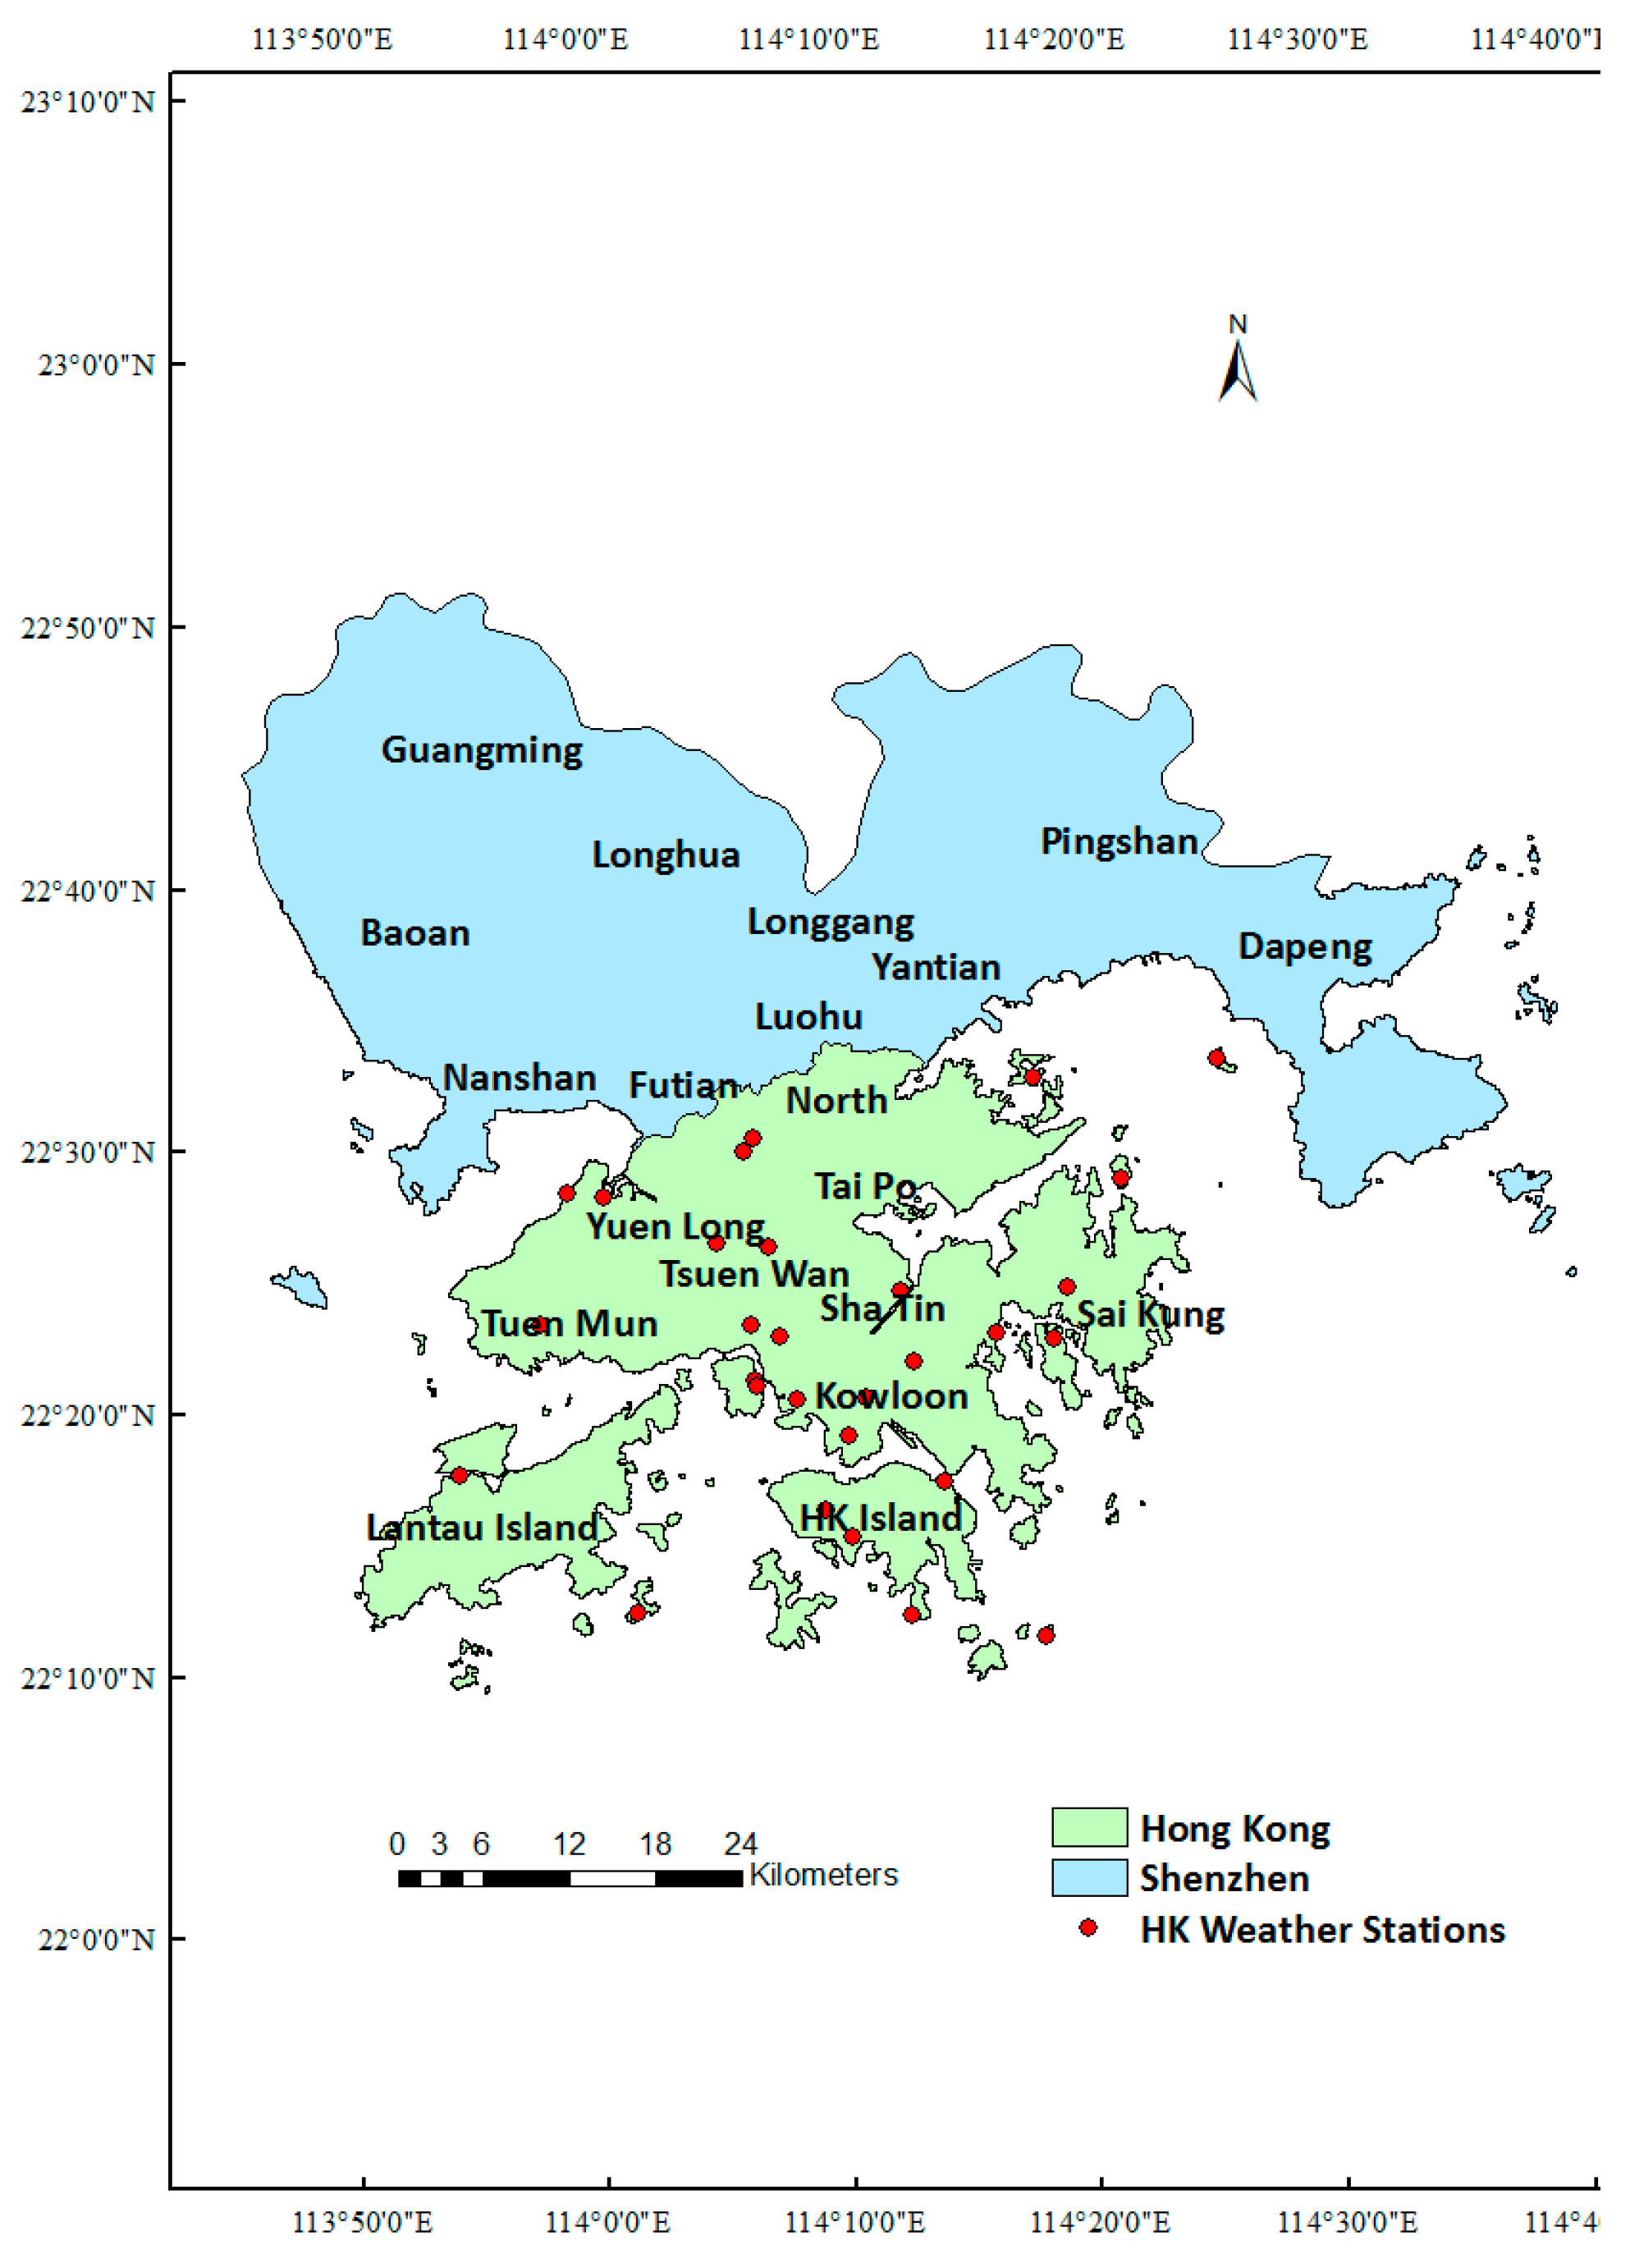
2. Study Area
Shenzhen (SZ) is located in Southern China, to the east of the Pearl River Estuary and the northern coast of South China Sea, and constitutes 10 districts, namely, Guangming, Baoan, Longhua, Nanshan, Futian, Longgang, Luohu, Pingshan, Yantian, and Dapeng (
Figure 1) [
31]. It is a modern city with rapid economic development in Guangdong Province, China, whose population was approximately 10,778,900 in 2014, and has a total area of approximately 1992 km
2 [
32].
Hong Kong (HK) is located in the south of Shenzhen and comprises of Hong Kong Island, Kowloon and New territories, including 18 districts, namely, the islands of Kwai Tsing, North, Sai Kung, Sha Tin, Tai Po, Tsuen Wan, Tuen Mun, Yuen Long, Kowloon City, Kwun Tong, Sham Shui Po, Wong Tai Sin, Yau Tsim Mong, Central and Western, Eastern, Southern, and Wan Chai (
Figure 1) [
31]. It is one of the most significant financial centers in the world, whose population was approximately 7,324,300 at the end of 2015, and has a total area of around 1110 km
2 [
33,
34].
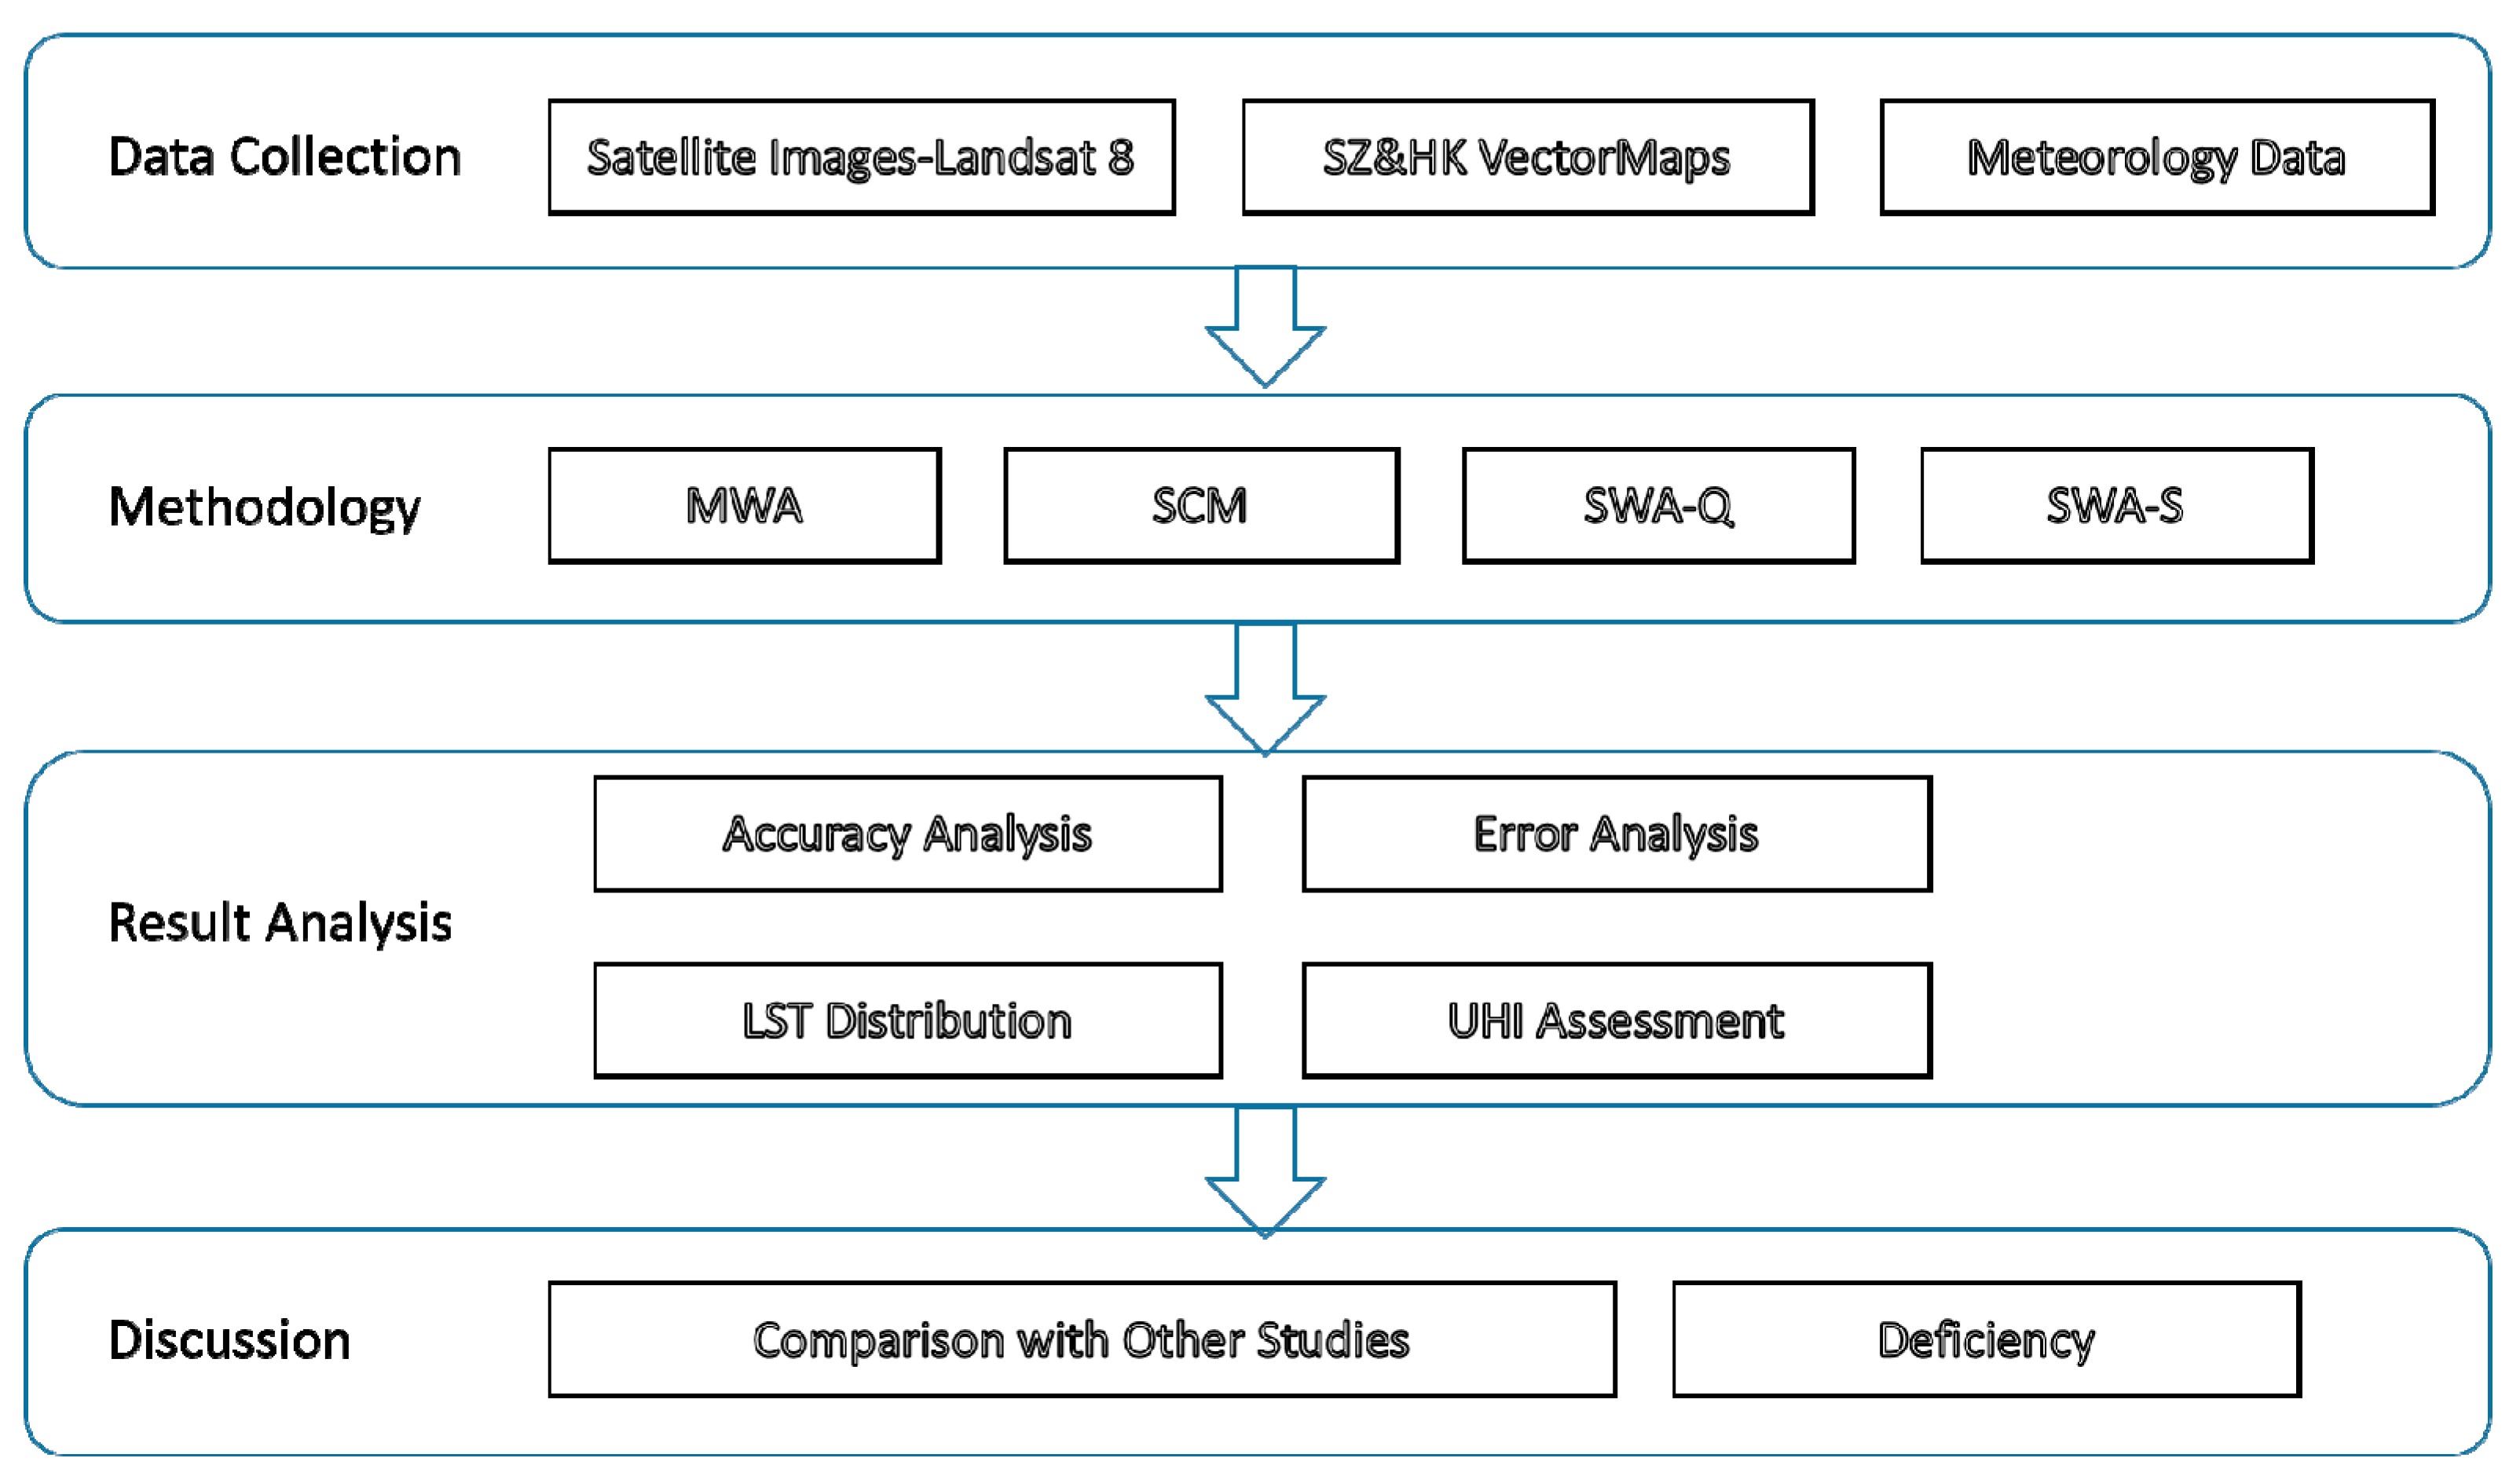
4. Results
According to the LST retrievals via MWA, SCM, SWA-Q, and SWA-S, the further analysis, including the accuracy analysis, error analysis, LST distribution, and UHI assessment of Shenzhen and Hong Kong, is presented in the following.
4.1. Accuracy Assessment
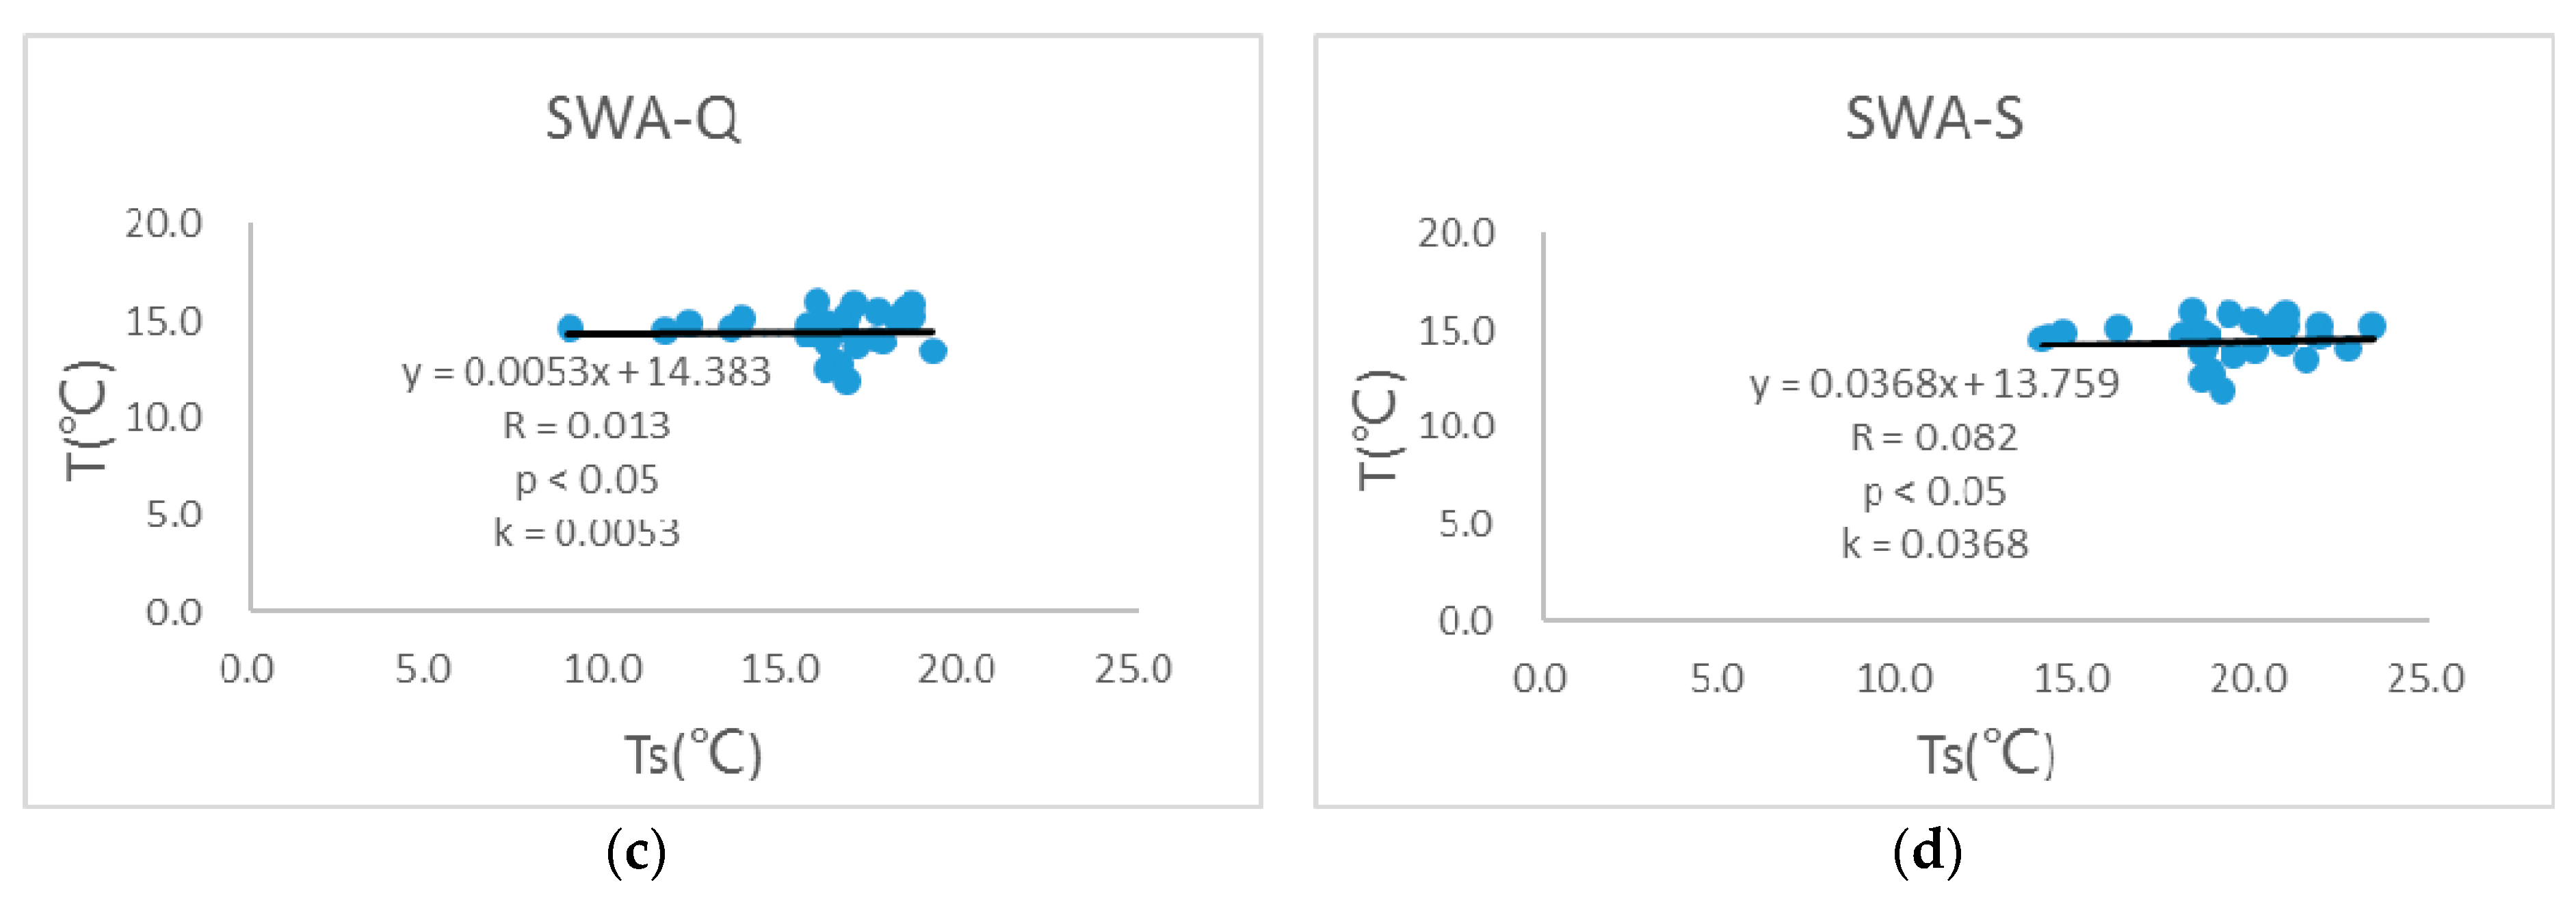
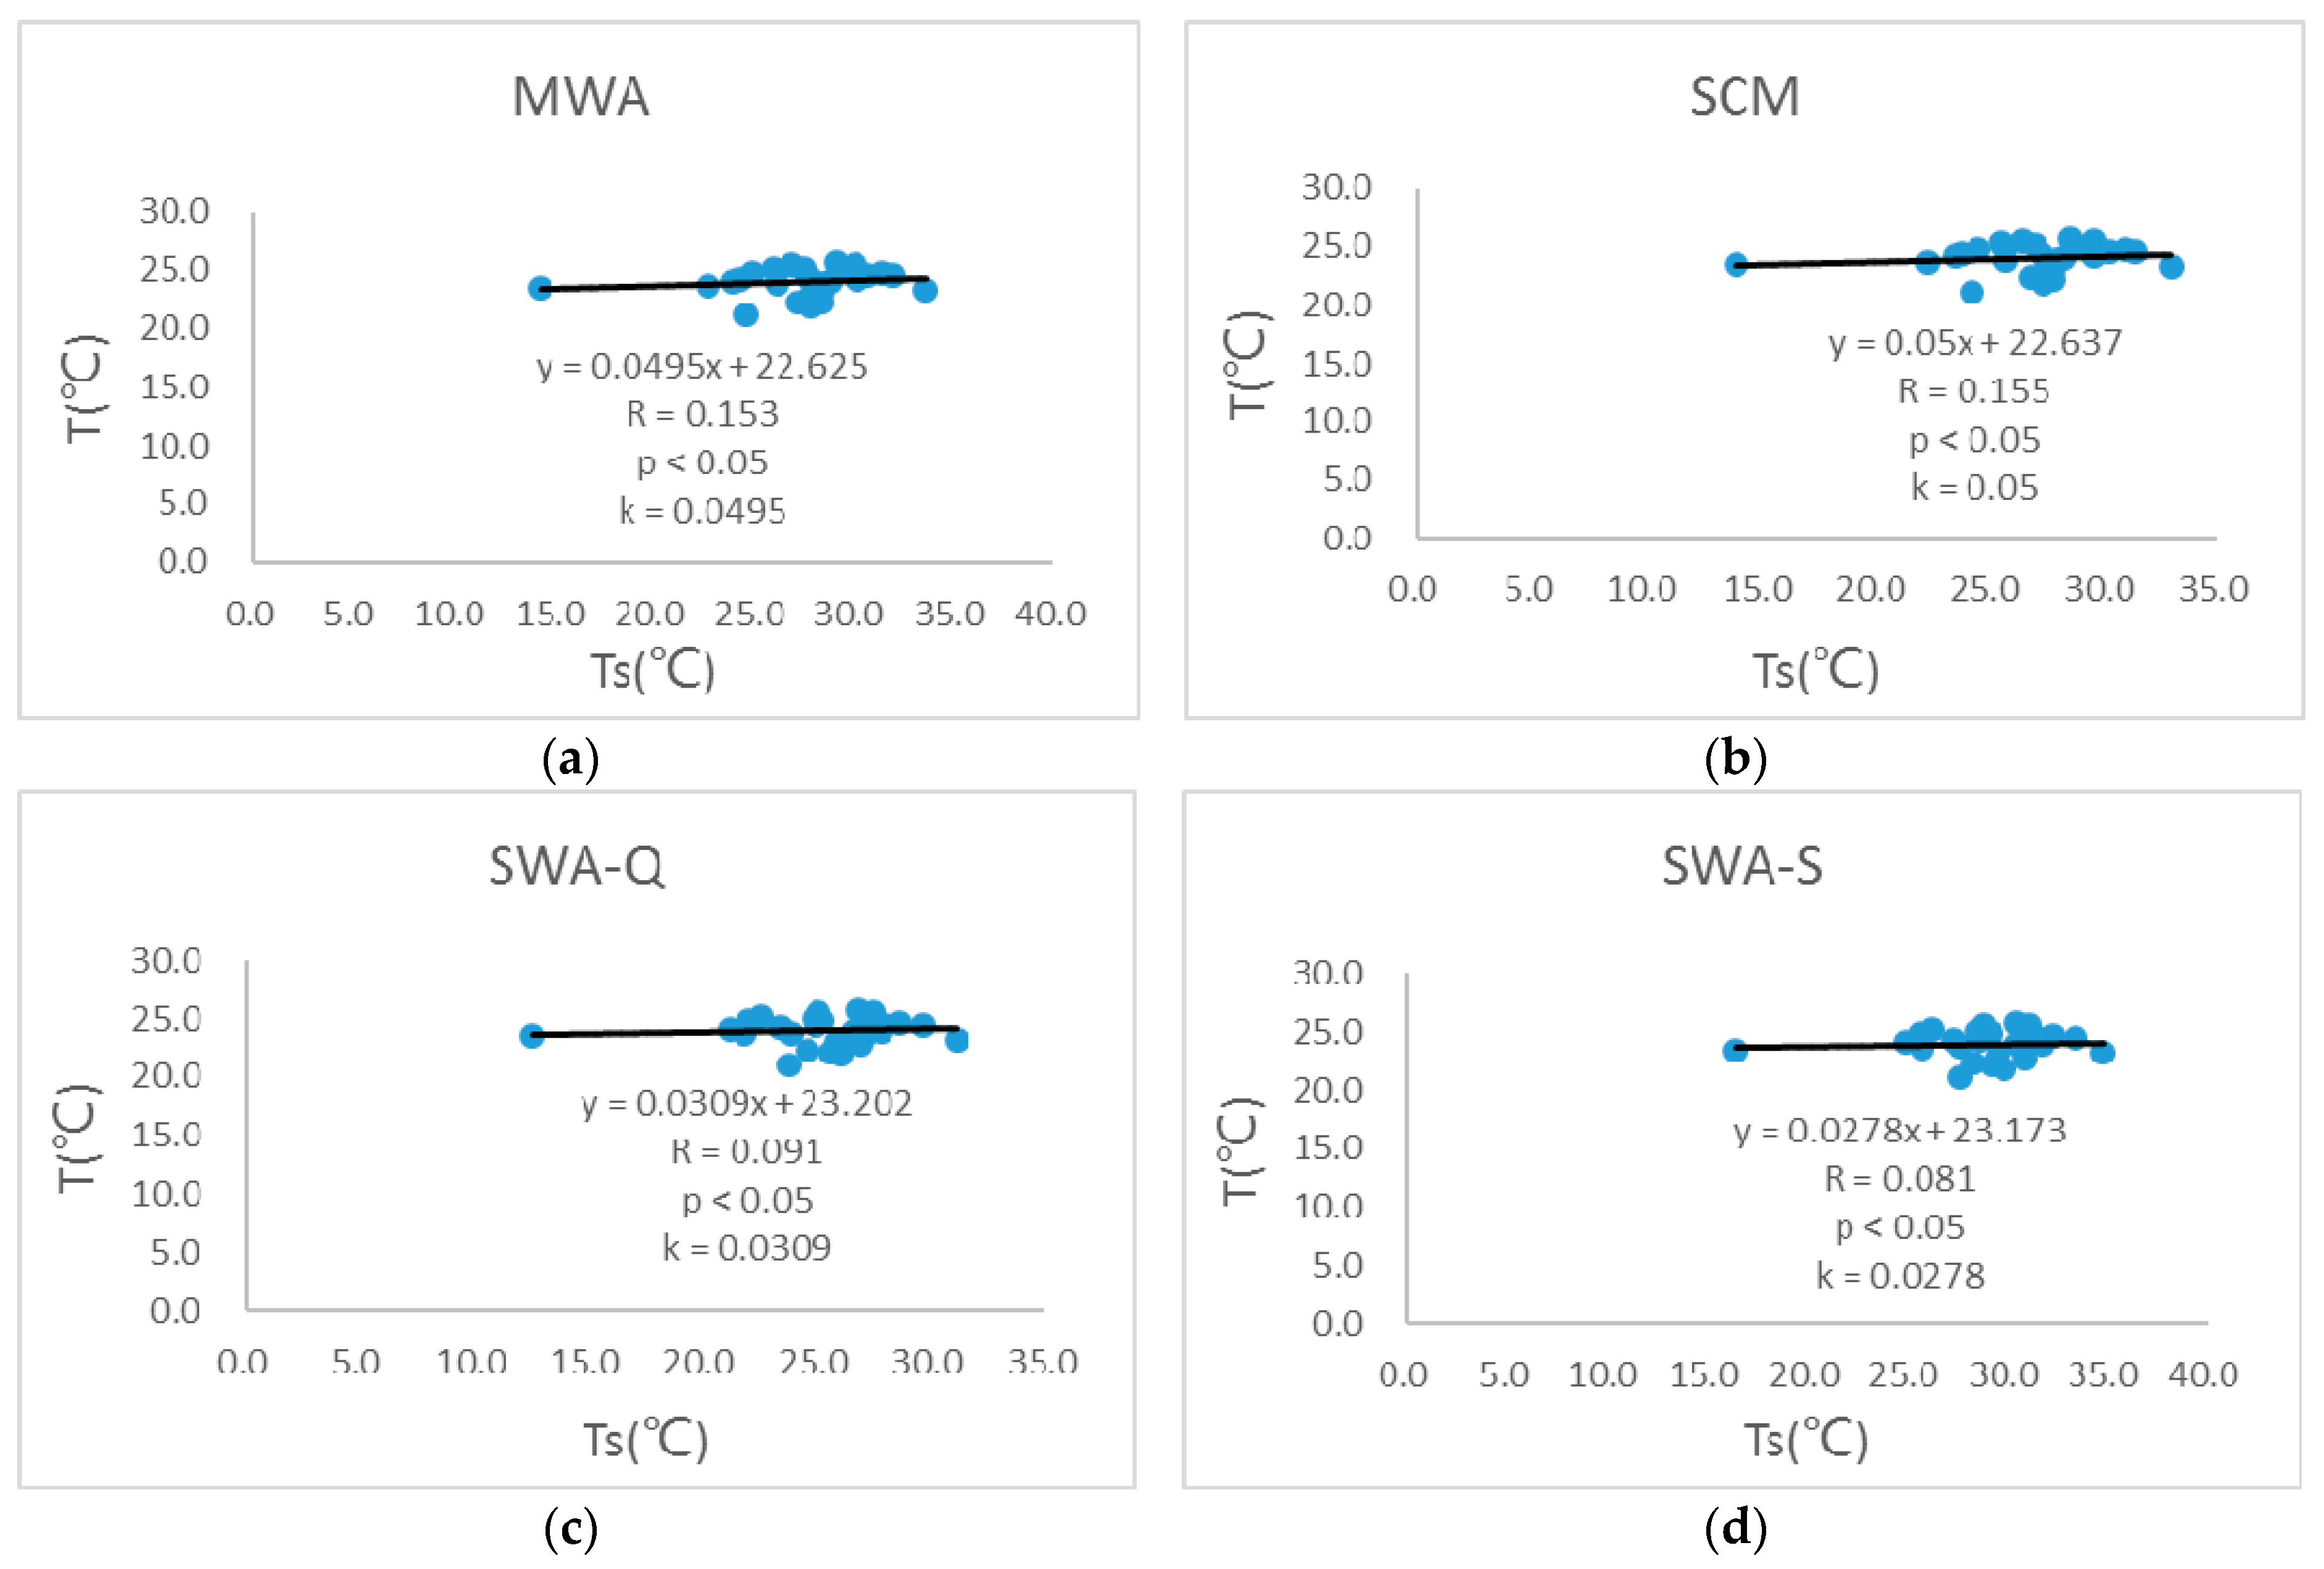
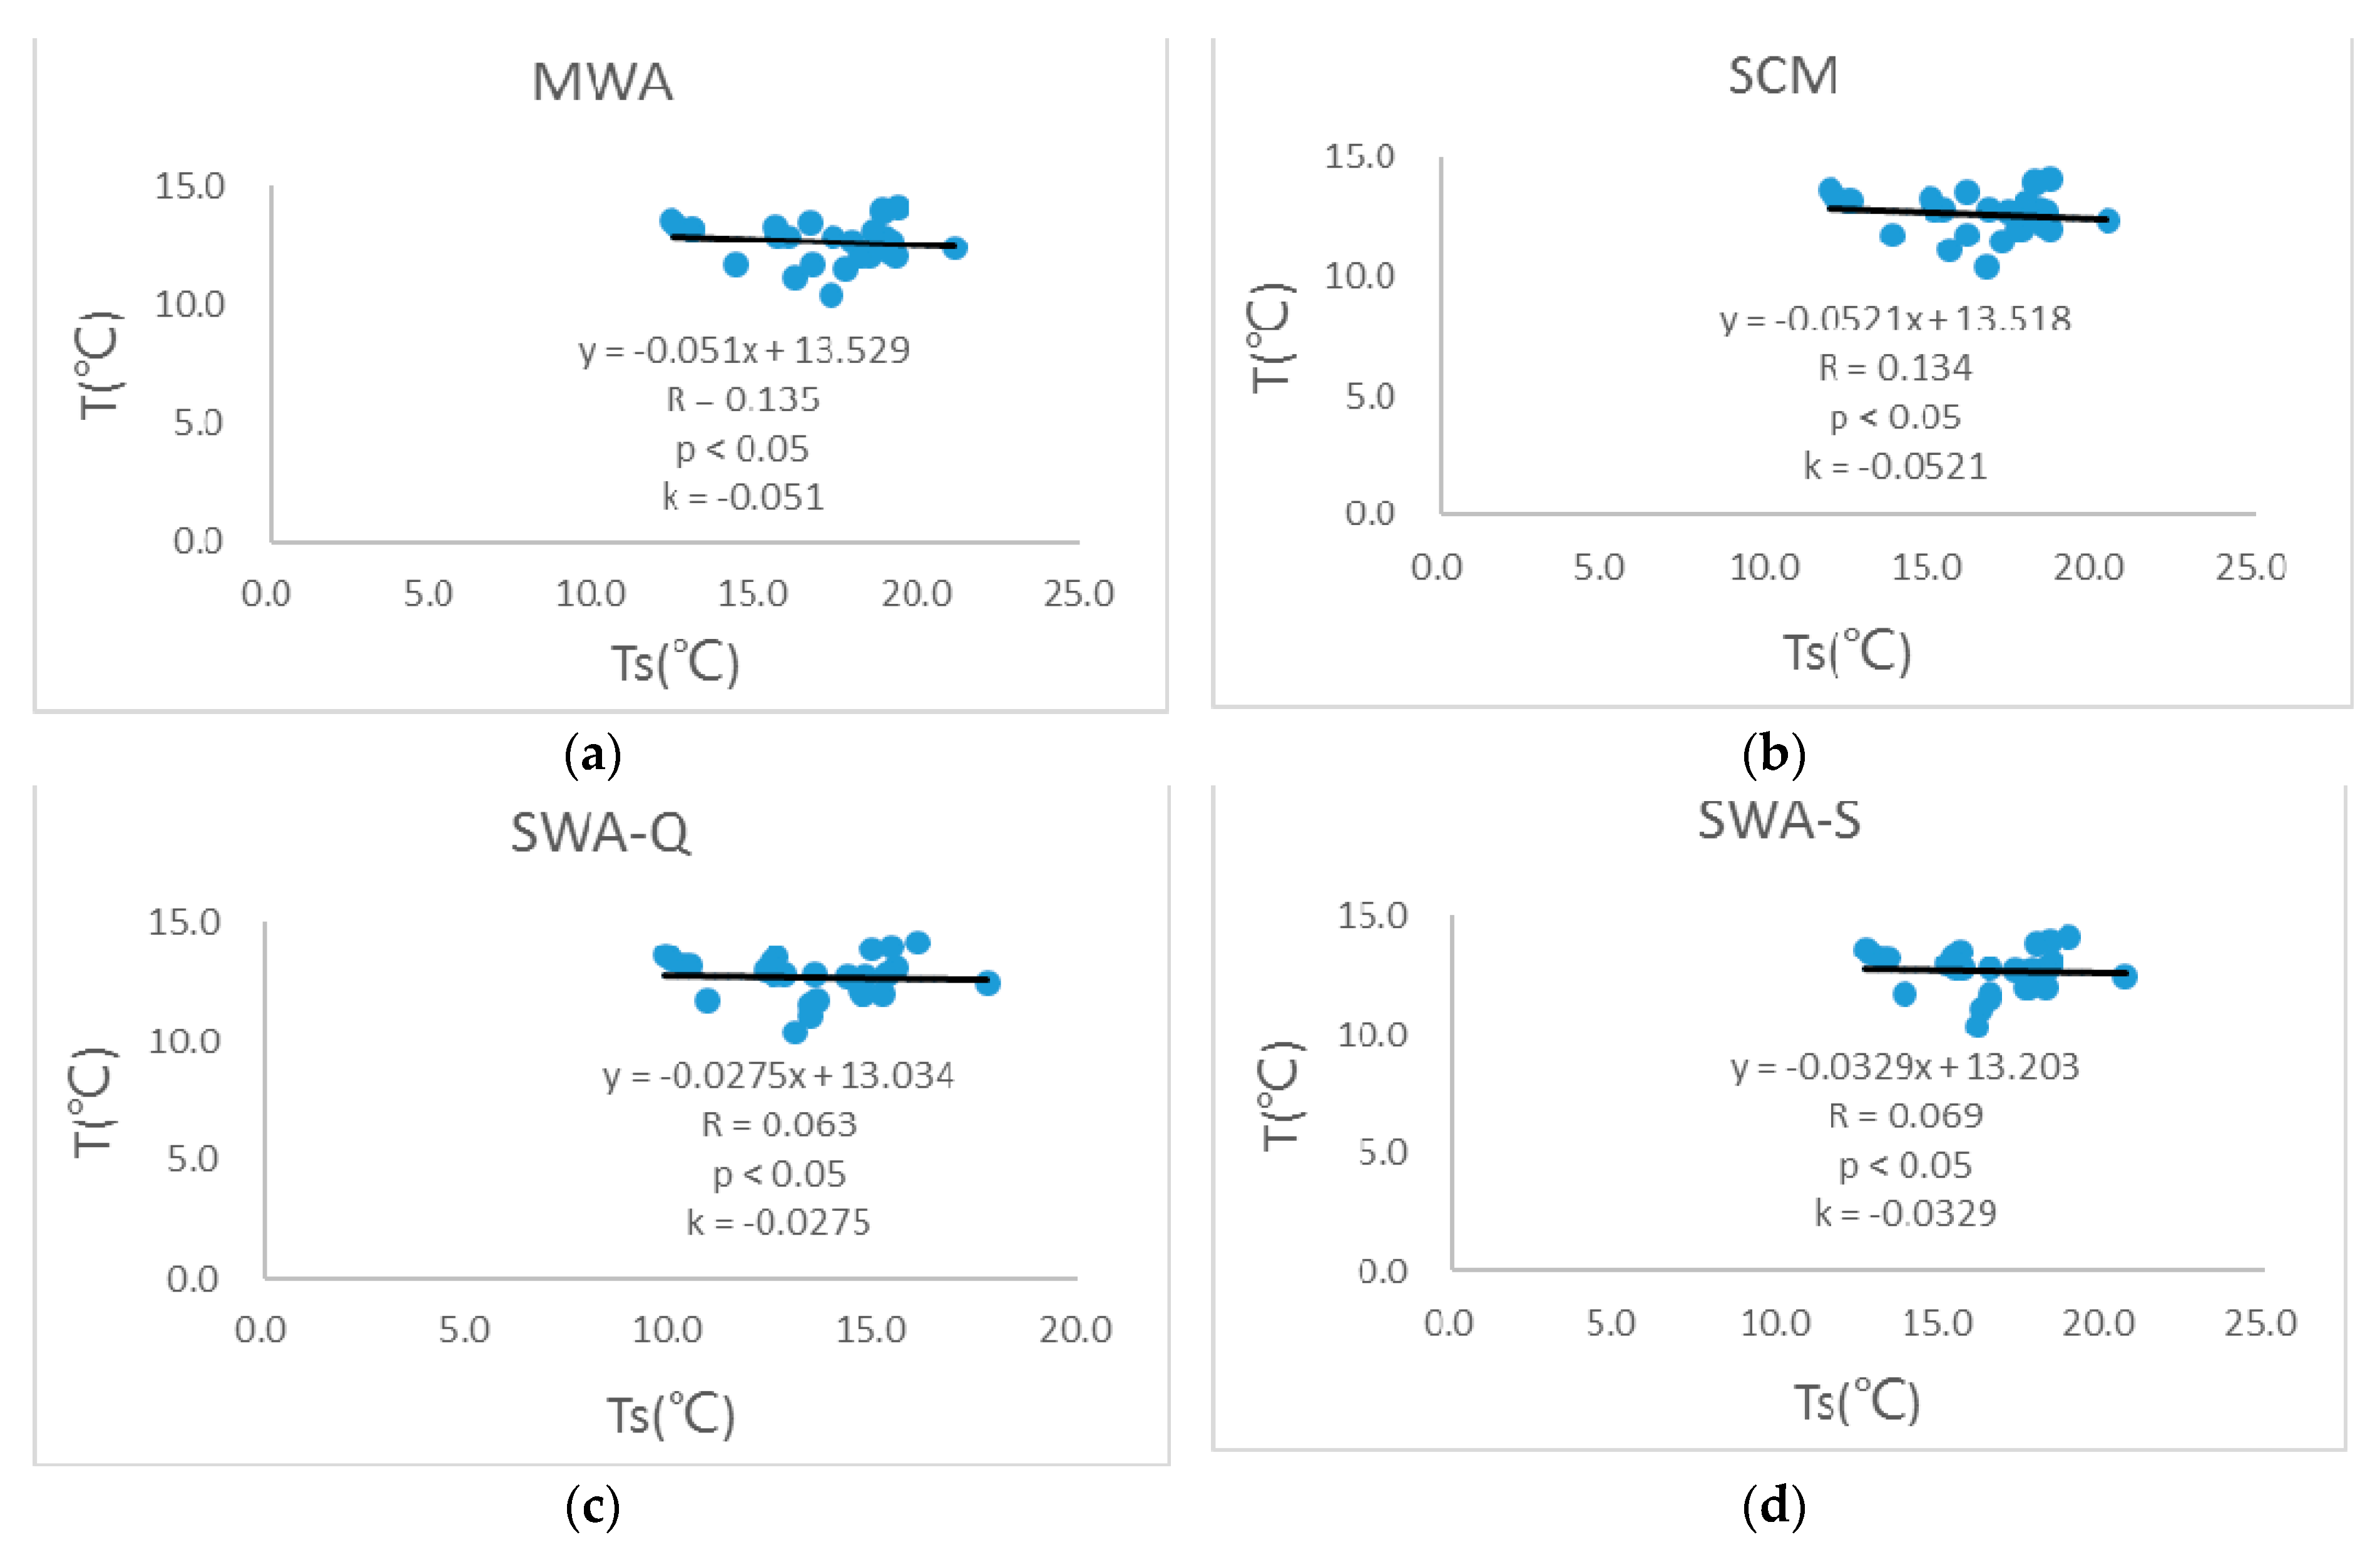
For comparing the accuracy of four methods, and then selecting the most accurate method to analyze the LST and UHI in Shenzhen and Hong Kong, the LST retrievals from 28 Hong Kong weather stations are extracted to compare with the mean daily air temperature collected from the Hong Kong Observatory (
Figure 3,
Figure 4,
Figure 5 and
Figure 6) [
38].
From
Figure 3,
Figure 4,
Figure 5 and
Figure 6,
Ts is the LST (°C);
T is the mean daily air temperature (°C); R is correlation coefficient; p is
p-value; and k is linear slope. In
Figure 3, the distribution of LST retrieval is more scattered than that of the mean daily air temperature, that is to say, the LST retrieval has some extreme values that decrease the general accuracy. In addition, the range of SWA-Q’s LST retrieval, basically between 10.0 °C and 20.0 °C, is relatively closer to the range of the measured mean air temperature, approximately between 12.0 °C and 16.0 °C, compared with the range of the other three methods’ LST retrievals, mostly between 15.0 °C and 25.0 °C.
In
Figure 4, the distribution of LST retrieval is more concentrated than that in
Figure 3, in other words, the LST retrieval in
Figure 4 has fewer extreme values than that in
Figure 3. Additionally, the range of SWA-Q’s LST retrieval, basically between 20.0 °C and 29.0 °C, is relatively closer to the range of measured mean air temperature, approximately between 20.0 °C and 23.0 °C, compared with the range of the other three methods’ LST retrievals, mostly between 22.0 °C and 33.0 °C.
In
Figure 5, the distribution of LST retrieval is much more scattering than that of the mean daily air temperature and has an extremely low value which may influence the LST’s accuracy. Additionally, the range of the SWA-Q’s LST retrieval, basically between 21.0 °C and 31.0 °C, is relatively closer to the range of measured mean air temperature, approximately between 21.0 °C and 26.0 °C, compared with the range of the other three methods’ LST retrievals, mostly between 23.0 °C and 34.0 °C.
Figure 6 shows that the distribution of LST retrieval is more scattered than that of the mean daily air temperature. In addition, the range of the SWA-Q’s LST retrieval, basically between 9.0 °C and 18.0 °C, is relatively closer to the range of measured mean air temperature, approximately between 10.0 °C and 14.0 °C, compared with the range of the other three methods’ LST retrievals, mostly between 12.0 °C and 21.0 °C.
For comparing the precision of four methods in a more precise and quantitative way, two statistical indices, the root mean square error (RMSE) and mean bias error (MBE), are used to assess the deviation between the estimators and observed values, and calculated as Equations (31) and (32) [
23,
32]:
where
RMSE is the root mean square error between variable
x and
y;
MBE is the mean bias error between variable
x and
y; and
x and
y are, respectively, the LST retrievals by four methods and observed mean daily air temperature in this paper.
In
Table 8, the correlation coefficients are relatively low, in general, which means the correlation between the LST retrieval of fixed points and observed air temperature is relatively low, which may be because the measured LST data are not found, and the observed air temperature which is approximately utilized as the LST in this paper has relatively weak correlation with the LST retrieval. Additionally, the SWA-Q’s RMSEs and MBEs are less than the other three methods, which means the SWA-Q’s precision is higher than the other three methods. Furthermore, according to the RMSE and MBE of the SWA-Q, the accuracy of the LST retrieval on 7 February 2016 is the highest, followed by that on 29 November 2013 and 16 November 2014, and that on 18 October 2015 is the lowest. Therefore, the LST retrieval of the SWA-Q is more accurate than the LST retrievals of the other three methods. For this reason, the LST retrieval of the SWA-Q is applied to analyze the LST and UHI in Shenzhen and Hong Kong from 2013 to 2016.
According to the accuracy analysis result, the accuracy of the four methods is uneven, so the error analysis is illuminated in three aspects, namely, data, methodology, and study area.
The data’s error analysis is generalized in three points. Firstly, although the satellite images have no obvious cloud cover in the study areas of this paper, a certain amount of water vapor still influence the accuracy of the LST conversion. Secondly, the atmospheric correction is not executed in the image pre-processing of this study, so the radiance error caused by the atmospheric scattering of the satellite images is not eliminated. Thirdly, because the measured LST data in the study areas are not found, the observed air temperature that already exists contains a certain amount of error, and the actual LST at the time of the images is approximately utilized as the LST in this paper.
The methodology’s error analysis is summarized in two points. Firstly, Shenzhen and Hong Kong are located in a subtropical area, but the standard profile for subtropical areas is not found, so the standard profiles for tropical areas or the global scale are adopted, which may cause a certain amount of deviation. For example, the standard atmosphere for tropical areas is applied in the calculation of mean atmospheric temperature and the 1976 US standard is utilized in the computation of atmospheric transmittance, etc. [
16,
29]. Secondly, some related databases for Landsat 8 are not found, so some other related databases are employed which may also cause a certain amount of deviation. For instance, the calculation of land surface emissivity, atmospheric functions in the SCM, and coefficients in the SWA-S are, respectively, based on the ASTER spectral database, GAPRI database, and MAPRI database [
27,
28].
Remote sensing is more applicable to large-scale areas, while the study areas in this paper, Shenzhen and Hong Kong, whose total area is approximate 3102 km
2, are not large-scale areas for remote sensing and, therefore, the scale of the study area may affect the accuracy of this study [
32,
34].
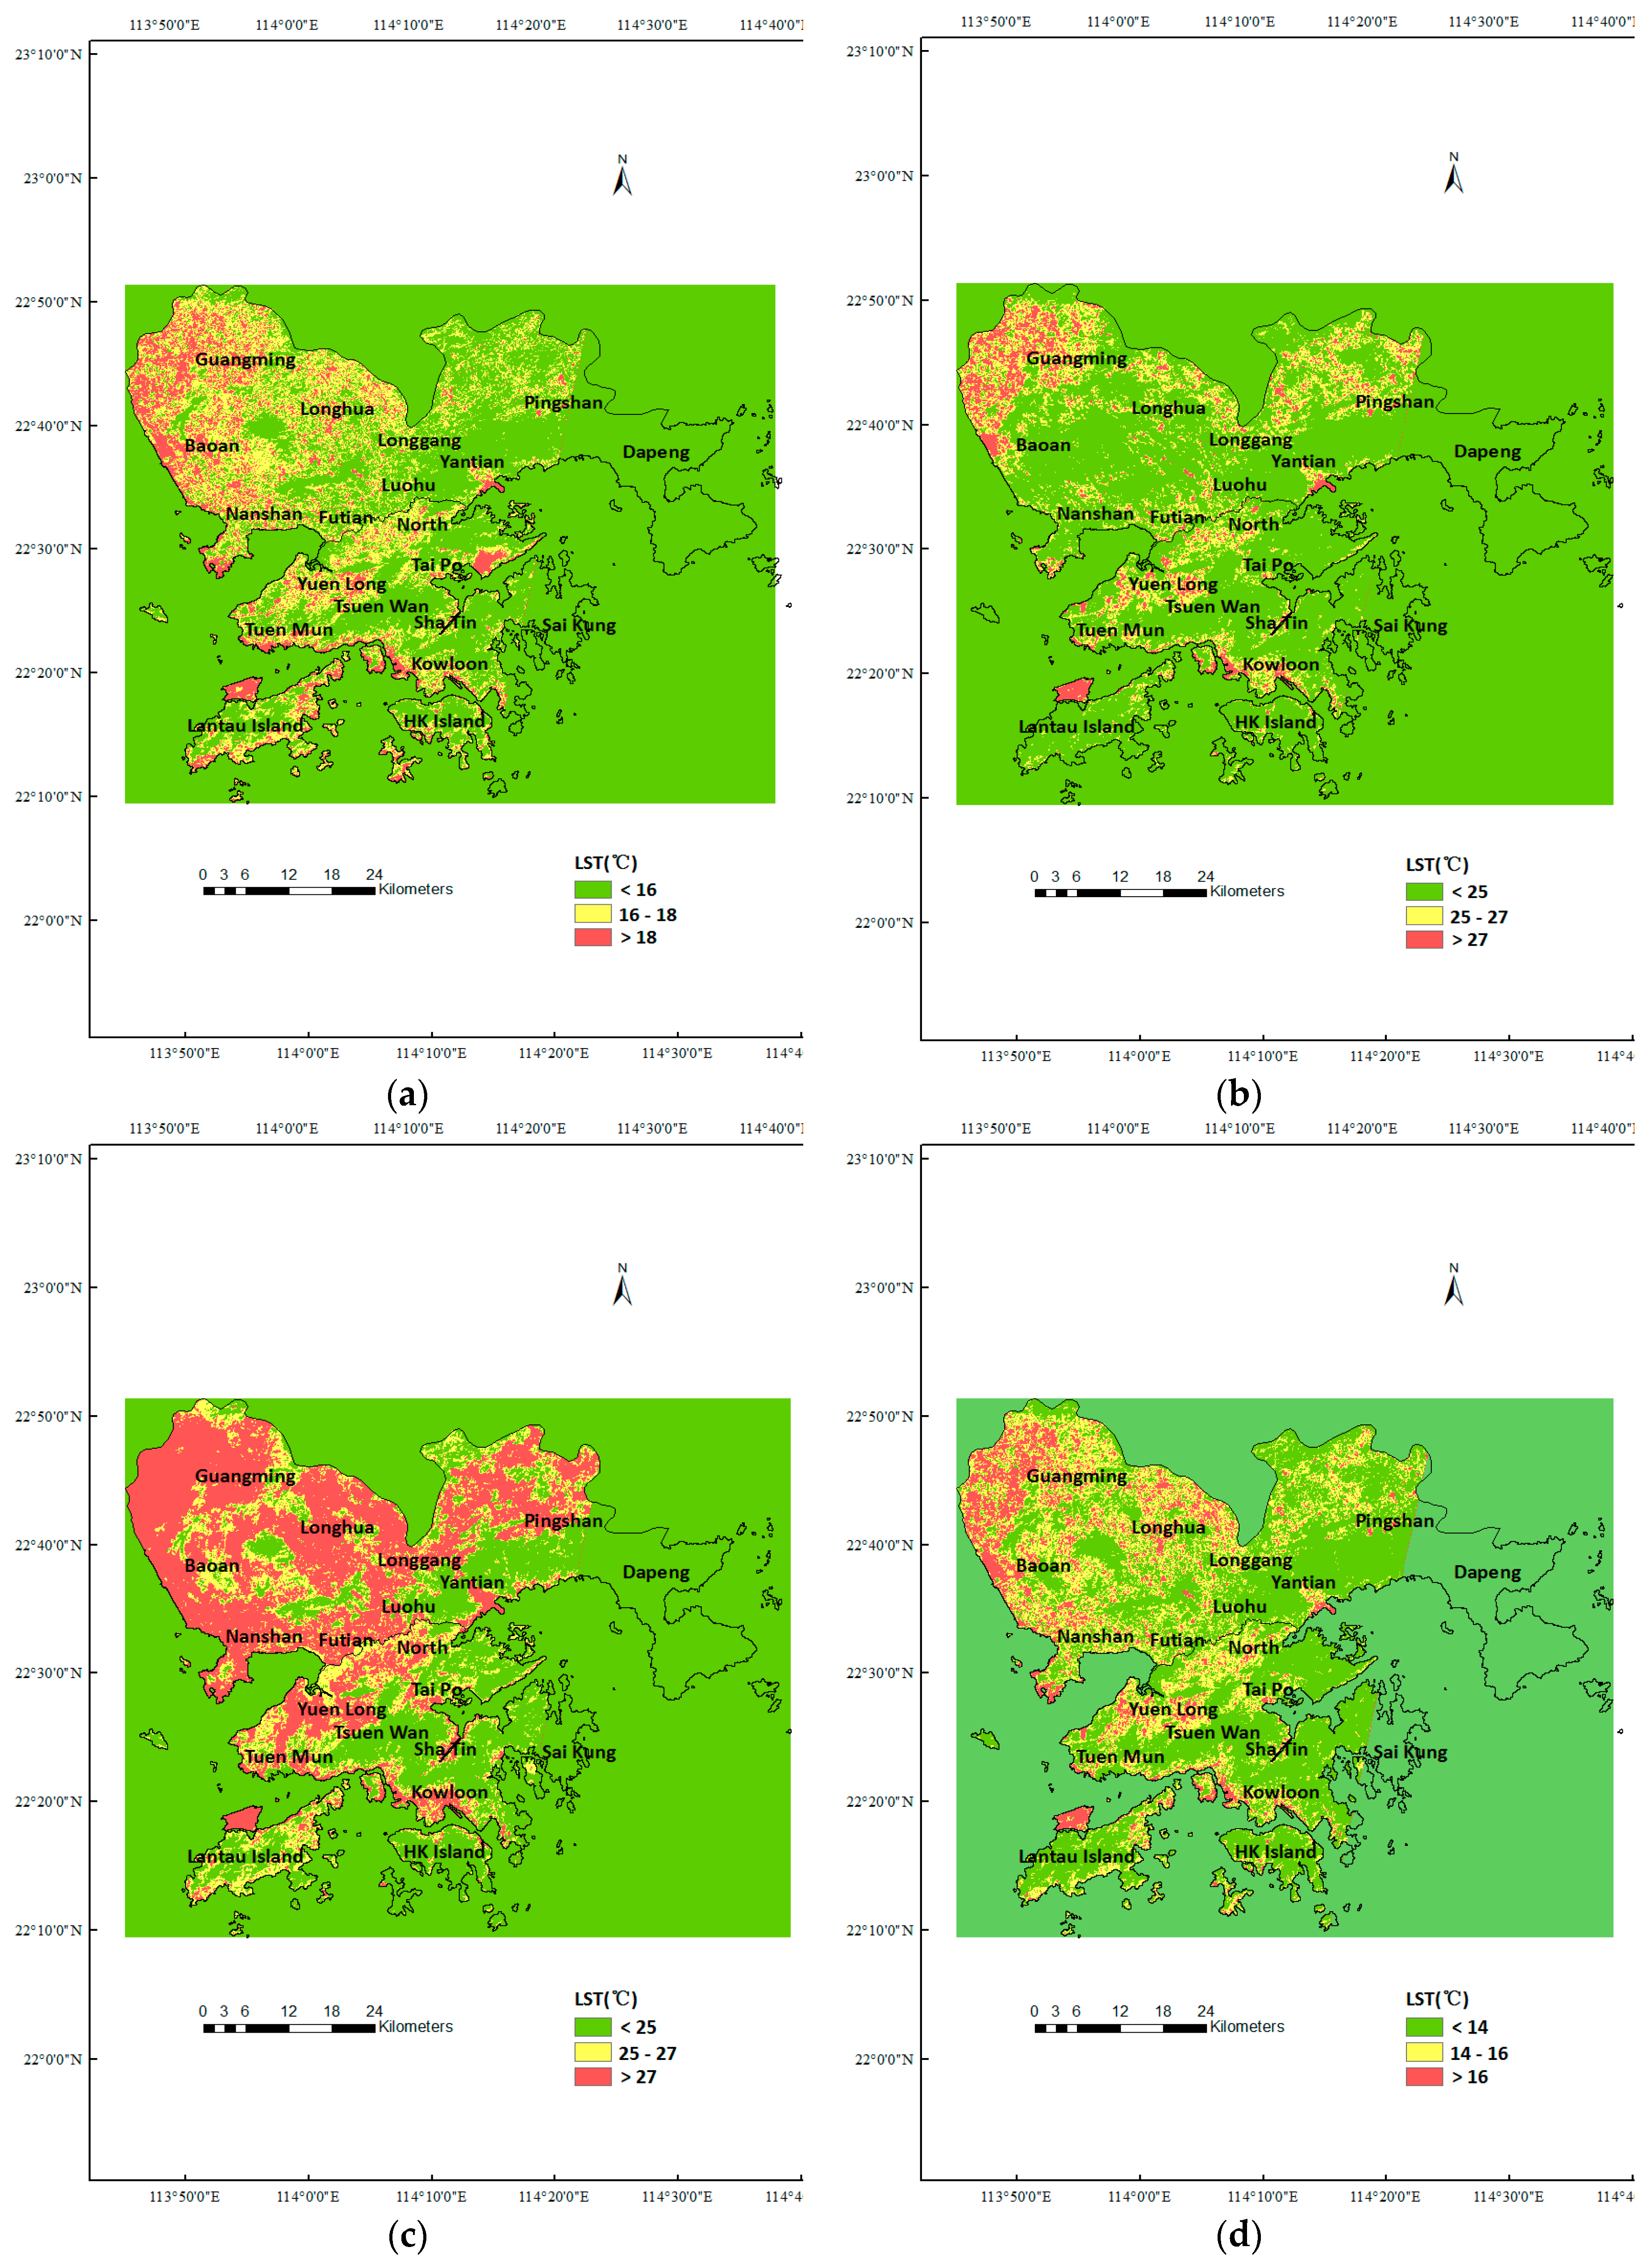
4.2. Land Surface Temperature Distribution
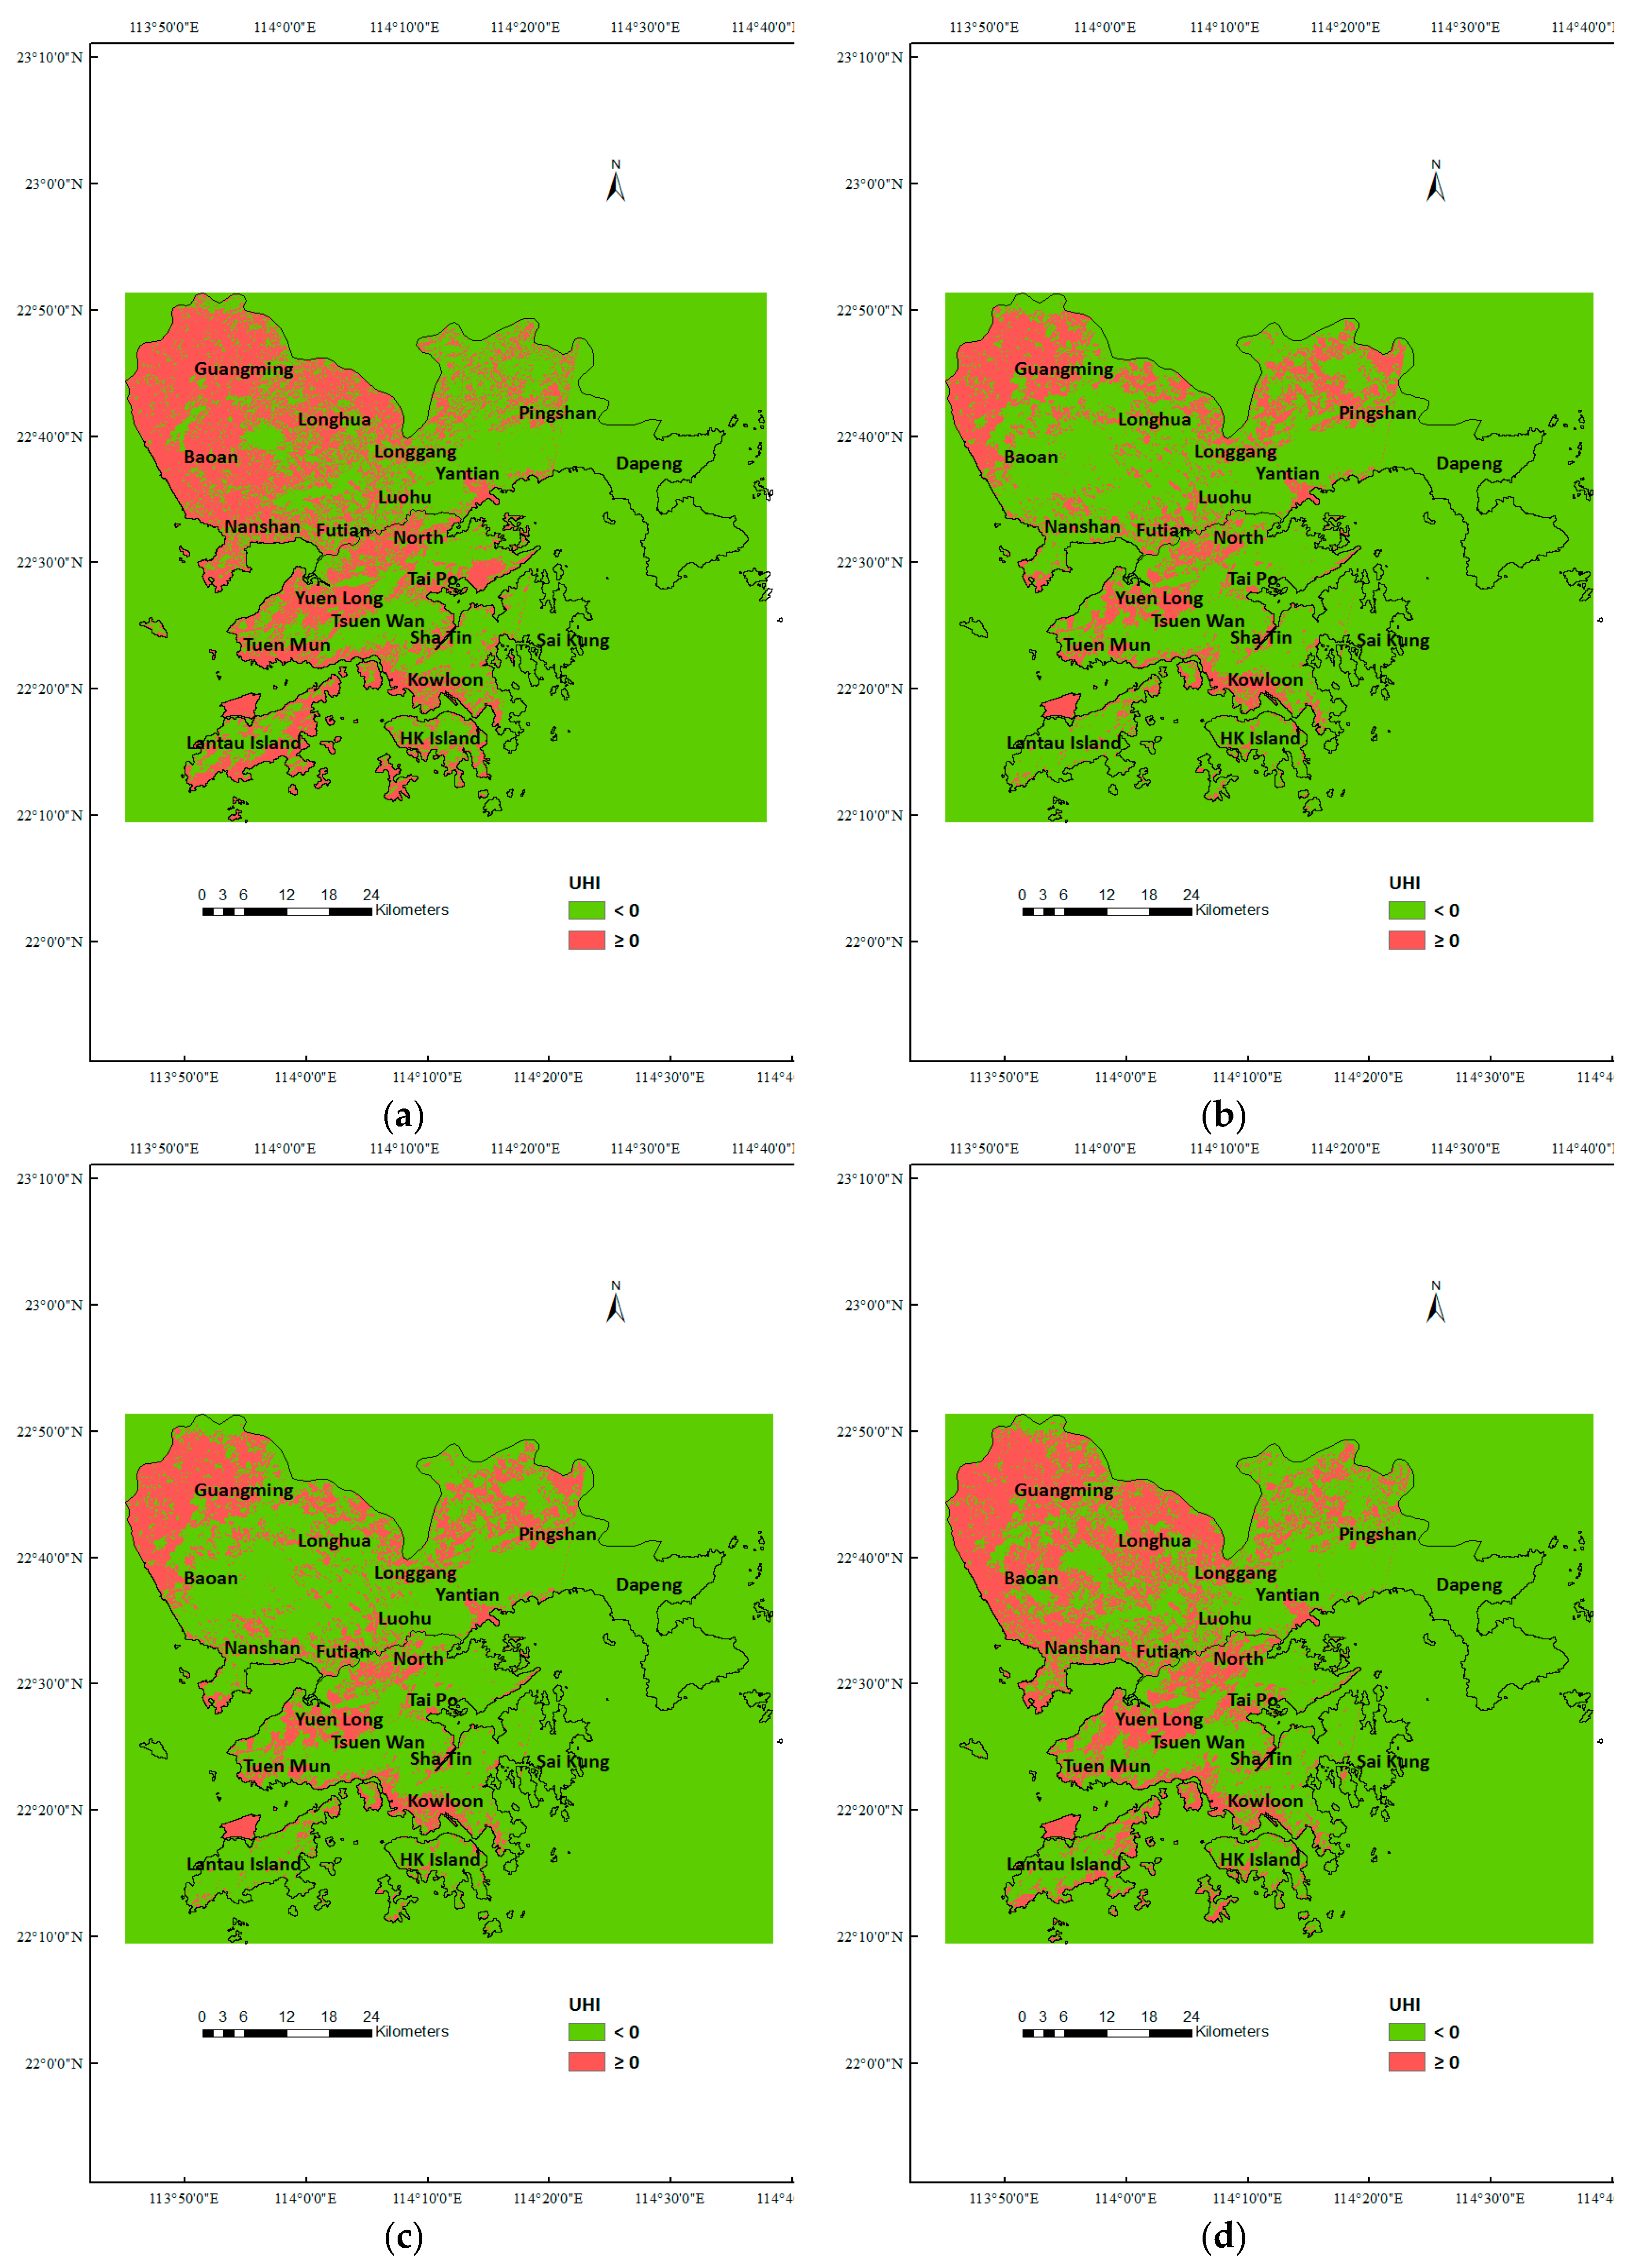
As mentioned above, the SWA-Q is the most accurate method among the four methods, so the LST retrieval of the SWA-Q is employed to export the LST and UHI distribution maps with ArcGIS 10.1 (
Figure 7 and
Figure 8) and analyze the LST and UHI in Shenzhen and Hong Kong from 2013 to 2016.
In
Figure 7, the green area means that the LST in that area is lower than the mean LST. In Shenzhen, the high-LST zones, namely, the red area in
Figure 7, mainly concentrate on the west of Shenzhen, including Guangming District, Baoan District, and Longhua District. The high-LST zones in Hong Kong mostly concentrate on Yuen Long, the west coast of Hong Kong, and Chulocock Island (namely, Hong Kong International Airport, located in the north of Lantau Island). In addition, the high-LST zones in 2015 are obviously larger than that in other years, which may be because the temperature difference in 2015 is larger than that in the other years. According to the measured air temperature, the temperature difference in 2015 is about 5 °C, while the temperature difference is around 3 °C in 2014 and 4 °C in 2013 and 2016. Additionally, the high-LST zones are relatively dispersive in 2013 and 2014, but relatively concentrative in 2015 and 2016.
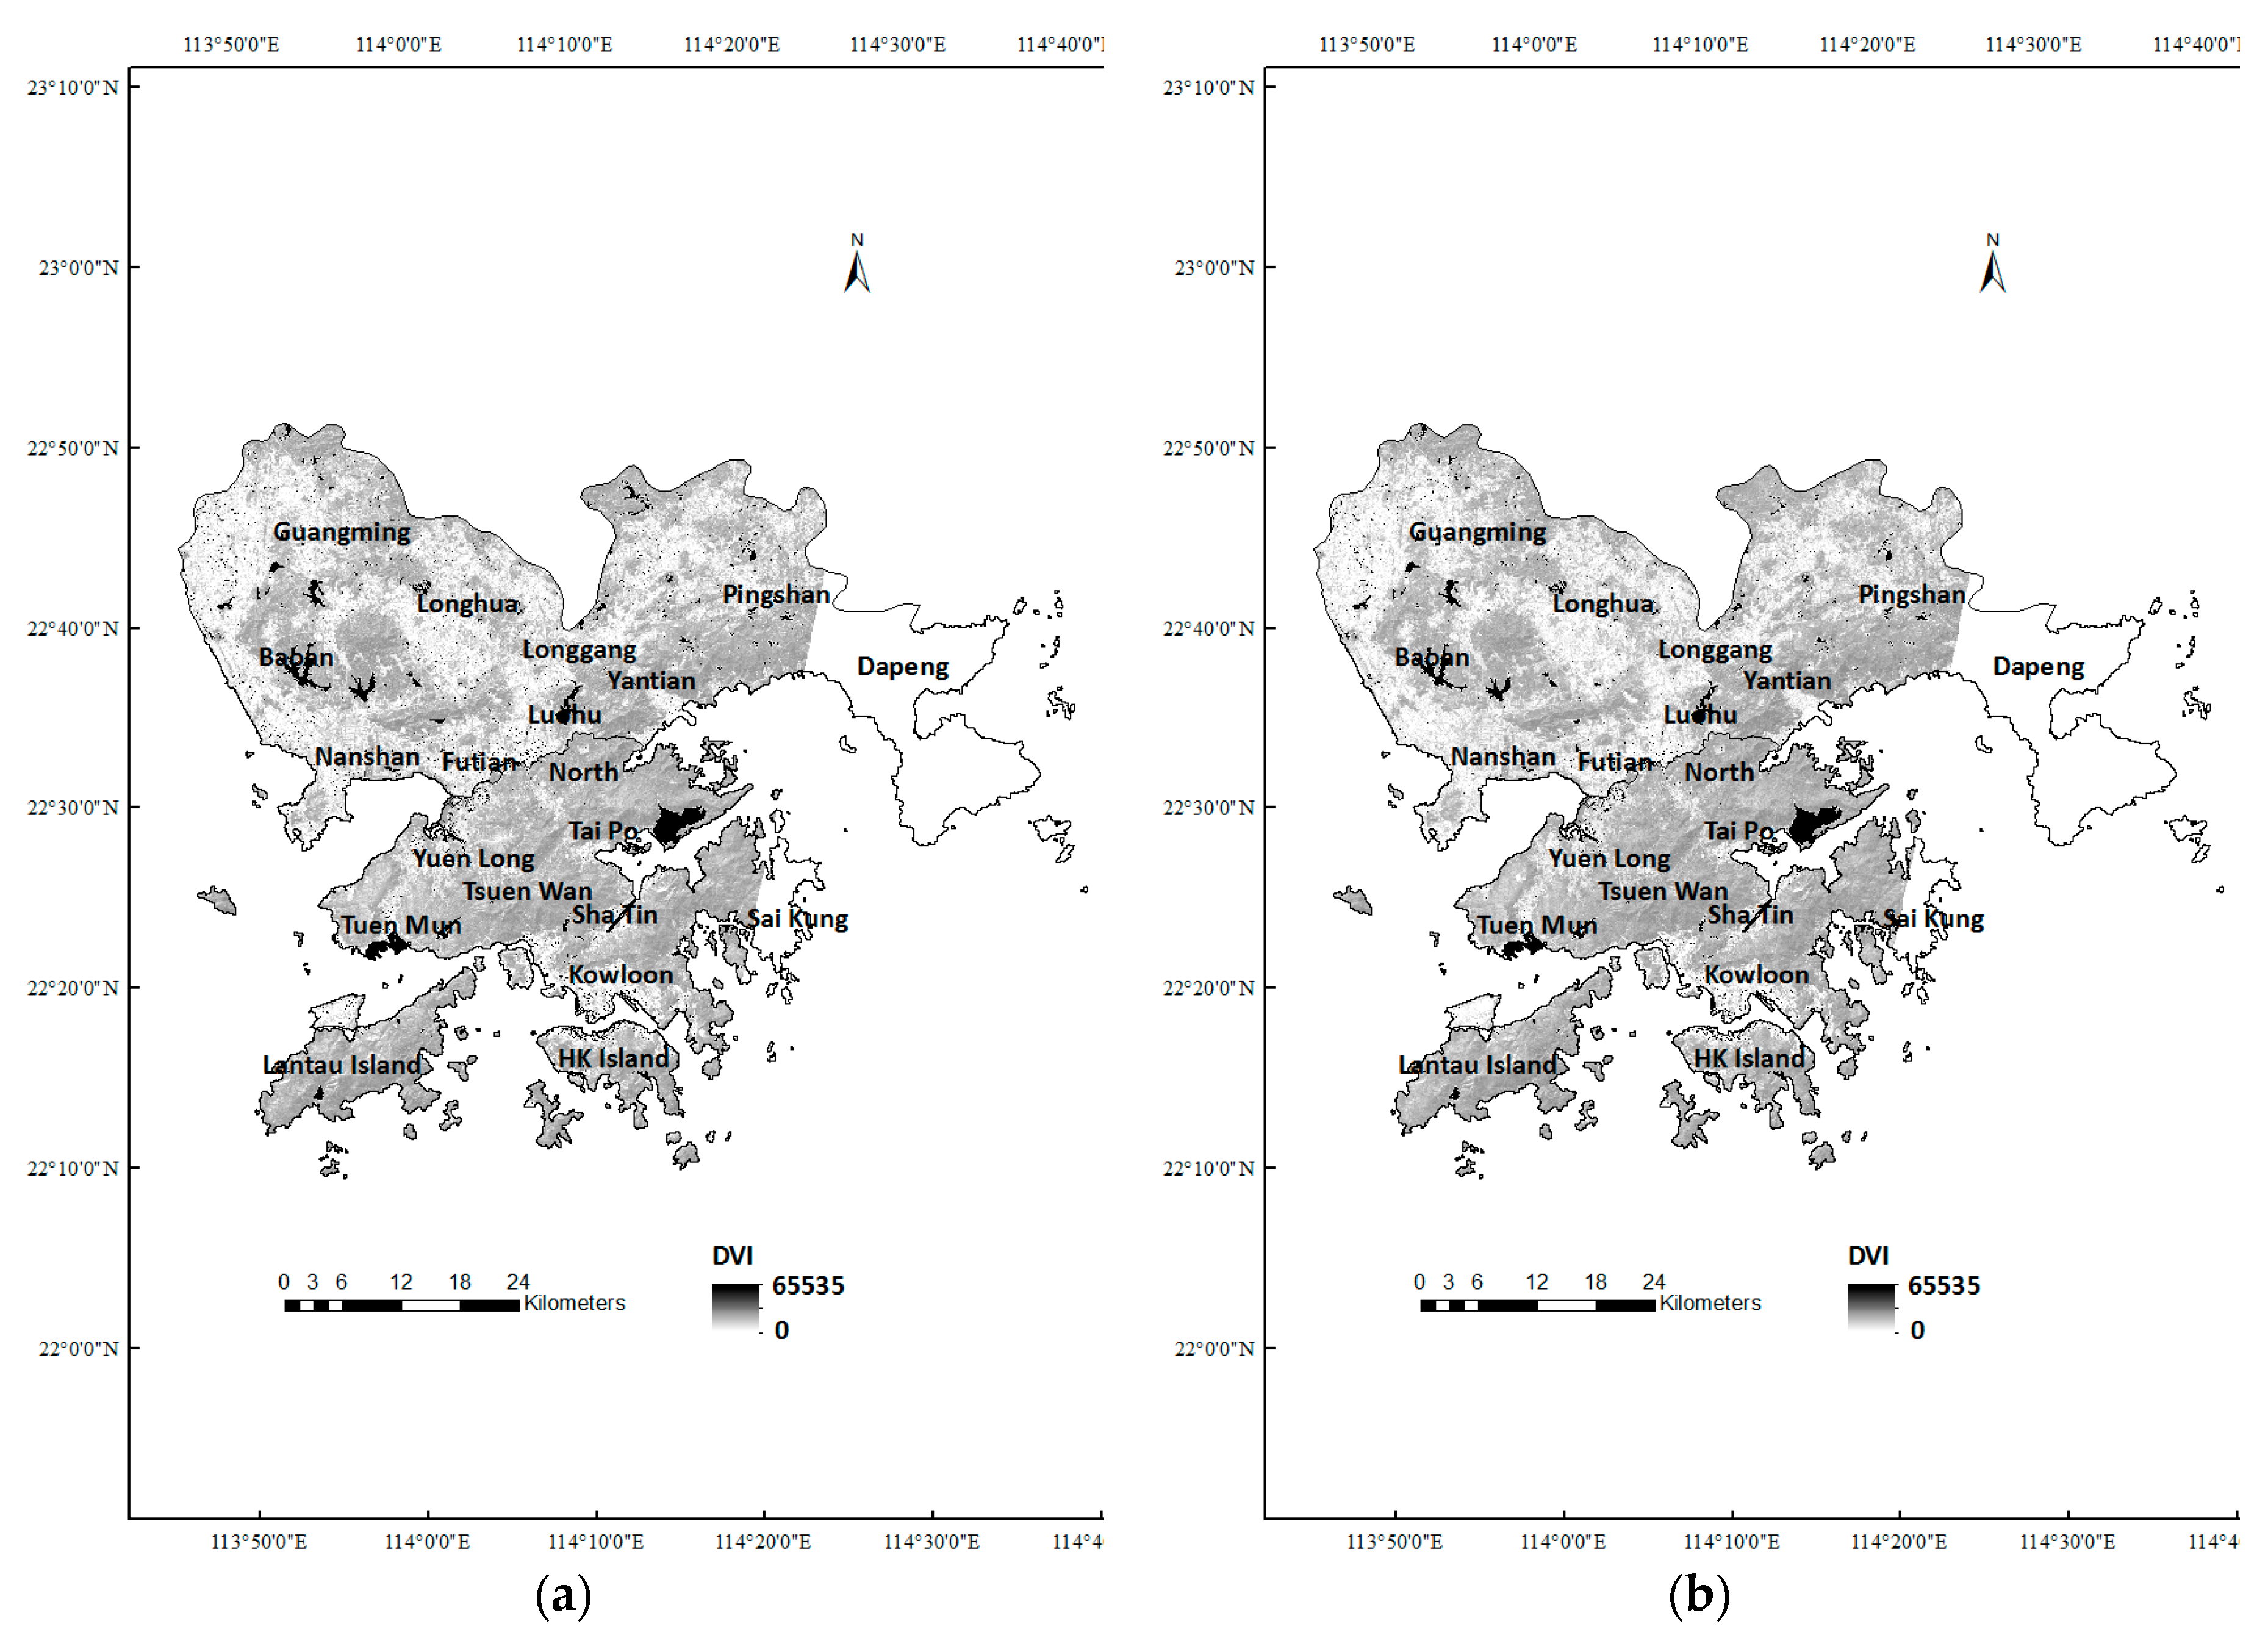
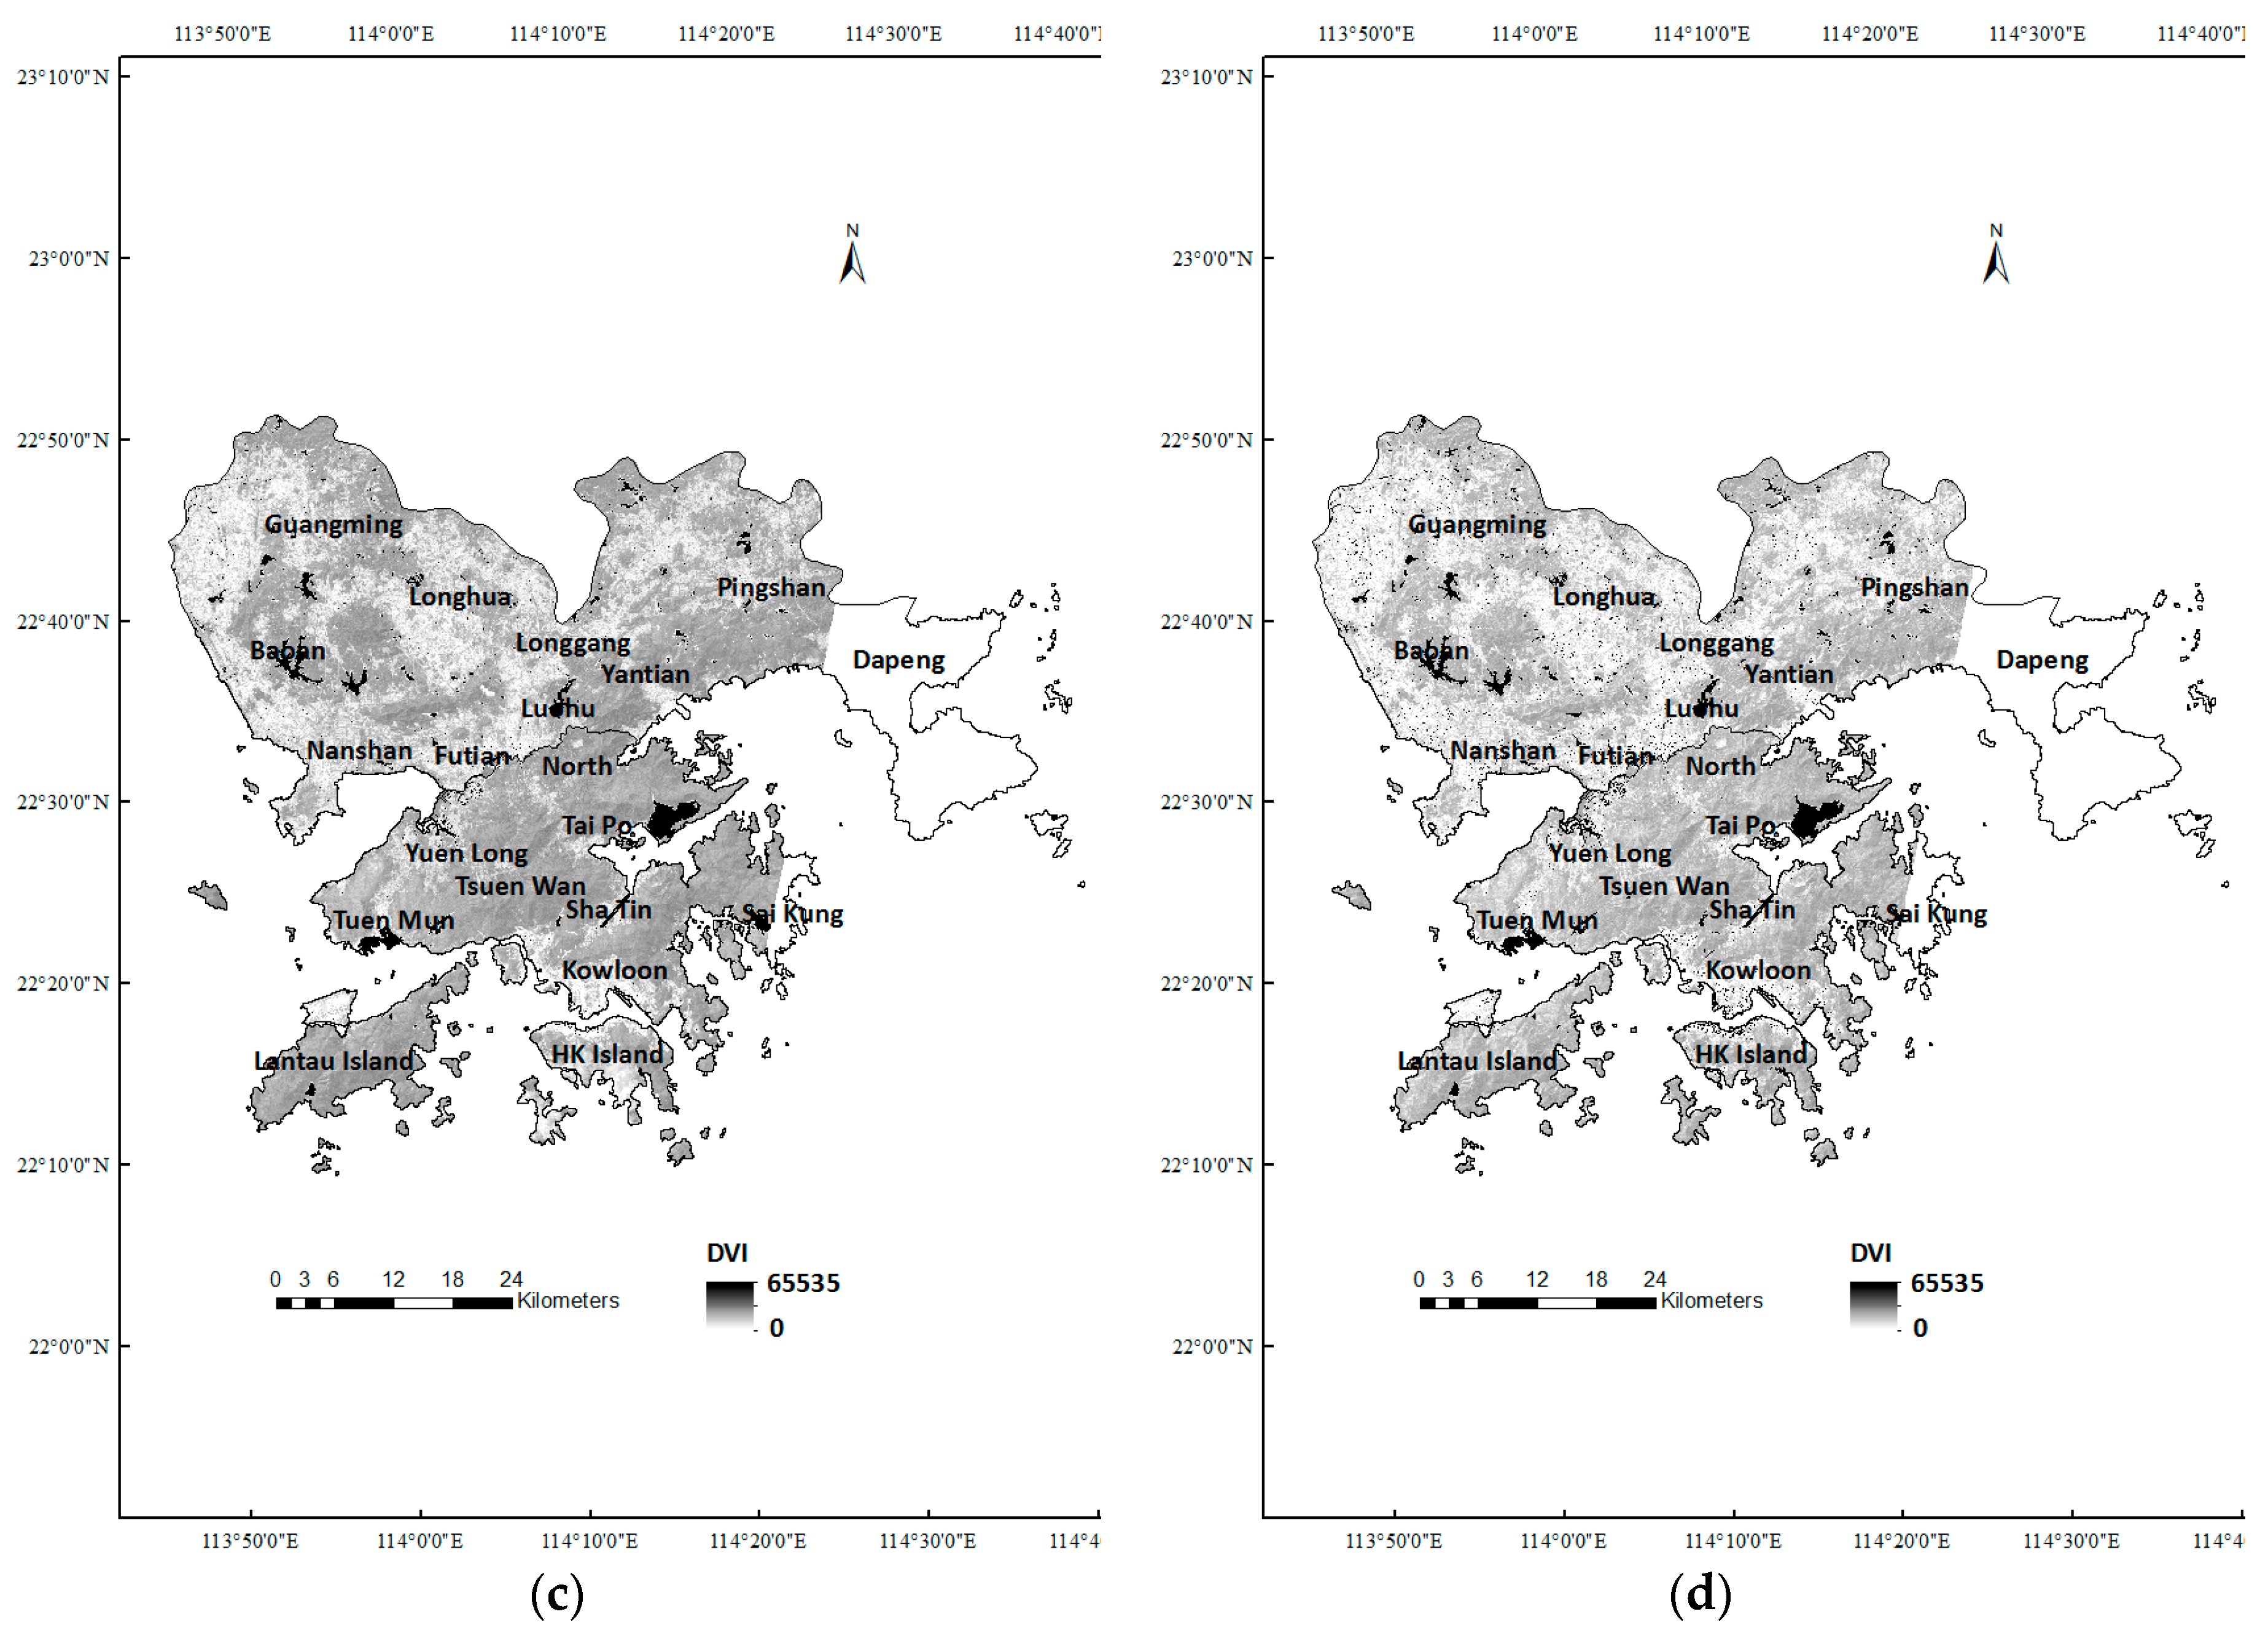
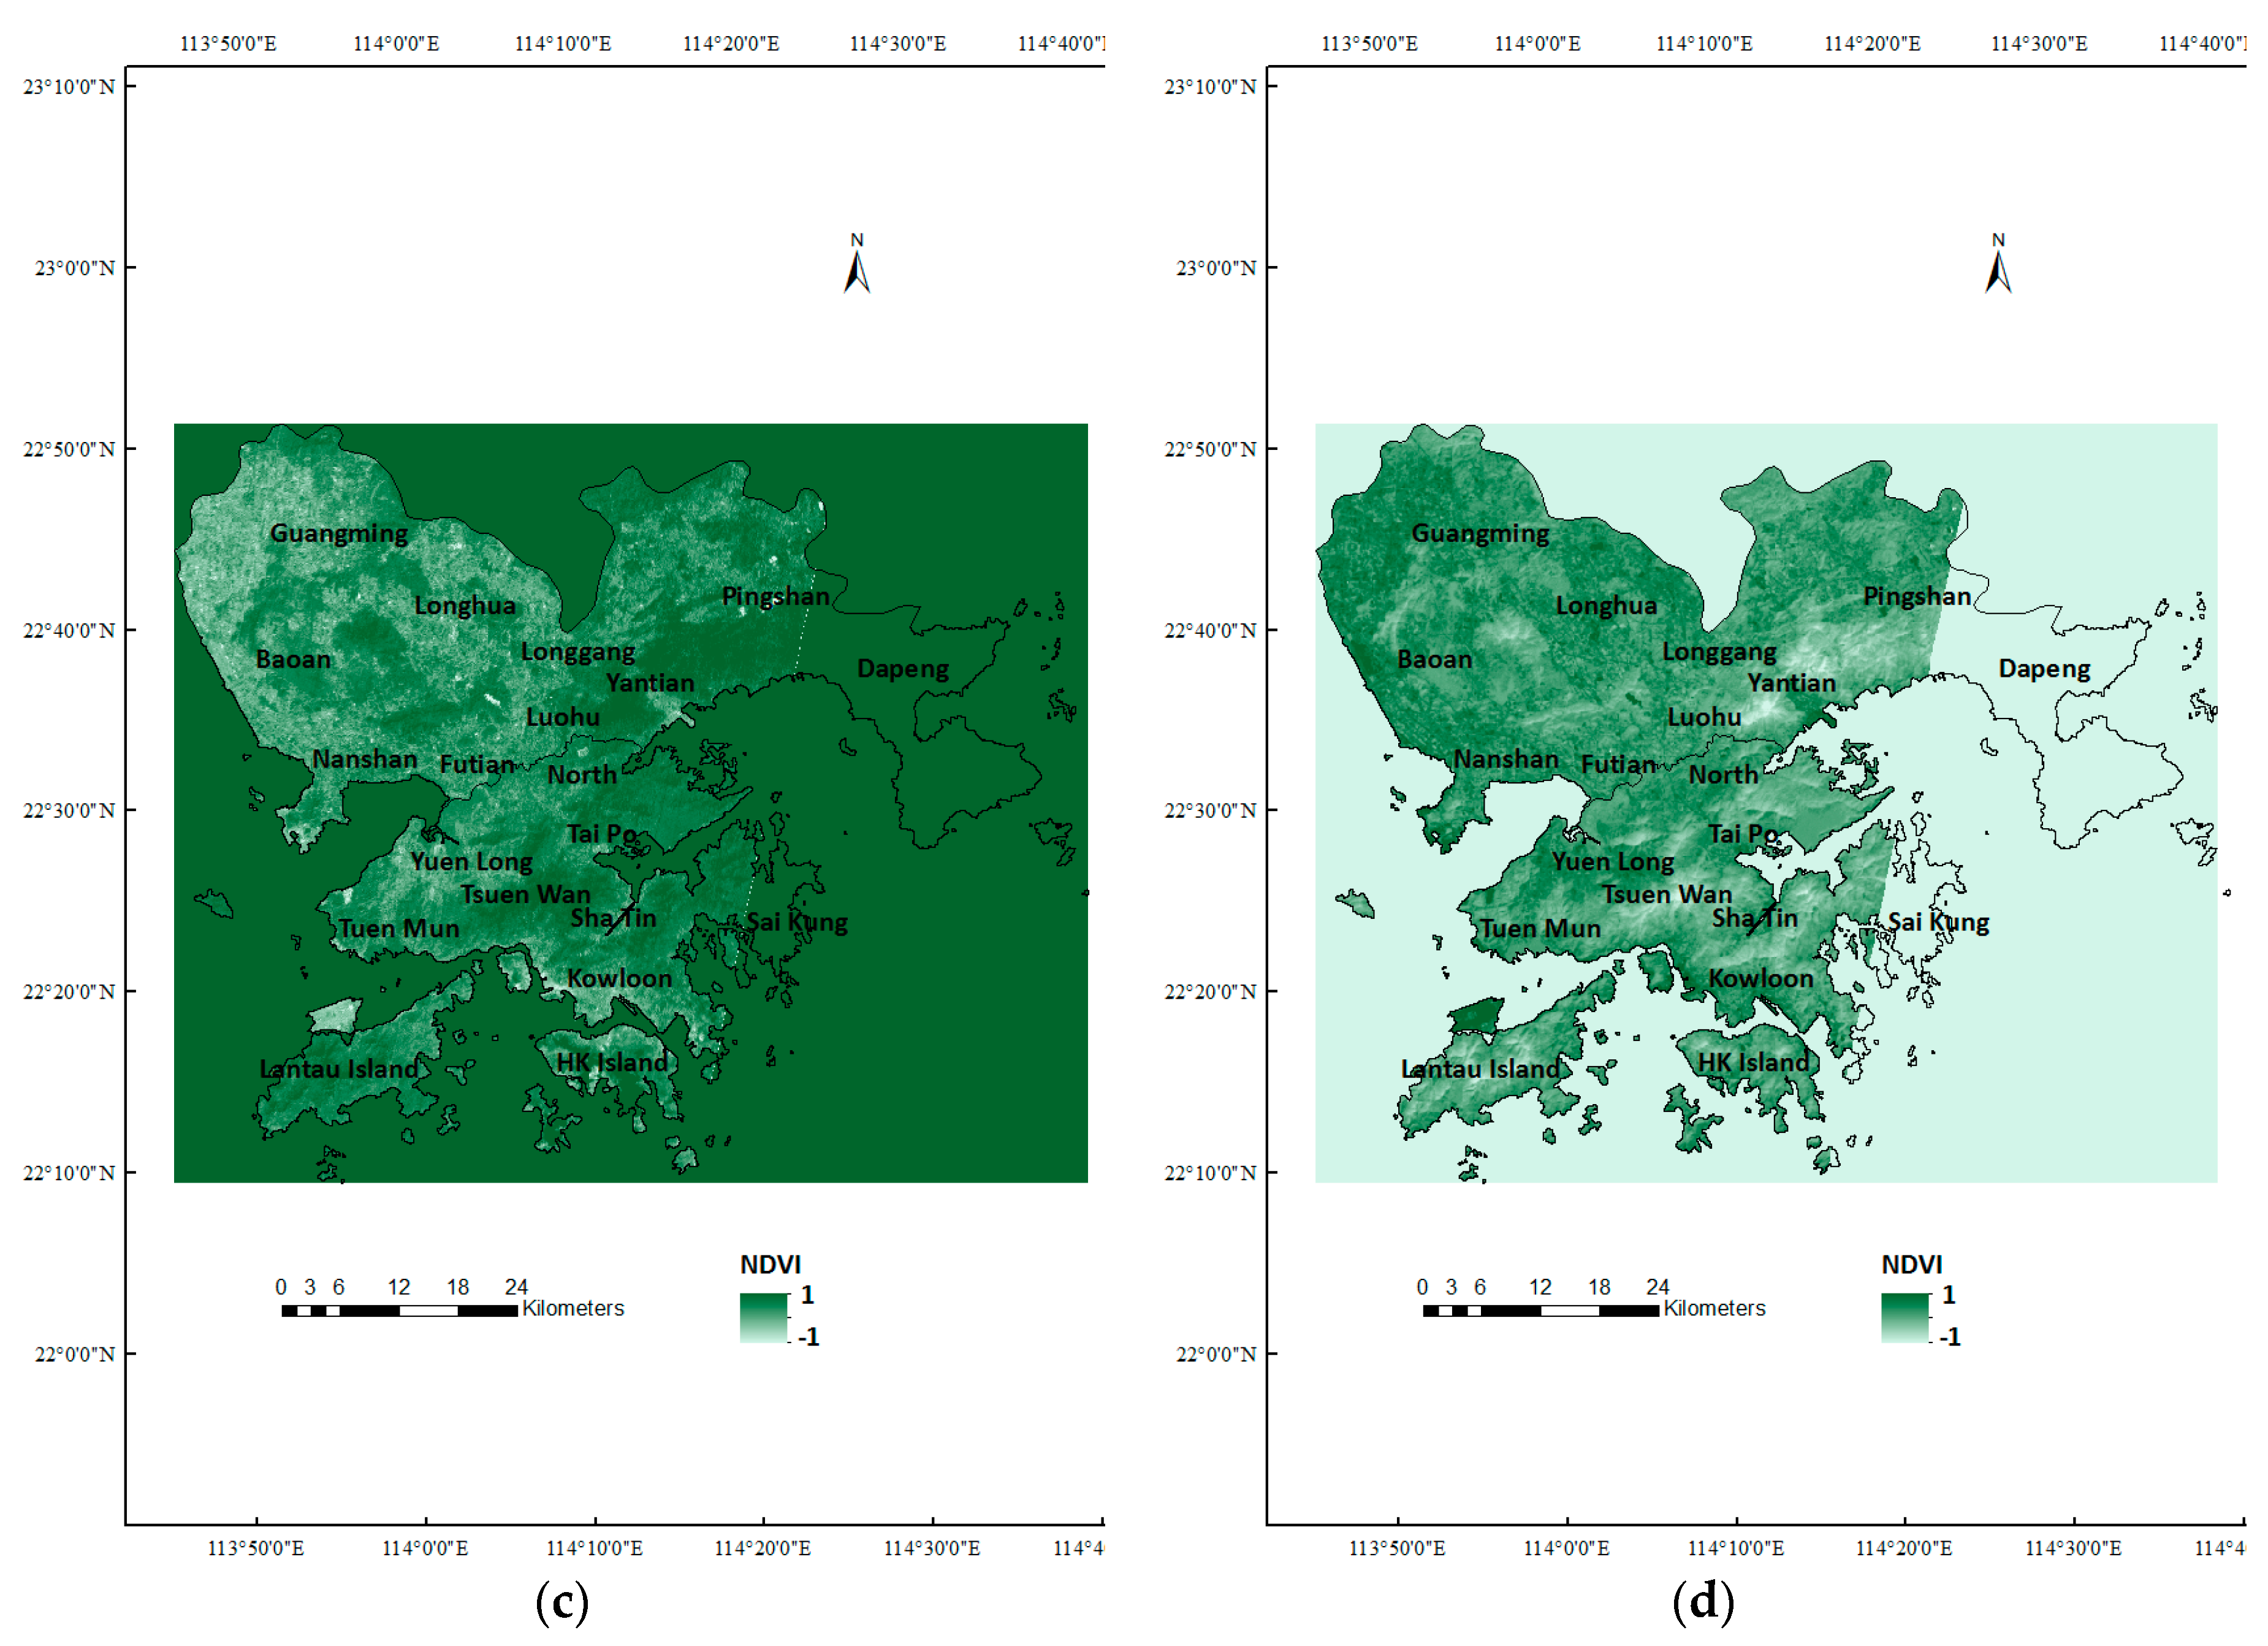
The difference vegetation index (DVI) is utilized to extrapolate the atmospheric particulate pollution and calculated as Equation (33) [
14]:
where
DVI is the difference vegetation index;
NIR is the near-infrared band; and
R is the red band.
For learning more about the relationship among the LST, NDVI, and DVI, the correlation coefficients with LST are presented in
Table 9. The correlation coefficients between the LST and NDVI are negative in 2014 and 2015, but positive in 2013 and 2016, that is to say, the LST and NDVI has no explicit relationship. Additionally, the correlation between the LST and DVI is slightly positive; in other words, the higher LST is slightly related to the higher atmospheric particulate concentration [
14].
The high NDVI is mainly located in Yantian, Tsuen Wan, and Lantau Island in 2013 and 2015, but mostly located in Guangming, Longhua, and Chulocock Island in 2014 and 2016; that is to say, the distribution of high NDVI is unfixed from 2013 to 2016 (
Figure 9). However, the high DVI is mainly located in Yantian, North, Tsuen Wan, and Lantau Island, in other words, the distribution of high DVI is relatively stationary from 2013 to 2016 (
Figure 10).
4.3. Urban Heat Island Assessment
The UHI intensity is estimated by the relative LST as Equation (34) (
Table 10) [
14]:
where
is the relative LST;
is the LST (K).
and
is the mean LST (K).
According to the calculation result, the relative LST in both Shenzhen and Hong Kong is lower than 0.1, which means the UHI intensity in Shenzhen and Hong Kong is weak, in other words, Shenzhen and Hong Kong are weak UHI regions. Compare
Figure 7 with
Figure 10, the UHI in Shenzhen and Hong Kong approximate to the high-LST zones. Furthermore, the proportion of UHI in Shenzhen and Hong Kong from 2013 to 2016 extracted from
Figure 10 with ENVI 5.1 is presented in
Table 11. The proportion of UHI is high in 2013 and 2016 when the correlation between LST and NDVI is positive, but low in 2014 and 2015 when the correlation between LST and NDVI is negative, that is to say, the growth condition rather than the distribution of vegetation may impact the distribution of UHI. The proportion of UHI in Shenzhen is always higher than that in Hong Kong from 2013 to 2016, in other words, the UHI-affected area in Shenzhen is larger than that in Hong Kong.
5. Discussion
In terms of LST estimation, Liu and Zhang estimated the LST in Hong Kong via the MWA using Landsat TM and ASTER data and found that the LST retrieval using Landsat TM data, whose overall accuracy was 0.7 °C, was more accurate [
17]. Xie et al. converted the LST in Shenzhen, China by the SCM using Landsat 5 TM data [
22]. Wong et al. derived the LST in Hong Kong using the Chinese small satellite HJ-1B data [
41]. In this paper, four methods, namely, the MWA, SCM, SWA-Q, and SWA-S, and newer satellite data, namely, Landsat 8 data, are adopted to derive the LST in Shenzhen and Hong Kong. The LST retrieval using the SWA-Q on 7 February 2016 is the most precise LST retrieval in this paper whose RMSE and MBE are, respectively, 2.30 °C and 0.88 °C, and whose accuracy is close to Liu and Zhang’s study [
17]. Additionally, the LST’s data of the 28 weather stations are extracted to compare with the observed air temperature, and then compared the accuracy of the four methods mentioned above. In addition, Liu and Zhang discovered that the correlation coefficient between LST and NDVI was weakly negative [
17] and Xie et al. indicated that the LST had negative correlation with the vegetation fraction and positive correlation with the impervious surface area [
22]; however, in this paper, the LST and NDVI had no noticeable relationship. Furthermore, the higher LST is correlated to the higher atmospheric particulate concentration in Shenzhen and Hong Kong.
In terms of the UHI assessment, Memon et al. and Siu et al., respectively, utilized the meteorology data from the Hong Kong Observatory to judge the UHI intensity in Hong Kong which just exerted the dotted data rather than the surface data to evaluate the UHI intensity [
38,
42,
43]. Liu et al., Xie et al., and Wong et al., respectively, estimated the UHI intensity in Shenzhen or Hong Kong using satellite data just like this paper [
17,
22,
41]. However, the assessments of UHI intensity have noticeable differences. Liu and Zhang evaluated that most areas in Hong Kong were the strongest UHI areas [
17]; on the contrary, in this study, the UHI intensity is weak in both Shenzhen and Hong Kong. Furthermore, few studies compared the UHI conditions between Shenzhen and Hong Kong. In this study, the growth condition of vegetation may impact the distribution of UHI, and the UHI-affected area in Shenzhen is larger than that in Hong Kong from 2013 to 2016. Additionally, the deficiency of this study is that the satellite images cannot cover the whole study area and the areas without data are mainly located in Dapeng District, Shenzhen, and Tai Po and Sai Kung, Hong Kong.
6. Conclusions
Under the background of global warming and urbanization, the study of UHI attracts widespread attention today, and with the rapid development of satellite technology, satellite images, which can acquire surface data rather than dotted data, compared with the traditional method, like meteorology data utilization, have become more and more popular recently. In this paper, the LST of Shenzhen and Hong Kong is retrieved by four methods, namely the MWA, SCM, SWA-Q, and SWA-S, using the Landsat 8 data from 29 November 2013, 16 November 2014, 18 October 2015, and 7 February 2016. Then, after the accuracy analysis, the SWA-Q is estimated as the most accurate method among the four methods mentioned above and, therefore, the LST retrievals by SWA-Q are applied to analyze the LST distribution and UHI intensity in Shenzhen and Hong Kong from 2013 to 2016. From 2013 to 2016, the high-LST zones or UHIs in Shenzhen and Hong Kong are substantially identical, mainly in Longhua, Baoan, and Guangming of Shenzhen, and in Yuen Long, the west coast of Hong Kong, and Chulocock Island, Hong Kong. Additionally, the high-LST zones are relatively dispersive in 2013 and 2014, but relatively concentrative in 2015 and 2016. Although the LST has not obviously correlated with the vegetation distribution, the growth condition of vegetation may impact the distribution of UHI, and the high LST is slightly correlated to the high atmospheric particulate concentration. Furthermore, in general, Shenzhen and Hong Kong are weak UHI regions and the UHI-affected area in Shenzhen is larger than that in Hong Kong from 2013 to 2016.


