Article

Changes in Anthropometric Characteristics and Isokinetic Muscle Strength in Elite Team Sport Players during an Annual Training Cycle

by
Evangelia Papaevangelou
1,
Zacharoula Papadopoulou
1,2,3,
Athanasios Mandroukas
1,
Yiannis Michaildis
1,
Pantelis T. Nikolaidis
4,*,
Nikos V. Margaritelis
3 and
Thomas I. Metaxas
1
1
Laboratory of Evaluation of Human Biological Performance, Department of Physical Education and Sports Science, Aristotle University of Thessaloniki, 57001 Thessaloniki, Greece
2
School of Physical Education and Sports Science, Department of Competitive Sports, Division of Team Handball, Aristotle University of Thessaloniki, 57001 Thessaloniki, Greece
3
Laboratory of Exercise Physiology & Biochemistry, Department of Physical Education and Sports Science at Serres, Aristotle University of Thessaloniki, 62122 Serres, Greece
4
School of Health and Caring Sciences, University of West Attica, 12243 Athens, Greece
*
Author to whom correspondence should be addressed.
Submission received: 6 September 2023 / Revised: 8 November 2023 / Accepted: 20 November 2023 / Published: 23 November 2023
(This article belongs to the Section Sports Science and Medicine)

Abstract

:
The aim of the present research was to investigate the variation in the anthropometric characteristics and the isokinetic muscle strength of elite female team sport players during a season (29–36 weeks). Three groups of female athletes that consisted of soccer (n = 19; age, 23.2 ± 4.3 years), basketball (n = 26, 21.1 ± 5.4 years) and handball players (n = 26, 21.1 ± 4.2 years) underwent anthropometric and isokinetic measurements at the beginning of the preparation period, in the middle and at the end of the competitive season. Isokinetic peak torque values of the hamstrings (H) and quadriceps (Q), as well as the conventional strength ratios of H:Q, were tested on an isokinetic dynamometer at angular velocities of 60, 180 and 300°·s−1. Body weight, lean body mass and body fat of all groups decreased from the first to the third testing session (p < 0.05). Isokinetic peak torque gradually increased during the three measurements (p < 0.05). The soccer players had lower body weight and body fat compared to the basketball and handball players (p < 0.05). Isokinetic peak torque in knee flexion did not show any difference between the sports at any angular velocity or knee movement (flexion and extension), with an exception of the 180°·s−1. The improvement observed for all athletes can be attributed to the training programs that collectively characterize these team sports.

1. Introduction

The participation and systematic involvement of women in team sports such as soccer, basketball and handball has increased in recent years. These sports include intermittent exercise with alternating intensity, and the contribution of both aerobic and anaerobic energy transfer systems [1]. The physiological demands and the energy transfer systems in female athletes are similar to those of men, showing high levels of muscle strength and muscle endurance [2], sprinting performance, repeated sprint ability and coordination [3]. However, the adaptations from the training depend on various factors, such as the intensity, the volume and the duration of the exercise, as well as the initial levels of fitness of each athlete [4].
Increasing maximal muscle strength can be related to a development in relative strength and consequently an improvement in muscle strength-related abilities [5]. During soccer, basketball and handball games, athletes demonstrate skills based mainly on the muscles’ ability to produce power. Thus, increasing the available force of muscle contraction in muscle groups such as the hamstrings (Hs) and quadriceps (Qs) improves acceleration and speed in important skills, e.g., jumping, change of direction (in basketball, these movements occur on average every 2 s), tackling (for soccer), as well as rotational movements [6,7,8].
The H and Q muscles play a key role in the stabilization of the knee joint. Consequently, a lack of adequate support from these muscles surrounding the knee results in excessive strain/loading of the joint, as well as delayed activation of the H muscles in dynamic movements [9]. The strength ratio of the maximal isokinetic muscle strength between the H and Q muscles (H:Q ratio) is a parameter that is widely used to describe the capabilities of muscular strength for the knee joint [10,11]. As muscle mass increases, so do the muscle strength and power, the neuromuscular performance, and the adaptations from strength training. These adaptations include the synchronization of the contracted motor units and the improvement in their recruitment capacity [12]. Differences in H:Q ratios between male and female athletes may be due to the training level, and possibly to the anatomical and physiological differences between the sexes [13]. Research has shown that body fat increases after the end of the season and during the transition period, while it gradually decreases from the beginning of the preparation period and during the training season [14]. Previous research on elite female soccer players has shown that the percentage of body fat decreases during the annual training cycle and especially at the end of the training season [15,16,17], noting that the physical composition within normal levels helps athletes’ performance and aerobic capacity improves, as excess body mass in the form of subcutaneous fat is a disadvantage and leads to faster fatigue [18]. The determination of physical abilities is important to perform (a) at the beginning of the annual training cycle, because the preparation period is crucial for improving the performance of athletes, (b) during the season, and (c) at the end of the season.
The aim of the present research was to investigate the changes in anthropometric characteristics and isokinetic muscle strength of elite female soccer, basketball and handball players during a season. Moreover, a secondary goal was to compare the isokinetic muscle strength of knee extensors and flexors in three different angular velocities between these different sports.

2. Materials and Methods
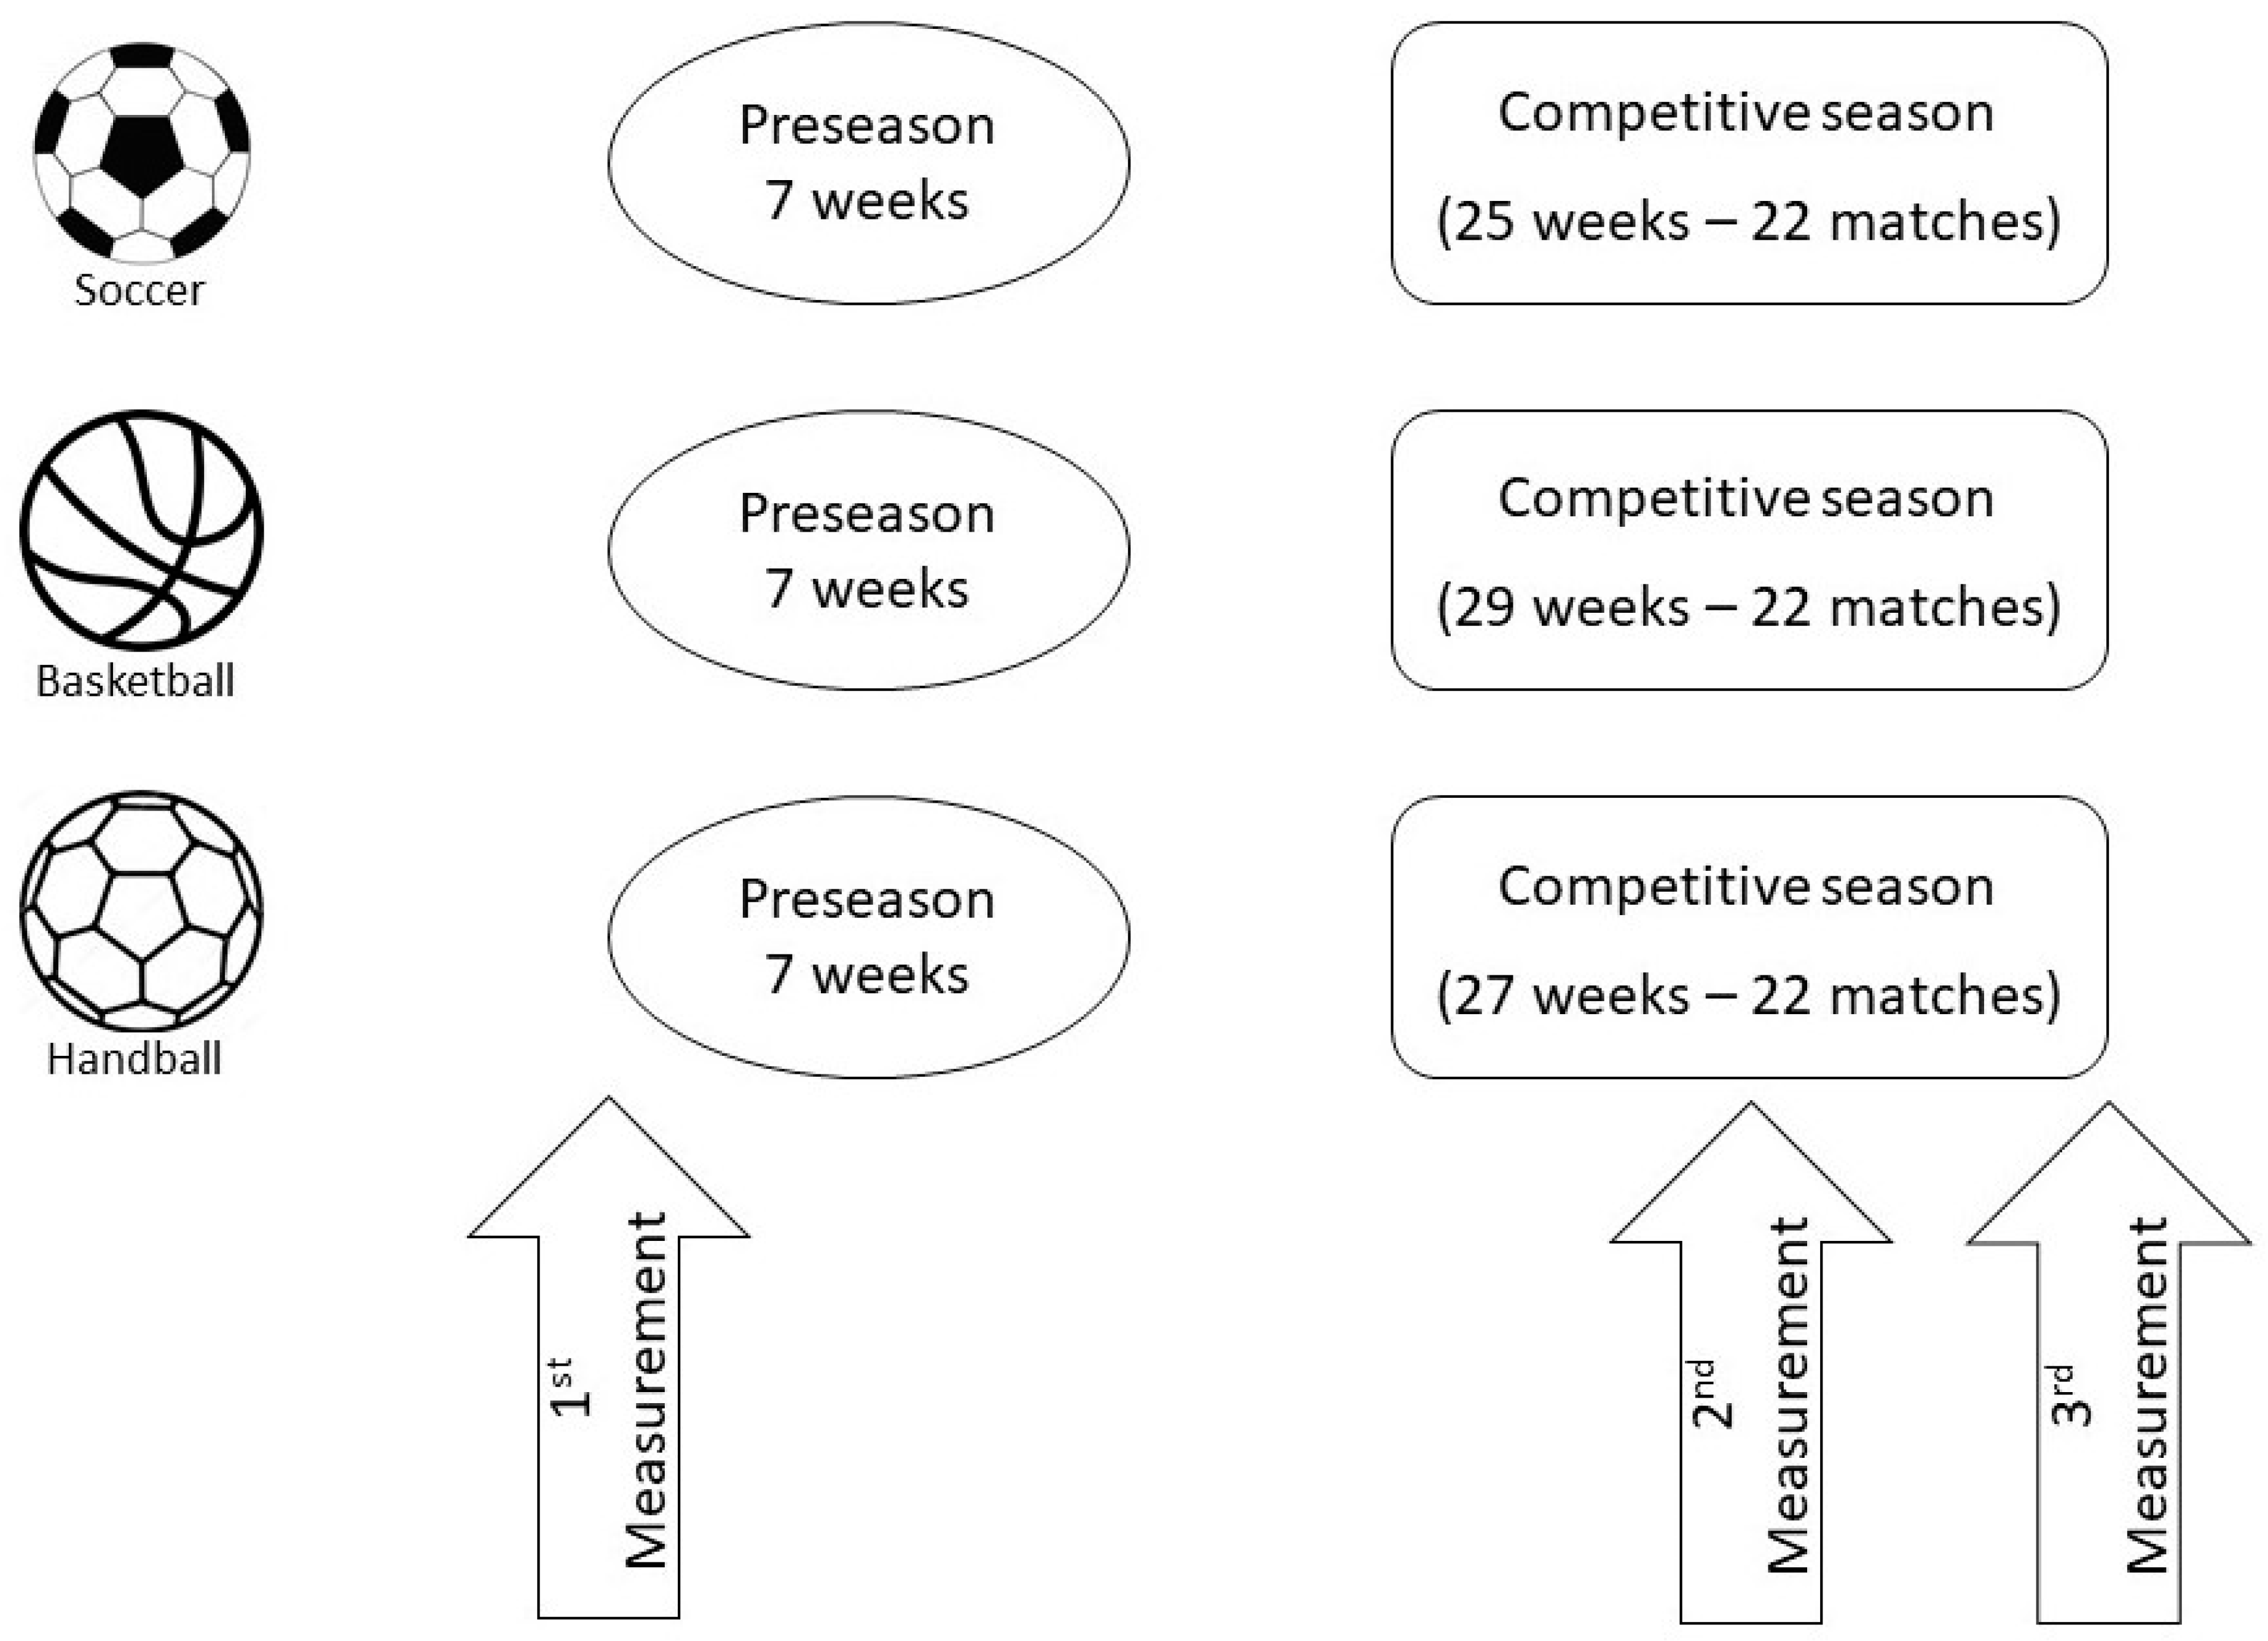
2.1. Study Design

Prior to initiation of the research, all participants gave written consent and received comprehensive information about the experiment’s procedures. The research was performed following the local University Ethics Committee Guidelines and in accordance with the Declaration of Helsinki.
All participants answered a questionnaire about their recent medical history. Anthropometric and isokinetic muscle strength tests were conducted three times during a season. The first testing session was performed at the start of the preparation period, the second one in the middle of the competitive period and the third one at the end of the season. Both anthropometric and muscle strength tests were conducted during a single visit to the laboratory. Participants were encouraged to avoid intense exercise for three days before each testing procedure and not to receive any kind of medication or supplement. The research design is shown in Figure 1.

2.2. Participants

All athletes participated in the First Division of their sport. The First Division in Greece is the highest level of competition for each sport. The inclusion criteria encompassed a minimum of three years of training experience, a training frequency of at least five sessions per week, and regular participation in one game per week throughout the season. Based on these criteria, the study included 71 elite female team sport players: soccer players (n = 19; age, 23.2 ± 4.3 years; sport experience, 8.2 ± 3.6 years; mean ± standard deviation), basketball players (n = 26; age, 21.1 ± 5.4 years; sport experience, 9.0 ± 4.7 years) and handball players (n = 26; age, 21.1 ± 4.2 years; sport experience, 10.9 ± 4.7 years). The anthropometric characteristics can be seen in Table 1.

2.3. Anthropometric Measurements

The assessment of the anthropometric characteristics was based on previous research [19] and performed using an electronic digital scale (Seca 220e, Hamburg, Germany). The body fat was estimated using skinfold measurements (four anatomical sites)—biceps (S1), triceps (S2), suprailiac (S3) and subscapular (S4)—using a skinfold caliper (DrLange, SantaCruz, CA, USA). An evaluation of the body density was performed based on validated equations for female humans older than 16 years [20], and the percentage of body fat was evaluated by the equation of Siri [21]. Finally, the lean body mass (LBM) was derived from body weight and body fat measurements.

2.4. Isokinetic Muscle Strength Testing

The muscle strength of knee muscle groups (flexors and extensors) was tested in the dominant lower limb using an isokinetic dynamometer (CSMI, Humac Norm, Cybex II). Before each testing session, participants completed a standardized warm-up on a Monark 839 cycle ergometer (Varberg, Sweden) for five minutes at a slow velocity (60 rev/min) against low braking force. Following this warm-up, participants engaged in a 5-minute partial passive stretching routine for the knee flexors and extensors, following the protocol outlined by Mandroukas et al. [22] Subsequently, the unilateral concentric muscle strength of the dominant lower limb was measured using the isokinetic dynamometer. The evaluation of strength performance was based on the absolute peak torque (APT), defined as the highest score obtained from all trials, considering various movement types and velocities.

Testing Protocol

At each specific angular velocity, the peak isokinetic torque was simultaneously monitored, and the torque produced by the lower limb body mass and the equipment arm was extracted from the collected data. The participant was then seated on an adjustable chair attached to the dynamometer. To minimize extraneous joint movement, the upper body was secured with diagonal straps across the chest, hips, and thighs. The knee being tested was set at a 90° flexion angle (with 0° representing a fully extended knee), aligning the equipment’s lever arm axis with the distal point of the lateral condyle of the femur bone. The length of the lever arm was individually set, and the resistance pad was positioned 5 cm proximal to the malleoli. The untested leg hung freely. Knee extension testing began with the knee at 90° of flexion, while knee flexion testing started from full extension (0°). Before maximal testing, a series of submaximal concentric contractions were performed. Participants were instructed to cross their arms over their chest and to kick the leg as hard and as fast as they could through a complete range of motion (ROM). Three trials were conducted at each angular velocity and the best peak torque (PT) value among the trials. A 30-second rest interval separated each trial, and a 60-second rest period separated measurements at different velocities. Participants were asked to perform maximal voluntary contractions, and verbal encouragement was provided simultaneously. Maximal isokinetic strength was recorded as the torque of the H and Q muscles throughout the whole ROM at angular velocities of 60, 180 and 300°·s−1 [23]. The H:Q ratio was expressed as the ratio between the peak values at each velocity. The conventional H:Q ratio was determined by dividing the participant’s highest concentric PT in leg flexion by the highest concentric PT in leg extension.

2.5. Statistics

Data are presented as means ± SD. The Kolmogorov–Smirnov test was used to test for normality and Levene’s test was used to assess the equality of variances. A 3 × 3 two-way analysis of variance (ANOVA) with repeated measures test (group (soccer, basketball and handball) × time (preseason preparation, mid-season, end of season)) was used to examine the main effect of the sport and annual training cycle, as well as their interaction, on the dependent variables. When a significant main effect or interaction was found, pairwise comparisons were performed with the Šidák test. When sphericity was violated, the Greenhouse–Geisser correction was applied. The magnitude of differences was evaluated using partial eta squared (ηp2), and was interpreted as trivial (ηp2 < 0.01), small (0.01 ≤ ηp2 < 0.06), moderate (0.06 ≤ ηp2 < 0.14) or large (ηp2 ≥ 0.14). The statistical analysis was performed on SPSS v.29.0 (IBM, Armonk, NY, USA) and GraphPad Prism v.7.0 (GraphPad Software, San Diego, CA, USA). The level of statistical significance was set at p < 0.05.

3. Results

3.1. Physical and Anthropometric Characteristics

A moderate-to-large main effect of time on body weight (p < 0.001, ηp2 = 0.925), lean mass (p < 0.001, ηp2 = 0.388), percentage of body fat (p < 0.001, ηp2 = 0.584) and HRrest (p < 0.001, ηp2 = 0.136) was observed, where an overall decrease in these scores was shown during the training season. The soccer players showed a decrease in their body weight throughout the training season (p < 0.001). The lean body mass was lower at the third measurement than the first measurement (p < 0.001), and the percentage of body fat was lower at the end of the training season compared to the first and second measurements (p < 0.001 and p < 0.01 respectively). In the basketball players, the body weight and the percentage of body fat decreased during the season (p < 0.001). The lean body mass was lower at the third measurement compared to the first and the second measurements (p < 0.001 respectively). Also, a decrease was observed in the HRrest at the second measurement compared to the first (p < 0.001) and the third measurements (p < 0.01). Similarly, in the handball players, a decrease was observed in body weight and body fat percentage from the first to the third measurement (p < 0.001). The lean body mass and the HRrest were lower at the second measurement compared to the first measurement (p < 0.01); however, there were no differences in lean body mass between the second and the third measurements or in the HRrest between the first and the second measurements (Table 1).
Between sports, differences were observed in all measurements regarding the height, weight and lean body mass. More specifically, the basketball players showed greater values in height and weight compared to the handball players (p < 0.001 and p < 0.01 respectively) and soccer players (p < 0.001); however, no differences were observed between soccer and handball players. Likewise, the basketball players presented greater lean body mass compared to the soccer and handball players (p < 0.01 and p < 0.001, respectively). The percentage of body fat was lower for all measurements for the soccer players compared to the basketball and handball players (p < 0.001). No differences were observed in the HRrest between the sports (Table 2).

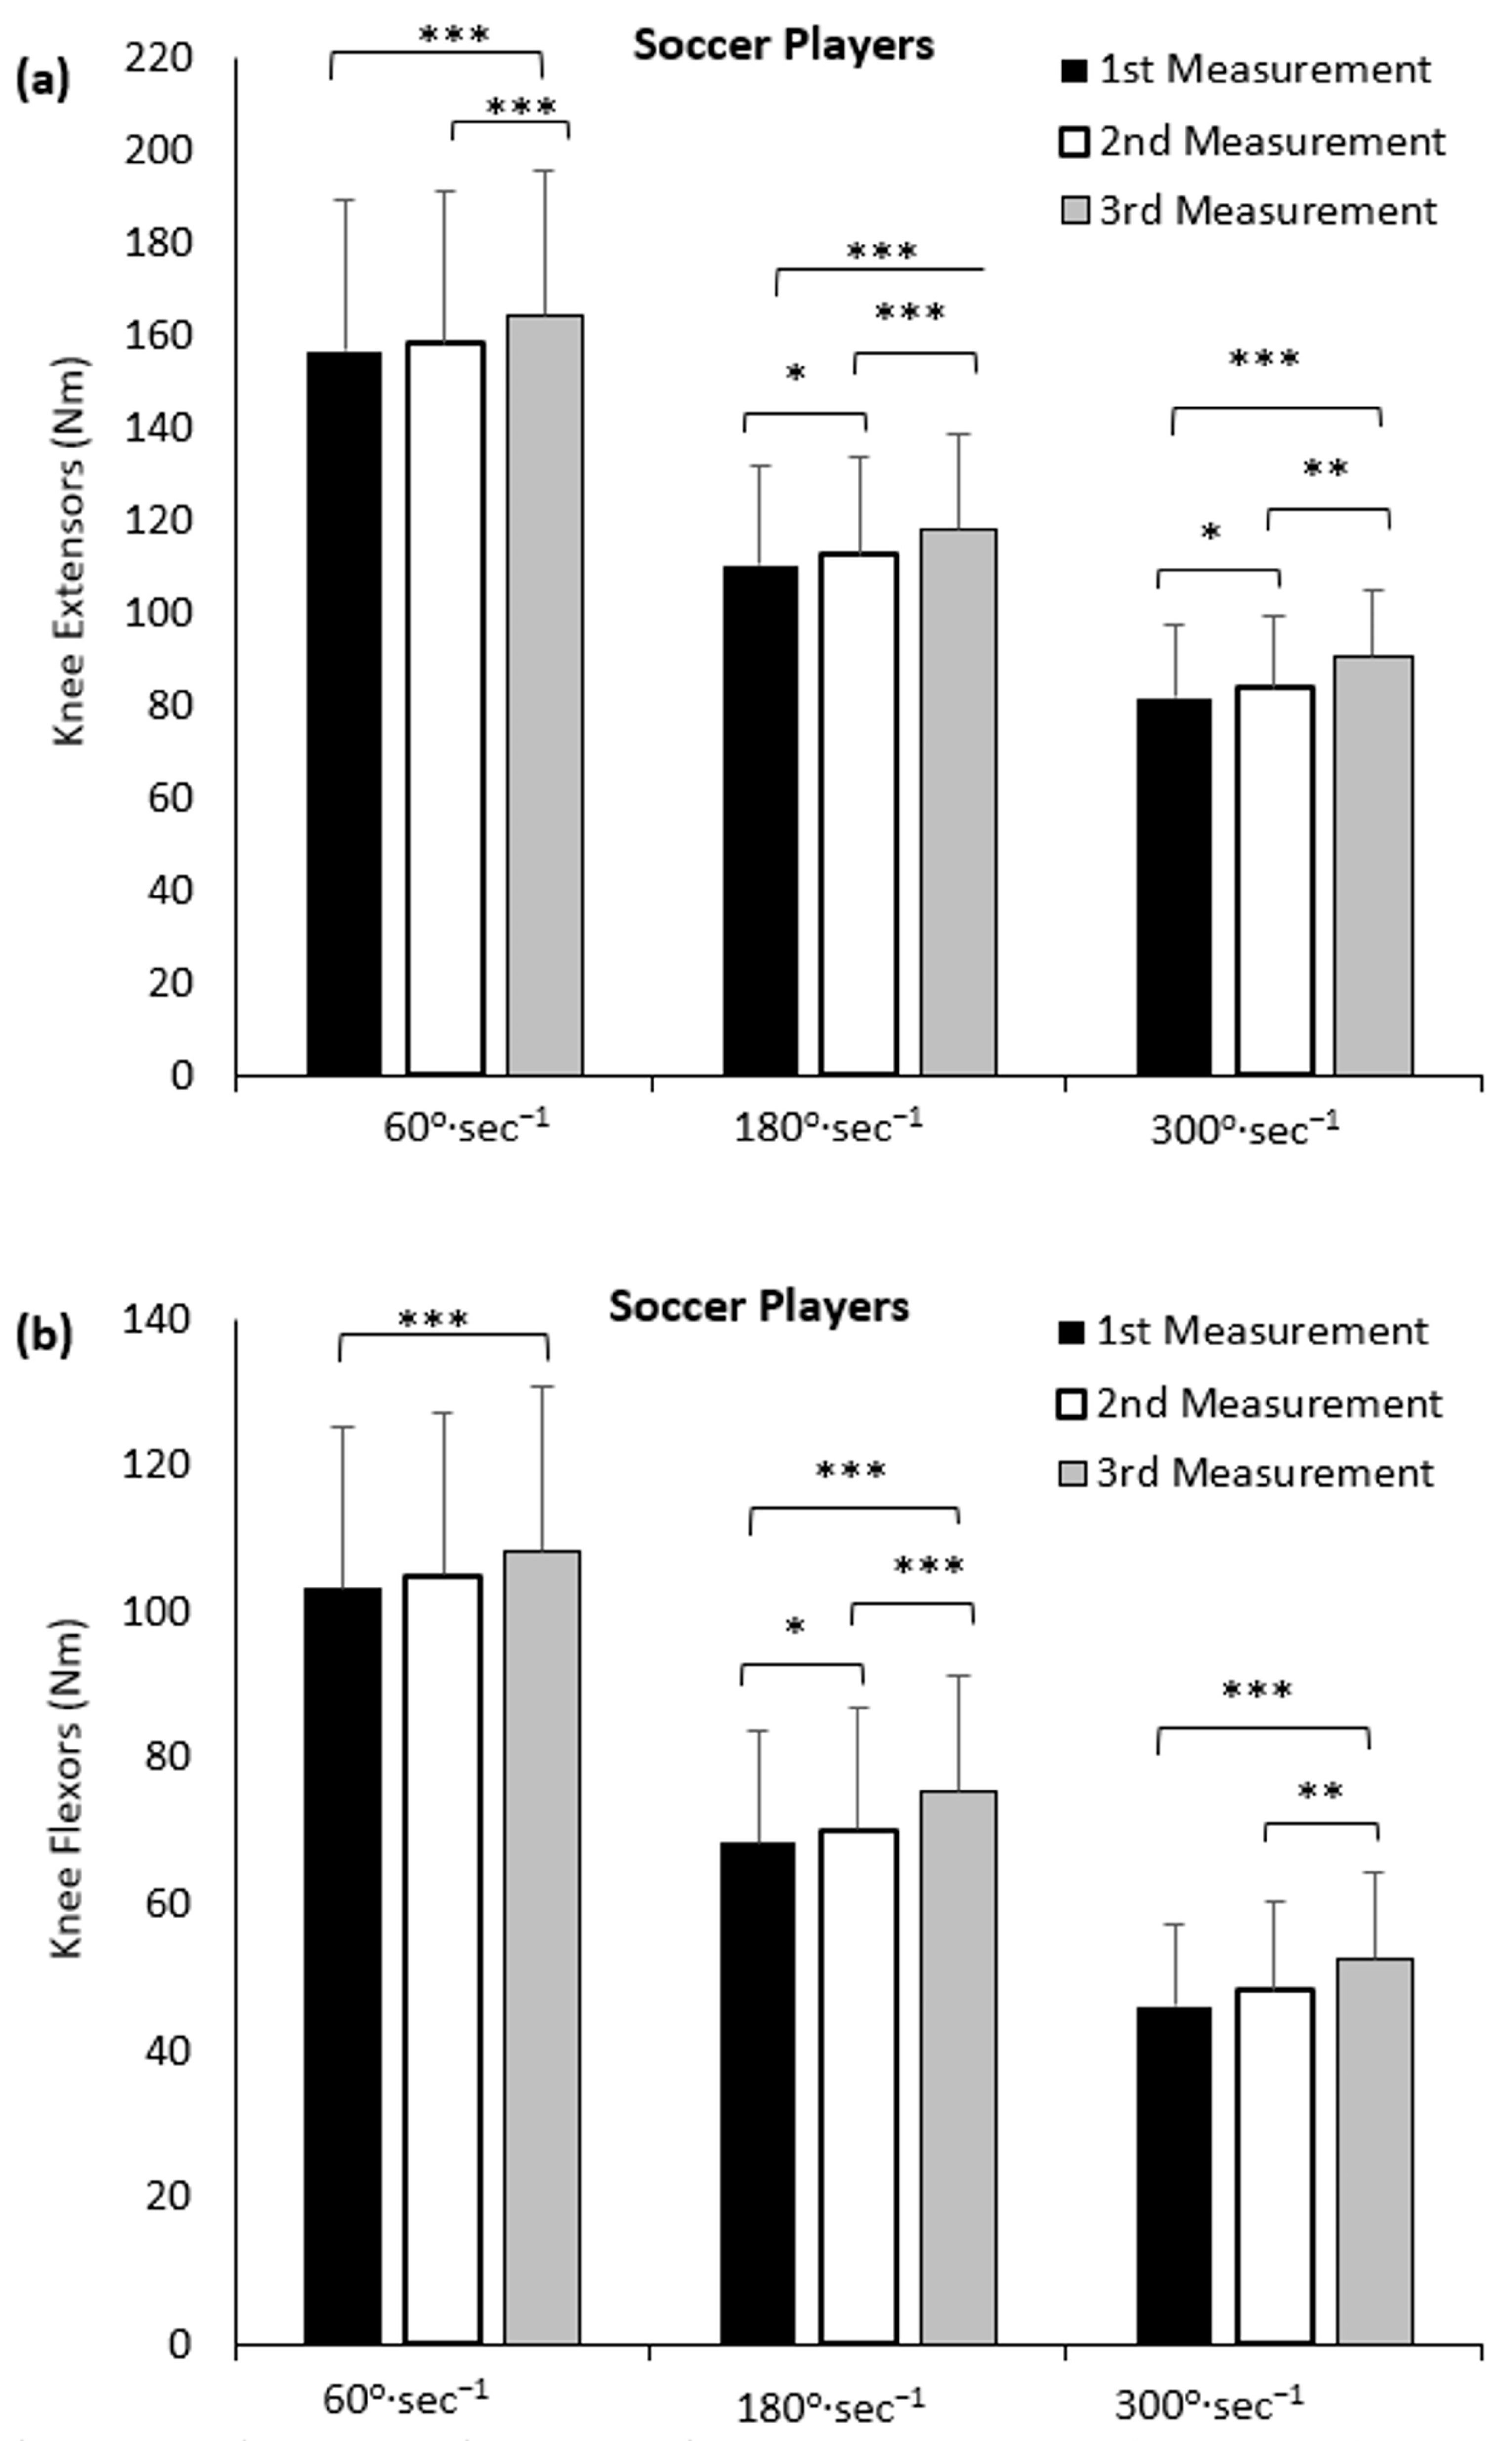
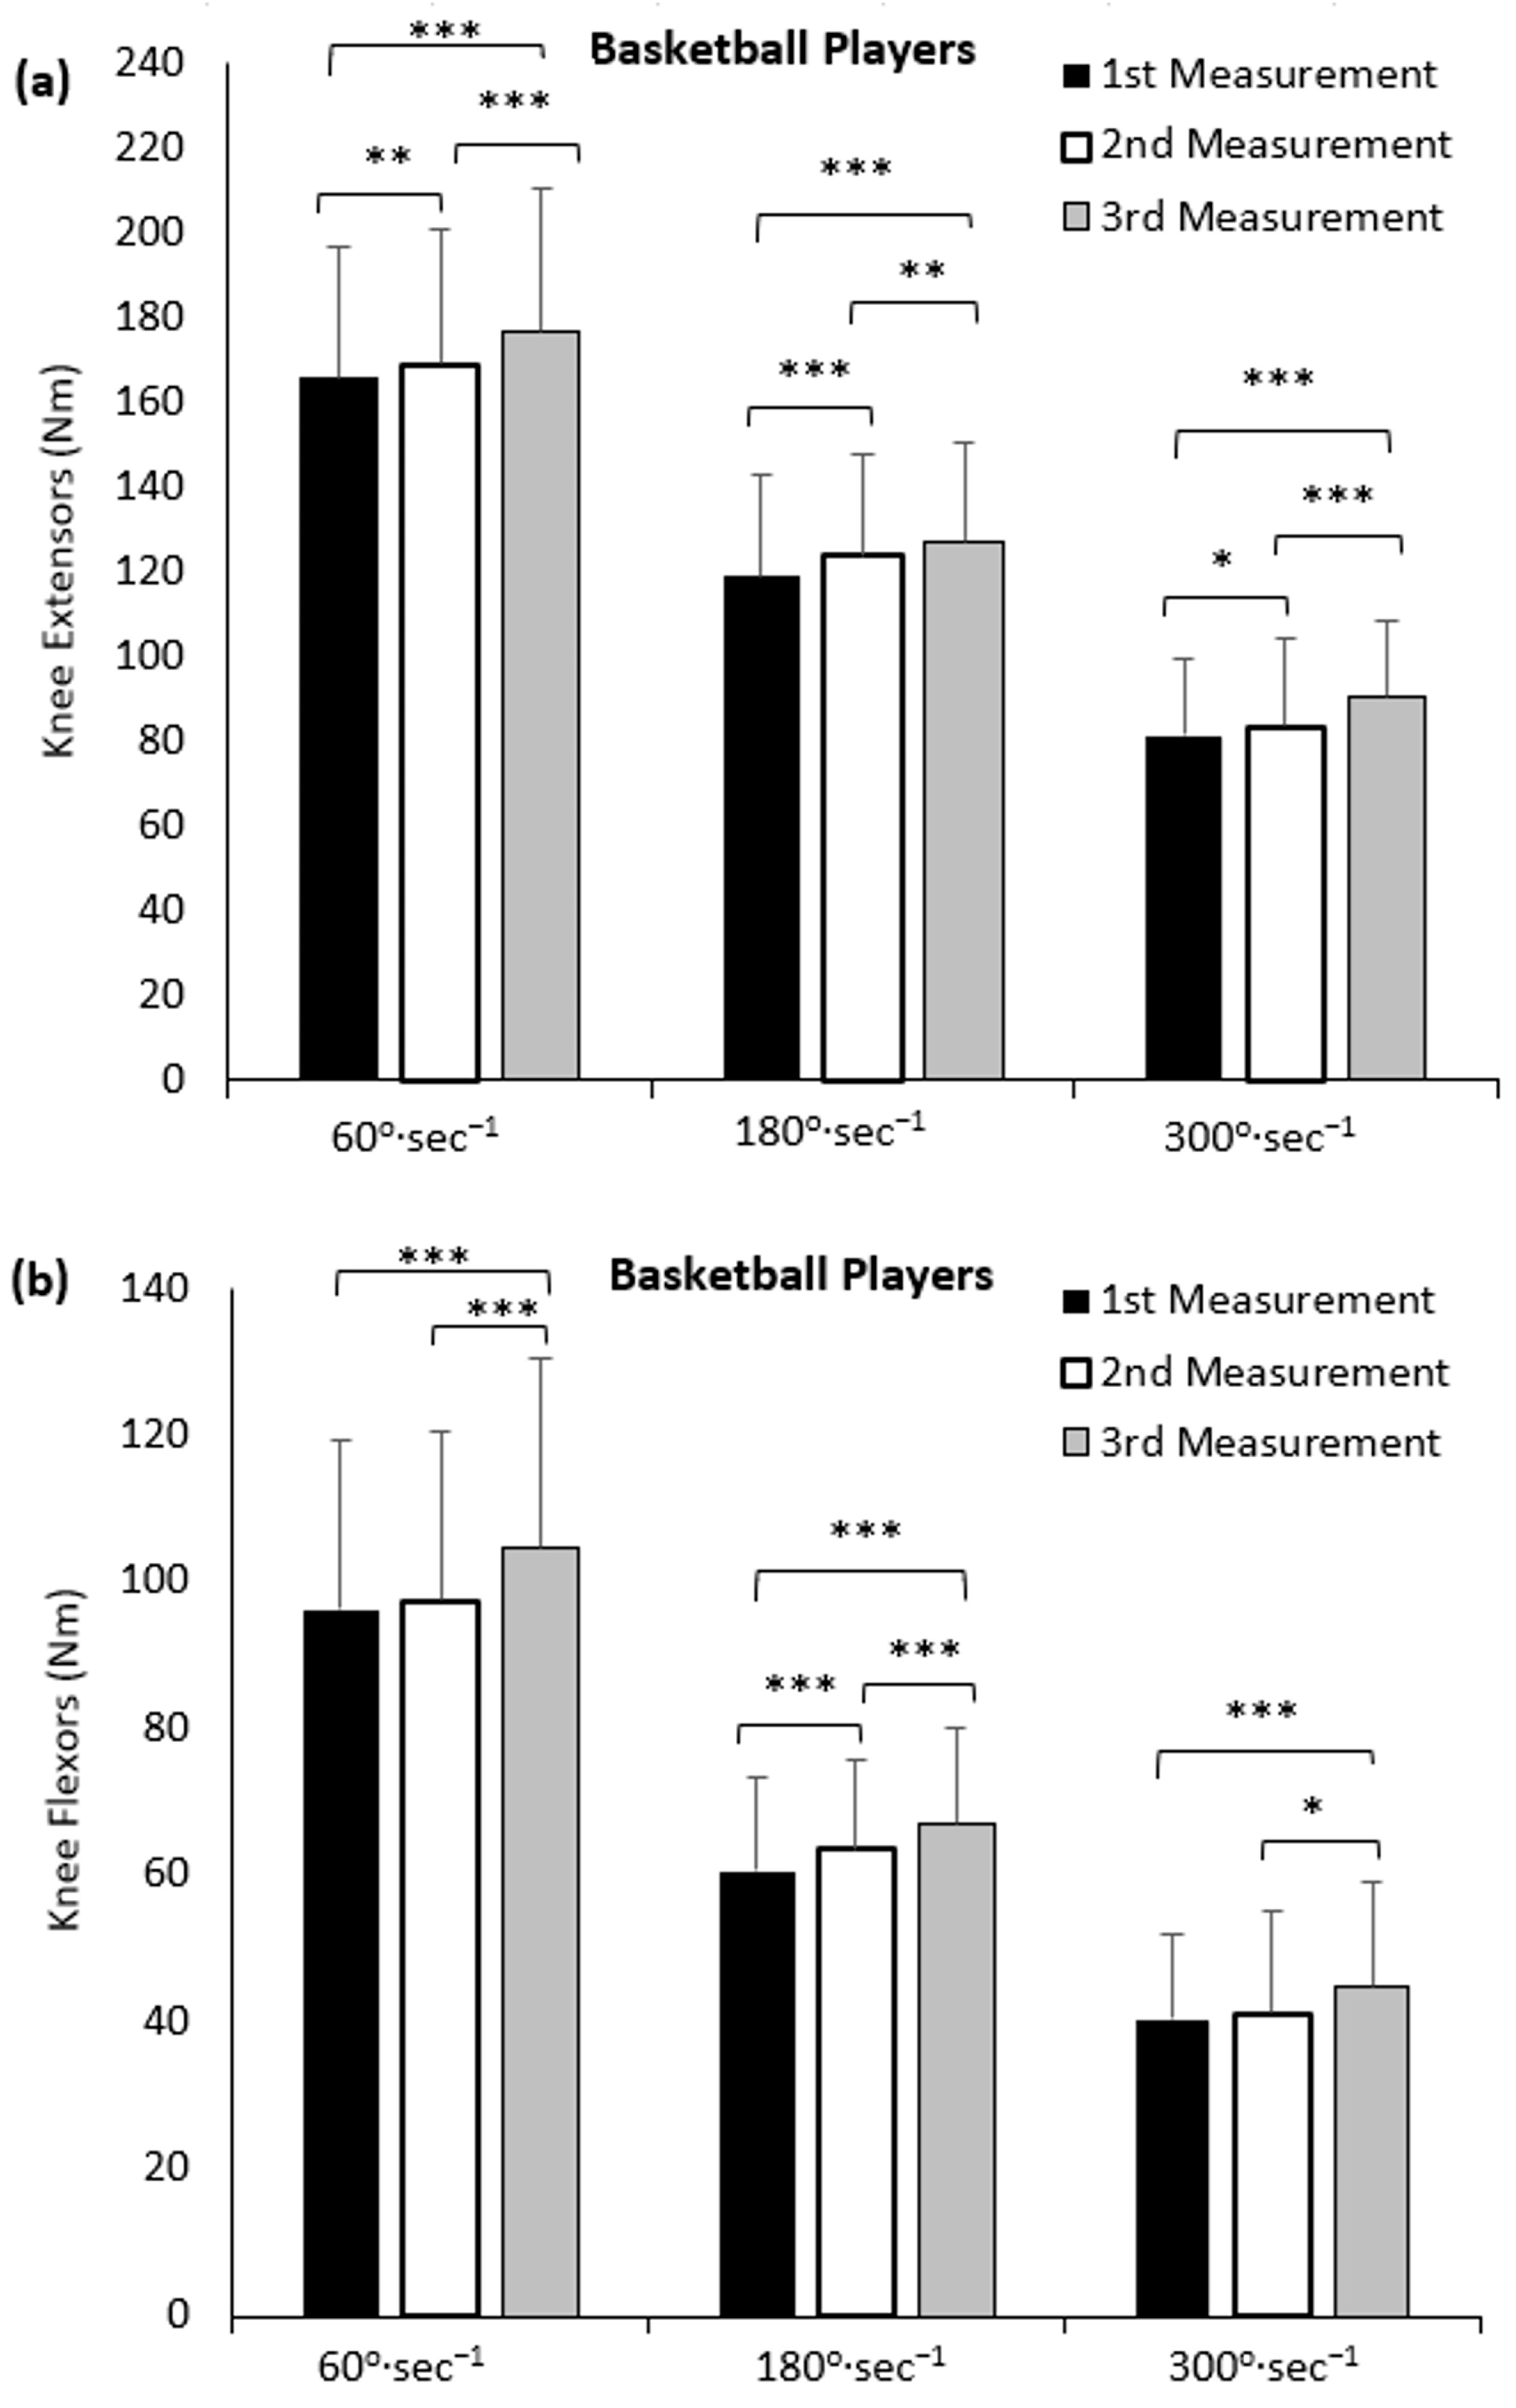
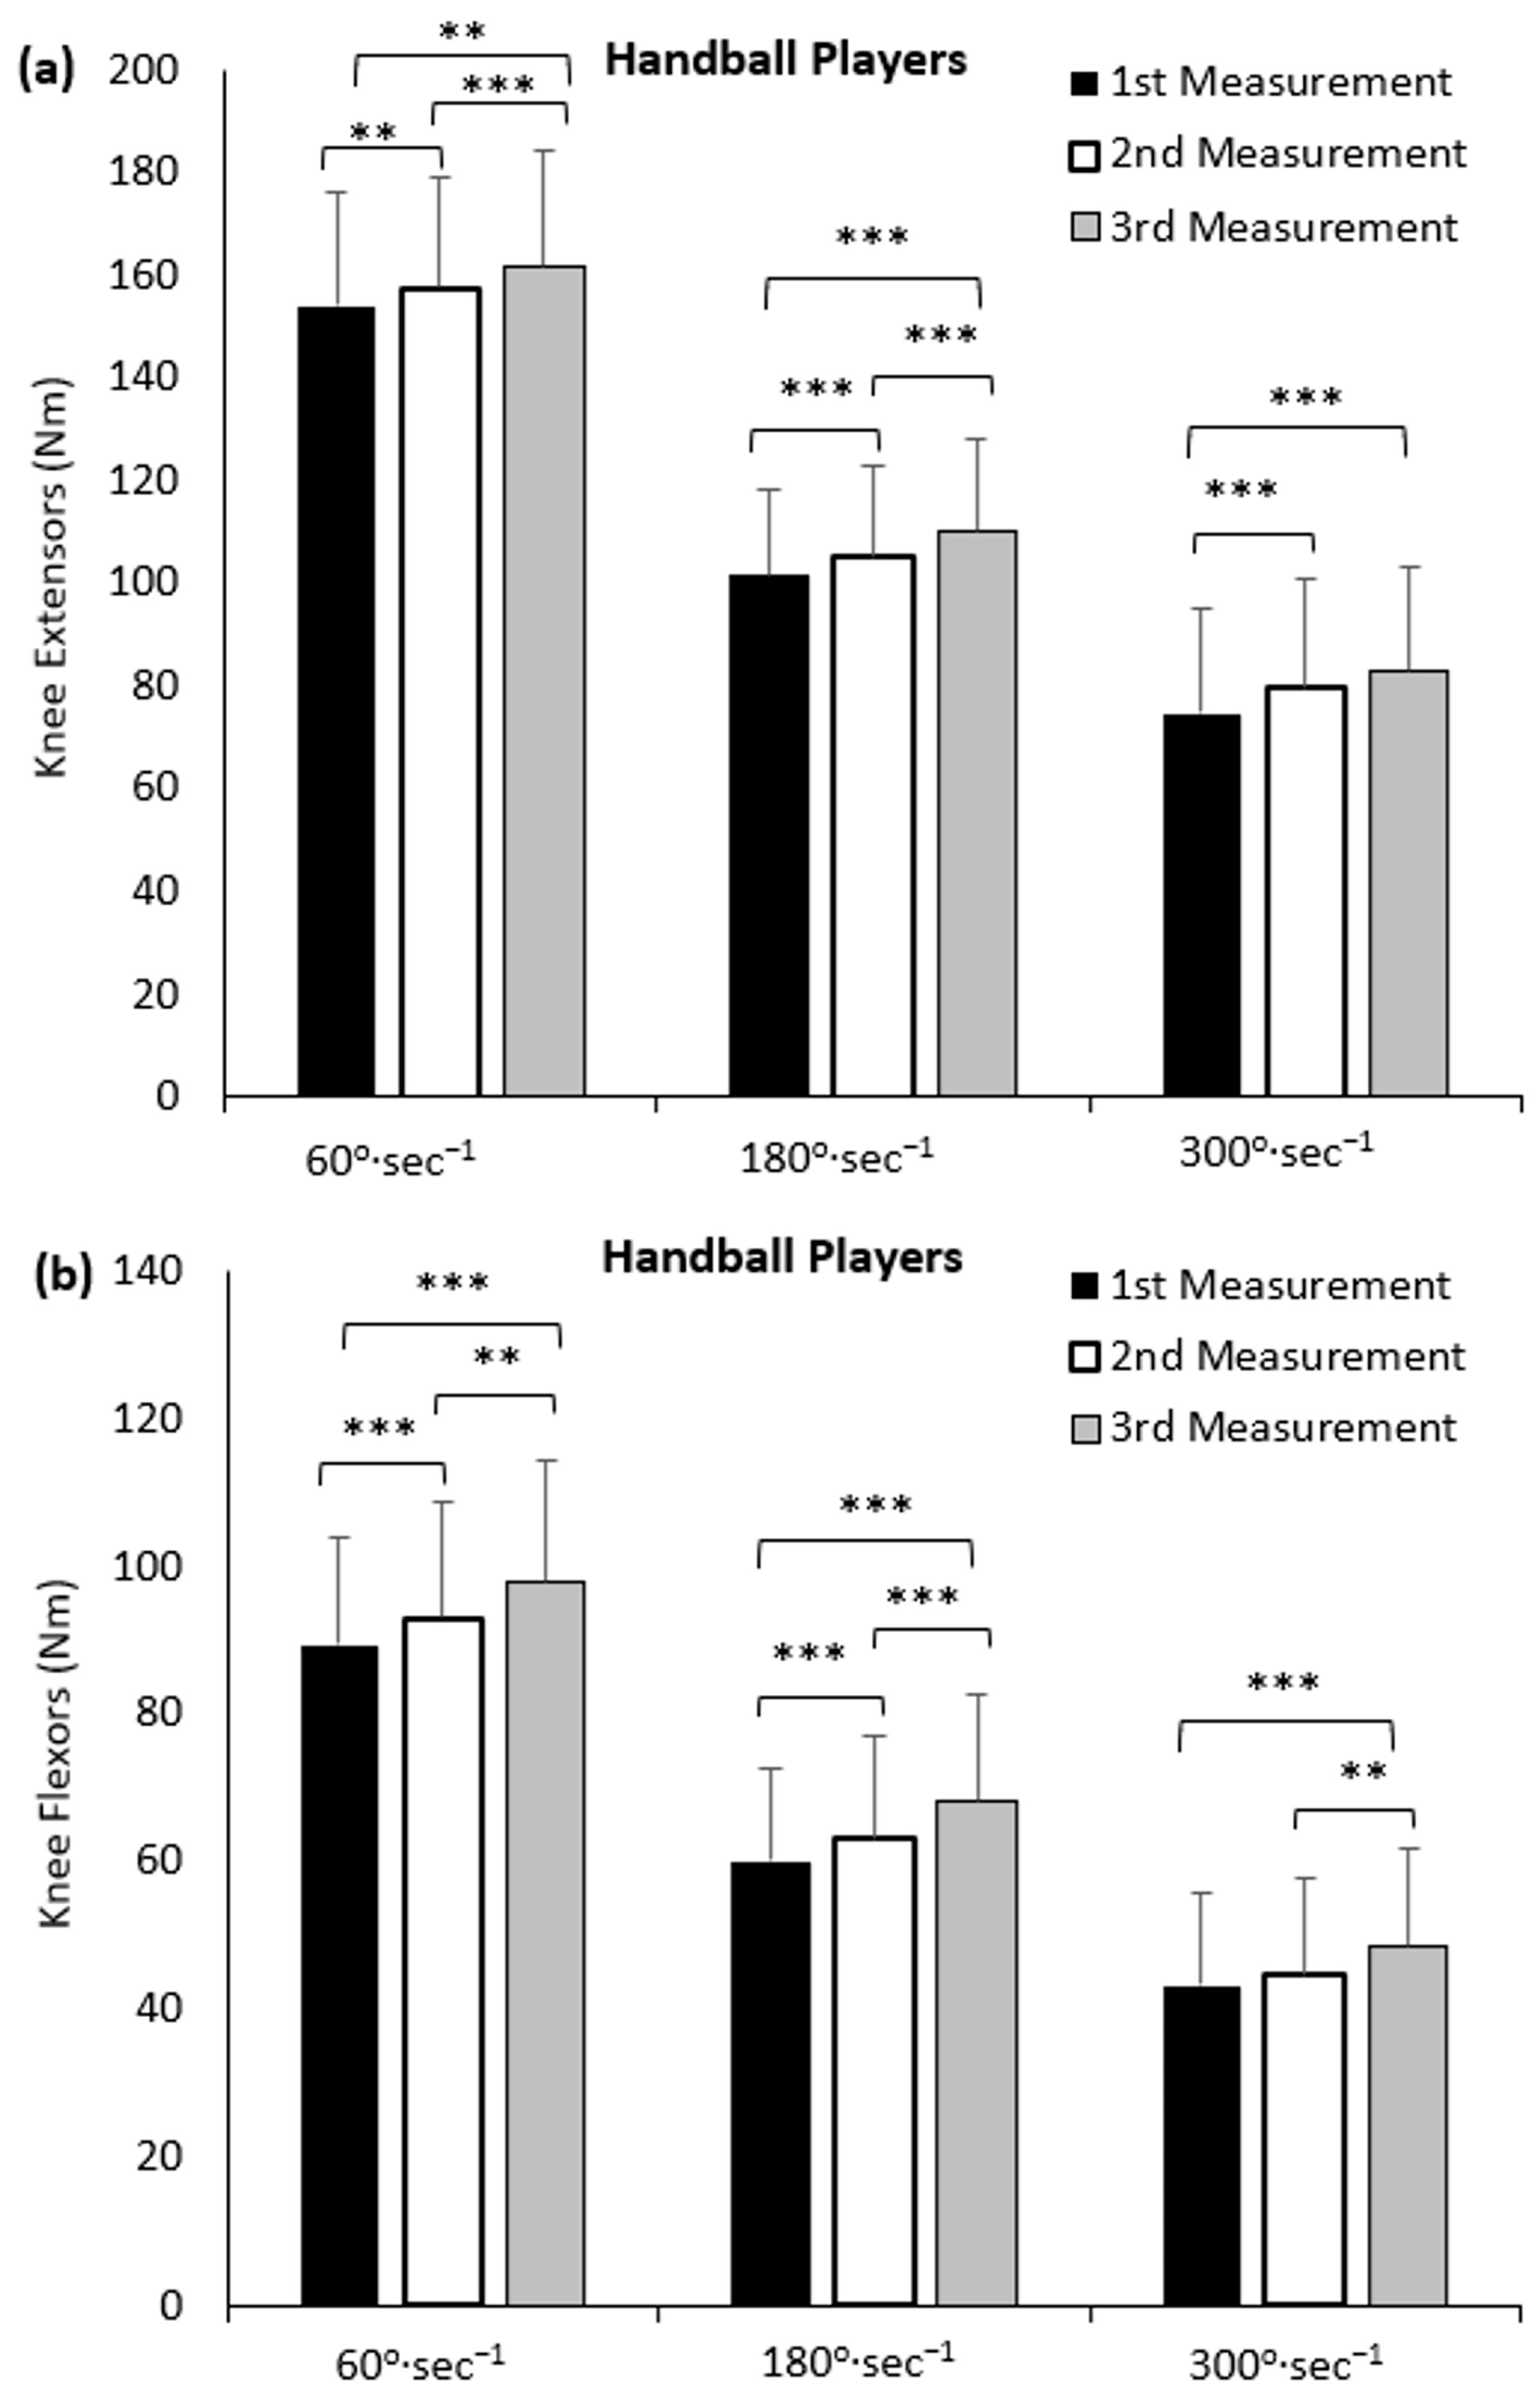
3.2. Isokinetic Muscle Strength of Knee Flexors and Extensors

The absolute isokinetic muscle strengths of knee extensors and flexors within sports at the three angular velocities are presented in Figure 2, Figure 3 and Figure 4. In the soccer players, there was an increase in the isokinetic muscle strength of both H and Q muscles at all angular velocities in the third measurement compared to the first measurement (p < 0.001). However, there was no difference between the first and the second measurements at 60°·s−1 for Q or H muscles. Between the second and the third measurements, differences were observed at 180 and 300°·s−1 for the H (p < 0.001 and p < 0.01) and Q (p < 0.001 and p < 0.01) muscles (Figure 2). Similar patterns were observed for the basketball and handball players, where there were higher absolute isokinetic muscle strength values in the third measurement compared to the first (p < 0.001) and the second measurements (p < 0.01) for both knee flexors and extensors at all angular velocities. In the basketball players, the second measurement presented higher values compared to the first measurement only at knee flexion of 180°·s−1 (p < 0.001) and at all angular velocities in knee extension (60°·s−1: p < 0.01; 180°·s−1: p < 0.001; 300°·s−1: p < 0.05) (Figure 3). Likewise, the handball players presented higher values at the second measurement compared to the first measurement in all angular velocities for both H and Q muscles (p < 0.001 for both muscle groups), except the knee flexors at 300°·s−1, where there was no difference (Figure 4).
The absolute isokinetic muscle strength between sports is shown in Table 3. Differences were found between the basketball and handball players for the knee extensors at 180°·s−1 in all measurements (first: p < 0.05; second: p < 0.01; third: p < 0.05). Finally, it is worth noting that no differences were found between the sports at any measurement or angular velocity in knee extensors or flexors (Table 3).

4. Discussion

This study aimed to examine and investigate the changes in the physical and anthropometric characteristics and the isokinetic muscle strength of elite female soccer, basketball, and handball athletes during the annual training cycle and to compare the results between the sports before the start of the preparation period, in the middle of the season, and at the end of the season. Regarding the anthropometric characteristics of the athletes within sports, there was a decrease in body weight, lean body mass and body fat from the first to the third measurement. Changes were also observed in isokinetic muscle strength, with a gradual increase from the beginning of the preparation period until the end of the training season. Between groups, the soccer players had lower body weight and body fat compared to the basketball and handball players in all measurements, while the basketball players presented the highest values in height and body weight. The isokinetic muscle strength on knee flexion did not show any difference between the sports at any angular velocity or any measurement, with the exception of 180°·s−1.
The results of the anthropometric characteristics showed that the values for height, body weight and the percentage of body fat of the soccer players were in agreement with those in previous studies [24,25,26,27,28], while the body weight and the body fat percentage showed a decrease from the beginning to the end of the season. The height, body weight and body fat values of the basketball and handball players were similar to those reported in other studies [29,30,31,32,33,34], but higher than other investigations carried out in elite female basketball [35,36] and handball players [37,38]. The body weight and the body fat percentage also showed a decrease throughout the season. Height is not the primary selection criterion in soccer and handball, but in basketball, it seems to play an important role [31]. A high percentage of body fat is a detrimental factor for the performance of athletes. Fat mass does not contribute to strength, but increases the metabolic cost of physical activity required during exercise [39]. The body fat percentage of basketball and handball players was relatively high, making weight loss critical by combining proper nutrition with aerobic training to ensure the loss of body fat and not muscle mass, which is essential for their sport [28].
The isokinetic muscle strength of the knee flexors and extensors showed similar patterns between the measurements for all sports. More specifically, in all sports, there was an increase in muscle strength at the end of the training season compared to the initial measurement (before the preparation period). These findings could be due to the training process (i.e., training, competition games) during the annual cycle. The H:Q ratio was within the normal range and did not show any differences during the season. Considering the role of angular velocity in testing, we observed lower peak torque at faster velocities for all sports and testing sessions. This finding reflected the force–velocity relationship underlying muscle function, where the faster the velocity of muscle contraction, the smaller the force production and vice versa [40]. Between the sports, there were no differences in any measurement or angular velocity for knee flexion, while for knee extension, differences were observed only at 180°·s−1, where the basketball players showed greater values compared to the soccer and handball players in all measurements. Furthermore, the lower H:Q ratio in handball than in soccer players was in agreement with a previous comparative study [41] indicating different training adaptations between these two sports. In particular, in female soccer, a low H:Q ratio has previously been identified as a risk factor for leg injuries [42].
Laboratory measurements offer precision and vital insights into the physiological demands of sport and athletes’ capabilities. Based on these measurements, the coaches devise training plans that incorporate suitable programs aimed at enhancing athlete development and performance [43]. Additionally, the data help to identify individual training weaknesses for improvement in individual skills and overall team performance [44]. Thus, the training should be designed individually for each athlete, with the aim of improvement and development. In team sports, the training is designed for all athletes (team training), so the athlete does not follow a specialized training program based on his/her individual and physiological characteristics. As a result, athletes with higher physical fitness do not receive the appropriate training stimulus for further improvement [45], and athletes with lower physical fitness are forced to train harder to reach the same level as other athletes, resulting in increased fatigue, reduced performance and increased risk of injury [46,47]. With regard to the underlying mechanisms explaining the observed changes in the present study, the athletes improved muscle strength during an annual season, which should be attributed to the long-term effect of strength training rather than physiological age-related changes [48,49,50]. All participants had similar training characteristics, such as number of training sessions and matches per week, and—considering the affinity among female soccer, basketball and handball—this might explain the finding of few differences in muscle strength among sports. In addition, the affinity of the training among these sports might explain that reference data in power and strength parameters could be provided collectively for “team sports” instead of each sport separately [51].

Limitations

The study also has some limitations. Initially, this is a descriptive study in three team sports, where the basic characteristics of training (intensity, volume, etc.) in each sport were not recorded in detail in each microcycle. It should be underscored that the present sample of convenience consisted of three clubs competing at the highest national league, where all the clubs adopt similar training routines. Moreover, a control group was not included in the study design, which would have allowed comparison with non-athletes. Future research should use an additional control group—that will not receive any exercise intervention—to verify our findings using a more rigorous study design. Nevertheless, it should be highlighted that given the age of participants (~21 years), one would not expect variation in muscle strength of non-athletes during a year, considering that muscle strength reaches its peak at the end of adolescence [48], remains stable during the 20s [49], and declines after the 40s [50]. Thus, it was reasonable to assume that the increase in muscle strength during a year in the present study was due to chronic adaptations to regular training. On the other hand, the results of this study can be used as reference data for female soccer, basketball and handball players regarding the strength evaluation of the hamstring and quadricep muscles using an isokinetic dynamometer. This information can serve as a springboard for improving the efficiency of strengthening the relevant muscles during an annual cycle. Accordingly, sport scientists and practitioners should expect similar variation in isokinetic muscle strength in these three team sports during a season.

5. Conclusions

In conclusion, it was found that anthropometric characteristics and isokinetic muscle strength were improved from the initial measurement (before the preparation period) to the mid-season measurement in all three sports. In addition, there was an improvement in all factors measured at the end of the training season. The improvement observed for all athletes can be attributed to the training programs that followed during the season. Also, they participate in competitive leagues, and the need for a better ranking is essential.

Author Contributions

Conceptualization, E.P., Z.P. and T.I.M.; methodology, E.P., A.M., Y.M. and P.T.N.; software, E.P., Z.P., A.M. and N.V.M.; validation, E.P., Z.P. and T.I.M.; formal analysis, E.P., A.M., Y.M. and P.T.N.; investigation, E.P., Z.P. and T.I.M.; resources, E.P., Z.P. and T.I.M.; data curation, E.P., A.M., Y.M. and T.I.M.; writing—original draft preparation, E.P., Z.P. and A.M.; writing—review and editing, E.P., A.M., Y.M., P.T.N. and N.V.M.; visualization, E.P., Z.P. and T.I.M.; supervision, T.I.M.; project administration, E.P., A.M. and Y.M. All authors have read and agreed to the published version of the manuscript.

Funding

This research received no external funding.

Institutional Review Board Statement

The study was conducted in accordance with the Declaration of Helsinki, and approved by the Institutional Review Board (or Ethics Committee) (protocol code 7102/2014).

Informed Consent Statement

Informed consent was obtained from all subjects involved in the study.

Data Availability Statement

The data presented in this study are available on request from the corresponding author. The data are not publicly available due to privacy restrictions.

Acknowledgments

The authors would like to thank all the participants who volunteered to participate in the study.

Conflicts of Interest

The authors declare no conflict of interest.

References

  1. Wiewelhove, T.; Raeder, C.; Meyer, T.; Kellmann, M.; Pfeiffer, M.; Ferrauti, A. Markers for routine assessment of fatigue and recovery in male and female team sport athletes during high-intensity interval training. PLoS ONE 2015, 10, e0139801. [Google Scholar] [CrossRef]
  2. Wisløff, U.; Helgerud, J.; Hoff, J. Strength and endurance of elite soccer players. Med. Sci. Sports Exerc. 1998, 30, 462–467. [Google Scholar] [CrossRef]
  3. Little, T.; Williams, A.G. Specificity of acceleration, maximum speed, and agility in professional soccer players. J. Strength Cond. Res. 2005, 19, 76–78. [Google Scholar] [CrossRef] [PubMed]
  4. Støne, N.M.; Kilding, A.E. Aerobic conditioning for team sport athletes. Sports Med. 2009, 39, 615–642. [Google Scholar] [CrossRef] [PubMed]
  5. Hoff, J.; Wisløff, U.; Engen, L.C.; Kemi, O.J.; Helgerud, J. Soccer specific aerobic endurance training. Br. J. Sports Med. 2002, 36, 218–221. [Google Scholar] [CrossRef]
  6. Bangsbo, J.; Nørregaard, L.; Thorsø, F. Activity profile of competition soccer. Can. J. Sport Sci. 1991, 16, 110–116. [Google Scholar] [PubMed]
  7. McInnes, S.E.; Carlson, J.S.; Jones, C.J.; McKenna, M.J. The physiological load imposed on basketball players during competition. J. Sports Sci. 1995, 13, 387–397. [Google Scholar] [CrossRef] [PubMed]
  8. Zakas, A.; Mandroukas, K.; Vamvakoudis, E.; Christoulas, K.; Aggelopoulou, N. Peak torque of quadriceps and hamstring muscles in basketball and soccer players of different divisions. J. Sports Med. Phys. Fitness 1995, 35, 199–205. [Google Scholar]
  9. Holcomb, W.R.; Rubley, M.D.; Lee, H.J.; Guadagnoli, M.A. Effect of hamstring-emphasized resistance training on hamstring: Quadriceps strength ratios. J. Strength Cond. Res. 2007, 21, 41–47. [Google Scholar] [CrossRef]
  10. Kannus, P. Isokinetic evaluation of muscular performance. Int. J. Sports Med. 1994, 15, 11–18. [Google Scholar] [CrossRef]
  11. Aagaard, P.; Simonsen, E.B.; Magnusson, S.P.; Larsson, B.; Dyhre-Poulsen, P. A new concept for isokinetic hamstring: Quadriceps muscle strength ratio. Am. J. Sports Med. 1998, 26, 231–237. [Google Scholar] [CrossRef]
  12. Powers, S.; Howley, E.; Quindry, J. Exercise Physiology: Theory and Application to Fitness and Performance, 11th ed.; McGraw Hill: Boston, MA, USA, 2021. [Google Scholar]
  13. Brown, L.E. Isokinetics in Human Performance; Human Kinetics: Champaign, IL, USA, 2000; p. 344. [Google Scholar]
  14. American College of Sports Medicine. ACSM’s Guidelines for Exercise Testing and Prescription, 7th ed.; Lippincott Williams & Wilkins: Philadelphia, PA, USA, 2006. [Google Scholar]
  15. Miller, T.A.; Thierry-Aguilera, R.; Congleton, J.J.; Amendola, A.A.; Clark, M.J.; Crouse, S.F.; Martin, S.M.; Jenkins, O.C. Seasonal changes in VO2max among Division 1A collegiate women soccer players. J. Strength Cond. Res. 2007, 21, 48–51. [Google Scholar] [CrossRef] [PubMed]
  16. Casajús, J.A. Seasonal variation in fitness variables in professional soccer players. J. Sports Med. Phys. Fitness 2001, 41, 463–469. [Google Scholar] [PubMed]
  17. Edwards, A.M.; Clark, N.; Macfadyen, A.M. Lactate and ventilatory thresholds reflect the training status of professional soccer players where maximum aerobic power is unchanged. J. Sports Sci. Med. 2003, 2, 23–29. [Google Scholar] [PubMed]
  18. Thomas, V.; Reilly, T. Changes in fitness profiles during a season of track and field training and competition. Br. J. Sports Med. 1976, 10, 217–222. [Google Scholar] [CrossRef]
  19. Papaevangelou, E.; Papadopoulou, Z.; Michailidis, Y.; Mandroukas, A.; Nikolaidis, P.T.; Margaritelis, N.V.; Metaxas, T. Changes in cardiorespiratory fitness during a season in elite female soccer, basketball, and handball players. Appl. Sci. 2023, 13, 9593. [Google Scholar] [CrossRef]
  20. Durnin, J.V.; Rahaman, M.M. The assessment of the amount of fat in the human body from measurements of skinfold thickness. Br. J. Nutr. 1967, 21, 681–689. [Google Scholar] [CrossRef] [PubMed]
  21. Siri, W.E. The gross composition of the body. Adv. Biol. Med. Phys. 1956, 4, 239–280. [Google Scholar] [PubMed]
  22. Mandroukas, A.; Vamvakoudis, E.; Metaxas, T.; Papadopoulos, P.; Kotoglou, K.; Stefanidis, P.; Christoulas, K.; Kyparos, A.; Mandroukas, K. Acute partial passive stretching increases range of motion and muscle strength. J. Sports Med. Phys. Fitness 2014, 54, 289–297. [Google Scholar]
  23. Mandroukas, A.; Michailidis, Y.; Metaxas, T. Muscle strength and hamstrings to quadriceps ratio in young soccer players: A cross-sectional study. J. Funct. Morphol. Kinesiol. 2023, 8, 70. [Google Scholar] [CrossRef]
  24. Oliveira, R.; Francisco, R.; Fernandes, R.; Martins, A.; Nobari, H.; Clemente, F.M.; Brito, J.P. In-Season Body Composition Effects in Professional Women Soccer Players. Int. J. Environ. Res. Public Health 2021, 18, 12023. [Google Scholar] [CrossRef] [PubMed]
  25. McFadden, B.A.; Walker, A.J.; Arent, M.A.; Bozzini, B.N.; Sanders, D.J.; Cintineo, H.P.; Bello, M.L.; Arent, S.M. Biomarkers correlate with body composition and performance changes throughout the season in women’s Division I collegiate soccer players. Front. Sports Act. Living 2020, 2, 74. [Google Scholar] [CrossRef] [PubMed]
  26. Manson, S.A.; Brughelli, M.; Harris, N.K. Physiological characteristics of international female soccer players. J. Strength Cond. Res. 2014, 28, 308–318. [Google Scholar] [CrossRef] [PubMed]
  27. Tumilty, D. Protocols for the physiological assessment of male and female soccer players. In Test Methods Manual: Sports—Specific Guidelines for the Physiological Assessment of Elite Athletes, 3rd ed.; Gore, C., Ed.; Australian Sports Commission: Canberra, Australia, 1998; pp. 1–16. [Google Scholar]
  28. Tumilty, D. Protocols for the physiological assessment of male and female soccer players. In Physiological Tests for Elite Athletes; Core, C.J., Ed.; Australian Sports Commission, Human Kinetics: Champaign, IL, USA, 2000; pp. 356–362. [Google Scholar]
  29. Nishisaka, M.M.; Zorn, S.P.; Kristo, A.S.; Sikalidis, A.K.; Reaves, S.K. Assessing Dietary Nutrient Adequacy and the Effect of Season—Long Training on Body Composition and Metabolic Rate in Collegiate Male Basketball Players. Sports 2022, 10, 127. [Google Scholar] [CrossRef]
  30. Cichy, I.; Dudkowski, A.; Kociuba, M.; Ignasiak, Z.; Sebastjan, A.; Kochan, K.; Koziel, S.; Rokita, A.; Malina, R.M. Sex Differences in Body Composition Changes after Preseason Training in Elite Handball Players. Int. J. Environ. Res. Public Health 2020, 17, 3880. [Google Scholar] [CrossRef] [PubMed]
  31. Bayios, I.A.; Bergeles, N.K.; Apostolidis, N.G.; Noutsos, K.S.; Koskolou, M.D. Anthropometric, body composition and somatotype differences of Greek elite female basketball, volleyball and handball players. J. Sports Med. Phys. Fitness 2006, 46, 271–280. [Google Scholar] [PubMed]
  32. Erčulj, F.; Bračič, M. Comparison of the morphological profiles of young European female basketball players from different competitive levels. Physical. Cult. 2010, 64, 14–21. [Google Scholar]
  33. Ronglan, L.T.; Raastad, T.; Børgesen, A. Neuromuscular fatigue and recovery in elite female handball players. Scand. J. Med. Sci. Sports 2006, 16, 267–273. [Google Scholar] [CrossRef]
  34. Vargas, R.P.; Dick, D.D.; de Santi, H.; Duarte, M.; da Cunha Júnior, A.T. Evaluation of physiological characteristics of female handball athletes. Fit. Perf. J. 2008, 7, 93–98. [Google Scholar] [CrossRef]
  35. Narazaki, K.; Berg, K.; Stergiou, N.; Chen, B. Physiological demands of competitive basketball. Scand. J. Med. Sci. Sports 2009, 19, 425–432. [Google Scholar] [CrossRef]
  36. Scanlan, A.T.; Dascombe, B.J.; Reaburn, P.; Dalbo, V.J. The physiological and activity demands experienced by Australian female basketball players during competition. J. Sci. Med. Sport 2012, 15, 341–347. [Google Scholar] [CrossRef] [PubMed]
  37. Granados, C.; Izquierdo, M.; Ibanez, J.; Bonnabau, H.; Gorostiaga, E.M. Differences in physical fitness and throwing velocity among elite and amateur female handball players. Int. J. Sports Med. 2007, 28, 860–867. [Google Scholar] [CrossRef]
  38. Granados, C.; Izquierdo, M.; Ibanez, J.; Ruesta, M.; Gorostiaga, E.M. Effects of an entire season on physical fitness in elite female handball players. Med. Sci. Sports Exerc. 2008, 40, 351–361. [Google Scholar] [CrossRef]
  39. Ghiani, G.; Marongiu, E.; Melis, F.; Angioni, G.; Sanna, I.; Loi, A.; Pusceddu, M.; Pinna, V.; Crisafulli, A.; Tocco, F. Body composition changes affect energy cost of running during 12 months of specific diet and training in amateur athletes. Appl. Physiol. Nutr. Metab. 2015, 40, 938–944. [Google Scholar] [CrossRef] [PubMed]
  40. Mendoza, E.; Moen, D.S.; Holt, N.C. The importance of comparative physiology: Mechanisms, diversity and adaptation in skeletal muscle physiology and mechanics. J. Exp. Biol. 2023, 226, jeb245158. [Google Scholar] [CrossRef]
  41. Risberg, M.A.; Steffen, K.; Nilstad, A.; Myklebust, G.; Kristianslund, E.; Moltubakk, M.M.; Krosshaug, T. Normative Quadriceps and Hamstring Muscle Strength Values for Female, Healthy, Elite Handball and Football Players. J. Strength Cond. Res. 2018, 32, 2314–2323. [Google Scholar] [CrossRef] [PubMed]
  42. Weingart, A.; Rynecki, N.; Pereira, D. A Review of Neuromuscular Training and Biomechanical Risk Factor Screening for ACL Injury Prevention Among Female Soccer Players. Bull. Hosp. Jt. Dis. 2022, 80, 253–259. [Google Scholar]
  43. Ziv, G.A.; Lidor, R. Physical characteristics, physiological attributes, and on-court performances of handball players: A review. Eur. J. Sport Sci. 2009, 9, 375–386. [Google Scholar] [CrossRef]
  44. Reilly, T. An ergonomics model of the soccer training process. J. Sports Sci. 2005, 23, 561–572. [Google Scholar] [CrossRef]
  45. Hoff, J.; Helgerud, J. Endurance and strength training for soccer players. Sports Med. 2004, 34, 165–180. [Google Scholar] [CrossRef]
  46. Alexiou, H.; Coutts, A.J. A comparison of methods used for quantifying internal training load in women soccer players. Int. J. Sports Physiol. Perform. 2008, 3, 320–330. [Google Scholar] [CrossRef]
  47. Impellizzeri, F.M.; Rampinini, E.; Marcora, S.M. Physiological assessment of aerobic training in soccer. J. Sports Sci. 2005, 23, 583–592. [Google Scholar] [CrossRef] [PubMed]
  48. Fraser, B.J.; Rollo, S.; Sampson, M.; Magnussen, C.G.; Lang, J.J.; Tremblay, M.S.; Tomkinson, G.R. Health-Related Criterion-Referenced Cut-Points for Musculoskeletal Fitness Among Youth: A Systematic Review. Sports Med. 2021, 51, 2629–2646. [Google Scholar] [CrossRef] [PubMed]
  49. Su, M.; Chen, Z.; Baker, B.; Buchanan, S.; Bemben, D.; Bemben, M. Muscle-Bone Interactions in Chinese Men and Women Aged 18–35 Years. J. Osteoporos. 2020, 2020, 8126465. [Google Scholar] [CrossRef] [PubMed]
  50. Landi, F.; Calvani, R.; Tosato, M.; Martone, A.M.; Fusco, D.; Sisto, A.; Ortolani, E.; Savera, G.; Salini, S.; Marzetti, E. Age-Related Variations of Muscle Mass, Strength, and Physical Performance in Community-Dwellers: Results From the Milan EXPO Survey. J. Am. Med. Dir. Assoc. 2017, 18, 88.e17–88.e24. [Google Scholar] [CrossRef]
  51. Valenzuela, P.L.; McGuigan, M.; Sánchez-Martínez, G.; Torrontegi, E.; Vázquez-Carrión, J.; Montalvo, Z.; Abad, C.C.; Pereira, L.A.; Loturco, I. Reference power values for the jump squat exercise in elite athletes: A multicenter study. J. Sports Sci. 2020, 38, 2273–2278. [Google Scholar] [CrossRef]
Figure 1. Study design.
Sci 05 00043 g001
Figure 2. Absolute isokinetic muscle strength of knee extensors (a) and knee flexors (b) of the soccer players throughout the season. *: p < 0.05; **: p < 0.01; ***: p < 0.001.
Sci 05 00043 g002
Figure 3. Absolute isokinetic muscle strength of knee extensors (a) and knee flexors (b) of the basketball players throughout the season. *: p < 0.05; **: p < 0.01; ***: p < 0.001.
Sci 05 00043 g003
Figure 4. Absolute isokinetic muscle strength of knee extensors (a) and knee flexors (b) of the handball players throughout the season. **: p < 0.01; ***: p < 0.001.
Sci 05 00043 g004
Table 1. Physical and anthropometric characteristics within sports throughout the season (mean ± SD).
Measurements
1st2nd3rd
Soccer (n= 19)
Height (cm)164.9 ± 6.0165.1 ± 6.0165.2 ± 5.9
Weight (kg)58.7 ± 6.1 ***,###57.5 ± 6.1 $$$56.1 ± 5.8
Lean body mass (kg)46.7 ± 3.7 ###46.1 ± 3.845.7 ± 3.8
Body fat (%)20.2 ± 3.6 ###19.5 ± 3.4 $$18.4 ± 3.2
HRrest (b/min)67.2 ± 6.966.8 ± 6.967.7 ± 7.4
Basketball (n = 26)
Height (cm)175.4 ± 5.7 ***,###176.0 ± 5.5 $$$176.4 ± 5.3
Weight (kg)71.6 ± 13.7 ***,###69.4 ± 13.3 $$$67.5 ± 12.8
Lean body mass (kg)52.0 ± 7.6 ###51.7 ± 7.7 $$$50.7 ± 7.3
Body fat (%)26.4 ± 4.4 ***,###24.9 ± 4.7 $$24.1 ± 4.3
HRrest (b/min)66.8 ± 9.3 ***64.1 ± 8.5 $$70.3 ± 11.8
Handball (n = 26)
Height (cm)167.3 ± 4.7 *,##167.5 ± 4.6 $$$167.8 ± 4.5
Weight (kg)63.1 ± 6.5 ***,###61.2 ± 6.4 $$$59.5 ± 6.1
Lean body mass (kg)46.2 ± 3.2 **,###45.4 ± 3.445.0 ± 3.3
Body fat (%)26.6 ± 4.7 **,###25.5 ± 4.0 $$$24.1 ± 3.8
HRrest (b/min)70.1 ± 8.1 **68.2 ± 9.6 $$74.0 ± 10.6
*: p < 0.05 1st vs. 2nd; **: p < 0.01 1st vs. 2nd; ***: p < 0.001 1st vs. 2nd; ##: p < 0.01 1st vs. 3rd; ###: p < 0.001 1st vs. 3rd; $$: p < 0.01 2nd vs. 3rd; $$$: p < 0.001 2nd vs. 3rd.
Table 2. Physical and anthropometric characteristics between sports at the 1st, 2nd, and 3rd measurements (mean ± SD).
1st Measurement
Soccer
(n = 19)
Basketball
(n = 26)
Handball
(n = 26)
Height (cm)164.9 ± 6.0 ***175.4 ± 5.7 $$$167.3 ± 4.7
Weight (kg)58.7 ± 6.1 ***71.6 ± 13.7 $$63.1 ± 6.5
Lean body mass (kg)46.7 ± 3.7 **52.0 ± 7.6 $$$46.2 ± 3.2
Body fat (%)20.2 ± 3.6 ***,###26.4 ± 4.426.6 ± 4.7
HRrest (b/min)67.2 ± 6.966.8 ± 9.370.1 ± 8.1
2nd Measurement
Height (cm)165.1 ± 6.0 ***176.0 ± 5.5 $$$167.5 ± 4.6
Weight (kg)57.5 ± 6.1 ***69.4 ± 13.3 $$61.2 ± 6.4
Lean body mass (kg)46.1 ± 3.8 **51.7 ± 7.7 $$$45.4 ± 3.4
Body fat (%)19.5 ± 3.4 ***,###24.9 ± 4.725.5 ± 4.0
HRrest (b/min)66.8 ± 6.964.1 ± 8.568.2 ± 9.6
3rd Measurement
Height (cm)165.2 ± 5.9 ***176.4 ± 5.3 $$$167.8 ± 4.5
Weight (kg)56.1 ± 5.8 ***67.5 ± 12.8 $$59.5 ± 6.1
Lean body mass (kg)45.7 ± 3.8 **50.7 ± 7.3 $$$45.0 ± 3.3
Body fat (%)18.4 ± 3.2 ***,###24.1 ± 4.324.1 ± 3.8
HRrest (b/min)67.7 ± 7.470.3 ± 11.874.0 ± 10.6
Soccer vs. basketball: **: p < 0.01; ***: p < 0.001; soccer vs. handball: ###: p < 0.001; basketball vs. handball: $$: p < 0.01; $$$: p < 0.001.
Table 3. Isokinetic muscle strength of knee flexors and knee extensors between sports at the three angular velocities during the 1st, 2nd, and 3rd measurements (mean ± SD).
1st Measurement
Soccer
(n = 19)
Basketball
(n = 26)
Handball
(n = 26)
Flexion 60°·s−1 (Nm)103.2 ± 22.096.1 ± 23.289.4 ± 14.7
Flexion 180°·s−1 (Nm)68.5 ± 15.360.4 ± 12.760.0 ± 12.7
Flexion 300°·s−1 (Nm)46.1 ± 11.140.2 ± 11.743.3 ± 12.3
Extension 60°·s−1 (Nm)156.5 ± 32.6165.7 ± 30.5154.0 ± 22.0
Extension 180°·s−1 (Nm)110.2 ± 21.4119.0 ± 23.5 $101.6 ± 16.8
Extension 300°·s−1 (Nm)81.5 ± 15.781.5 ± 17.774.8 ± 20.5
H:Q ratio 60°·s−1 (%)66.8 ± 11.3 *,#58.2 ± 9.858.4 ± 7.8
H:Q ratio 180°·s−1 (%)62.6 ± 10.5 **51.6 ± 10.459.7 ± 11.3
H:Q ratio 300°·s−1 (%)57.3 ± 13.649.6 ± 10.759.6 ± 14.3
2nd Measurement
Flexion 60°·s−1 (Nm)105.0 ± 22.297.4 ± 22.993.0 ± 15.8
Flexion 180°·s−1 (Nm)70.3 ± 16.563.3 ± 12.563.0 ± 14.1
Flexion 300°·s−1 (Nm)48.3 ± 12.141.0 ± 13.844.7 ± 13.1
Extension 60°·s−1 (Nm)158.2 ± 32.7168.6 ± 32.2157.3 ± 21.5
Extension 180°·s−1 (Nm)112.6 ± 20.9123.7 ± 23.7 $$105.1 ± 17.5
Extension 300°·s−1 (Nm)83.9 ± 15.383.5 ± 20.579.5 ± 21.3
H:Q ratio 60°·s−1 (%)67.2 ± 11.2 **,#58.0 ± 9.259.4 ± 8.5
H:Q ratio 180°·s−1 (%)62.8 ± 11.6 **52.1 ± 10.6 $60.6 ± 12.5
H:Q ratio 300°·s−1 (%)58.1 ± 13.349.1 ± 12.257.8 ± 14.7
3rd Measurement
Flexion 60°·s−1 (Nm)108.4 ± 22.3104.5 ± 26.097.8 ± 16.5
Flexion 180°·s−1 (Nm)75.4 ± 15.866.9 ± 13.168.3 ± 14.4
Flexion 300°·s−1 (Nm)52.7 ± 11.944.5 ± 14.448.4 ± 13.3
Extension 60°·s−1 (Nm)164.5 ± 30.9176.5 ± 33.4161.8 ± 22.4
Extension 180°·s−1 (Nm)118.2 ± 20.6126.8 ± 23.7 $110.2 ± 17.6
Extension 300°·s−1 (Nm)90.8 ± 14.290.6 ± 17.983.0 ± 20.2
H:Q ratio 60°·s−1 (%)66.2 ± 8.759.4 ± 10.660.8 ± 8.7
H:Q ratio 180°·s−1 (%)64.0 ± 8.8 **53.5 ± 9.7 $$62.4 ± 10.6
H:Q ratio 300°·s−1 (%)58.0 ± 10.3 *49.0 ± 12.5 $$59.3 ± 12.4
Soccer vs. basketball: *: p < 0.05; **: p < 0.01; soccer vs. handball: #: p < 0.05; basketball vs. handball: $: p < 0.05; $$: p < 0.01.
Disclaimer/Publisher’s Note: The statements, opinions and data contained in all publications are solely those of the individual author(s) and contributor(s) and not of MDPI and/or the editor(s). MDPI and/or the editor(s) disclaim responsibility for any injury to people or property resulting from any ideas, methods, instructions or products referred to in the content.

