Article

Nuances of Interpreting X-ray Analysis by Deep Learning and Lessons for Reporting Experimental Findings

by
Steinar Valsson
and
Ognjen Arandjelović
*
School of Computer Science, University of St Andrews, North Haugh, St Andrews KY16 9SX, UK
*
Author to whom correspondence should be addressed.
Submission received: 5 November 2021 / Revised: 20 December 2021 / Accepted: 5 January 2022 / Published: 16 January 2022

Abstract

:
With the increase in the availability of annotated X-ray image data, there has been an accompanying and consequent increase in research on machine-learning-based, and ion particular deep-learning-based, X-ray image analysis. A major problem with this body of work lies in how newly proposed algorithms are evaluated. Usually, comparative analysis is reduced to the presentation of a single metric, often the area under the receiver operating characteristic curve (AUROC), which does not provide much clinical value or insight and thus fails to communicate the applicability of proposed models. In the present paper, we address this limitation of previous work by presenting a thorough analysis of a state-of-the-art learning approach and hence illuminate various weaknesses of similar algorithms in the literature, which have not yet been fully acknowledged and appreciated. Our analysis was performed on the ChestX-ray14 dataset, which has 14 lung disease labels and metainfo such as patient age, gender, and the relative X-ray direction. We examined the diagnostic significance of different metrics used in the literature including those proposed by the International Medical Device Regulators Forum, and present the qualitative assessment of the spatial information learned by the model. We show that models that have very similar AUROCs can exhibit widely differing clinical applicability. As a result, our work demonstrates the importance of detailed reporting and analysis of the performance of machine-learning approaches in this field, which is crucial both for progress in the field and the adoption of such models in practice.

1. Introduction

Chest X-ray is one of the most widely available and easy-to-use medical imaging tools in the diagnostics of lung disease. In no small part, its attractiveness stems from the fact that it is relatively inexpensive compared to other imaging techniques [1,2]. The quality of the acquisition process and the subsequent analysis are of crucial importance as more extensive tests are often only performed for acute cases due to cost or a lack of availability. A wrongly interpreted X-ray image can lead to a misdiagnosis with severe consequences.
Advances in the field of machine learning (ML) have made it possible, in principle, to automate the interpretation of X-ray images or at least assist in the process. Interpreting X-ray images can be quite challenging to do accurately. Junior doctors generally perform rather poorly on the task [3], and even specialists exhibit significant variability between readings (intra-personal variability) or one another (inter-personal variability) [4]. The difference in contrast between an anomaly and normal tissue can often be minimal, and it is often virtually or literally impossible to distinguish between two conditions from an X-ray alone, so further investigation may be needed. The goal of the present paper is to emphasise the importance of interpreting model results by training and evaluating the diagnostic capabilities of a model to diagnose and localise 14 disease labels.
Following a review of the related previous work in Section 1, we overview the performance metrics most widely used in research on computer vision and machine-learning-based diagnostics and prognostics in Section 2 and then describe the specific models adopted in the present study in Section 3. The nexus of the article is found in Section 4, wherein we present our experiments and analyse and contextualise the corresponding findings. A summary and conclusions are presented in Section 5.

Background and Previous Work

As noted earlier, the focus of the present work is not on the technical approach itself, but rather on the issues related to the interpretation of the output of machine-learning models trained to analyse X-ray imagery. Hence, since all but without exception, previous work has suffered from much the same weaknesses (while differing in “under the bonnet” technicalities), we illustrate this with a representative example—namely the work of Wang et al. [5]—without seeking to survey different learning methodologies in detail. The authors described a data-gathering and -labelling process using natural language processing (NLP) from radiology reports gathered from institutional picture archiving and communication systems (PACSs) and trained a deep convolutional neural network (CNN) model to predict the label corresponding to an input X-ray image. Their experimental corpus included labelled X-ray images and metadata such as patient ID, age, sex, and the X-ray view position (VP) (antero-posterior or postero-anterior). A total of 14 disease labels were considered: Atelectasis, Cardiomegaly, Consolidation, Oedema, Effusion, Emphysema, Fibrosis, Hernia, Infiltration, Mass, Nodule, Pleural Thickening, Pneumonia, and Pneumothorax, with the meaning of each being clear from the label itself. Furthermore, for approximately 1000 images, the information on the locality of the label (or indeed, the disease) was provided in the form of a bounding box. The promising results reported by the authors have made this work influential, with a number of follow-up methods having been put forward by others, all bearing conceptual and methodological similarity, such as those by Baltruschat et al. [6], Rajpurkar et al. [7], Yao et al. [8], Li et al. [9], and Gündel et al. [10].
In none of the aforementioned work, except for that of Baltruschat et al. [6], is there a discussion of the shortcomings to any extent. The scores, usually the area under curve (AUC) of the receiver operating characteristic curve (ROC) or the F1-score, are adopted without any consideration of their clinical significance or insight into what is failing in the proposed method when it does (and failure certainly does occur often enough that it ought to have been discussed).
Quantifying performance using a single numerical measure is certainly an attractive proposition: it is usually easily interpretable, quickly absorbed, and provides unambiguous rank ordering of different approaches. While this approach can be appropriate in some problem contexts, it certainly is not in the case of X-ray image analysis, when nuances in what a model is learning or basing its decisions on can lead to significant clinical differences, yet leave a simple all-encompassing performance measure unaltered (or virtually so). The present paper sheds additional light on this issue and furthers the understanding of the effectiveness of software as a medical device (SaMD) that may be measured.

2. Performance Quantification

The Food and Drug Administration (FDA), as a part of the IMDRF, has issued guidelines for SaMDs’ clinical evaluation where they list a number of evaluation functions they would like to see reported for clinical validation in future SaMDs. These are specificity, sensitivity, accuracy, and the odds ratio [11]. These metrics can all be computed from the values comprising the confusion matrix—a 2 × 2 matrix containing the empirical true positive (TP), true negative (TN), false positive (FP), and false negative (FN) ratios measured by applying a model on the test data. Sensitivity, or recall, specificity, accuracy, and the F1-score are thus defined as follows:
S e n s i t i v i t y = T P T P + F N
S p e c i f i c i t y = T N T N + F P
A c c u r a c y = T P + T N T P + T N + F P + F N
F 1 = T P T P + 1 2 × ( F P + F N ) .
A high sensitivity entails that there are very few false negatives, while a high specificity means that there are few false positives. Accuracy describes the proportion of correct diagnoses, but has the downside of not accounting for imbalanced data, as it is possible to always predict a class with very few samples as another class with more numerous samples and still have high accuracy. Having both sensitivity and specificity included can therefore indicate how well the SaMD performs in a relatively straightforward way. Accuracy can then be looked at with respect to the other metrics.
The diagnostic odds ratio (DOR) is also often used as a single indicator of diagnostic performance. Its value can range from zero to infinity, with higher values corresponding to better performance. A value of one means that the a positive result is as likely to be the result of a true positive or a true negative, and a score below one means that there are more negative results for positive examples of a given class. The DOR is independent of sample prevalence, as apposed to accuracy, and the 95 % confidence interval can be calculated as:
ln ( D O R ) ± 1.96 × S E ( ln ( D O R ) )
where:
S E ( ln ( D O R ) ) = 1 T P + 1 T N + 1 F P + 1 F N
A drawback of the DOR is that it is undefined when the confusion matrix contains zero entries (i.e., in practice, if there are no false positives or false negatives). A commonly used ad hoc adjustment applied in such cases is to add 0.5 to all values in the matrix.
Lastly, we turn our attention to the AUROC, i.e., the area under the receiver operating characteristic curve, which is used extensively in medical research as a means of ranking different diagnostic procedures [12,13,14,15,16,17]. Recall that the receiver operator characteristic (ROC) curve captures the dependency between of the true positive rate on the the false positive rate of a binary classifier. The ROC curve is highly useful in that it captures the nuanced behaviour of a classifier and is indispensable in informing the choice of the classifier’s operating point, that is the FP/TP combination that is deemed best according by the relevant clinical criteria. However, it is exactly this nuance that makes the ROC difficult to interpret by clinical staff (as opposed to statisticians) [18]. The use of the AUROC as an alternative for comparing different methods is an attempt to simplify the information conveyed by the ROC curve and to allow for different classifiers to be ranked unambiguously. It is, as the name suggests, simply the integral of the TP rate as a function of the FP rate, over the entire FP range from 0–1. Therefore, a randomly guessing classifier achieves an AUROC of 0.5 , whereas a perfectly performing one that of 1.0 . As we will demonstrate in Section 4, a major limitation of the AUROC lies in the loss of clinically important information captured by the ROC curve. In short, two classifiers with vastly different behaviours and significantly different clinical usefulness can be characterised by the same AUROC.

3. Model

As we noted earlier, the method described by Wang et al. [5] is influential and representative of a whole body of work in the area, and hence herein, we adopted it as our baseline. We took a pre-trained network and re-training on the task specific data set—that of X-ray images. A key feature of this process is that the entire network is re-trained and not just the classification layer (which is more common in the literature). In particular, we adopted the 121-layer dense convolutional network (DenseNet) [19] pre-trained on the ImageNet corpus [20] and re-trained on the data made available by Wang et al., using the same training–validation–test split as the original authors and the binary cross-entropy loss function:
( x , y ) = 1 N i = 1 N l i
where:
l n = [ y n · log x n + ( 1 y n ) · log ( 1 x n ) ]
where x and y are respectively the input and the output vectors and N is the batch size.
For the localisation of the salient image region corresponding to the label, we used gradient-weighted class activation mapping (Grad-CAM) based on the work by Zhou et al. [21] and further improved on by Selvaraju et al. [22]. Herein, we summarise the process for the reader’s benefit. Firstly, an input image is run through the model and the activations from the forward pass on the last convolutional layer saved. Then, backpropagation with respect to a given label is performed, and the output gradients from the backwards pass on the same convolutional layer are also saved. Next, the gradients are pooled together into a single layer and multiplied by the activations saved earlier. An average pooling is applied to the activation, per feature, leaving an H × W matrix. A ReLU function is then applied to the matrix, removing all negative feature outputs, and the remaining features are then normalised around the maximum entry in the array. At this point, the Grad-CAM heat map is generated and can be overlayed on top of the original image.
In the end, we compared two models: one that just follows the method mentioned above and another one where the network was modified to use metadata by virtue of two additional binary nodes, corresponding to a patient’s gender and the X-ray VP, in the last prediction layer; see Figure 1. We refer to the first model as the standard model and the second one as the modified model.

4. Experiments

4.1. Data Corpus

Following its widespread use in the existing literature, herein, we also adopted the ChestX-ray8 data corpus introduced by Deng et al. [20] and which, to the best of our knowledge, remains a publicly accessible chest X-ray data set. To summarise its contents succinctly (the reader is referred to the original publication for further detail), NLP was employed to extract from radiology reports the labels ultimately associated with each X-ray image in the set; Table 1 summarises the statistics of the thus-extracted labels. In total, the corpus comprises 108,000 labelled images from over 30,000 patients.

4.2. Analysis

In line with the primary aims of this work, we started by assessing the different methods’ performance using the most widely used metric in the literature, namely the AUROC. Under this metric, the standard and the modified models stand on par with one another, the former achieving an AUROC value of 0.800 and the latter a marginally higher value of 0.806. We note that this is consistent with the previous reports in the literature, with the reported AUROC ranging from 0.745 (see Wang et al. [5]) to 0.806 using the method proposed by Baltruschat et al. [6]. The picture painted by comparing the per-label AUROC values, shown in Table 2, is similar: on some labels, one model performs somewhat better, on others, the other does. Weighted by the frequencies of the labels, as we saw earlier, the difference all but disappears.
Both the standard and the modified model achieve nearly identical empirical AUROC scores, which, as we noted already, are normally used as the metric for ranking different methods in the field. Thus, superficially, this result suggests that the two methods are performing on par. Yet, in clinical terms, which is really what is of ultimate interest, this is far from the case: a closer look shows that the models actually perform rather differently.
Consider a slightly more nuanced comparison of the methods’ performances summarised in Table 3. In terms of specificity and accuracy, the standard model can be seen to be superior. This is significant. For example, the difference of 0.023 in specificity means that out of 1000 patients, 23 can be (correctly) not subjected to further investigation and tests, thereby reducing the unnecessary discomfort caused and reducing the financial burden on the health care system. On the other hand, the modified model has a higher recall, so it is more likely to detect disease present in patients that have it. The difference in recall of 0.025 means it correctly diagnoses 25 more patients in 1000 than the standard model. To contextualise this, patients and healthcare professionals were willing to exchange 2250 FP diagnoses of colorectal cancer for one additional TP diagnosis [23]. Similarly, 63% of women were found as >500 FPs reasonable per one life saved, and 37% would tolerate 10,000 or more [24]. Some 1000 images have expert-drawn bounding boxes associated with them, localizing the visual presentation of the corresponding disease.
Reflecting on these observations, it is neither correct to say that the methods perform comparably, nor that one is superior to the other. Rather, there are significant differences between the two, and the question that is to be preferred in a specific context is one that demands collaborative consultative effort between teams of clinicians who understand the particular operative environment of interest and, no less importantly, medical ethicists whose role in the process is still inadequately appreciated.

4.3. Understanding the Data and the Interpretation of the Findings

A major concern of relevance to the efforts in the development of medical applications of machine learning concerns data used for training and testing algorithms. Notable problems include quality control (both of the data themselves, as well as their labelling), the clinical relevance and appropriateness of any associated annotations, the data balance, and numerous others. Indeed, concerns regarding the ChestX-ray14 corpus have been raised as well. Indeed, their nature mirrors the aforementioned pervasive ones: labelling accuracy (quality control), confounding information (quality control), clinical meaning of labels (quality control and clinical significance), and the usefulness of the labels (clinical significance and appropriateness) [25]. Consider the following quality control concern: since some pneumothorax images are of patients that have already been treated and who hence have a chest drain, a machine-learning algorithm can learn to detect the presence of a drain and thus to correctly label the image, rather than learning to detect directly the condition itself (a similar issue in an anatomically different context was noted by Tun et al. [
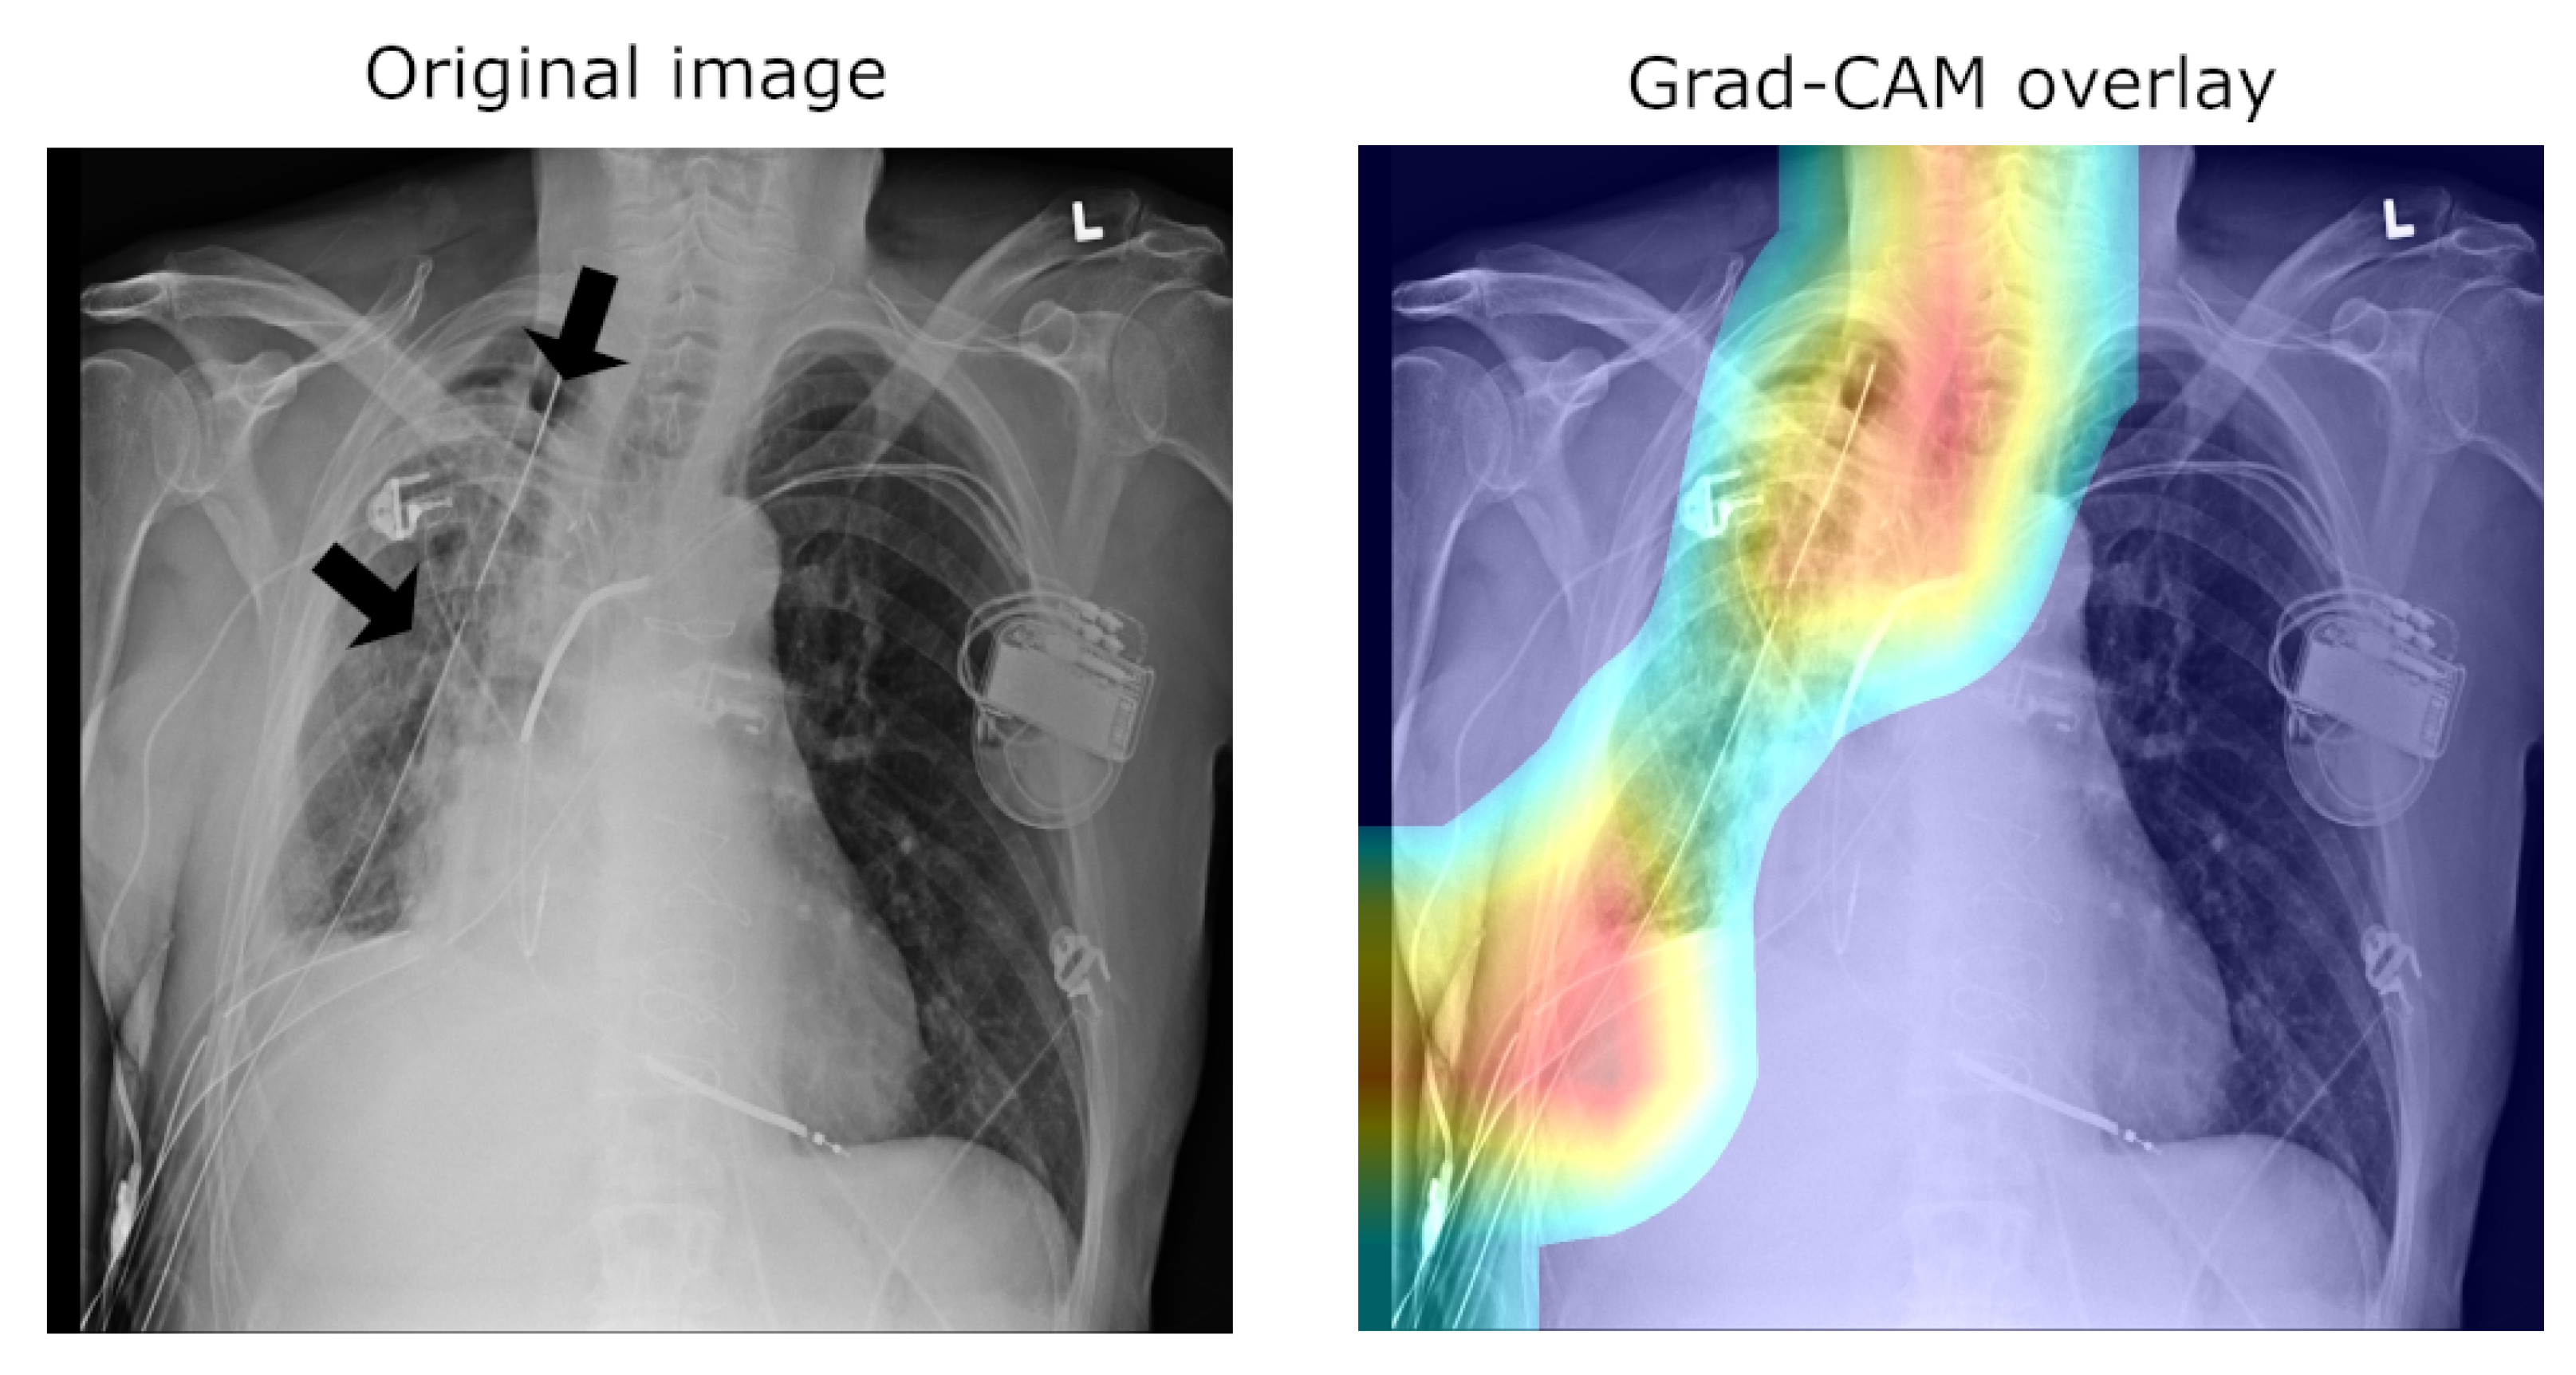
26]). This is illustrated in Figure 2, which shows on the left the original image, with the drain tube indicated, and on the right the learned class (pneumothorax) activation map.
Another important observation is that an image can have more than one class label associated with it (e.g., both the “Pneumonia” and “Infiltration” labels can be associated with the same X-ray image). Using the same loss function used to train the network, we can compute the mean model loss as a function of the number of labels, N, associated with an image (n.b. N ranges from zero for healthy lungs and goes up to eight, which is the maximum number of labels in this corpus). The loss increases at a linear rate with each additional label (see Table 4), suggesting that the number of labels does not affect the per-label accuracy.
Looking at all instances of images with a single label and examining the mean activations across classes reveals a clear bias. An example is illustrated in Table 5. The mean activation for the correct, ground truth label “Consolidation” is only 0.0842, whereas the mean activation for “Infiltration” is 0.2724—a 3.2-fold difference.
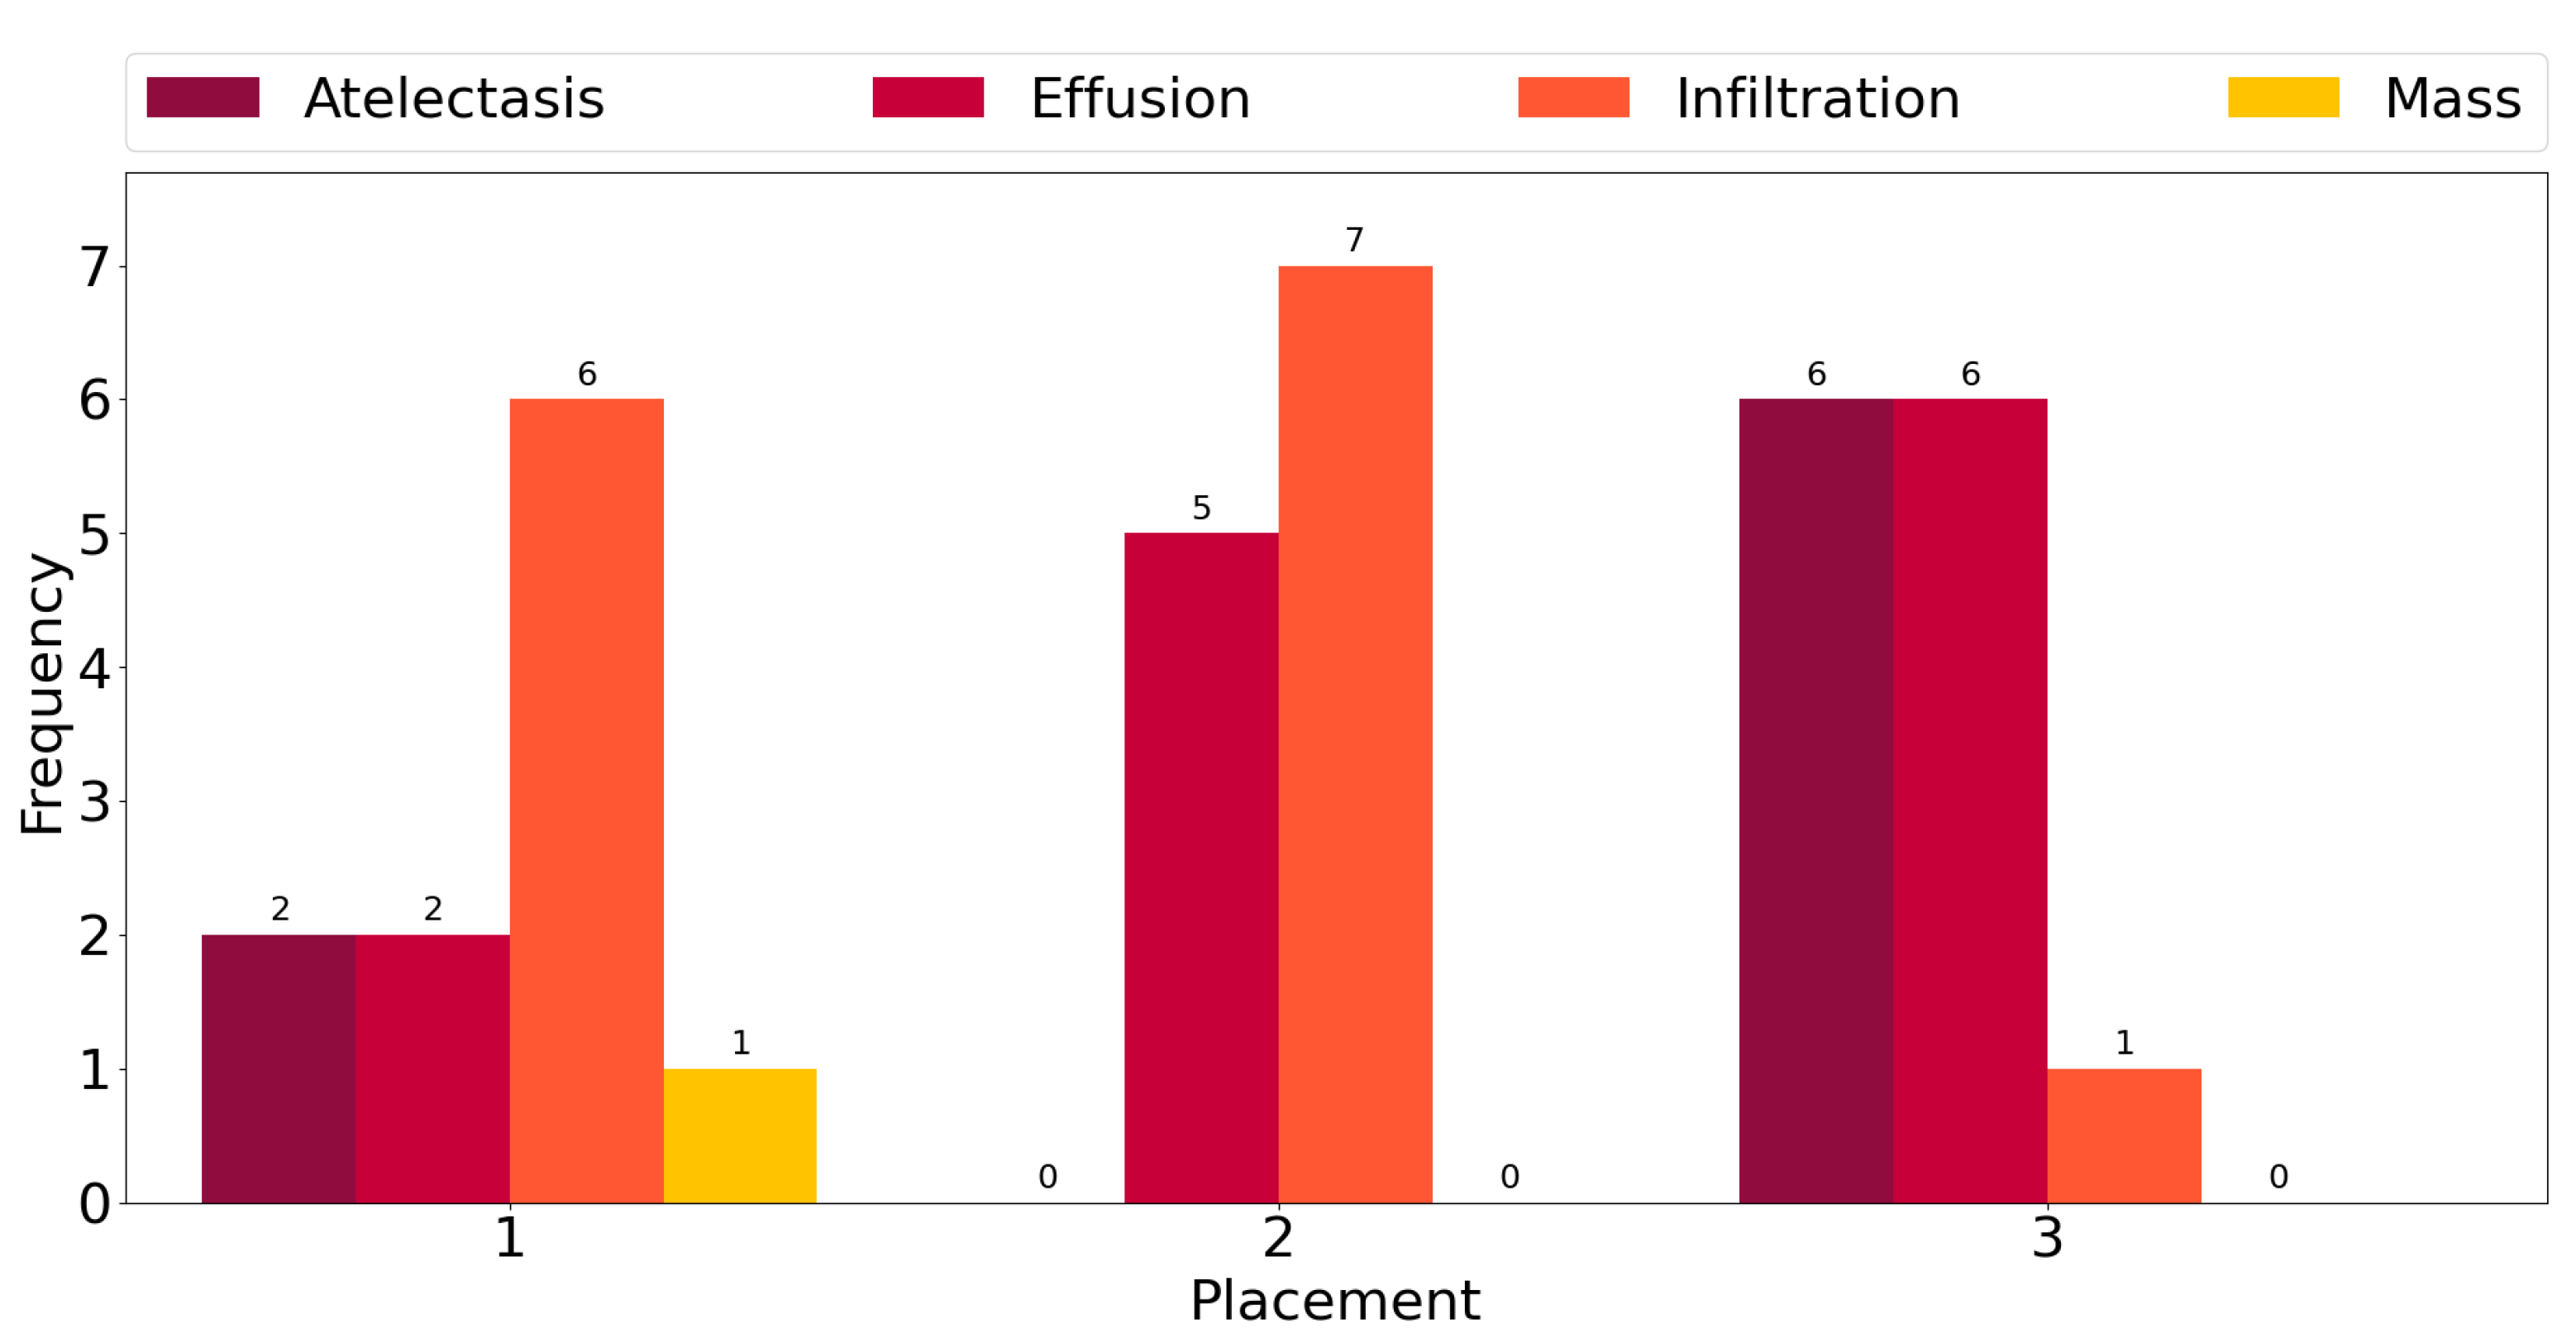
This observation is corroborated further by the plot in Figure 3, which shows counts of the number of times each class exhibits among the three highest mean activations for single-label images across all classes. “Infiltration” is the most frequent class in the corpus, and for six out the fourteen ground truth labels, it exhibits the highest activation mean. In seven cases, it is the second-most-activated class, and in one, it is the third. In other words, it is always amongst the top three most-activated output classes, regardless of what the true, target label is. The same can be seen for the three other most common classes, namely “Atelectasis”, “Effusion”, and “Mass”. The frequency of high activations is highly affected by the number of class instances in the corpus.

4.4. Saliency and Explainability

As we noted previously, using Grad-CAM, or indeed similar methods [27], it is possible to quantify and thus visualise the importance of different parts of an analysed image a network uses as the basis for its prediction. This can be helpful both in understanding why the model fails when it does as well in focusing an expert’s attention for further analysis and interpretation.
In the context of the ChestX-ray8 corpus, the labelling within it has been criticised by some [25]. This is hardly surprising, for the very manner in which the labels were extracted makes it impossible to consider them as the oracle ground truth. For instance, some pneumothorax images are of patients that have already had treatments indicated by a chest drains in the image. This can lead a network simply localising the drain and, based on this finding alone, label the image as belonging to the pneumothorax class, rather than as a result of the actual visual analysis of the presentation of the condition—see Figure 2, wherein the drain has been marked with an arrow.
Using the bounding boxes information provided, we further examined how well the models performed in localizing the visual presentation of different diseases. We quantified this using the intersection over union (IoU), a ratio of the intersection of the bounding box and heat map activation and the union of the area they both cover, which can be loosely related to the well-known Bhattacharyya coefficient, a measurement of the amount of overlap between two statistical samples [28,29]. The ratio was calculated using thresholded heat maps with the key findings summarised in Table 6 and Table 7.
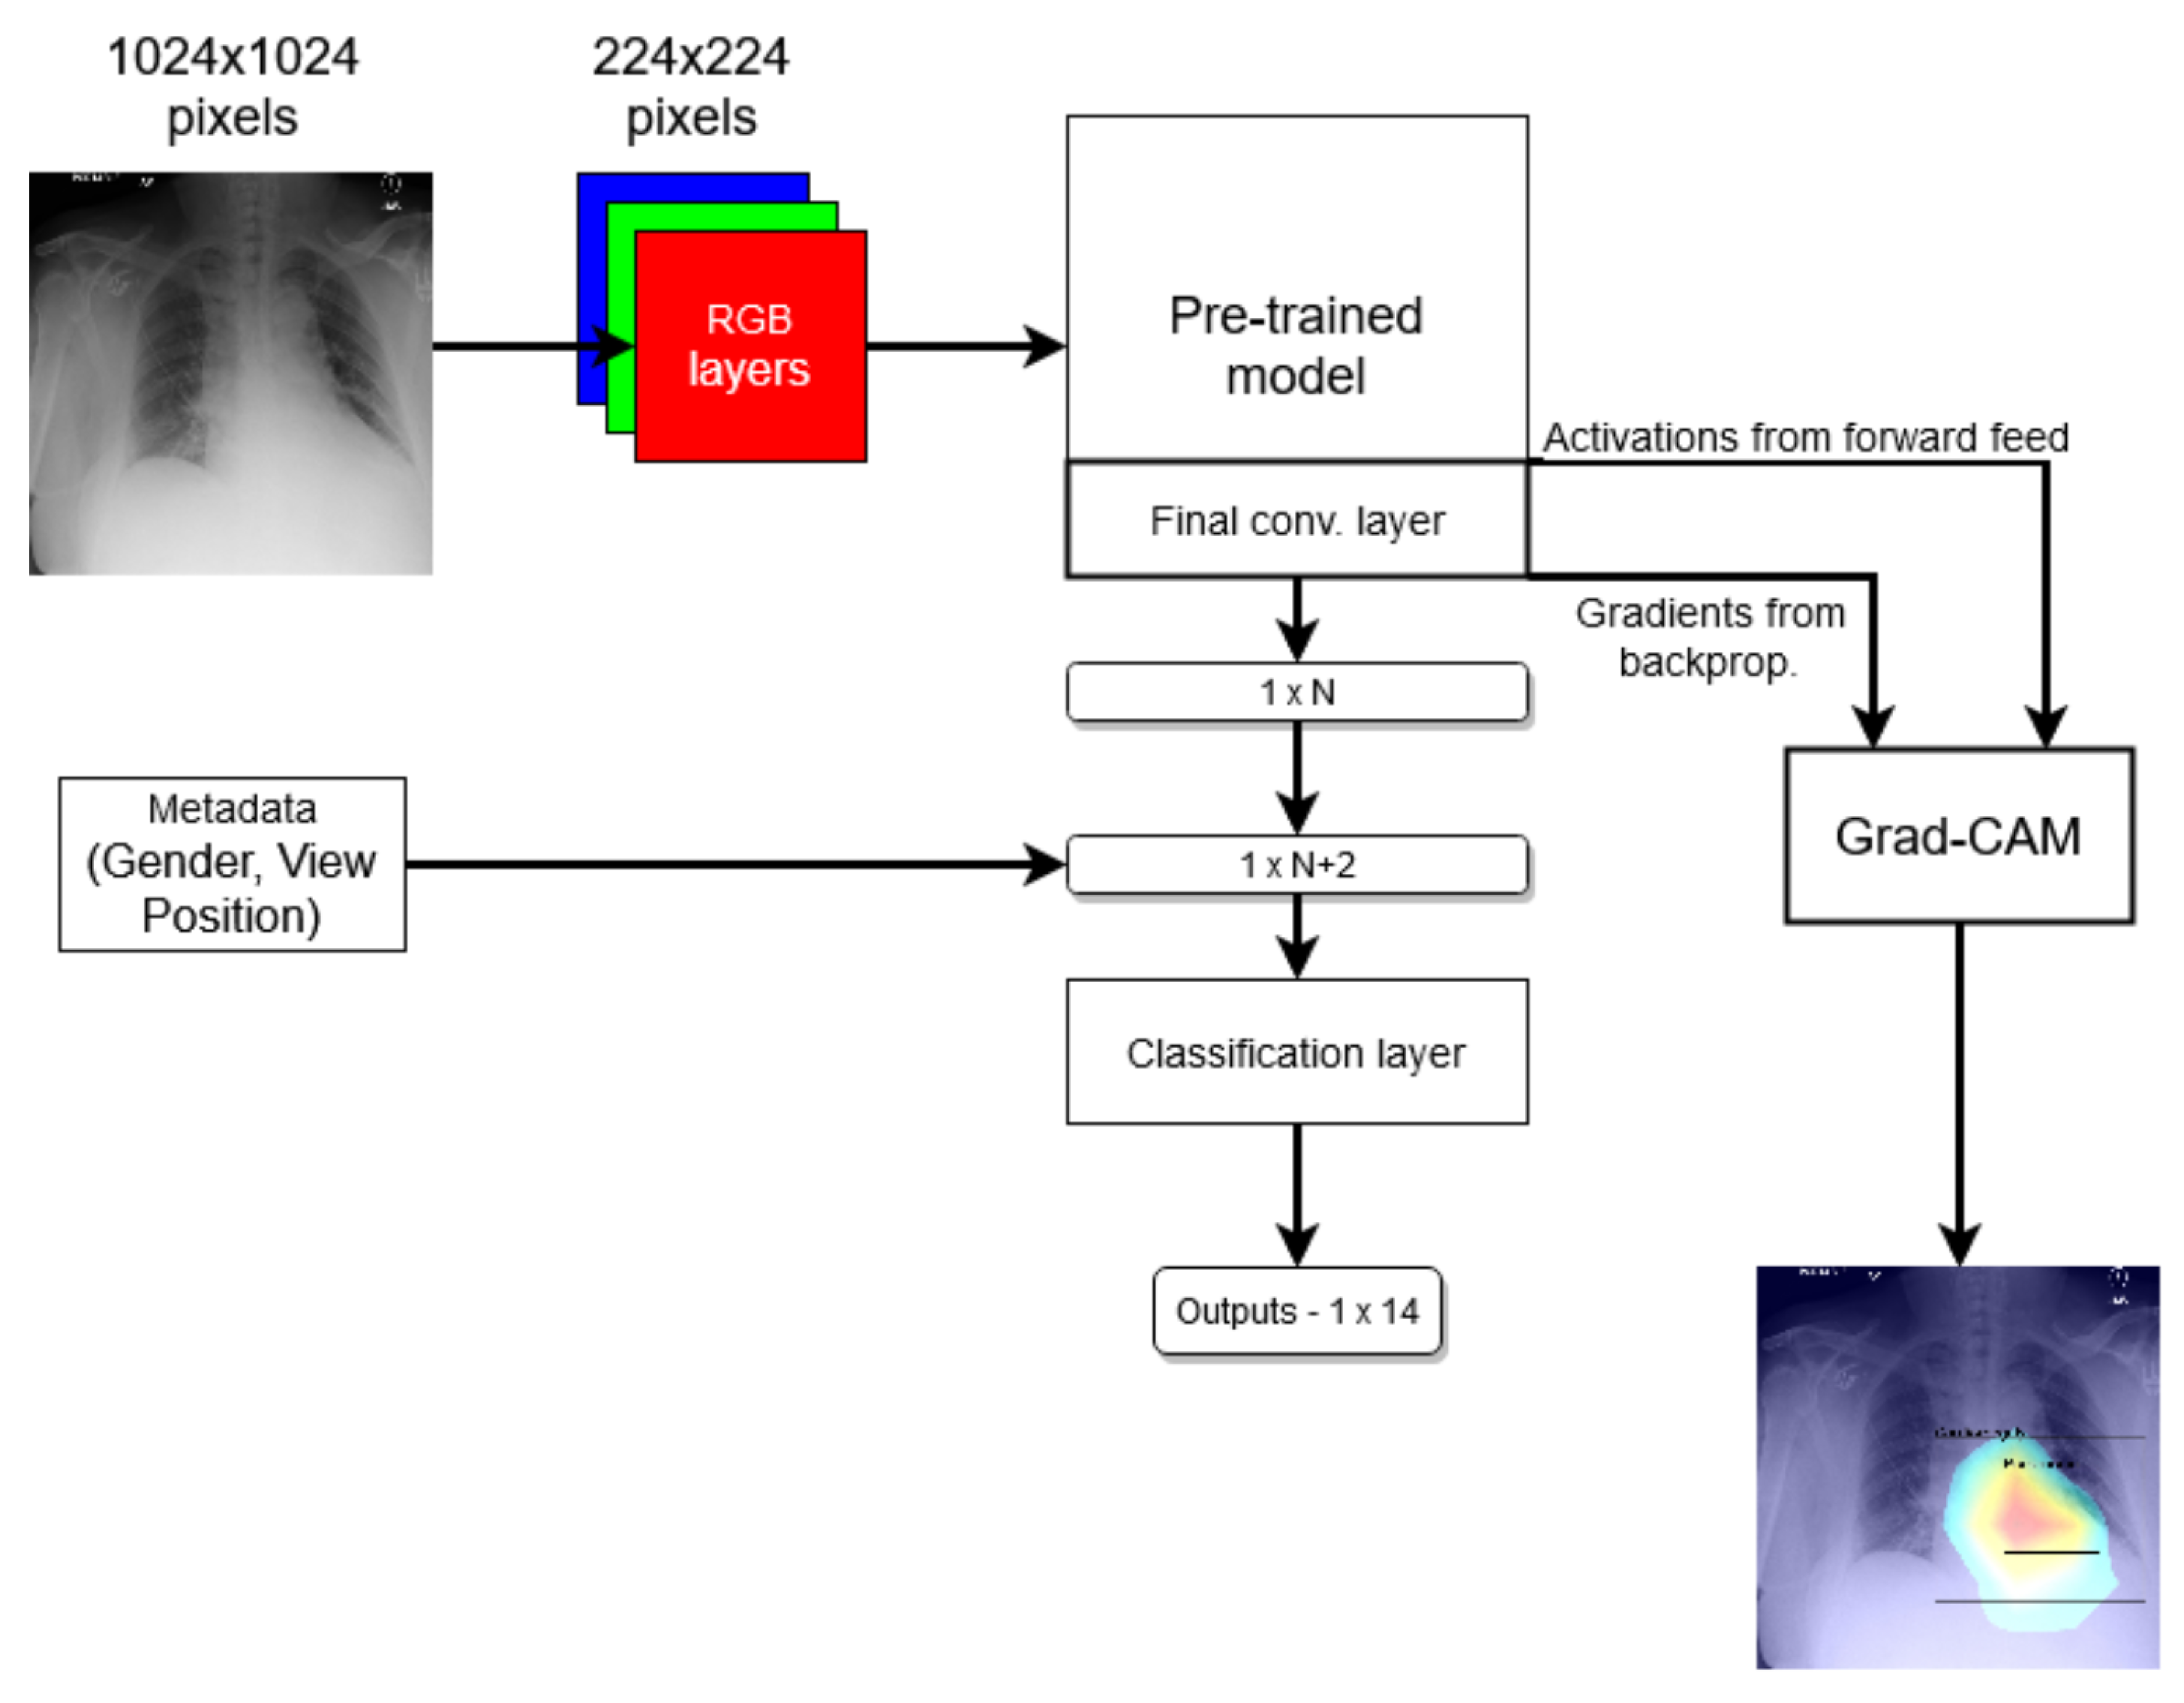
These findings are interesting in the context of the previously discussed AUROC-based comparison. Although the modified model performed better in terms of the former performance measure, that is to say AUROC, here, we found that it is the standard that does a better job in localizing the diseases. The likely explanation for this apparent paradox can be found in the structure of the network that was introduced in Section 3 and shown in Figure 1 and the flow of the metadata information and the manner in which it is used in the backpropagation. In any event, the important lesson to draw here is the same one that pervades the present article: any model must be examined in a variety of different ways and its performance measured using a range of comprehensive metrics and with a keen eye on their clinical significance, and its failure modes must be identified and understood, before any application in the real world is even considered.
Returning to the findings in Table 6 and 
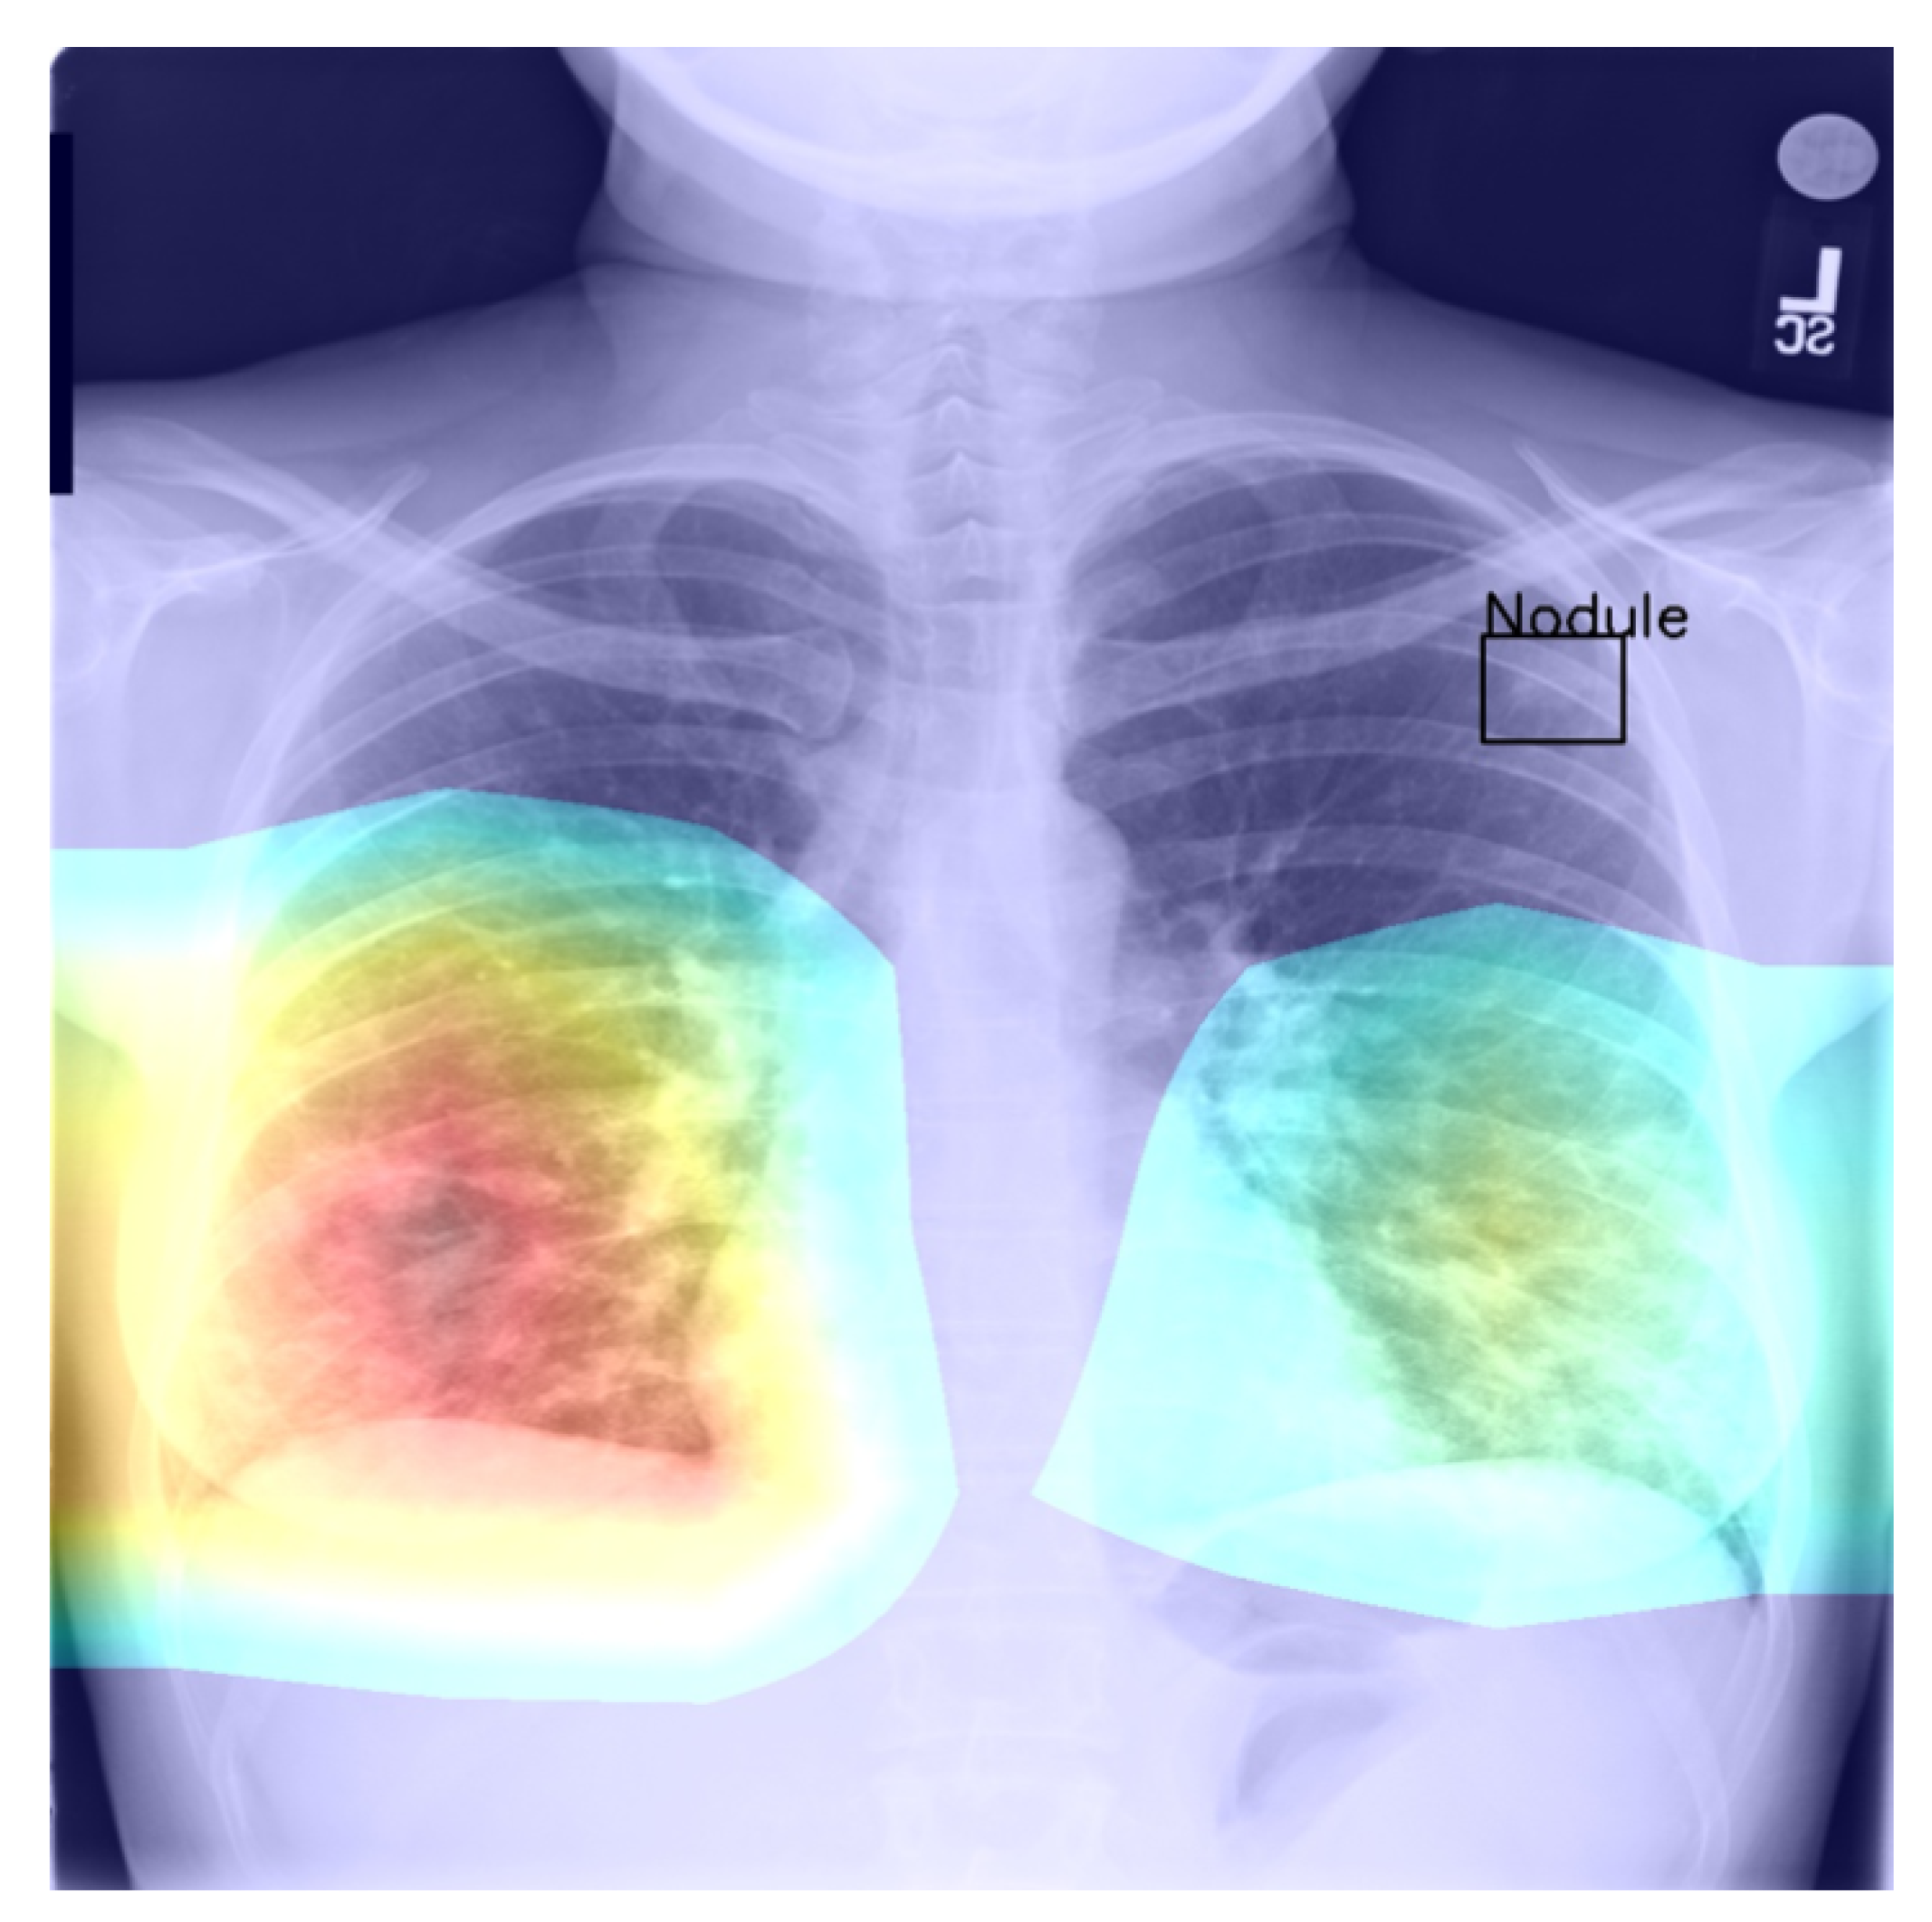
Table 7, it is a concerning fact that the minimum IoU for all classes was found to be zero (an interesting example is shown in Figure 4. In other words, in the case of every class, that is disease, there was at least one instance in which the ground truth bounding box had no intersection with the thresholded saliency heat map. The models did, however, perform rather well in many cases, as indicated by the average scores. To check for potential biases, we measured the Pearson’s correlation coefficient between the number of class instances and the corresponding mean IoU and found it to be −0.265. This is an interesting and perhaps somewhat surprising finding, which should be revisited in future work. On the present evidence, we hypothesise that the more numerous classes exhibited greater variability in appearance presentation, which affected the performance under the IoU measure.
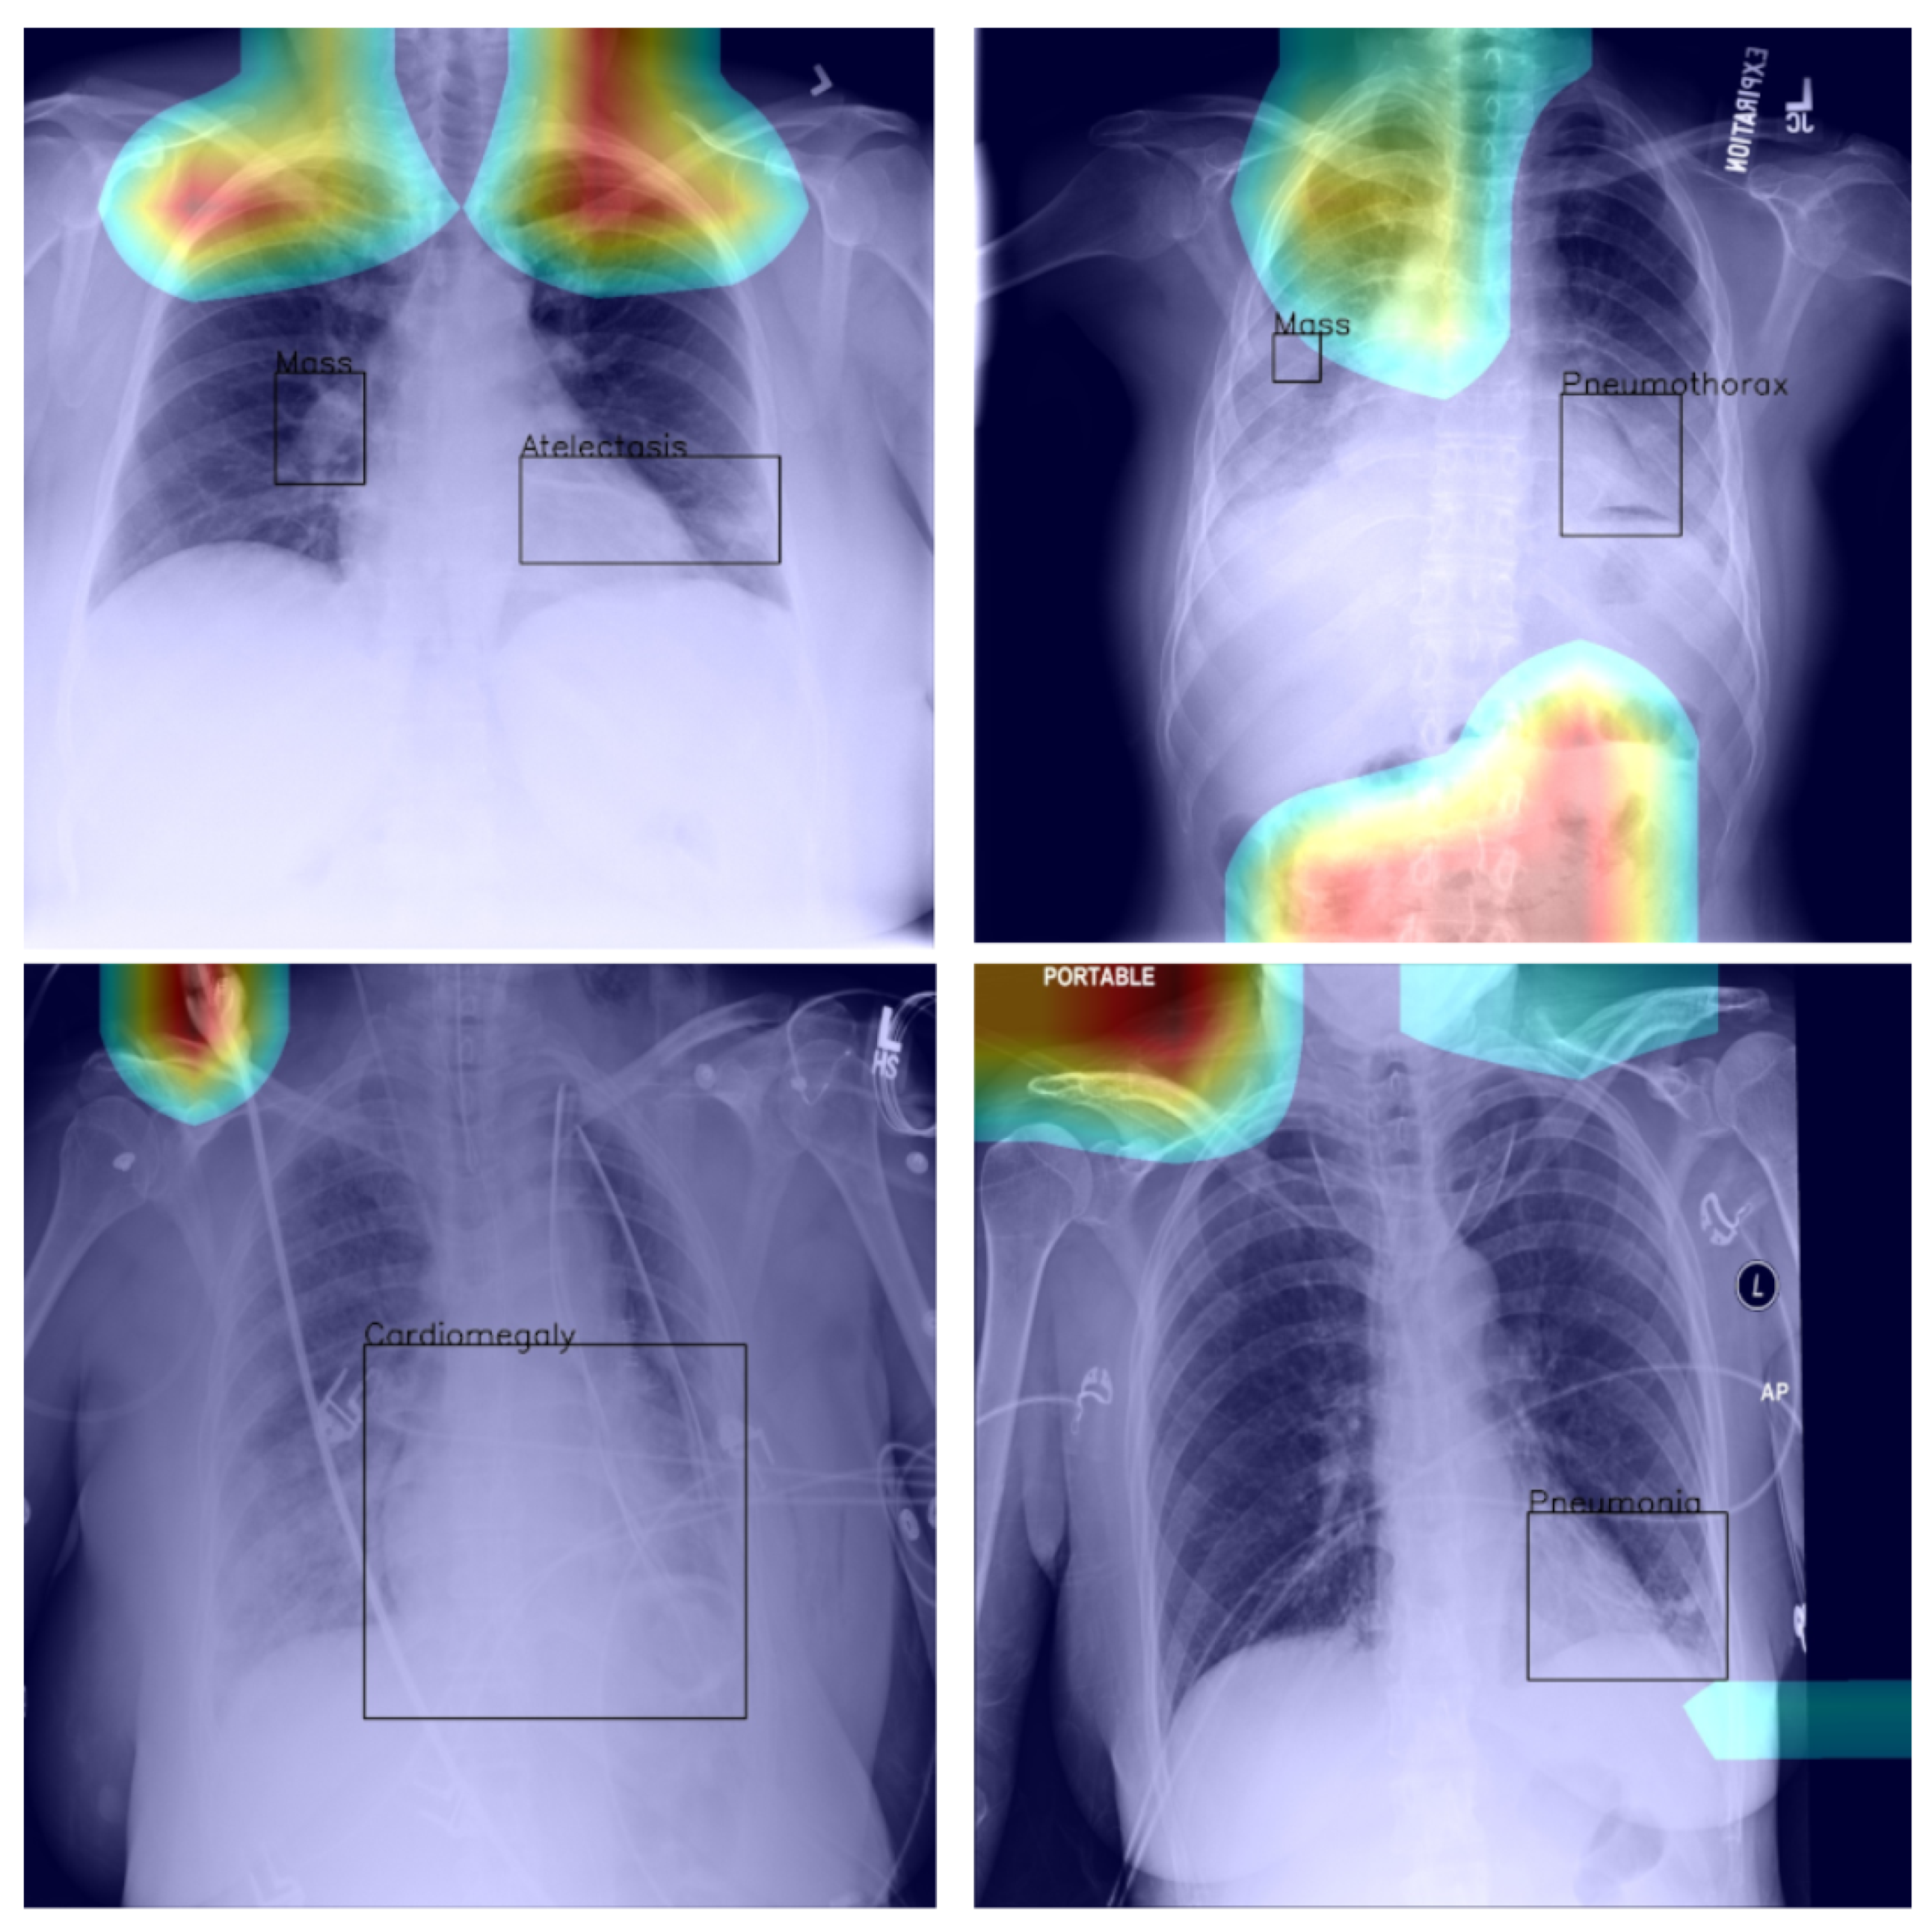
Last but not least, we found that when the heat map is significantly off course, this is often an indicator of there being confounding information—in the sense that it is not inherent information affected by imaging, but rather added by human experts such as radiologists and, as such, being assistive in correct labelling prediction, but misleading in the context of what the method is trying to achieve; see Figure 5—present in an image (e.g., various textual descriptors overlaid on the images). If unnoticed, such information can instil false confidence in the performance of a model. Thus, we were again drawn to make two conclusions and recommendations: it is important that confounds of this kind be explicitly stated, observed, and discussed in any research and that a thorough examination of the data and specific findings be made whenever an algorithm is evaluated.

4.5. General Remarks

In this article, we focused specifically on the methodological assumptions underlying the prevalent approaches to the interpretation of deep-learning-based analysis of chest X-ray images. There are several reasons behind this choice. The most important of these lies in the practical importance of this application itself, a fact also reflected in the already large body of previous work, as discussed in Section 1.
Secondly, the fact that the relevant phenomenology of the problem is well understood makes the desiderata and the potential pitfalls to watch for particularly clear, which is crucial for establishing a reliable and convincing framework needed for the challenging task of studying interpretability.
Notwithstanding the aforementioned focus, the applicability of the findings and the analysis we presented in this paper extend further and are not confined to the application of deep learning to chest X-ray image analysis. The issues we highlighted are readily identified in the use of deep learning in other medical applications, as well as non-medical ones. Perhaps the most fundamental question concerns the very premises of perturbation- and occlusion-based methods [30,31,32,33,34,35] to the determination of saliency and thus explainability, as recently also pointed out by Cooper et al. [27].
Questions such as these are undoubtedly worth further study; meanwhile, caution should be exercised in the making of clinical conclusions based on insufficiently well-understood models.

5. Summary and Conclusions

Computer software already plays an instrumental role in medicine today and will, without a doubt, play an increasingly important part in the future. This observation makes it imperative that the evaluation of such software be performed rigorously and in a manner that is coherent with its intended clinical application. Indeed, serious concerns have already been raised about the real-world performance of medical software, which has previously been reported as successful at the research stage [36]. In this paper, we looked at this issue in some depth, in the realm of X-ray analysis. We found that in most cases, the analysis of the performance reported in research papers is rather poor. In particular, there is an over-reliance on a single metric (or a few metrics). Worse yet, the clinical significance of these metrics is questionable. Thus, we presented a thorough analysis of a pair of leading machine-learning methods for X-ray-image-based diagnosis. We showed that the widely used standards for performance assessment are overly coarse and often misleading and that seemingly similarly performing methods can in clinical practice exhibit major differences. Our analysis highlighted the subtleties involved in the comprehensive analysis of a machine-learning method in this field, potential biases that emerge, as well as the often difficult-to-notice confounding factors. In summary, our work calls for a more nuanced evaluation of newly proposed methods and a more thorough reporting of the associated findings and presents a blueprint for future research efforts.

Author Contributions

Conceptualisation, S.V. and O.A.; methodology, S.V. and O.A.; software, S.V.; validation, S.V.; formal analysis, S.V.; investigation, S.V.; resources, O.A.; writing—original draft preparation, S.V. and O.A.; writing—review and editing, S.V. and O.A.; visualisation, S.V.; supervision, O.A.; project administration, O.A. All authors have read and agreed to the published version of the manuscript.

Funding

This research received no external funding.

Institutional Review Board Statement

Not applicable.

Informed Consent Statement

Not applicable.

Data Availability Statement

The data used in the present article are openly available at the following URL: https://www.kaggle.com/nih-chest-xrays/data (accessed on 4 November 2021).

Conflicts of Interest

The authors declare no conflict of interest.

References

  1. Medizino. Buying a New X-ray Machine—Advice and Offers; Medizino: Austin, TX, USA, 2020. [Google Scholar]
  2. Sistrom, C.L.; McKay, N.L. Costs, Charges, and Revenues for Hospital Diagnostic Imaging Procedures: Differences by Modality and Hospital Characteristics. J. Am. Coll. Radiol. JACR 2005, 2, 511–519. [Google Scholar] [CrossRef]
  3. Cheung, T.; Harianto, H.; Spanger, M.; Young, A.; Wadhwa, V. Low Accuracy and Confidence in Chest Radiograph Interpretation Amongst Junior Doctors and Medical Students. Intern. Med. J. 2018, 48, 864–868. [Google Scholar] [CrossRef]
  4. Satia, I.; Bashagha, S.; Bibi, A.; Ahmed, R.; Mellor, S.; Zaman, F. Assessing the Accuracy and Certainty in Interpreting Chest X-rays in the Medical Division. Clin. Med. 2013, 13, 349–352. [Google Scholar] [CrossRef] [Green Version]
  5. Wang, X.; Peng, Y.; Lu, L.; Lu, Z.; Bagheri, M.; Summers, R.M. ChestX-ray8: Hospital-Scale Chest X-ray Database and Benchmarks on Weakly-Supervised Classification and Localization of Common Thorax Diseases. In Proceedings of the IEEE Computer Society Conference on Computer Vision and Pattern Recognition, Honolulu, HI, USA, 21–26 July 2017; pp. 3462–3471. [Google Scholar]
  6. Baltruschat, I.M.; Nickisch, H.; Grass, M.; Knopp, T.; Saalbach, A. Comparison of Deep Learning Approaches for Multi-Label Chest X-ray Classification. Sci. Rep. 2019, 9, 6381. [Google Scholar] [CrossRef] [Green Version]
  7. Rajpurkar, P.; Irvin, J.; Zhu, K.; Yang, B.; Mehta, H.; Duan, T.; Ding, D.; Bagul, A.; Langlotz, C.; Shpanskaya, K.; et al. CheXNet: Radiologist-Level Pneumonia Detection on Chest X-rays with Deep Learning. arXiv 2017, arXiv:1711.05225. [Google Scholar]
  8. Yao, L.; Poblenz, E.; Dagunts, D.; Covington, B.; Bernard, D.; Lyman, K. Learning to Diagnose from Scratch by Exploiting Dependencies among Labels. arXiv 2017, arXiv:1710.10501. [Google Scholar]
  9. Li, Z.; Wang, C.; Han, M.; Xue, Y.; Wei, W.; Li, L.J.; Li, F.-F. Thoracic Disease Identification and Localization with Limited Supervision. In Proceedings of the IEEE Computer Society Conference on Computer Vision and Pattern Recognition, Salt Lake City, UT, USA, 18–23 June 2018; pp. 8290–8299. [Google Scholar]
  10. Gündel, S.; Grbic, S.; Georgescu, B.; Liu, S.; Maier, A.; Comaniciu, D. Learning to Recognize Abnormalities in Chest X-rays with Location-aware Dense Networks. In Lecture Notes in Computer Science (including Subseries Lecture Notes in Artificial Intelligence and Lecture Notes in Bioinformatics); Springer: Cham, Switzerland, 2019; pp. 757–765. [Google Scholar]
  11. Center for Devices and Radiological Health; Food And Drug Administration. Software as a Medical Device (SAMD): Clinical Evaluation; Technical Report; FDA, Center for Devices and Radiological Health: Silver Spring, MD, USA, 2018. [Google Scholar]
  12. Mandrekar, J.N. Receiver operating characteristic curve in diagnostic test assessment. J. Thorac. Oncol. 2010, 5, 1315–1316. [Google Scholar] [CrossRef] [PubMed] [Green Version]
  13. Cook, N.R. Use and misuse of the receiver operating characteristic curve in risk prediction. Circulation 2007, 115, 928–935. [Google Scholar] [CrossRef] [PubMed] [Green Version]
  14. Dimitriou, N.; Arandjelović, O.; Harrison, D.J.; Caie, P.D. A principled machine learning framework improves accuracy of stage II colorectal cancer prognosis. NPJ Digit. Med. 2018, 1, 1–9. [Google Scholar] [CrossRef] [Green Version]
  15. Barracliffe, L.; Arandjelović, O.; Humphris, G. A pilot study of breast cancer patients: Can machine learning predict healthcare professionals’ responses to patient emotions. In Proceedings of the International Conference on Bioinformatics and Computational Biology, Honolulu, HI, USA, 20–22 March 2017; pp. 20–22. [Google Scholar]
  16. Gavriel, C.G.; Dimitriou, N.; Brieu, N.; Nearchou, I.P.; Arandjelović, O.; Schmidt, G.; Harrison, D.J.; Caie, P.D. Assessment of Immunological Features in Muscle-Invasive Bladder Cancer Prognosis Using Ensemble Learning. Cancers 2021, 13, 1624. [Google Scholar] [CrossRef]
  17. Birkett, C.; Arandjelović, O.; Humphris, G. Towards objective and reproducible study of patient-doctor interaction: Automatic text analysis based VR-CoDES annotation of consultation transcripts. In Proceedings of the 2017 39th Annual International Conference of the IEEE Engineering in Medicine and Biology Society (EMBC), Jeju, Korea, 11–15 July 2017; pp. 2638–2641. [Google Scholar]
  18. Jones, C.M.; Athanasiou, T. Summary receiver operating characteristic curve analysis techniques in the evaluation of diagnostic tests. Ann. Thorac. Surg. 2005, 79, 16–20. [Google Scholar] [CrossRef]
  19. Huang, G.; Liu, Z.; Van Der Maaten, L.; Weinberger, K.Q. Densely Connected Convolutional Networks. In Proceedings of the IEEE Computer Society Conference on Computer Vision and Pattern Recognition, Honolulu, HI, USA, 21–26 July 2017; Volume 2017, pp. 2261–2269. [Google Scholar]
  20. Deng, J.; Dong, W.; Socher, R.; Li, L.J.; Li, K.; Li, F.-F. ImageNet: A Large-Scale Hierarchical Image Database. In Proceedings of the IEEE Computer Society Conference on Computer Vision and Pattern Recognition, Miami, FL, USA, 20–25 June 2009; pp. 248–255. [Google Scholar]
  21. Zhou, B.; Khosla, A.; Lapedriza, A.; Oliva, A.; Torralba, A. Learning Deep Features for Discriminative Localization. In Proceedings of the IEEE Computer Society Conference on Computer Vision and Pattern Recognition, Las Vegas, NV, USA, 27–30 June 2016; pp. 2921–2929. [Google Scholar]
  22. Selvaraju, R.R.; Das, A.; Vedantam, R.; Cogswell, M.; Parikh, D.; Batra, D. Grad-CAM: Why did you say that? arXiv 2016, arXiv:1611.07450. [Google Scholar]
  23. Boone, D.; Mallett, S.; Zhu, S.; Yao, G.L.; Bell, N.; Ghanouni, A.; von Wagner, C.; Taylor, S.A.; Altman, D.G.; Lilford, R.; et al. Patients’ & Healthcare Professionals’ Values Regarding True-& False-Positive Diagnosis when Colorectal Cancer Screening by CT Colonography: Discrete Choice Experiment. PLoS ONE 2013, 8, e80767. [Google Scholar]
  24. Schwartz, L.M. US Women’s Attitudes to False Positive Mammography Results and Detection of Ductal Carcinoma in Situ: Cross Sectional Survey. BMJ 2000, 320, 1635–1640. [Google Scholar] [CrossRef] [Green Version]
  25. Oakden-Rayner, L. Exploring the ChestXray14 Dataset: Problems. 2017. Available online: https://lukeoakdenrayner.wordpress.com/2017/12/18/the-chestxray14-dataset-problems/ (accessed on 4 November 2021).
  26. Tun, W.; Arandjelović, O.; Caie, P.D. Using machine learning and urine cytology for bladder cancer prescreening and patient stratification. In Proceedings of the Workshops at the AAAI, New Orleans, LA, USA, 2–7 February 2018; pp. 2–7. [Google Scholar]
  27. Cooper, J.; Arandjelović, O.; Harrison, D. Believe the HiPe: Hierarchical Perturbation for Fast and Robust Explanation of Black Box Models. arXiv 2021, arXiv:2103.05108. [Google Scholar]
  28. Derpanis, K.G. The bhattacharyya measure. Mendeley Comput. 2008, 1, 1990–1992. [Google Scholar]
  29. Beykikhoshk, A.; Arandjelović, O.; Phung, D.; Venkatesh, S. Discovering topic structures of a temporally evolving document corpus. Knowl. Inf. Syst. 2018, 55, 599–632. [Google Scholar] [CrossRef] [Green Version]
  30. Zhang, J.; Bargal, S.A.; Lin, Z.; Brandt, J.; Shen, X.; Sclaroff, S. Top-down neural attention by excitation backprop. Int. J. Comput. Vis. 2018, 126, 1084–1102. [Google Scholar] [CrossRef] [Green Version]
  31. Petsiuk, V.; Das, A.; Saenko, K. Rise: Randomized input sampling for explanation of black-box models. arXiv 2018, arXiv:1806.07421. [Google Scholar]
  32. Fong, R.; Patrick, M.; Vedaldi, A. Understanding deep networks via extremal perturbations and smooth masks. In Proceedings of the IEEE/CVF International Conference on Computer Vision, Seoul, Korea, 27–28 October 2019; pp. 2950–2958. [Google Scholar]
  33. Springenberg, J.T.; Dosovitskiy, A.; Brox, T.; Riedmiller, M. Striving for simplicity: The all convolutional net. arXiv 2014, arXiv:1412.6806. [Google Scholar]
  34. Simonyan, K.; Vedaldi, A.; Zisserman, A. Deep inside convolutional networks: Visualising image classification models and saliency maps. In Proceedings of the Workshop at International Conference on Learning Representations, Banff, AB, Canada, 14–16 April 2014. [Google Scholar]
  35. Selvaraju, R.R.; Cogswell, M.; Das, A.; Vedantam, R.; Parikh, D.; Batra, D. Grad-cam: Visual explanations from deep networks via gradient-based localization. In Proceedings of the IEEE International Conference on Computer Vision, Venice, Italy, 22–29 October 2017; pp. 618–626. [Google Scholar]
  36. Morley, J.; Floridi, L.; Goldacre, B. The poor performance of apps assessing skin cancer risk. BMJ 2020, 368, m428. [Google Scholar] [CrossRef] [PubMed]
Figure 1. Coarse structure of the baseline neural network model.
Sci 04 00003 g001
Figure 2. Image labelled as “Pneumothorax” after it has been treated by a drain tube.
Sci 04 00003 g002
Figure 3. Frequency of the highest activation mean.
Sci 04 00003 g003
Figure 4. Example of a high-confidence correct label identification, despite the entirely incorrect disease localisation.
Sci 04 00003 g004
Figure 5. Examples of confounding information unwittingly aiding inference.
Sci 04 00003 g005
Table 1. The distribution of automatically extracted labels associated with the images in the ChestX-ray8 data corpus.
LabelOccurrences (Number)Frequency (%)
Normal60,36153.84
Infiltration19,89417.74
Effusion13,31711.88
Atelectasis11,55910.31
Nodule63315.65
Mass57825.16
Pneumothorax53024.73
Consolidation46674.16
Pleural Thickening33853.02
Cardiomegaly27762.48
Emphysema25162.24
Oedema23032.05
Fibrosis16861.50
Pneumonia14311.28
Hernia2270.20
Table 2. Comparison of the standard and modified models using the standard AUROC score, per label and overall. Bold font indicates the better-performing method for a specific label/diagnosis.
LabelModified ModelStandard Model
Atelectasis0.7630.768
Cardiomegaly0.8750.887
Consolidation0.7490.749
Oedema0.8460.835
Effusion0.8220.830
Emphysema0.8950.873
Fibrosis0.8160.818
Hernia0.9370.896
Infiltration0.6940.697
Mass0.8200.814
Nodule0.7470.739
Pleural Thickening0.7630.762
Pneumonia0.7140.708
Pneumothorax0.8400.829
Average0.8060.800
Table 3. Coarse model comparison.
ModelSpecificitySensitivityAccuracyDOR
Standard0.7410.7260.7419.56
Modified0.7180.7510.72010.63
Table 4. Mean model loss dependency on the number of labels per image.
N012345678
Loss0.0550.2060.3460.4910.6470.8270.9561.1341.353
Count98617992502119585721523181
Table 5. Mean activation of “Consolidation” for single-label images, across different ground truth target labels.
ClassMean Activation
Atelectasis0.134
Cardiomegaly0.023
Consolidation0.084
Oedema0.075
Effusion0.244
Emphysema0.011
Fibrosis0.006
Hernia<0.001
Infiltration0.272
Mass0.061
Nodule0.050
Pleural Thickening0.024
Pneumonia0.025
Pneumothorax0.019
Table 6. Intersection-over-union (IoU)-quantified assessment of the standard model’s localisation of the disease presentation.
LabelMeanSTDMaxMinCase Count
Atelectasis0.0960.1040.5140180
Cardiomegaly0.5510.1400.7580146
Effusion0.1270.1090.5190153
Infiltration0.1400.1730.6970123
Mass0.0990.1320.574085
Nodule0.0130.0160.067079
Pneumonia0.1510.1600.6170120
Pneumothorax0.0790.1040.435098
Average0.1570.1170.5220
Table 7. IoU-quantified assessment of the modified model’s localisation of the disease presentation.
LabelMeanSTDMaxMinCase Count
Atelectasis0.0290.0460.2070180
Cardiomegaly0.5120.1730.7230146
Effusion0.0710.0750.3090153
Infiltration0.1610.1630.6320123
Mass0.0760.1090.415085
Nodule0.0320.0390.173079
Pneumonia0.0150.0410.2900120
Pneumothorax0.0740.1100.588098
Average0.1210.0940.4170
Publisher’s Note: MDPI stays neutral with regard to jurisdictional claims in published maps and institutional affiliations.

