Article

Evaluation of Dissolution Enhancement of Aprepitant Drug in Ternary Pharmaceutical Solid Dispersions with Soluplus® and Poloxamer 188 Prepared by Melt Mixing

by
Stavroula Nanaki
1,
Rodanthi Maria Eleftheriou
1,
Panagiotis Barmpalexis
2,
Margaritis Kostoglou
3,
Evangelos Karavas
4 and
Dimitrios Bikiaris
1,*
1
Laboratory of Polymer Chemistry and Technology, Department of Chemistry, Aristotle University of Thessaloniki, 54124 Thessaloniki, Region of Central Macedonia, Greece
2
Department of Pharmaceutical Technology, School of Pharmacy, Aristotle University of Thessaloniki, 54124 Thessaloniki, Region of Central Macedonia, Greece
3
Laboratory of General and Inorganic Chemical Technology, Department of Chemistry, Aristotle University of Thessaloniki, GR-541 24 Thessaloniki, Greece
4
Pharmathen S.A., Pharmaceutical Industry, Dervenakion Str 6, Pallini Attikis, GR-15351 Attiki, Greece
*
Author to whom correspondence should be addressed.
Submission received: 27 January 2019 / Accepted: 23 February 2019 / Published: 15 August 2019

Abstract

:
In the present study Aprepitant (APT) ternary solid dispersions (SDs) were developed and evaluated for the first time. Specifically, ternary SDs of APT with Poloxamer 188 and Soluplus® (SOL) were prepared via melt mixing and compared to binary APT/Poloxamer 188 and APT/SOL SDs. Initially, combined thermo-gravimetric and hot-stage polarized light microscopy studies indicated that all tested compounds were thermally stable up to 280 °C, while Poloxamer 188 acted as a plasticizer to SOL by significantly reducing the temperature required to fully solubilize the API during SD preparation. Differential scanning calorimetry combined with wide angle X-ray diffraction studies showed that crystalline API was dispersed in both binary and ternary SDs, while Fourier transformation-infrared spectroscopy studies revealed no molecular interactions among the components. Scanning electron microscopy combined with EDAX element analysis showed that the API was dispersed in nano-scale within the polymer matrices, while increasing APT content led to increasing API nano-crystals within the SDs. Finally, dissolution studies showed that the prepared formulations enhanced dissolution of Aprepitant and its mechanism analysis was further studied. A mathematical model was also investigated to evaluate the drug release mechanism.

1. Introduction

Aprepitant (APT), with a chemical name of 5-(((2R,3S)-2-((1R)-1-(3,5-bis(trifluoromethyl) phenyl) ethoxy)-3-(4-fluorophenyl) – 4 morpholinyl) methyl) -1,2 -dihydro-3H -1,2,4 -triazol-3-one, is an antiemetic Active Pharmaceutical Ingredient (API) used for the treatment of chemotherapy induced emesis, nausea and vomiting as well as postoperative nausea and vomiting [1,2]. It is a selective antagonist of human substance P/neurokinin 1 (NK1) receptors with little or no affinity for serotonin (5-HT3), dopamine and corticosteroid receptors [3,4,5]. It is a lipophilic compound supplied in the form of a white to off-white crystalline solid powder with pKa value of 9.7 within the pH range 2 to 12. It is considered as practically insoluble in water with low free base aqueous solubility of (3–7 μg/mL) over the physiological pH range [6,7,8]. In vivo absorption of APT through first pass metabolism leads to low bioavailability while the API is considered as having intermediate permeability across Caco2 [9,10]. Hence, APT is categorized as a BCS class IV drug with low aqueous solubility being the rate limiting step for API’s poor gastrointestinal absorption [6,11,12,13].
Various attempts have been proposed for improving APT’s low in vivo bioavailability by enhancing API’s poor aqueous solubility. Among them, the marketed (under the trade name of Emend®) pharmaceutical product utilizes a media nano-milling approach for preparing a hard gelatin capsule containing an effective APT nano-composition at several dosing strengths (40 mg, 80 mg and 125 mg) [6]. Other attempts include the preparation of cyclodextrin complexes [14], nanoparticles [15], liquisolid formulations [16], solid pre-concentrated microemulsions [6] and solid dispersions (SD) [17,18,19,20,21,22,23,24].
Among all above mentioned approaches the preparation of APT SDs seems to be the simplest and most cost effective approach, especially when a temperature-based method such as melt-mixing or hot-melt extrusion (HME) is applied. Temperature-based methods for the preparation of SDs present several advantages compared to alternatives, such as being environmentally friendly (solvent and dust free), process-efficient (continuous processing) etc. [25,26,27,28,29,30,31,32,33,34]. In such systems, thermoplastic matrix forming polymers are co-melted/cooled with API(s) in order to prepare several types of solid formulations, including eutectic mixtures, micro- or nano-sized crystalline (or semi-crystalline) solid dispersions or solid solutions (substitutional, interstitial or amorphous) [28,29,35,36,37,38]. However, despite the large number of studies published on SDs, only a limited number of products have been introduced into the market [35,37,39]. This scarcity can be attributed to several limitations including problems in reproducibility and scaling up of the manufacturing process, or issues related to the physical stability and the in vivo behavior [39]. In all cases, one of the most significant reasons for these observed limitations is the fact that the majority of the published and ongoing research is still handling preliminary proof of concept trials based on binary SD systems
In binary SDs an API matrix system is usually developed by dispersing the API on a single thermoplastic matrix forming carrier, which, in most cases, is a polymer or a copolymer. On the contrary, in a more realistic product development scenario ternary (or higher) SDs having instead of the two said components (i.e., an API and a polymer) a third component with multi-functionality (such as matrix forming, plasticizing, crystallization inhibiting and dissolution rate enhancing abilities) are usually needed [40,41,42,43,44,45,46,47,48,49,50]. When designing such multi-component SDs the complexity of formulation development increases by much, since several factors, including the selection of appropriate polymer/additive composition and the synergistic/antagonistic effects of all components, are introduced into the system.
Therefore, the present study attempts to extent the prior preliminary efforts made for the preparation of an effective APT SD system. Specifically, an in-depth evaluation of the binary SD of APT with Soluplus® (an amphiphilic copolymer and solubilizer), recently studied by several different research groups [18,19,20,21], with the addition of a surface active compound like Poloxamer 188, a nonionic polyoxyethylene–polyoxypropylene copolymer widely used as an additive in temperature-based SD preparation methods [48,49,51,52,53], and the preparation of ternary APT-based SD systems, are being evaluated for the first time. One additional advantage of our study is that these solid dispersions have been prepared my melt extrusion procedure, which is a new technique applied in pharmaceutical technology. According to this technique solid dispersions can be prepared in very short time, compared with traditional techniques like solvent evaporation.

2. Materials and Methods

2.1. Materials

Aprepitant (APT) (Scheme 1) was obtained from Dr. Reddy’s Laboratories Ltd. (Hyderabad, Telangana, India), while Soluplus® (SOL) a polyvinyl caprolactam–polyvinyl acetate–polyethylene glycol graft copolymer with a molecular weight of 118,000, moisture content of 2.6% (measured by thermogravimetric analysis, TGA), and bulk density 500–600 kg/m3 and Poloxamer 188 (Lutrol micro 68) with a molecular weight of 7680–9510 gmol−1 and 80.5% of poly-oxy-ethylene group were supplied by BASF Co. (Ludwigshafen, Germany). All the other materials and reagents were of analytical grade and purity.

2.2. Preparation of SD via Melt Mixing

Pre-weighed (a total of 10 g) binary (APT/Poloxamer 188 and APT/SOL) and ternary (APT/SOL/Poloxamer 188) SDs were prepared via melt mixing using a Haake-Buchler Reomixer (Model 600, Vreden, Germany) with roller blades. Table 1 summarizes the sample compositions and the melt mixing parameters employed during the SD preparation.
Before melt mixing SOL and Poloxamer 188 were dried for 24 h. In order to achieve optimum API to matrix dispersion the components (either in binary or in ternary mixtures) were physically premixed before being fed into the reomixer. During sample mixing the employed temperature in the melt reomixer was continuously monitored and maintained constant. All prepared SDs after preparation were milled and placed in desiccators at room temperature (25 °C) in order to prevent moisture absorption. Based on Emend® SmPC there are several capsule strengths starting from 40 mg/dose up to 125 mg/dose. Hence, in the case of 90/10 SD the lowest total dose weight will be 360 mg and the highest total dose will be 1125 mg, quantities that are acceptable for per os administration.

2.3. Characterization of SD

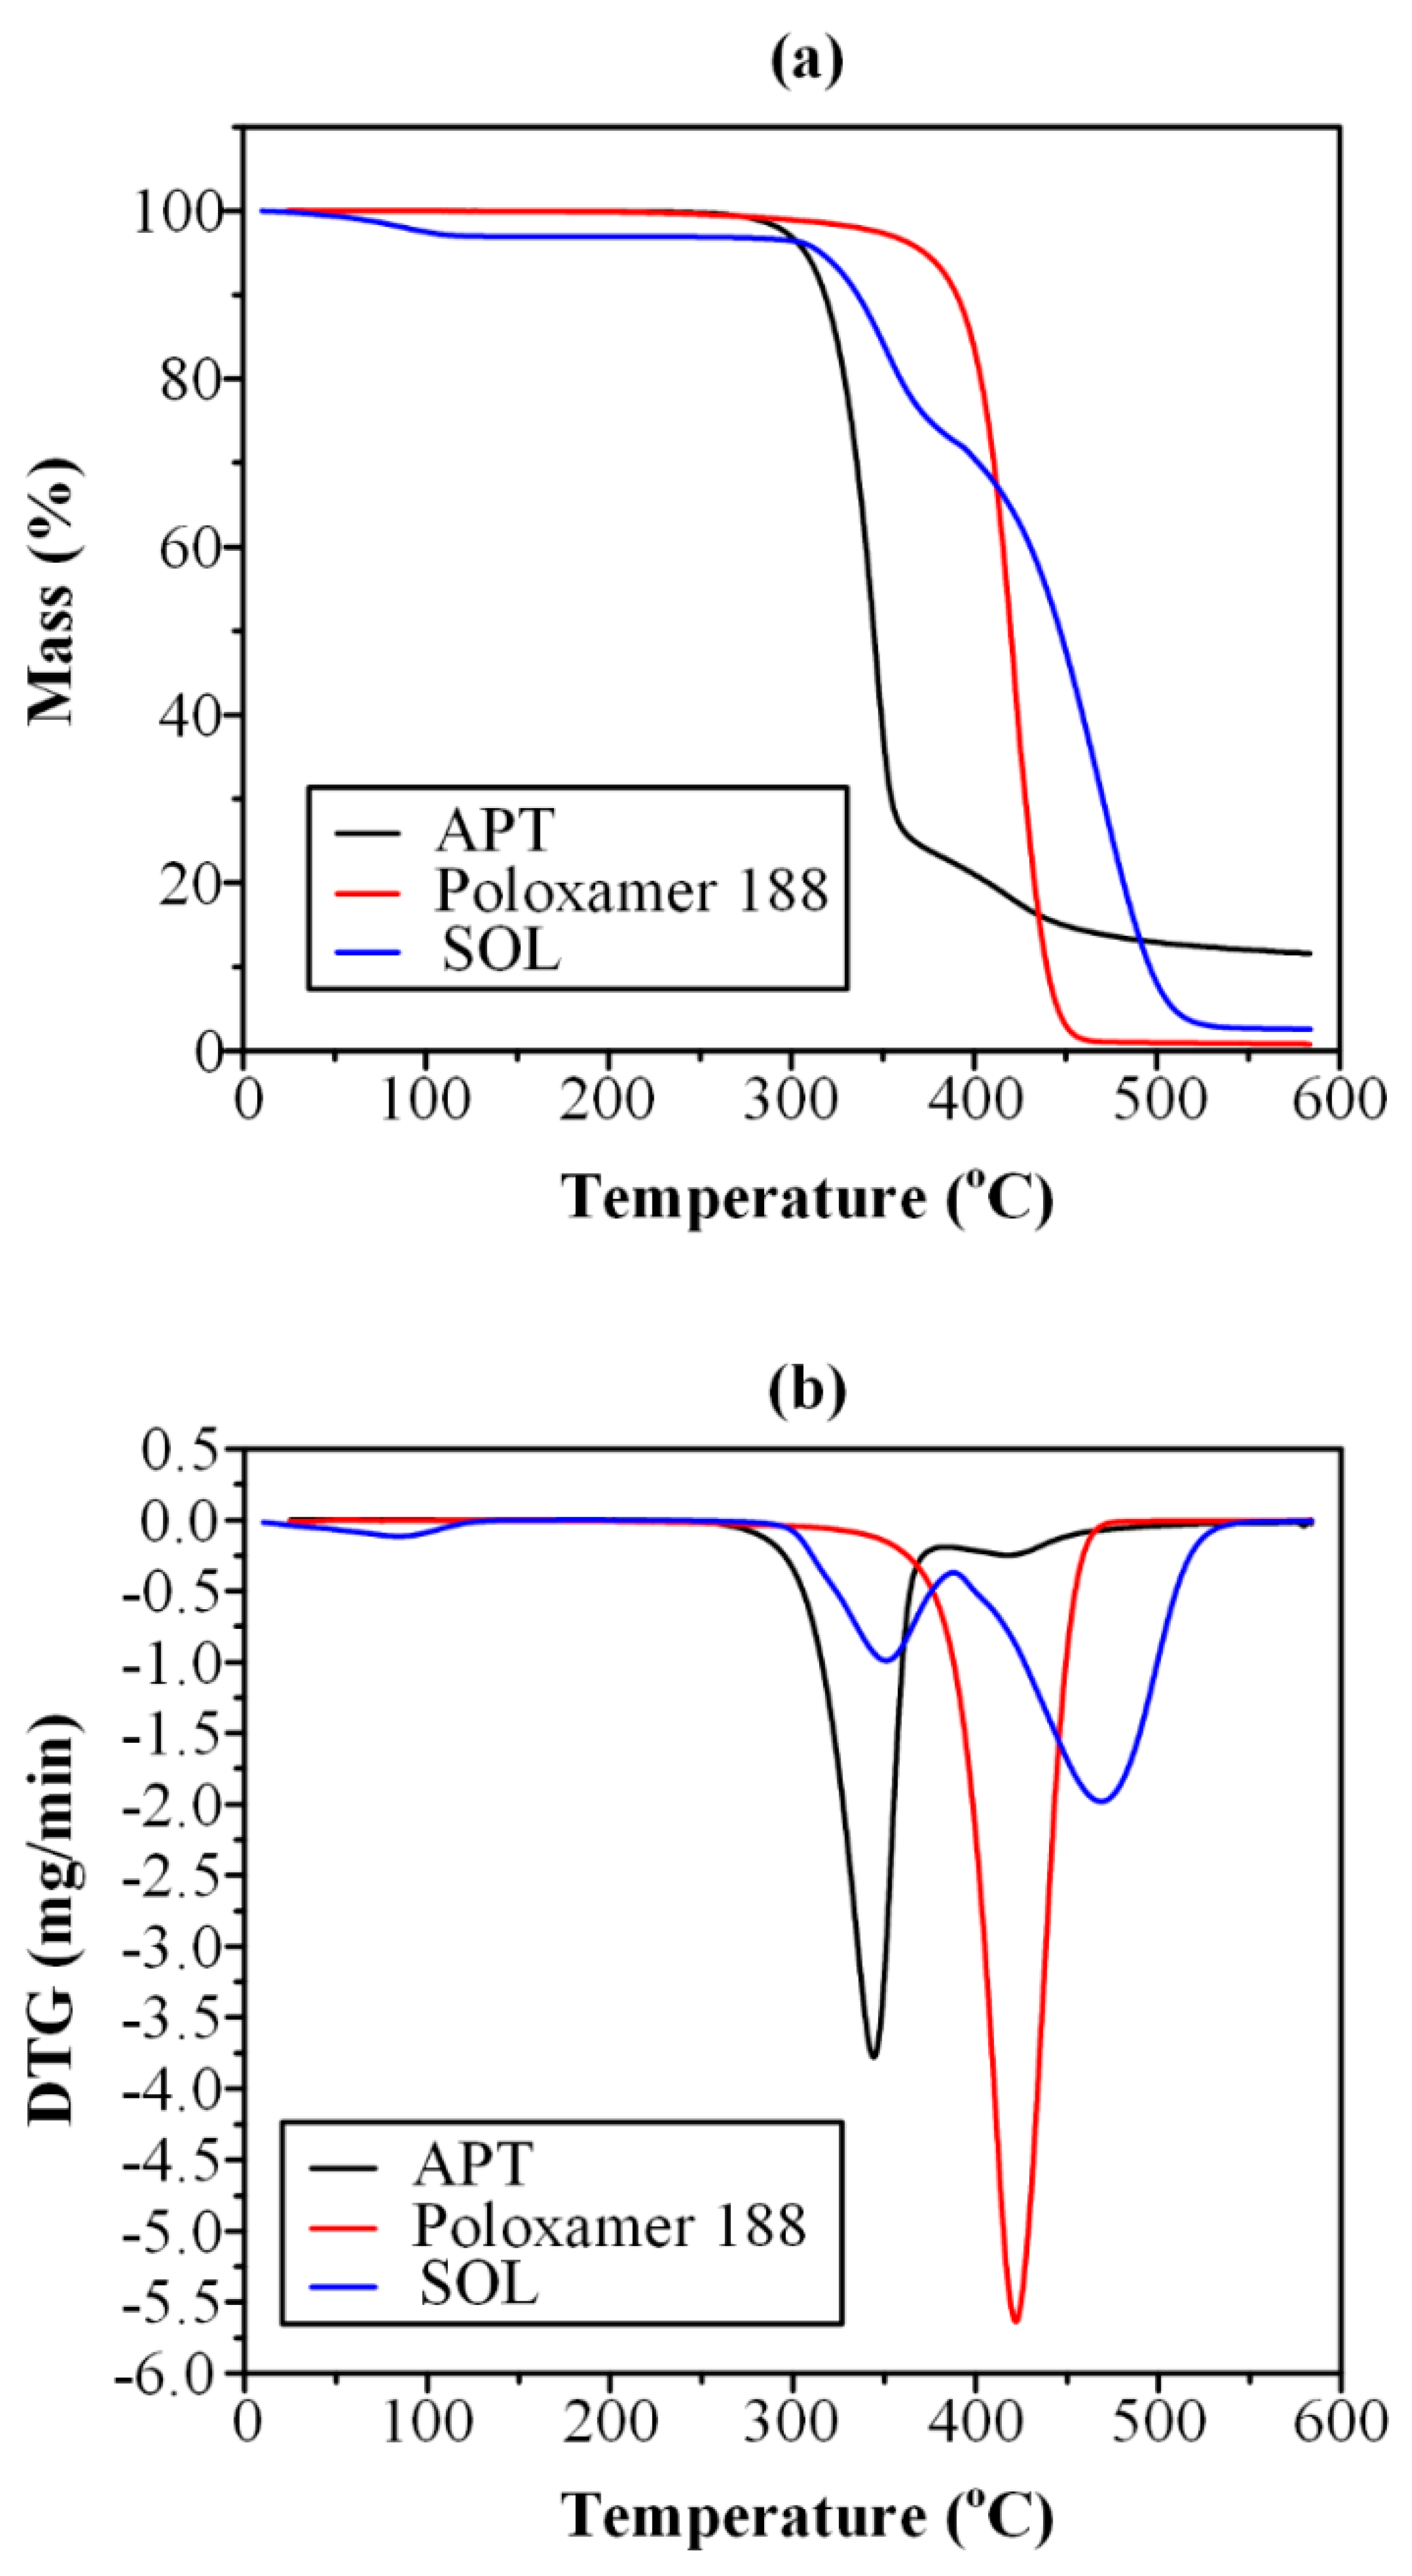
2.3.1. Thermo-Gravimetric Analysis (TGA)

The thermal degradation of APT and the selected polymeric matrix formers (SOL and Poloxamer 188) was studied with the aid of a SETARAM SETSYS TG-DTA 16/18 equipment (Setaram Instrumentation, Caluire, France). Accurately weighted samples (6.0 ± 0.2 mg) were placed in appropriate alumina crucibles and heated at heating rate of 10 °C/min from ambient temperature to 580 °C under inert atmosphere (N2 with a 50 mL/min flow). Continuous recordings of sample temperature, sample weight and first derivative were obtained.

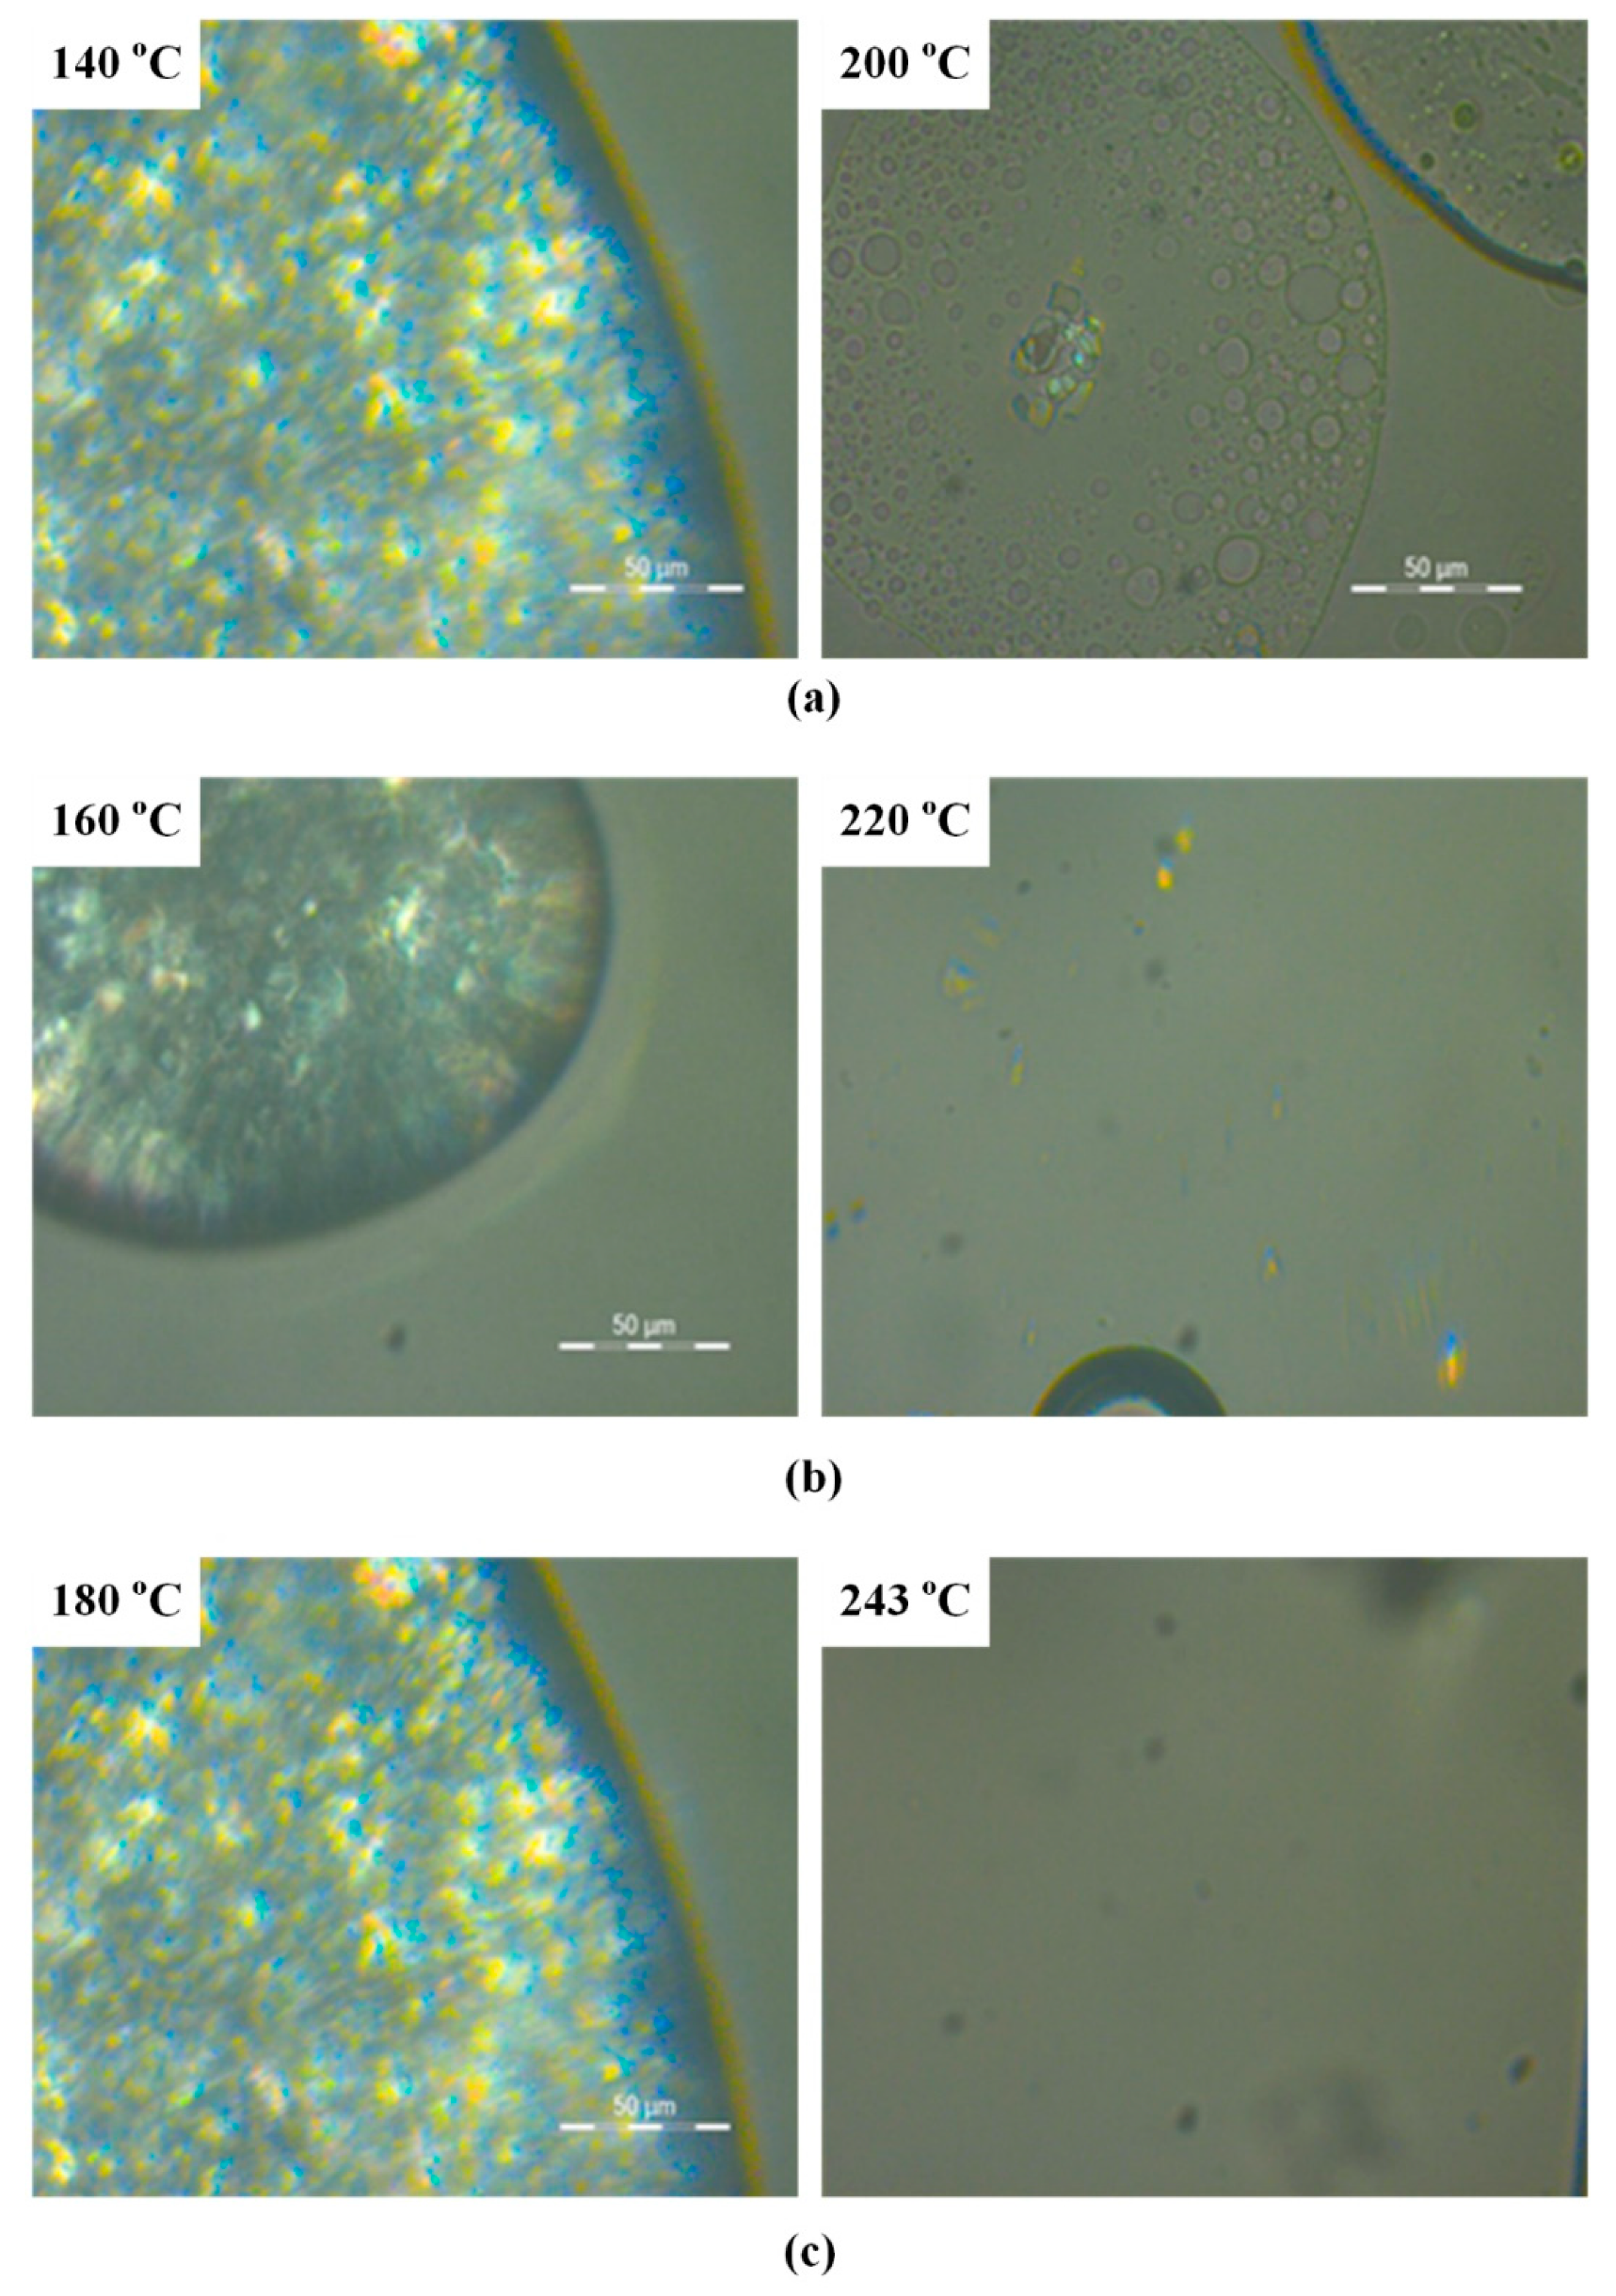
2.3.2. Hot Stage Polarized Light Microscopy (HSM)

In order to evaluated the proper melt mixing temperature during the preparation of the binary and ternary SDs, preliminary HSM experiments were conducted. Specifically, physical mixtures of samples were tested using a Linkam THMS600 (Linkam Scientific Instruments Ltd., Surrey, UK) heating stage mounted on Olympus BX41 polarized light microscope, controlled through a Linkam TP91 (Linkam Scientific Instruments Ltd., Surrey, UK) temperature controller. Samples were heated with a rate of 20 °C/min and the physical changes during heating of the binary or ternary mixtures were videotaped with a Jenoptik ProgRes C10Plus color video camera (JENOPTIK Optical Systems GmbH, Jena, Germany) with the Capture Pro 2.1 software directly attached to the microscope.

2.3.3. Differential Scanning Calorimetry (DSC)

Binary and ternary SD thermal properties were evaluated via DSC with the aid of a Perkin-Elmer Pyris Diamond DSC (PerkinElmer Corporation, Waltham, MA, USA) calibrated with high-purity indium and zinc standards. Accurately weighted samples of 10.0 ± 1.0 mg were sealed in appropriated aluminum pans and measured in a cyclic scanning procedure. Specifically, the samples were heated till 270 °C at a heating rate of 20 °C/min, remained at that temperature for 2 min in order to erase any thermal history and remove moisture, and then quench cooled to −25 °C, remained at that temperature for 3 min and scanned again up to 270 °C with a heating rate of 10 °C/min. An empty alumina crucible was used as reference. Constant nitrogen flow with a flow rate of 20 mL/min was employed within the DSC cell during all measurements.

2.3.4. Wide Angle X-ray Diffractometry (WAXD)

The crystal properties of pure components (APT, SOL and Poloxamer 188) along with binary and ternary SDs were evaluated by WAXD studies. Specifically, powder X-ray diffraction measurements of samples were performed using Rigaku Mini Flex 600 (Rigaku Co., Tokyo, Japan) with Bragg–Brentano geometry (θ–2θ), using CuKa radiation (k = 0.154 nm) in the angle 2θ range from 5° to 60°. The slit was 1.25°, the accuracy was ±0.05° and the scanning speed was 1 min−1.

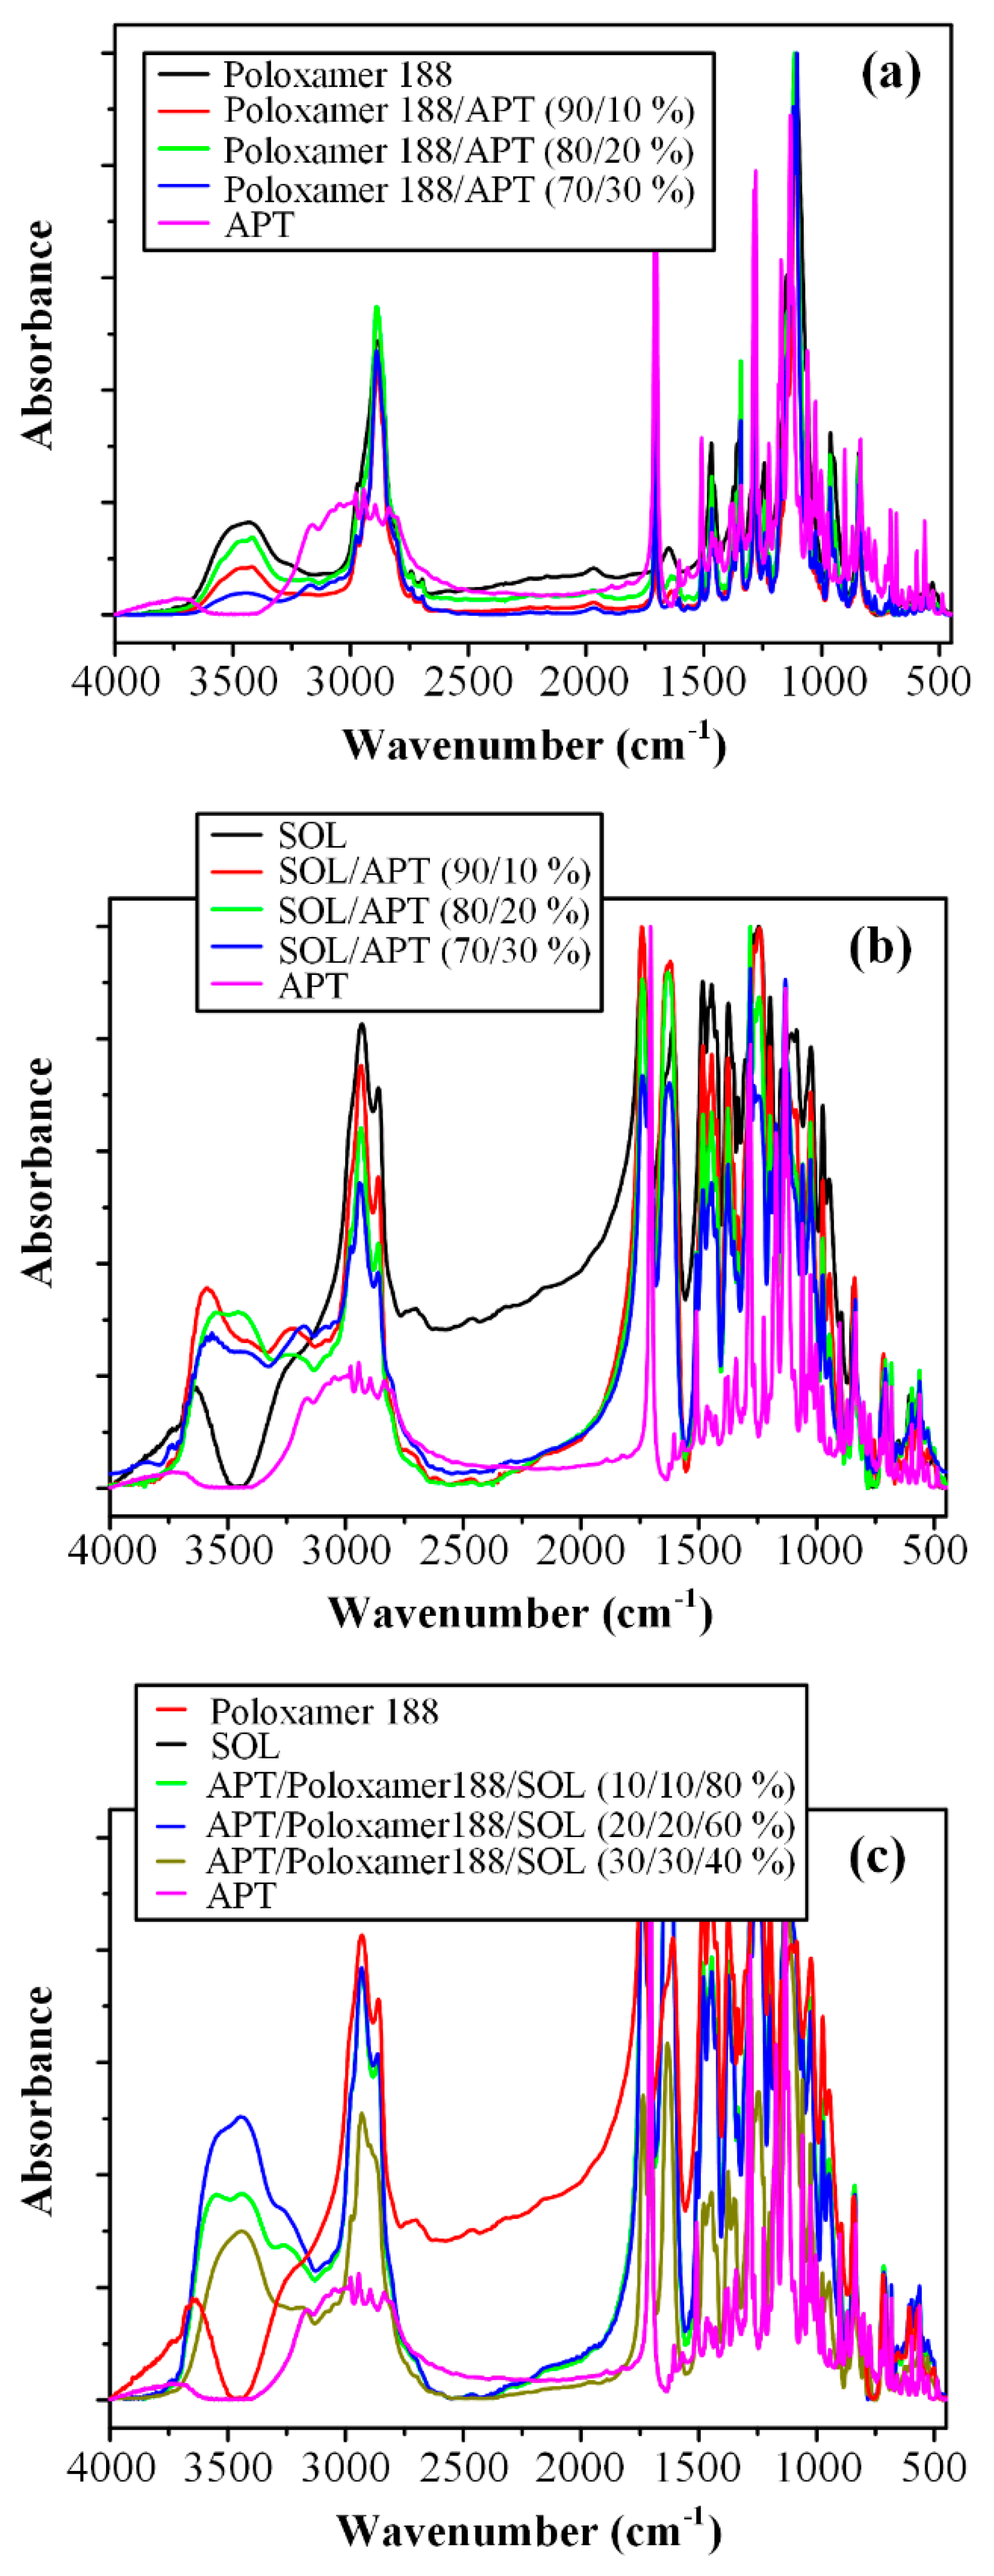
2.3.5. Fourier Transformation-Infrared Spectroscopy (FT-IR)

Possible molecular interactions among the studied component in the prepared binary and ternary SDs were evaluated with the aid of FT-IR spectroscopy obtained using a Perkin-Elmer FT-IR spectrometer (Spectrum One, PerkinElmer Corporation, Waltham, MA, USA). Sample spectra in absorbance mode was collected using KBr tablets in the spectral region of 450–4000 cm−1 at a resolution of 4 cm−1 in 32 co-added scans.

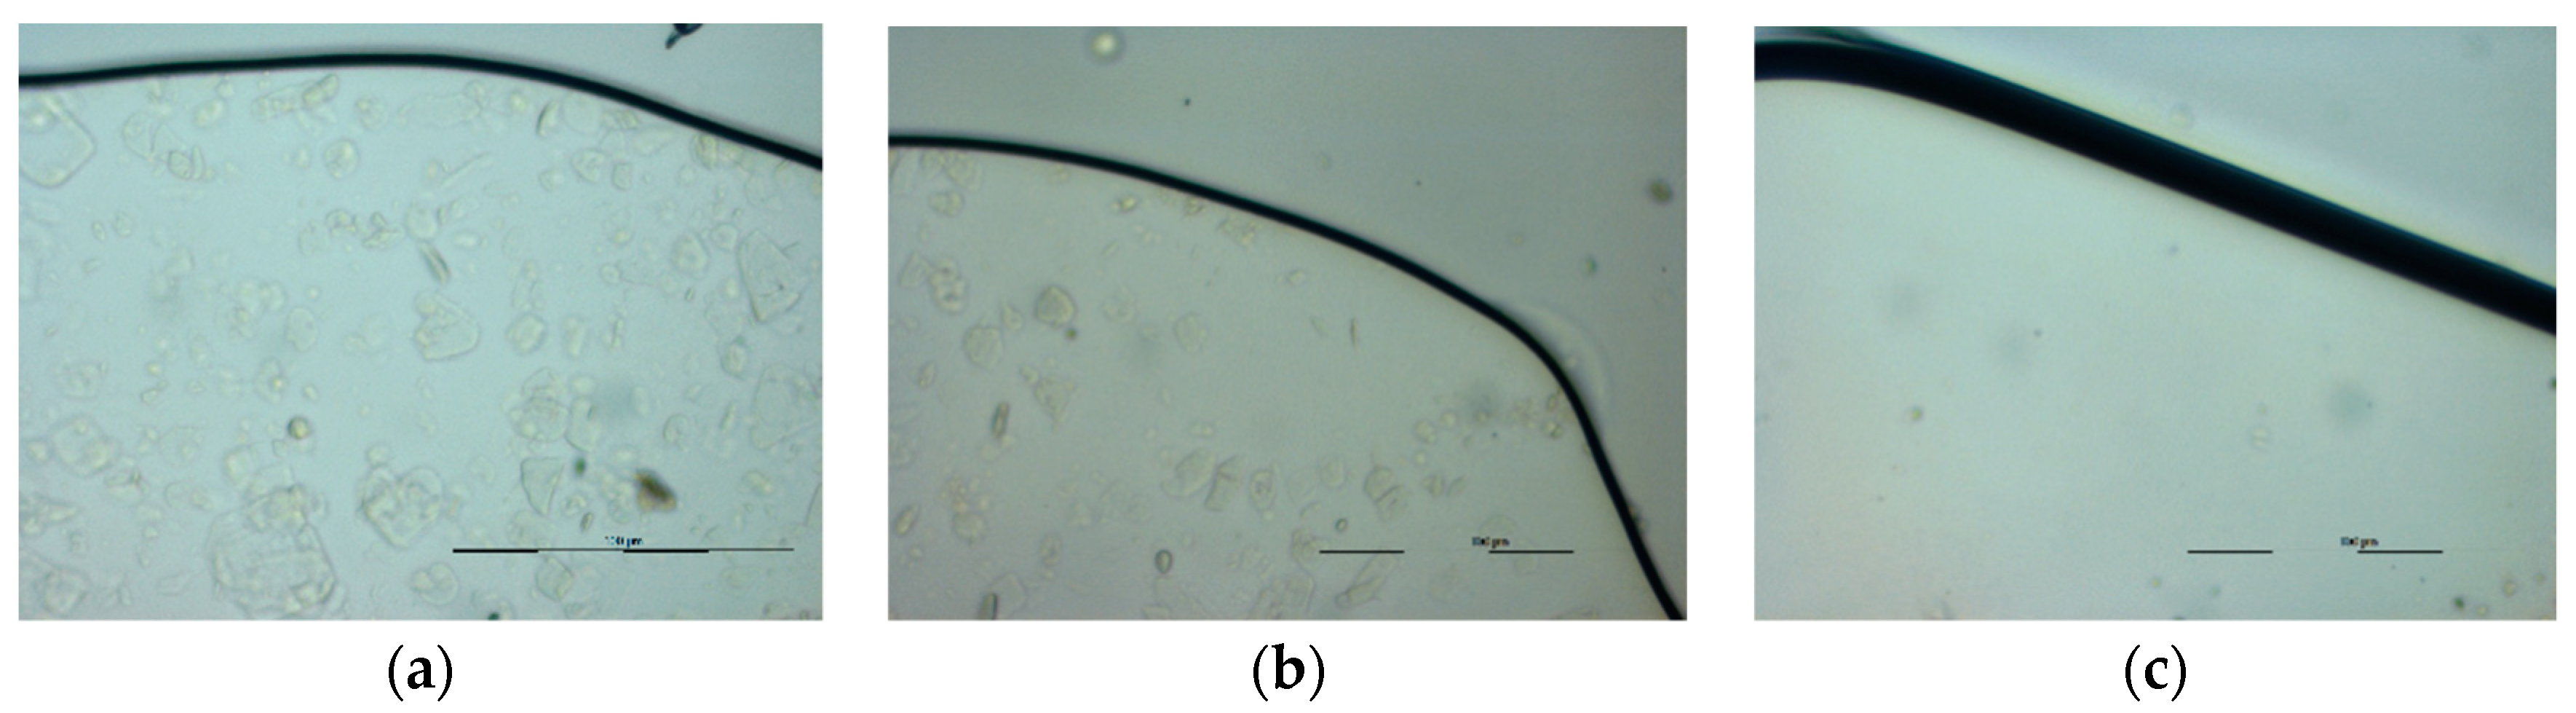
2.3.6. Scanning Electron Microscopy (SEM)

Binary and ternary SD morphology was evaluated via SEM analysis using a JEOL JMS-840A (JMS-840, Peabody, MA, USA) equipped with an energy dispersive X-ray (EDX) Oxford ISIS 300 (High Wycombe Bucks, UK) micro-analytical system and the analysis was conducted based on the F element of APT. The samples were covered with carbon coating to increase conductivity of the electron beam, while the operating conditions were accelerating voltage 20 kV, probe current 45 nA, and counting time 60 s.

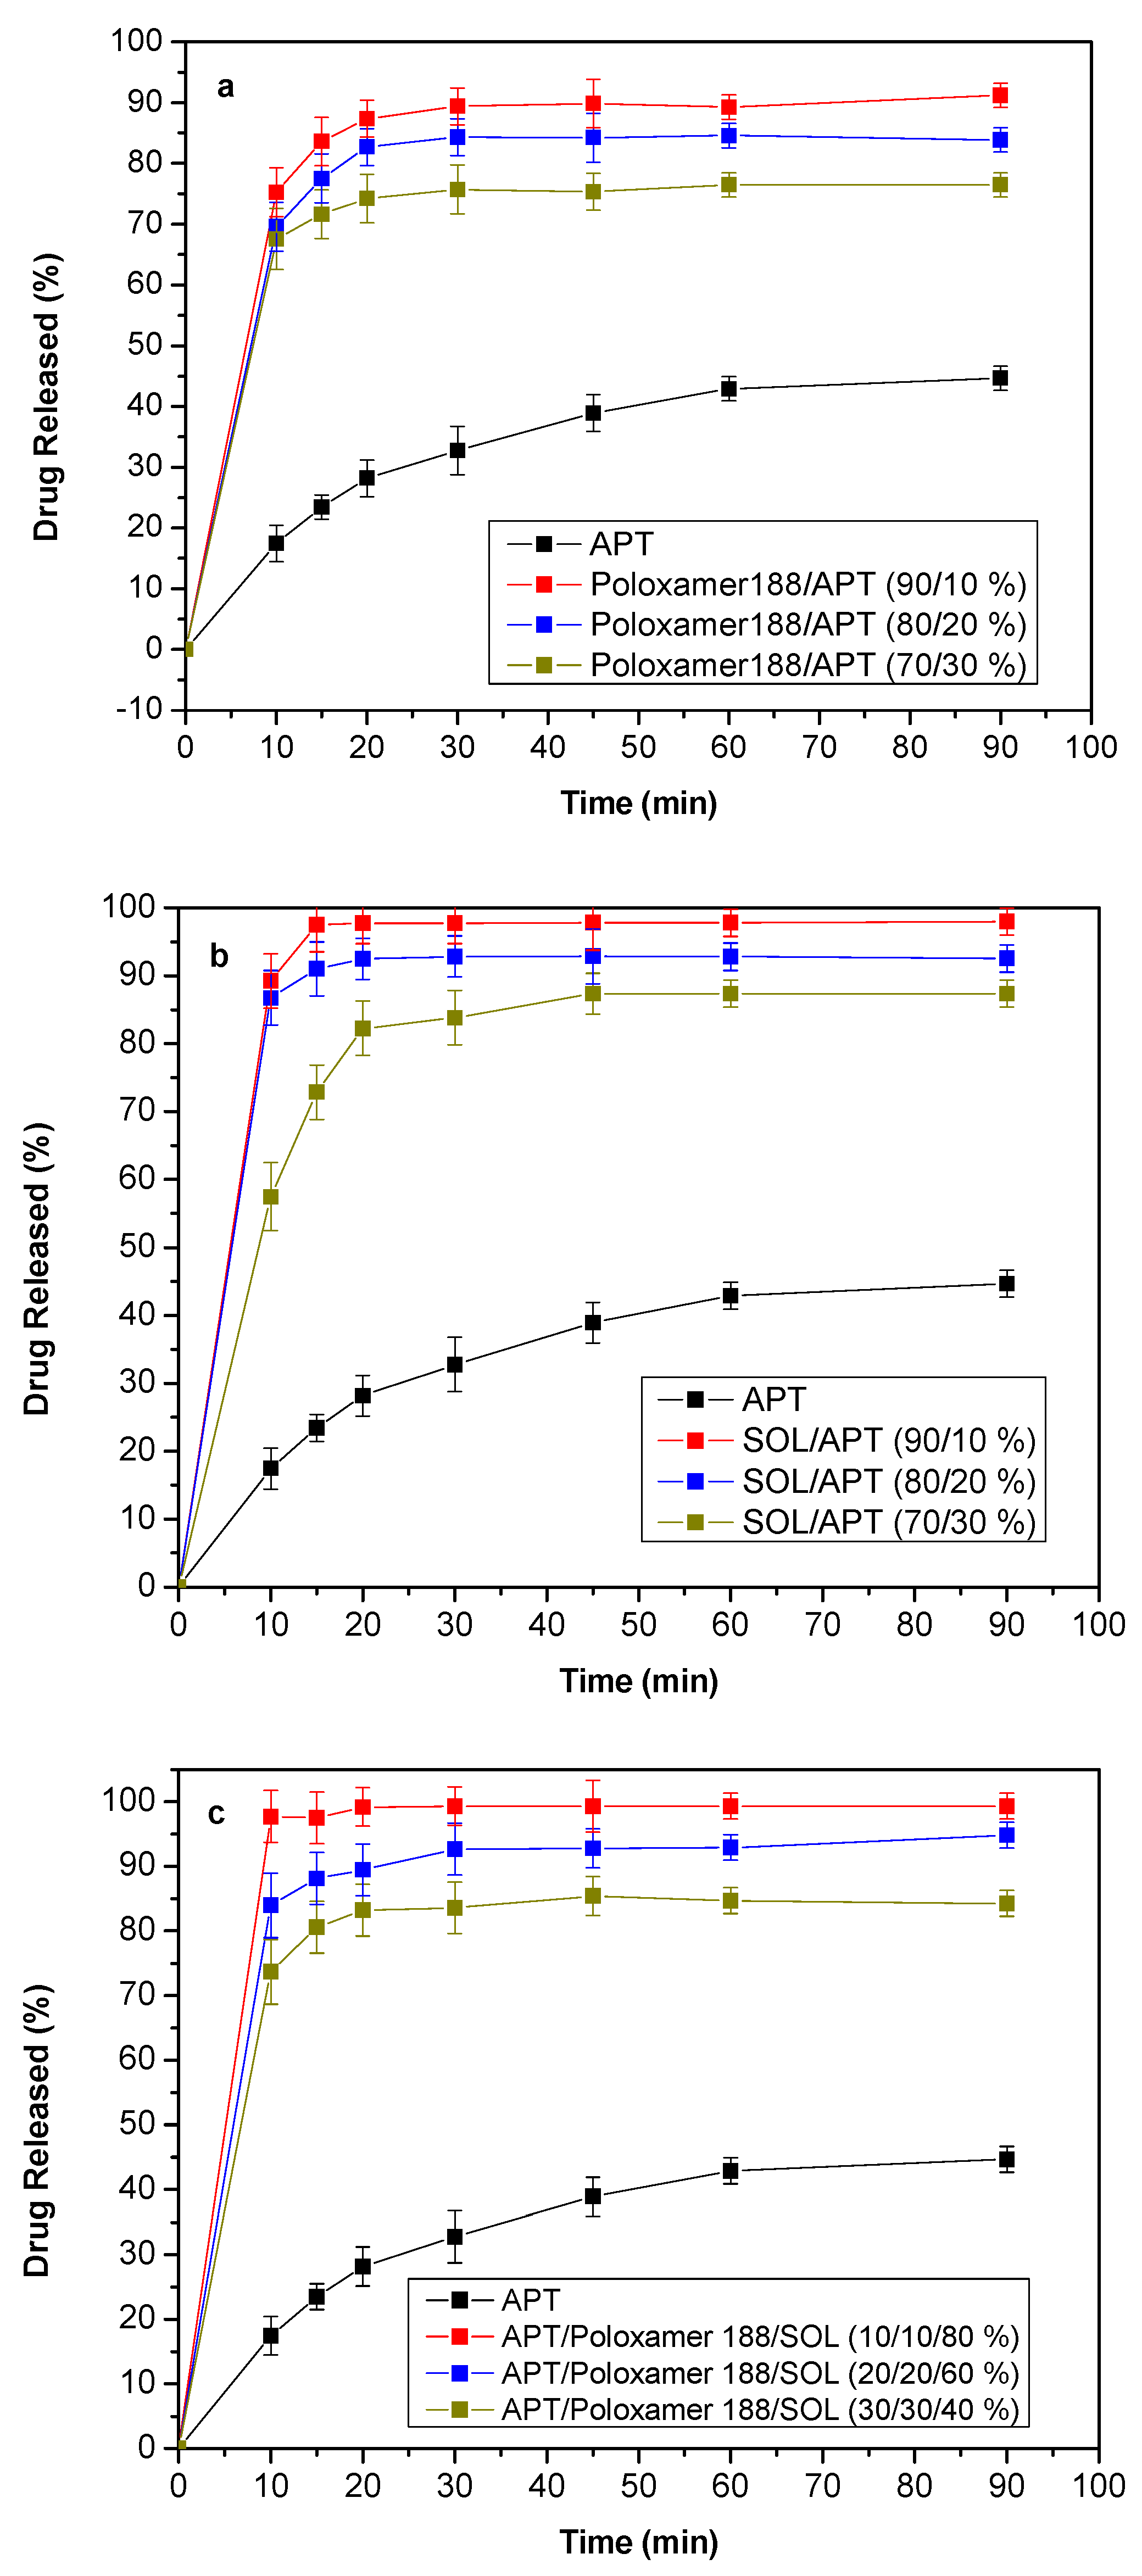
2.3.7. Dissolution Studies

In vitro dissolution studies were performed using dissolution Apparatus II (puddles method) on a Distek 2100C (Markham, ON, Canada) dissolution tester equipped with an Evolution 4300 Dissolution Autosampler (Distek, North Brunswick, NJ, USA). Appropriate amounts of samples containing of 125 mg of APT (having constant particle size distribution) compressed on a manually operated hydraulic press equipped with a 11 mm diameter flat-faced punch and die set pre-lubricated with Mg Stearate, were placed inside the dissolution vessel. Dissolution medium, according to FDA’s recommendations, consisted of 2.2% sodium dodecyl sulfate in distilled water. All dissolution experiments were conducted at 37 ± 0.5 °C and 100 rpm. At predetermined time intervals (namely, 10, 15, 20, 30, 45, 60 and 90 min) 3 mL aliquots was withdrawn from the release media, filtered (0.1 μm filters) and analyzed for APT content based on the following HPLC method. The withdrawn amount (3 mL) was immediately substituted with a freshly prepared buffer solution.

2.3.8. High Performance Liquid Chromatography (HPLC)

APT drug content was assayed using the following validated isocratic HPLC method. A Shimadzu Prominence HPLC (Kyoto, Japan) system consisting of a degasser (Model DGU-20A5), a pump (Model LC-20AD), an auto sampler (Model SIL-20AC), a UV–Vis detector (Model SPD-20A) and a column oven (Model CTO-20AC) was used. Chromatographic analysis was performed on a CNW Technologies Athena C18, 120 A, 5 μm, 250 mm × 4.6 mm. The mobile phase consisted of acetonitrile/pH = 7.0 buffer solution (70:30, v/v) the flow rate was 1.0 mL/min and the column temperature was set at 25 °C. Injection volume was set at 20 μL, and APT was detected at 215 nm. The excipients used in this study did not interfere with the assay of APT.

3. Results and Discussion

3.1. Thermo-Gravimetric Analysis (TGA)

Before proceeding with the preparation of any pharmaceutical SD system using a temperature-based technique, it is extremely important to evaluate the thermal degradation profile of all used components. This profile helps to determine the temperature profile during component melt mixing in order to avoid any compound thermal decomposition. In the present study the thermal degradation profiles of APT, Poloxamer 188 and SOL were evaluated with the aid of TGA. Figure 1a shows the % mass loss of all compounds during heating. Results analysis showed that, contrary to SOL having a moisture content of 2.6%, APT and Poloxamer 188 did not contain any residual moisture. In the case of APT no mass loss is observed up to 246.6 °C, while from that temperature up to 380.0 °C a significant mass loss is observed followed by a second thermal degradation event from 380.0 °C up to approximately 480.0 °C (Figure 1b). The residual APT mass according to the above TGA was 11.56% of the initial weight. In regards to Poloxamer 188, TGA showed that compound’s thermal decomposition takes place in one step. Specifically, results in Figure 1a show that no mass loss is observed up to 306.0 °C, while from that point up to 492.0 °C almost complete compound degradation is obtained (residual Poloxamer 188 mass was 0.8% of the initial weight). Finally, in the case of SOL a three step degradation process was observed. Specifically, an initial small mass loss (~2.6% of the initial sample weight) is observed up to 140.0 °C due to residual moisture flowed by a second mass loss stage starting from 280.0 °C up to 389.0 °C and a final thermal degradation step from 389.0 °C to 553.0 °C (Figure 1b). Hence, based on the above thermal-decomposition analysis APT and the selected excipients show good thermal stability ensuring safe processing at high temperatures.

3.2. Hot Stage Polarized Light Microscopy (HSM)

In order to identify the proper melting temperature during APT SD preparation, HSM was employed. Figure 2 shows the obtained HMS micrographs for APT/Poloxamer 188, APT/SOL and APT/Poloxamer 188/SOL physical mixtures during heating with a rate of 20 °C/min. In all cases, no complete melting of API was observed at 160 °C, indicating that higher temperatures are needed in order to obtain a clear API solution within the polymer matrix. In the case of APT/Poloxamer mixtures, complete solubilization of the API was obtained at 243 °C, while in the case of APT/SOL the API was completely dissolved at 220 °C. Additionally, the presence of Poloxamer 188 (10% w/w) in the APT/SOL mixture showed a further decrease in solubilization temperature, as the API was completely dissolved within the tested polymer matrix at 200 °C. These findings indicate that Poloxamer 188 acts as a plasticizer in SOL matrix, leading to reduced processing temperature, which is extremely important in terms of thermal stability and process safety.
Based on the above results, and in order to evaluate the proper thermal processing conditions, heating time was also evaluated. Results showed that APT can be completely dissolved in all polymer melts when heated at 160 °C for 12–15 min of isothermal (not dynamic) heating (Figure 3). For this reason and in order to avoid any possible drug or polymer decomposition, all solid dispersions were prepared by heating at 160 °C for 15 min.

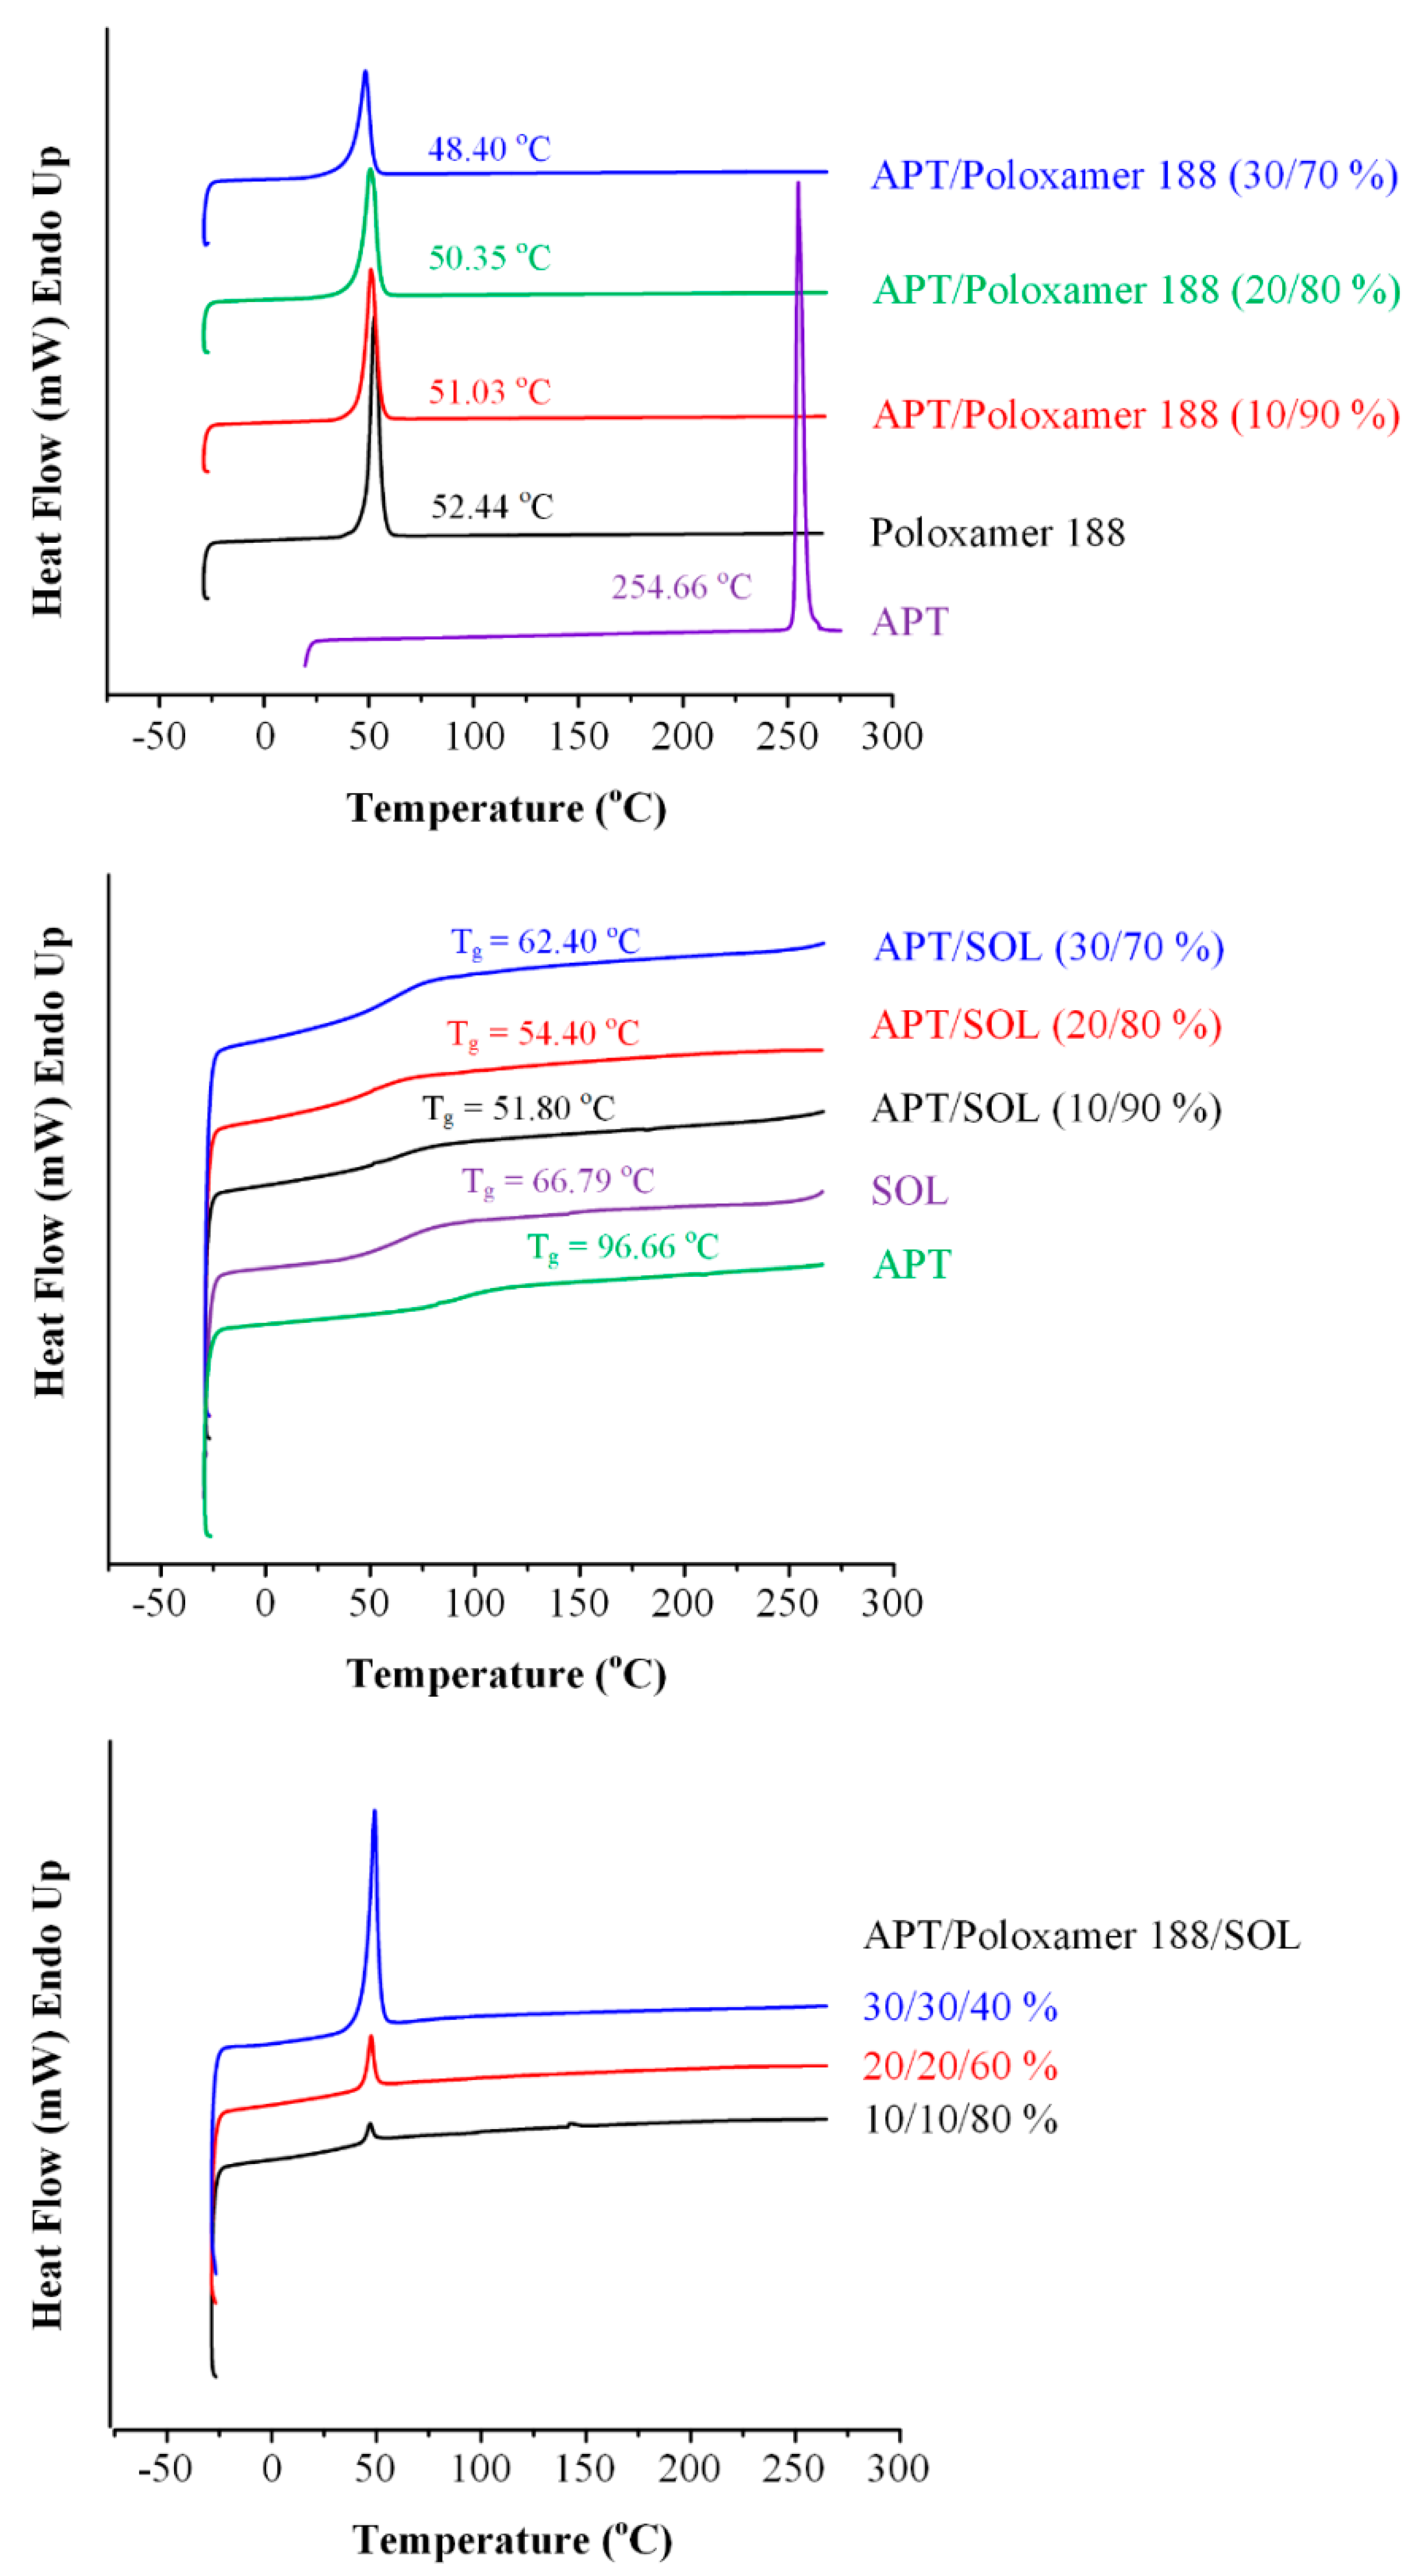
3.3. Differential Scanning Calorimetry (DSC) Analysis

DSC studies were performed in order to evaluate the thermal properties of the pure compounds and the prepared SDs (Figure 4). APT DSC thermogram shows one endothermic peak at 254.66 °C corresponding to its melting point and a glass transition temperature (Tg) at 96.66 °C. Poloxamer 188 shows an endothermic melting peak at 52.44 °C, while SOL (amorphous copolymer) shows a Tg value at 66.29 °C. Based on the above thermal properties of the pure compounds, it can be said that Poloxamer’s low melting point may facilitate its use as a plasticizer during temperature-based SD preparation (such as melt mixing and HME) and hence, lower melting temperatures may be achieved resulting in a safer preparation process (in terms of API’s thermal degradation as well as in terms of operator’s safety).
In regards to APT/Poloxamer binary SDs, DSC thermograms showed only one endothermic peak corresponding to the melting of the crystalline polymer. No API DSC thermal traces were observed in all studied weight fractions (i.e., 10%, 20% and 30% wt. of APT). This indicates that in the prepared SDs APT is probably dispersed in amorphous phase. However, since the DSC in-situ amorphization of APT (inside the aluminum pan) due to the melting of Poloxamer 188 cannot be excluded, in order to identify the true physical nature of APT (crystal or amorphous) a more precise technique (such as WAXD discussed below) is needed. Nevertheless, DSC thermograms of APT/Poloxamer 188 showed that the melting point of Poloxamer 188 is reduced to lower temperatures as API content increases. Specifically, Poloxamer 188 melting temperatures are 51.03 °C, 50.35 °C and 48.40 °C for 10%, 20% and 30% wt. of APT, respectively. This melting point drop suggests the presence of molecular interactions between the polymer and the API (in depth evaluation of molecular interactions will follow in FT-IR analysis).
In the case of APT/SOL binary SDs, DSC thermograms in Figure 4 show a single Tg in all APT tested weight concentrations indicating component miscibility. No API melting endotherm was observed and hence, it can be said that the API is probably dispersed in amorphous phase. Increasing APT weight content led to increasing Tg values (51.80 °C, 54.40 °C and 62.40 °C for 10%, 20% and 30% wt. APT, respectively) which were, in all cases, below the Tg values of the pure components (66.79 °C and 96.66 °C for SOL and APT, respectively), indicating that probably molecular interactions are taking place between APT and SOL.
Finally, DSC thermograms of APT/Poloxamer 188/SOL ternary SDs showed a single endothermic peak corresponding to the melting of Poloxamer 188. No APT melting endothermic peaks were observed in all tested drug weight contents, indicating that the API is probably mixed in amorphous phase. However, as in the case of binary SDs, the DSC in-situ APT amorphization cannot be excluded.

3.4. Fourier Transformation-Infrared (FT-IR) Spectroscopy Analysis

In a further step, and in order to identify any possible molecular interaction taking place among system’s components, FT-IR analysis of neat APT, Poloxamer 188 and SOL along with the prepared binary and ternary SDs was conducted (Figure 5).
Figure 5a shows the FT-IR spectra of neat APT, Poloxamer 188 and the prepared APT/Poloxamer 188 binary SDs. In regards to APT, FT-IR analysis showed several characteristic peaks corresponding to amide C=O stretching (at 1702 cm−1), C=C stretching (at 1600 to 1500 cm−1) and C-F stretching (at 1400 cm−1 to 1100 cm−1), while Poloxamer 188 showed characteristic FT-IR peaks at 2887 cm−1, 1343 cm−1 and 1110 cm−1 corresponding to the C-H, O-H and C-O groups, respectively. Additionally, figure analysis revealed that in all prepared binary SDs the obtained IR spectra were the sum of neat component spectra, indicating that no molecular interactions are taking place between the two components during the preparation of SDs.
Figure 5b shows the FT-IR spectra of neat APT, SOL and the prepared APT/SOL binary SDs. In regards to neat SOL characteristic FT-IR absorption peaks were recorded at 1739 cm−1 and 1643 cm−1 corresponding to the OC(O)CH3 or ester group and the C(O)N or amide group, respectively. As in the case of APT/Poloxamer 188, all obtained spectra for APT/SOL binary SDs showed no changes compared to the neat components, indicating that no molecular interactions are present between the two components.
Similarly to the above binary SDs results, analysis of the FT-IR spectra for the ternary APT/Poloxamer 188/SOL SDs in Figure 5c showed that the obtained spectra were the sum of neat component spectra, indicating that no molecular interactions are taking place among system’s components.

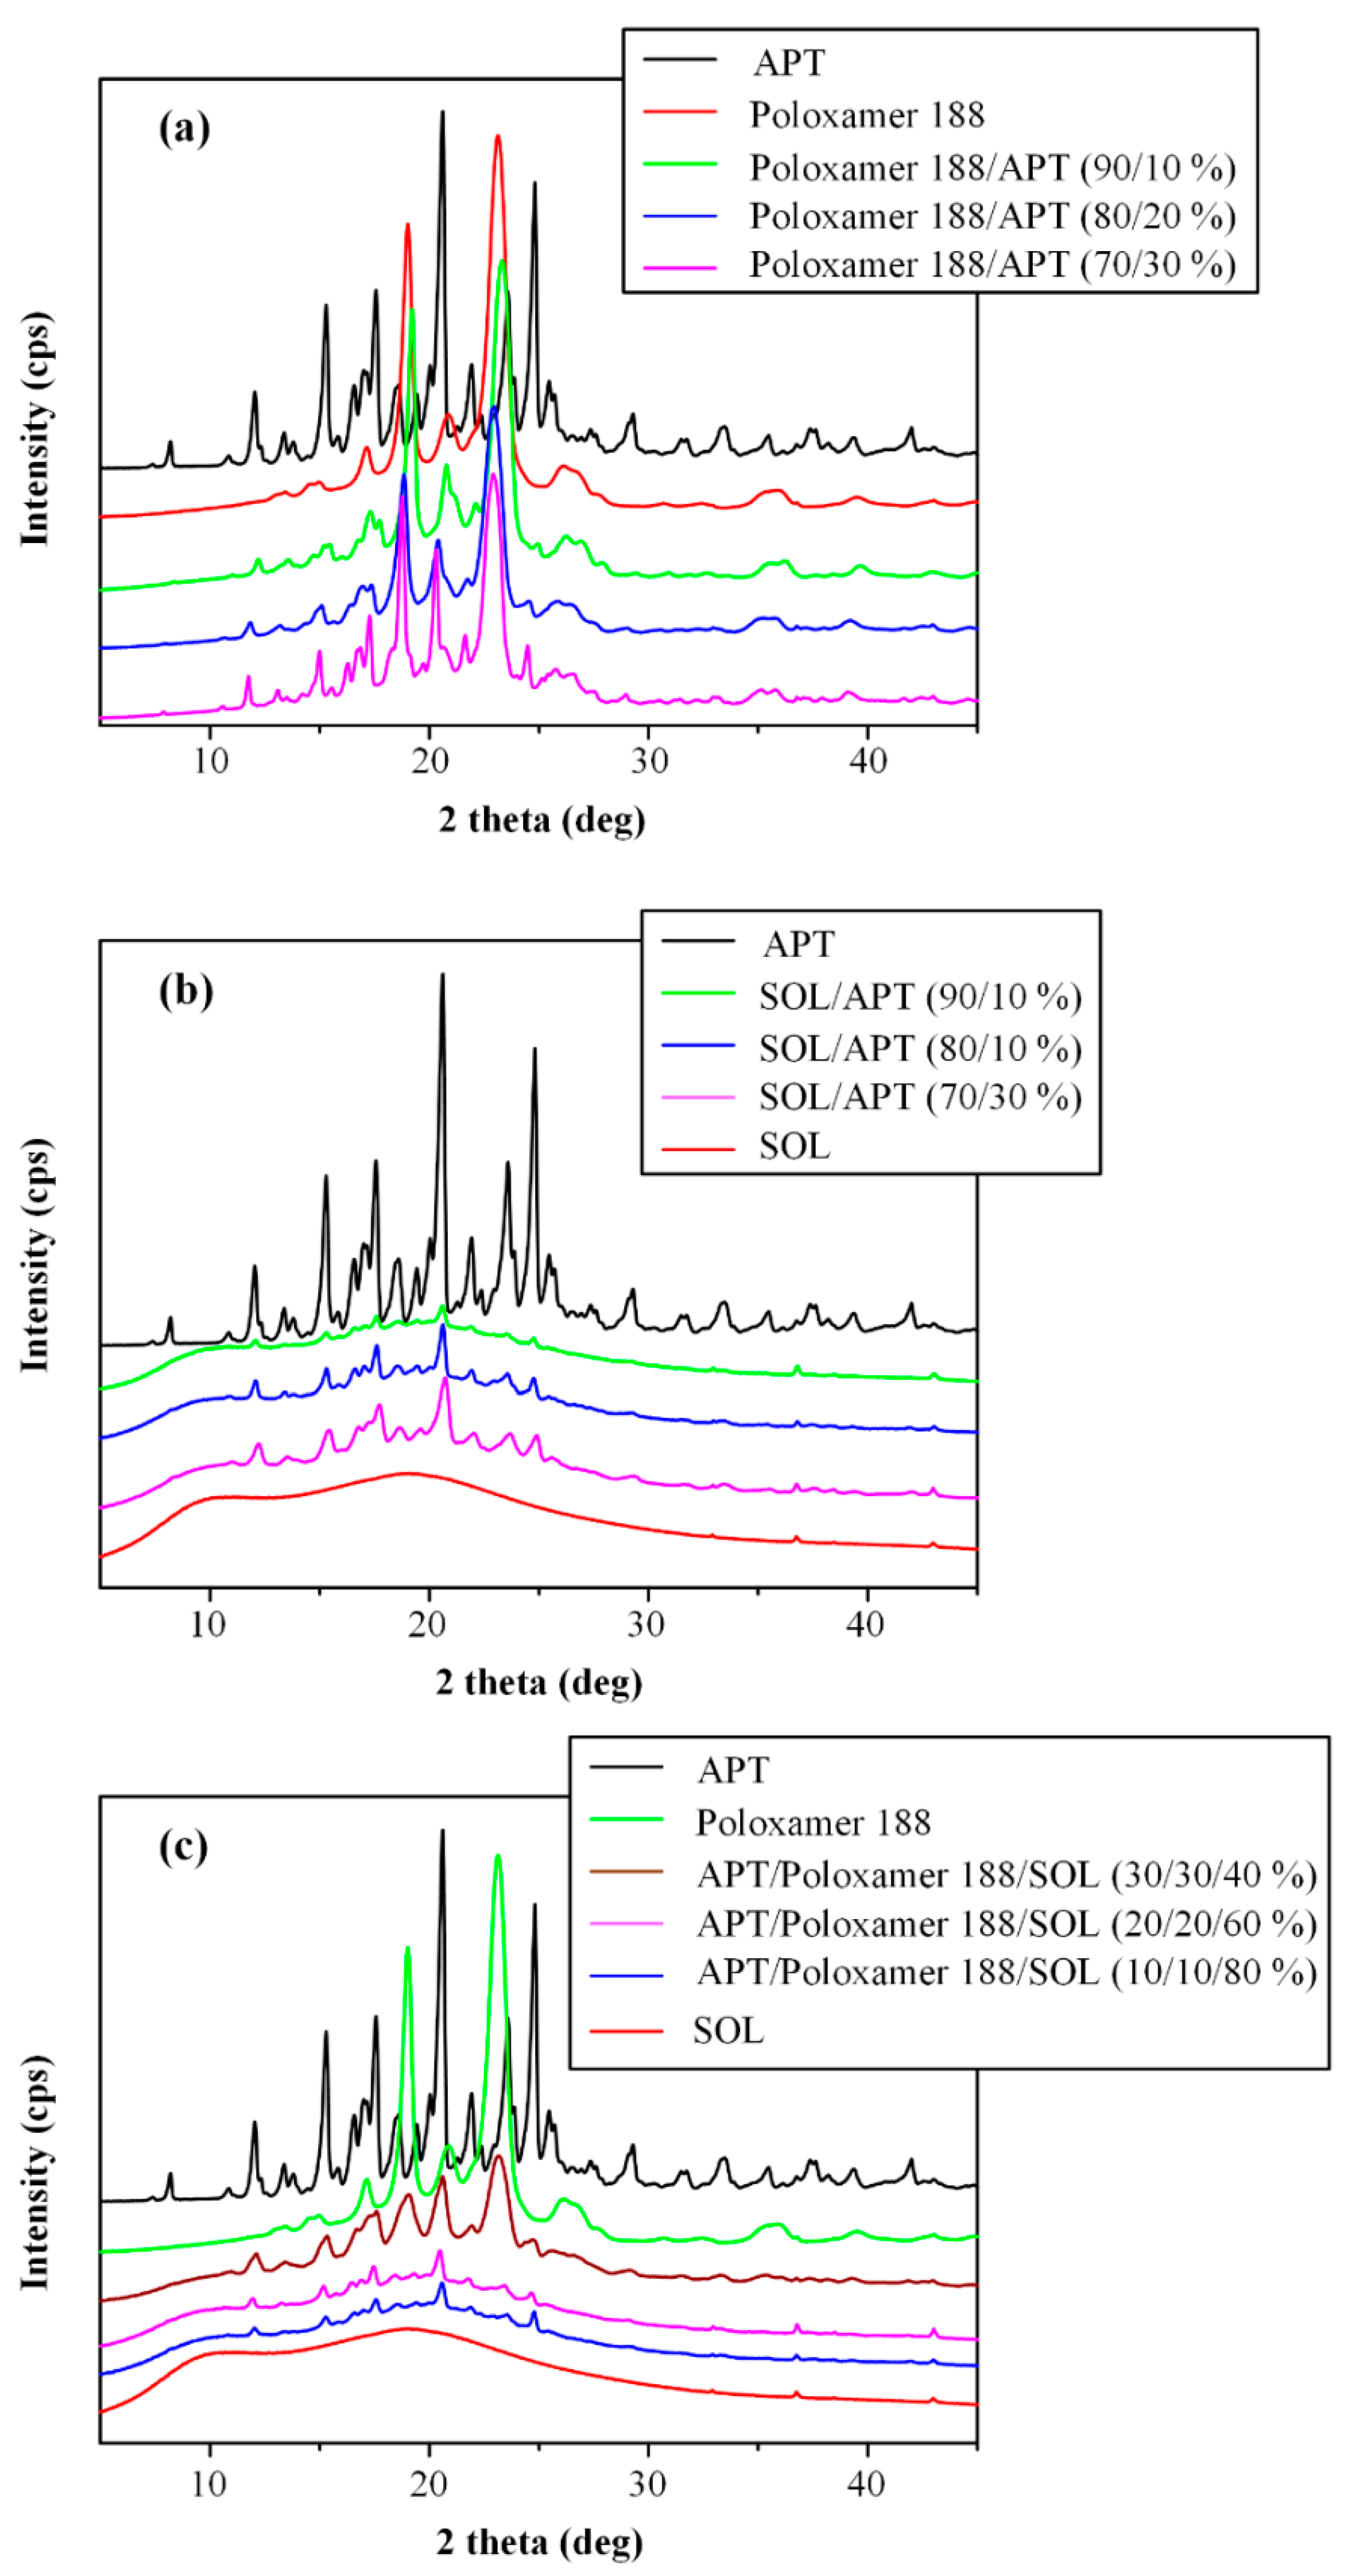
3.5. Wide Angle X-ray Diffractometry (WAXD) Analysis

DSC analysis of all solid dispersions showed no APT melting peak endotherms indicating that the API is probably amorphous. However, DSC analysis is such systems containing crystalline or semi-crystalline carriers, shows many limitations [54]. In addition, taking into consideration the FT-IR analysis results (where no interactions were identified among the tested components) API’s amorphization suggested by DSC seems to be misleading [55,56]. Hence, in order to properly evaluate API’s physical state after melt mixing procedure WAXD analysis was performed [57].
Figure 6 shows the recorded WAXD patterns of neat components (APT, Poloxamer and SOL) along with the prepared APT/Poloxamer 188, APT/SOL and APT/Poloxamer 188/SOL SDs. APT’s WAXD diffractogram revealed that the neat API is crystalline in nature. Specifically, several API reflections were recorded at 2θ of 8.2°, 12.2°, 16.1°, 17.1°, 20.7°, 22.8°, 24.3°, 24.8°, and 26.6°, indicating that the API was a mixture of polymorphs I and II (containing approximately 6% of form II) [16]. In the case of neat Poloxamer 188 two strong reflections at 2θ of 19.3° and 23.2° (Figure 6a) indicated that the copolymer was also crystalline in nature, while analysis of APT/Poloxamer 188 SD diffractograms revealed that, in all API to carrier concentrations, APT remained crystalline after melt mixing. In the case of APT/SOL binary SDs, diffractograms in Figure 6b verified the amorphous nature of neat SOL, while, as in the case of APT/Poloxamer 188 binary SDs, APT was also crystalline in SOL binary SDs. Similar results were observed in the case of APT/Poloxamer 188/SOL ternary SDs (Figure 6c), where API crystalline reflection peaks were recorded in all prepared ternary mixtures. XRD analysis showed no changes in the percentage of APT form II after melt mixing (i.e. ~ 6% of form II was present in all prepared SDs).
Hence, based on the obtained results and the absence of molecular interactions (verified via FTIR analysis) facilitates the hypothesis that API recrystallizes during melt cooling, and that the DSC recorded drug amorphization was due to the in-situ drug solubilization within the polymer matrix melt. However, it is clear from all WAXD patterns that API’s crystallinity increases by increasing drug content.

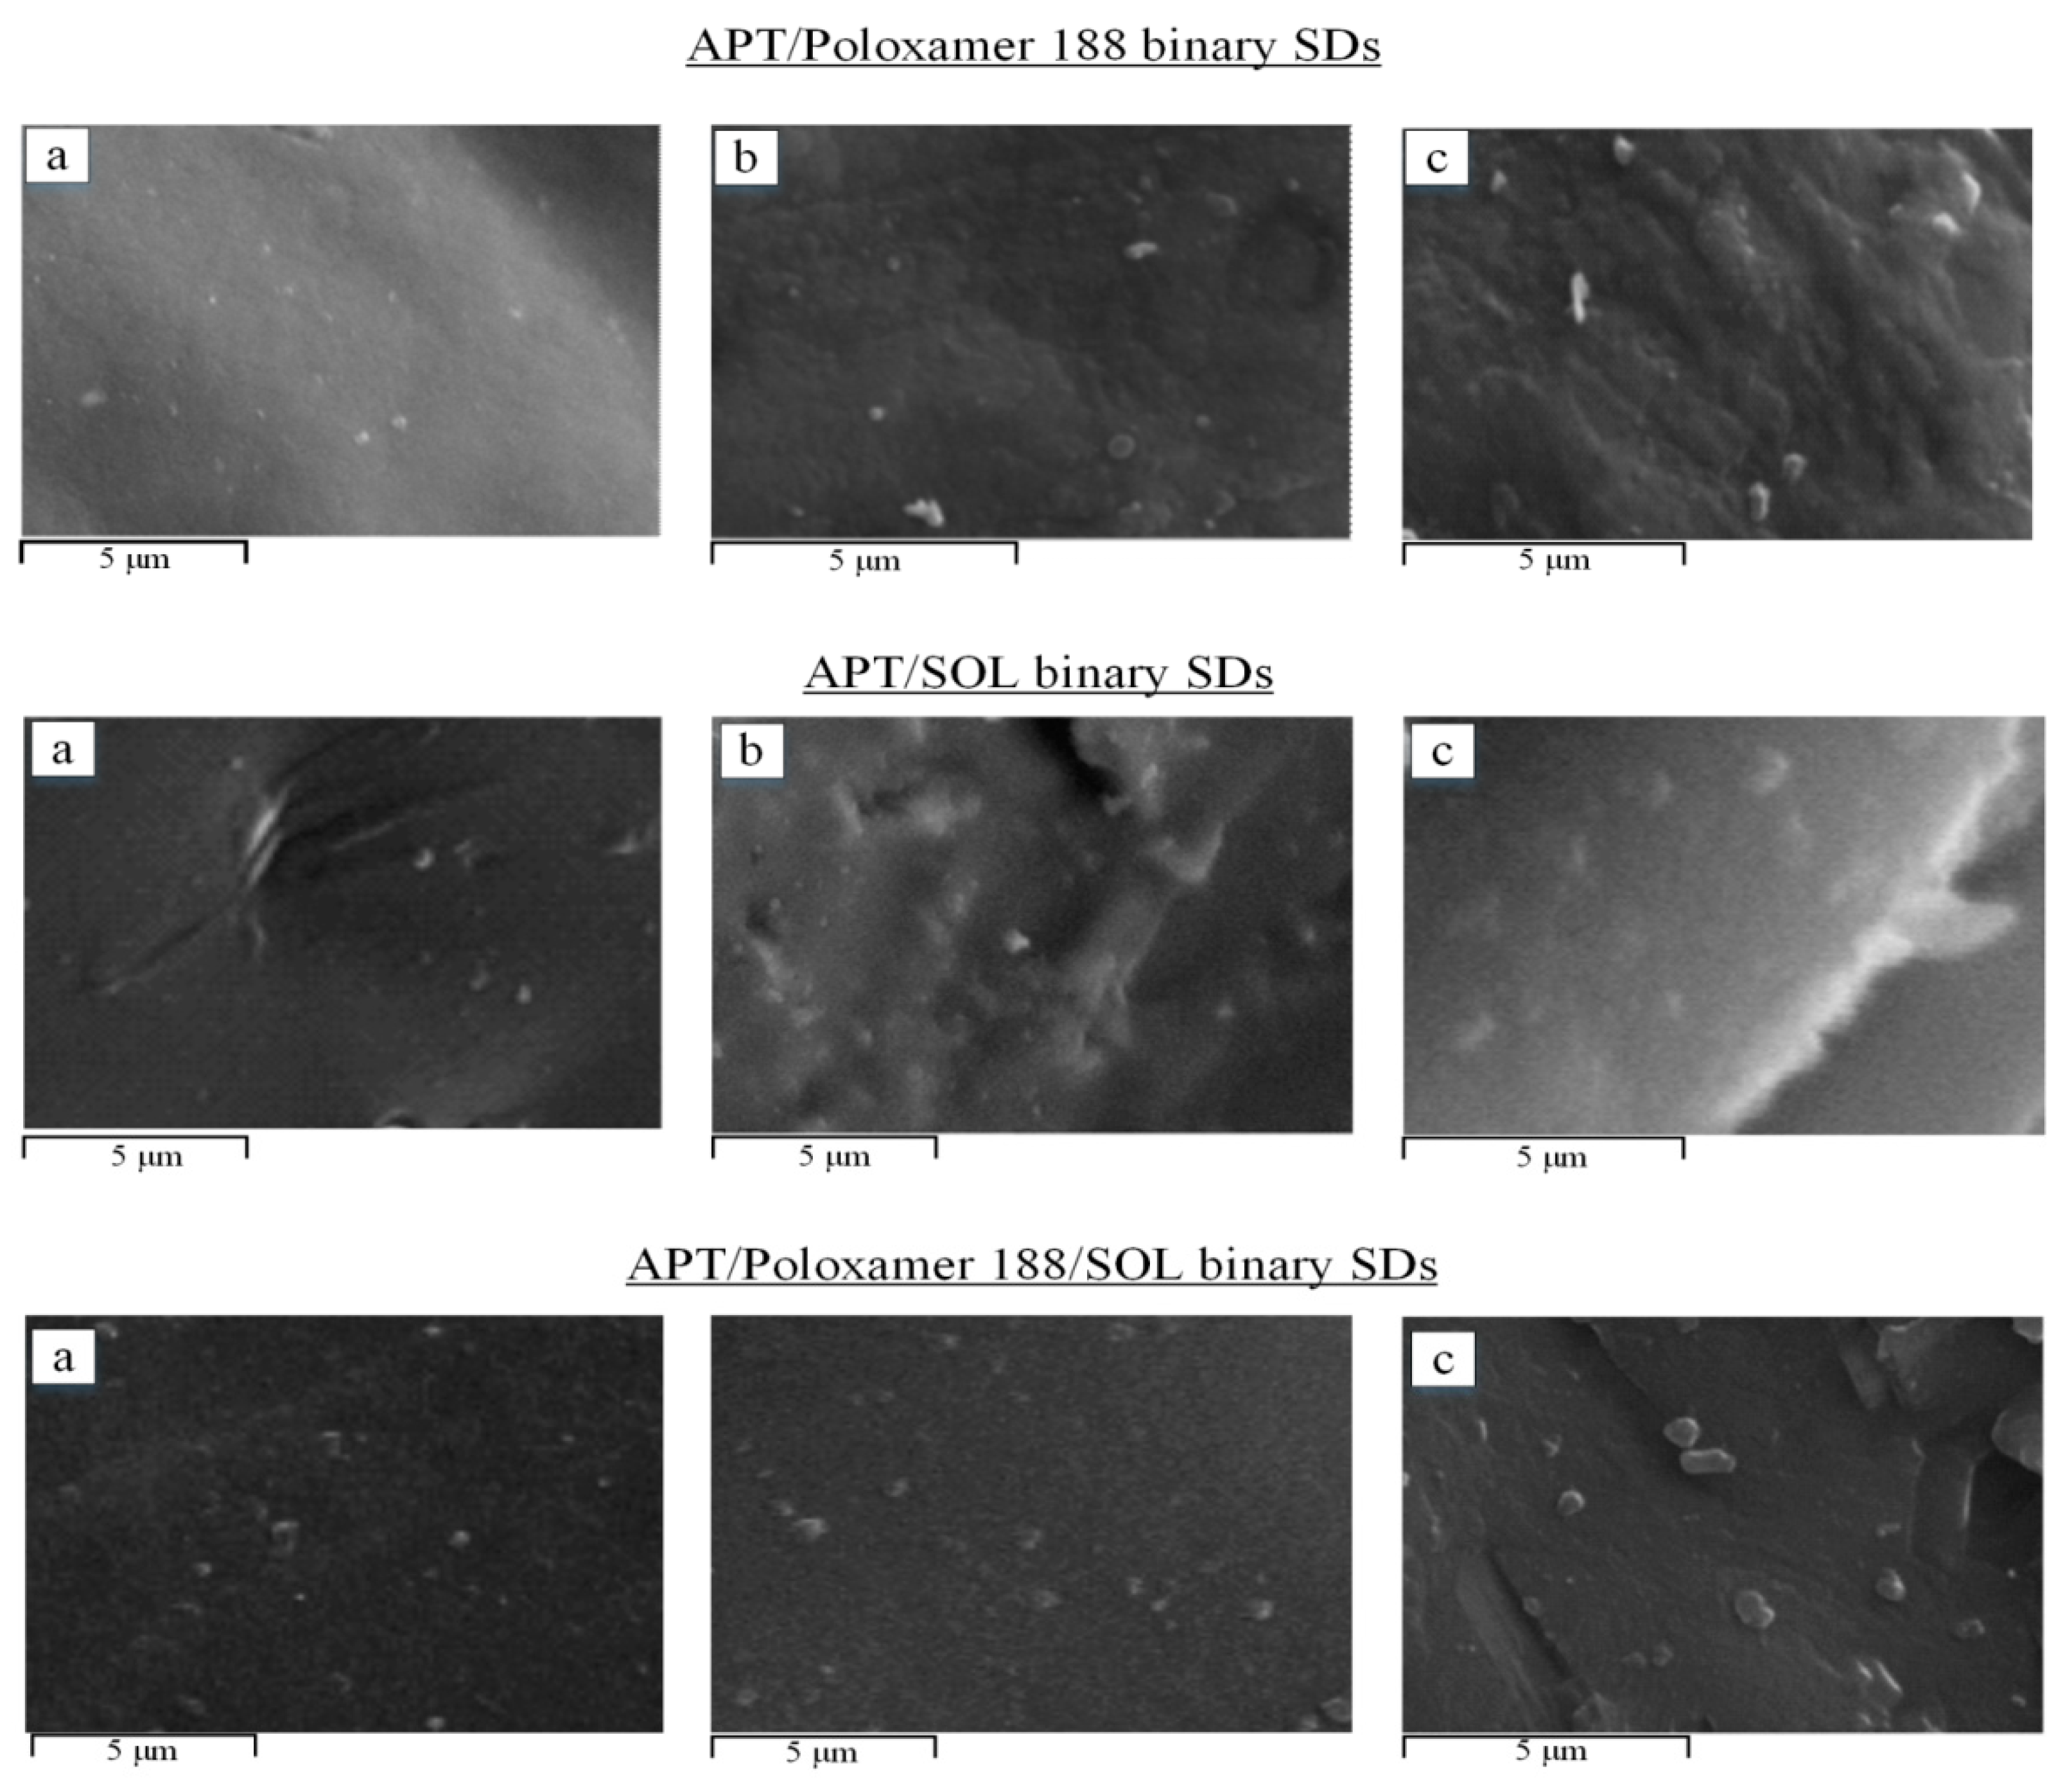
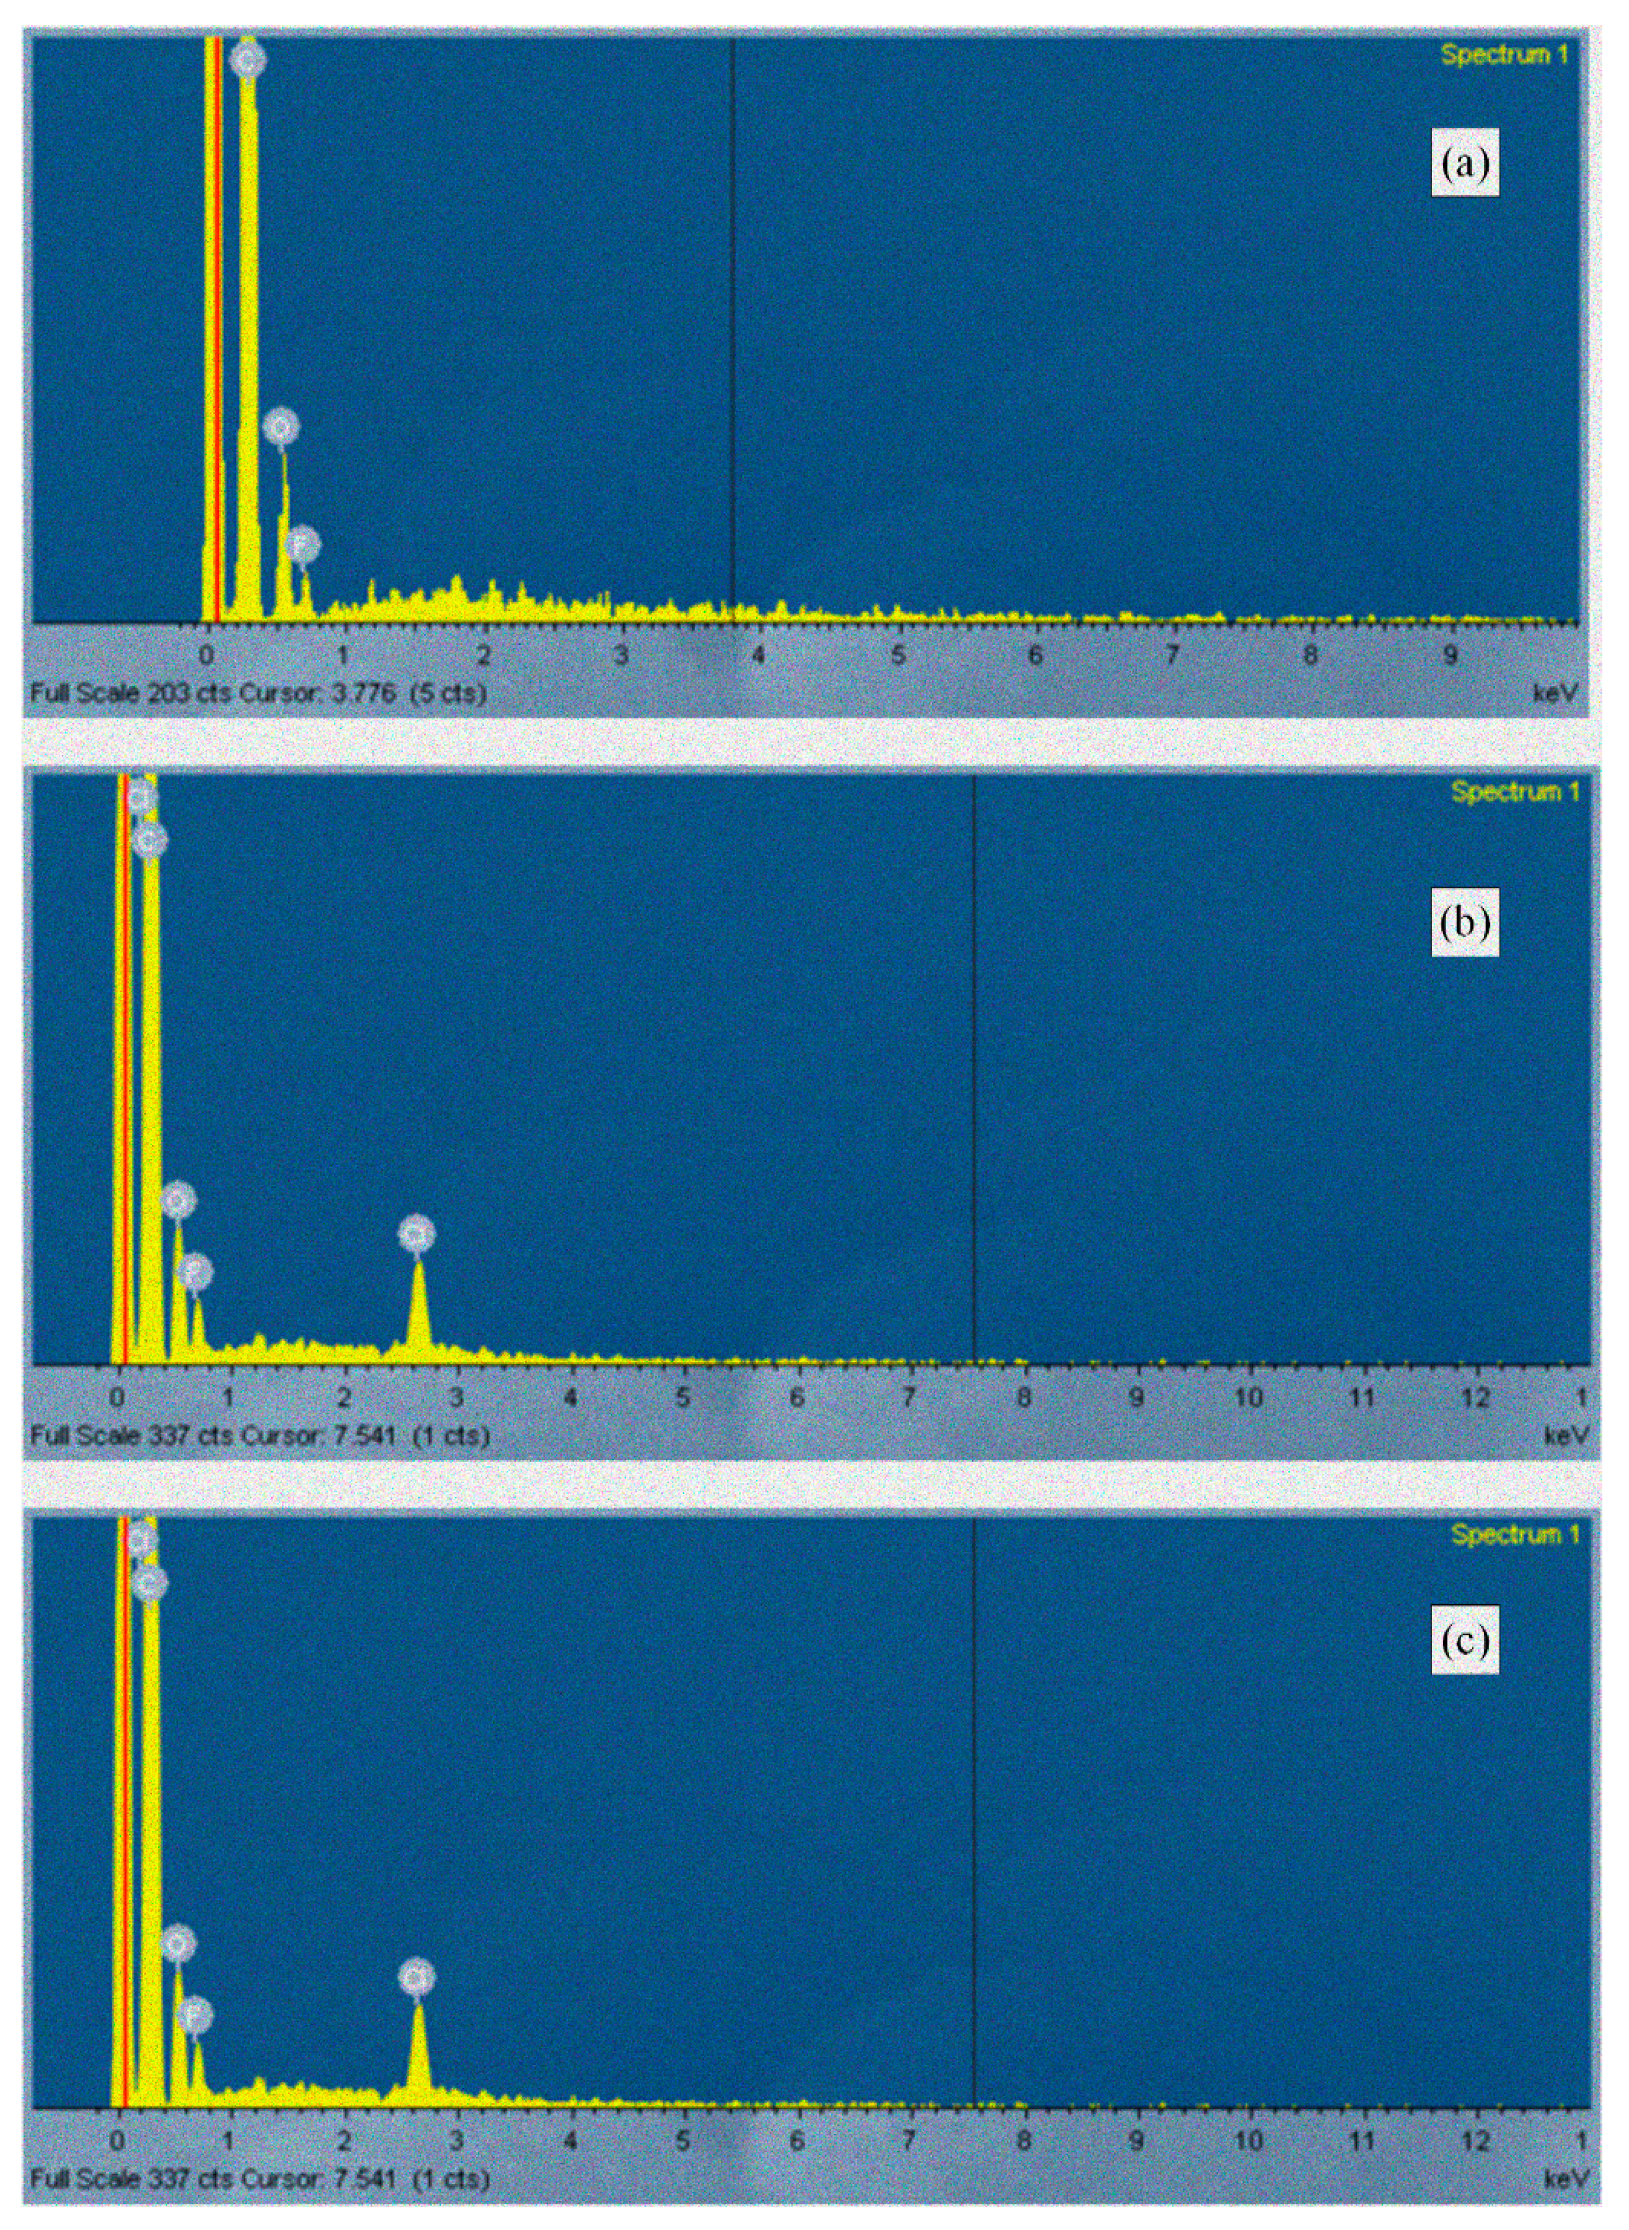
3.6. Scanning Electron Microscopy (SEM) Analysis

Several forms of pharmaceutical SDs have been reported over the past decades. In general, the main categories include APIs dispersed either in: (1) amorphous molecular or (2) crystalline level [58]. Especially, in the case of crystalline SDs the API may be dispersed in either micro (over 1 μm) or nano (under 1 μm) scale. Based on the above analysis for the prepared binary and ternary APT SDs, WAXD analysis showed that in all cases crystalline API is present within the SD matrix. Hence in order to identify the size of API crystalline dispersion, SEM analysis was performed.
In general, SEM gives useful information about shape, particle size, and morphology of SDs, while it can precisely depict the topography of surfaces without revealing the internal structure of samples [48]. Looking at the SEM micrographs of all prepared SDs (both binary and ternary systems) the API seems to be dispersed within the polymer substrate in nano-scale (Figure 7) [58]. Specifically, in the case of APT/Poloxarer 188 (Figure 7a), several dispersions in the scale of 370, 430 and 750 nm for 10%, 20% and 30% wt. APT content, respectively, were observed, indicating that increasing API content leads to increasing nano-dispersion size. Similarly, same results were observed in the case of API/SOL and APT/Poloxamer 188/SOL SDs, where nano-dispersion with size varying from 340, 410 and 720 μm, and 350, 460 and 700 μm for APT/SOL and APT/Poloxamer 188/SOL SDs, respectively, were observed. Based on the obtained results, the type of SD matrix forming copolymer (in the case of APT/Poloxamer and APT/SOL binary SDs) or copolymer blend (in the case of APT/Poloxamer 188/SOL ternary SDs) did not affect significantly the size of API nano-dispersion. Increasing APT’s nanocrystal size by increasing drug content, is probably due API’s oversaturation.
In a further step, in order to determine whether the observed nano-crystals are indeed the re-crystallized API, element analysis was performed using EDAX (a semi-quantitative method for identifying the surface atoms of particles), a method that is suitable since the molecular structure of APT consists of Fluorine (F) atoms. Figure 8 shows the EDAX diagrams for the SD nano-crystals containing 20 % wt. of APT, where, in all cases, the existence of Fluorine atoms indicated that the observed SEM nano-crystals consisted of APT.

3.7. Dissolution Studies Results

Figure 9 shows the mean dissolution profiles of the binary and ternary APT SDs. As expected, neat APT shows slow dissolution rate due to its poor aqueous solubility, while in all prepared SDs the API’s dissolution rate increases drastically.
Specifically, Poloxamer188 SD having 10% APT showed an initial burst effect in the first 10 min, while the API was released in a controlled manner thereafter. Analogous results were observed for 20% and 30% concentrations of API, where an initial burst effect was followed by a controlled release rate. This two-phase release pattern is commonly observed in such SD systems [33,59]. SOL based SDs having 10% and 20% API content, showed an initial burst release releasing approximately 90% of API in less than 10 min, while SOL SDs with 30% API, showed an initial burst release releasing 60% of APT in 10 min, followed by a sustained release rate reaching 85% of API in 45 min. Finally, dissolution profile for ternary APT/Poloxamer 188/SOL SDs showed an initial API burst release in all tested API concentrations, while the release rate did not change significantly thereafter. It is important to note that in the prepared ternary SDs, increasing Poloxamer 188 concentrations led increasing API initial burst release.
Analysis of the above results, showed that in all SDs drug release rate and extent is directly depended from drug content (increasing APT content leads to decreasing API release rate and extent). This is probably due to the higher degree of crystallinity for the dispersed drug inside the polymer matrix, and the higher particle size of the formed APT nano-crystals in high API-content SDs (verified by SEM micrographs and EDX analysis in Figure 7 and Figure 8). However, even in these cases, APT solubility is substantially enhanced compared to neat API, indicating that all used polymers are appropriate to enhance APT’s dissolution rate (due to their solubilizing and micelles forming abilities).

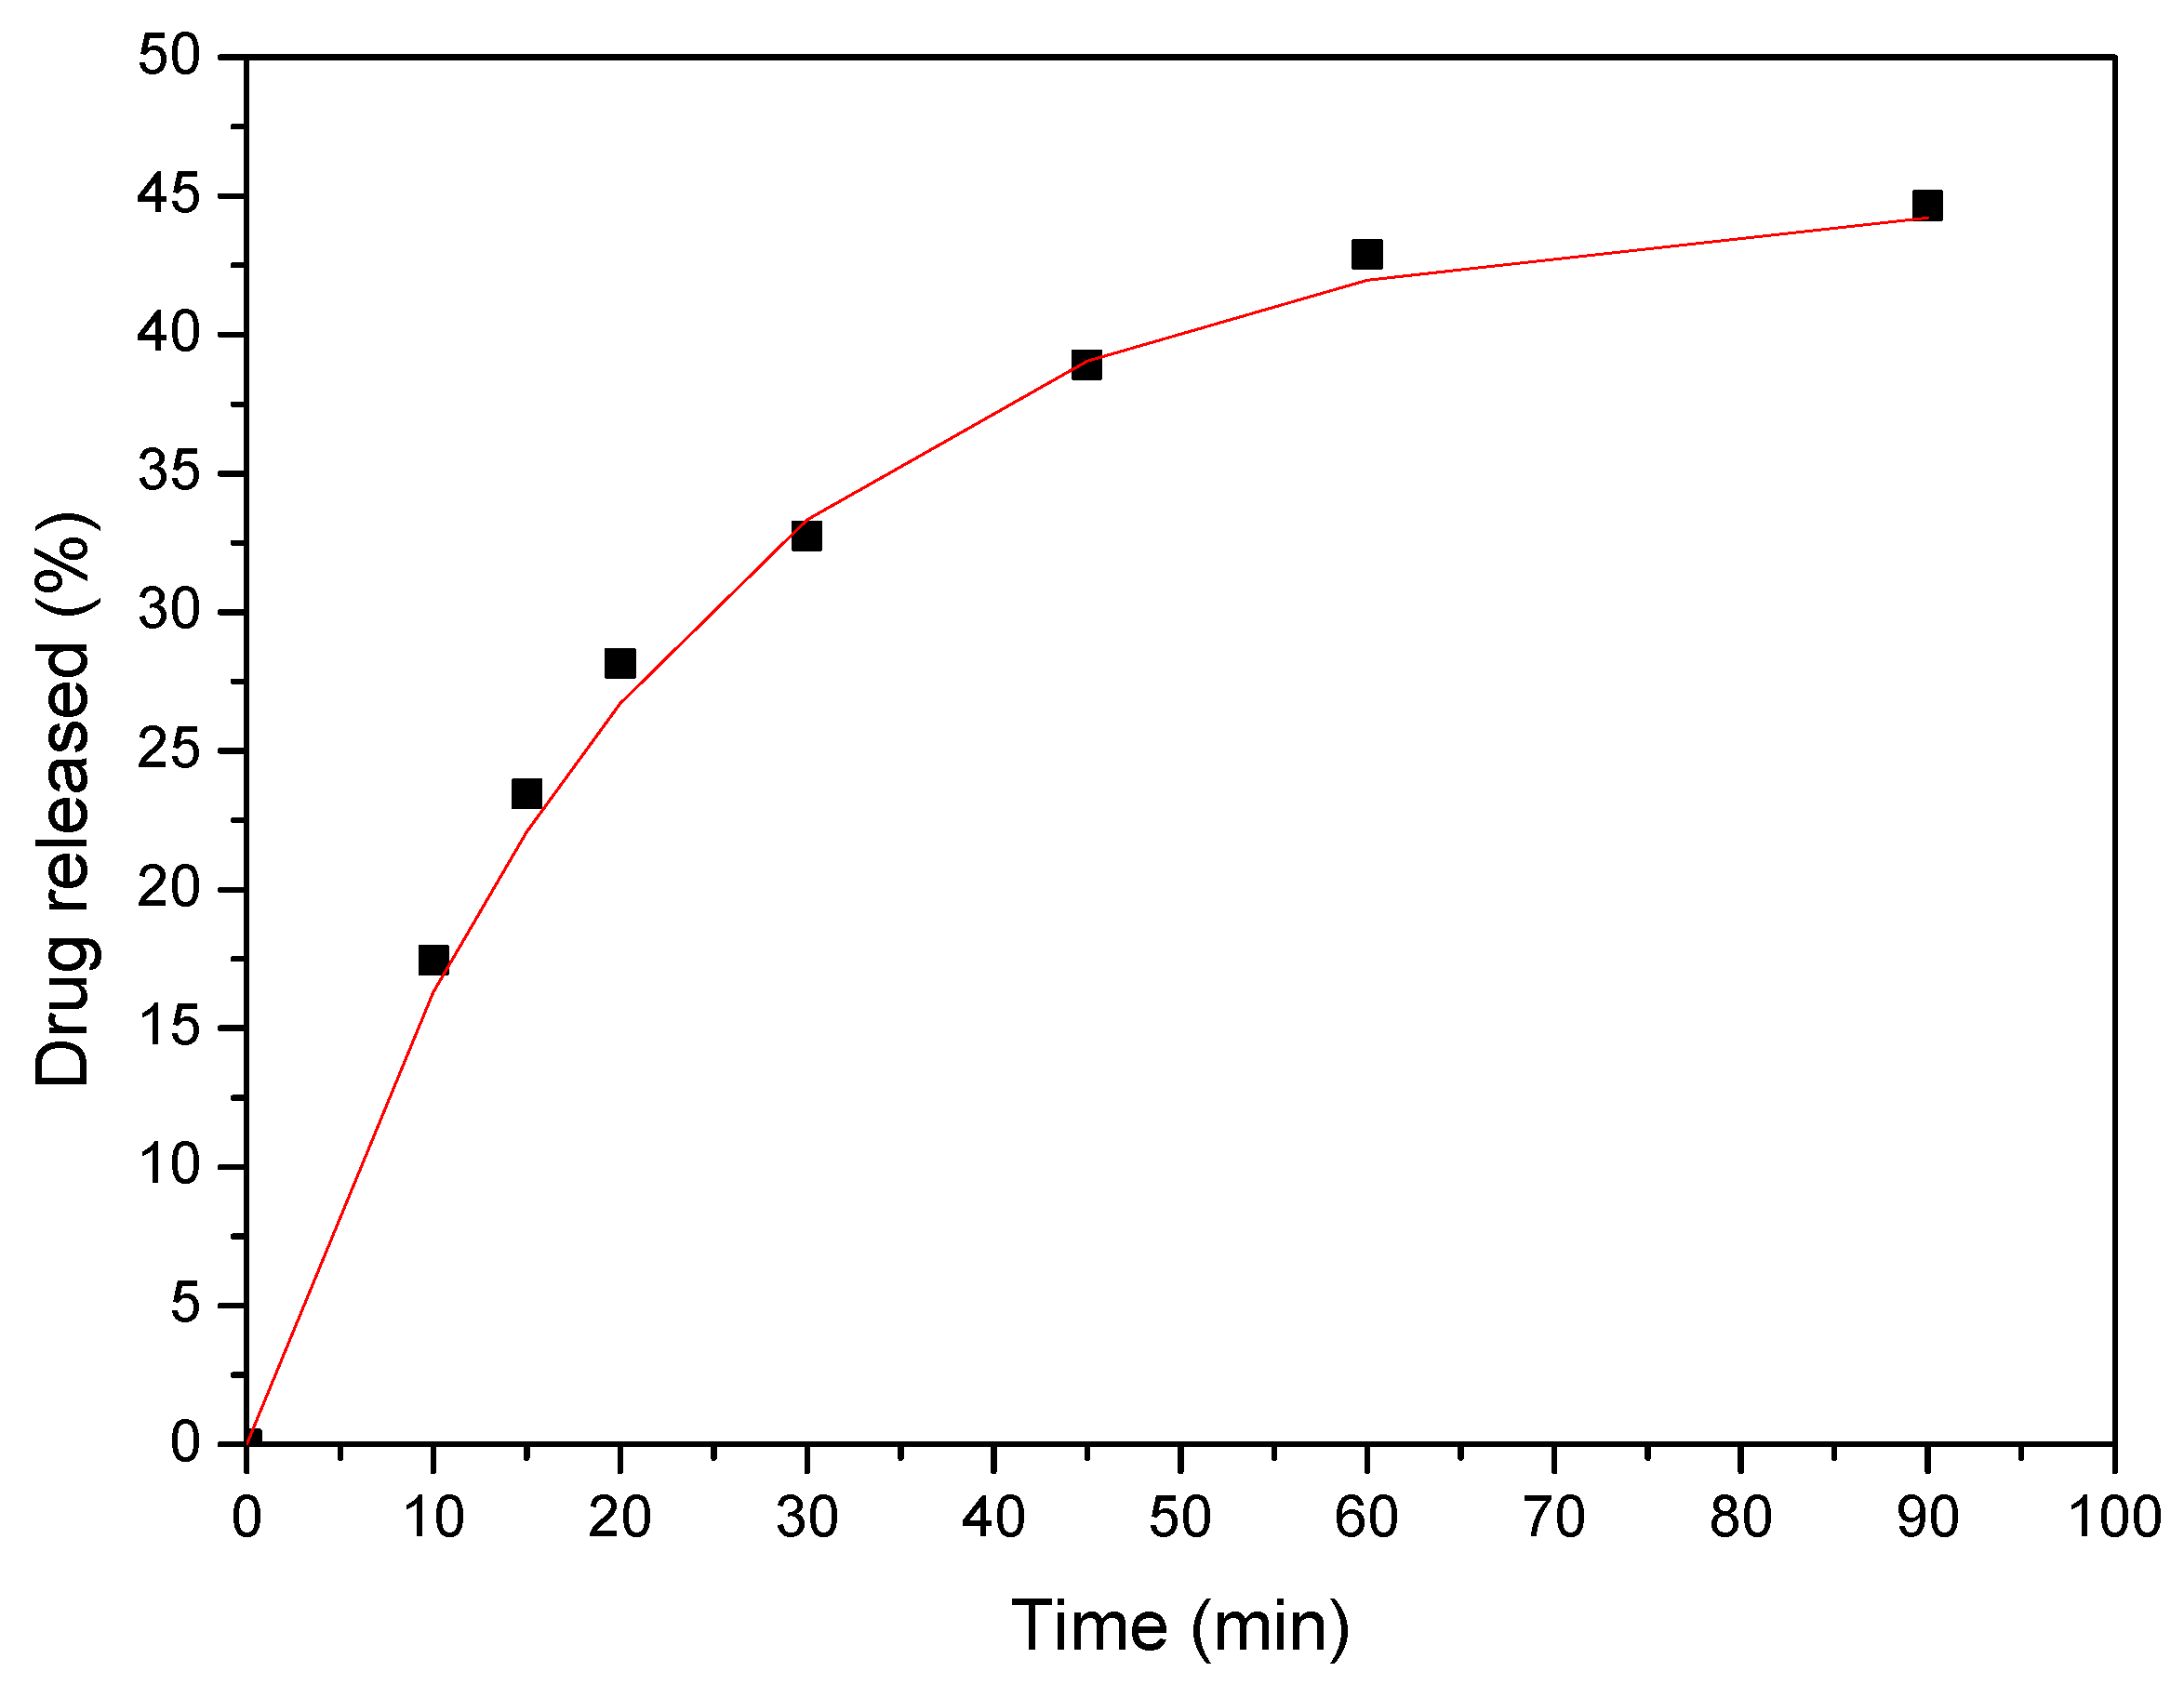
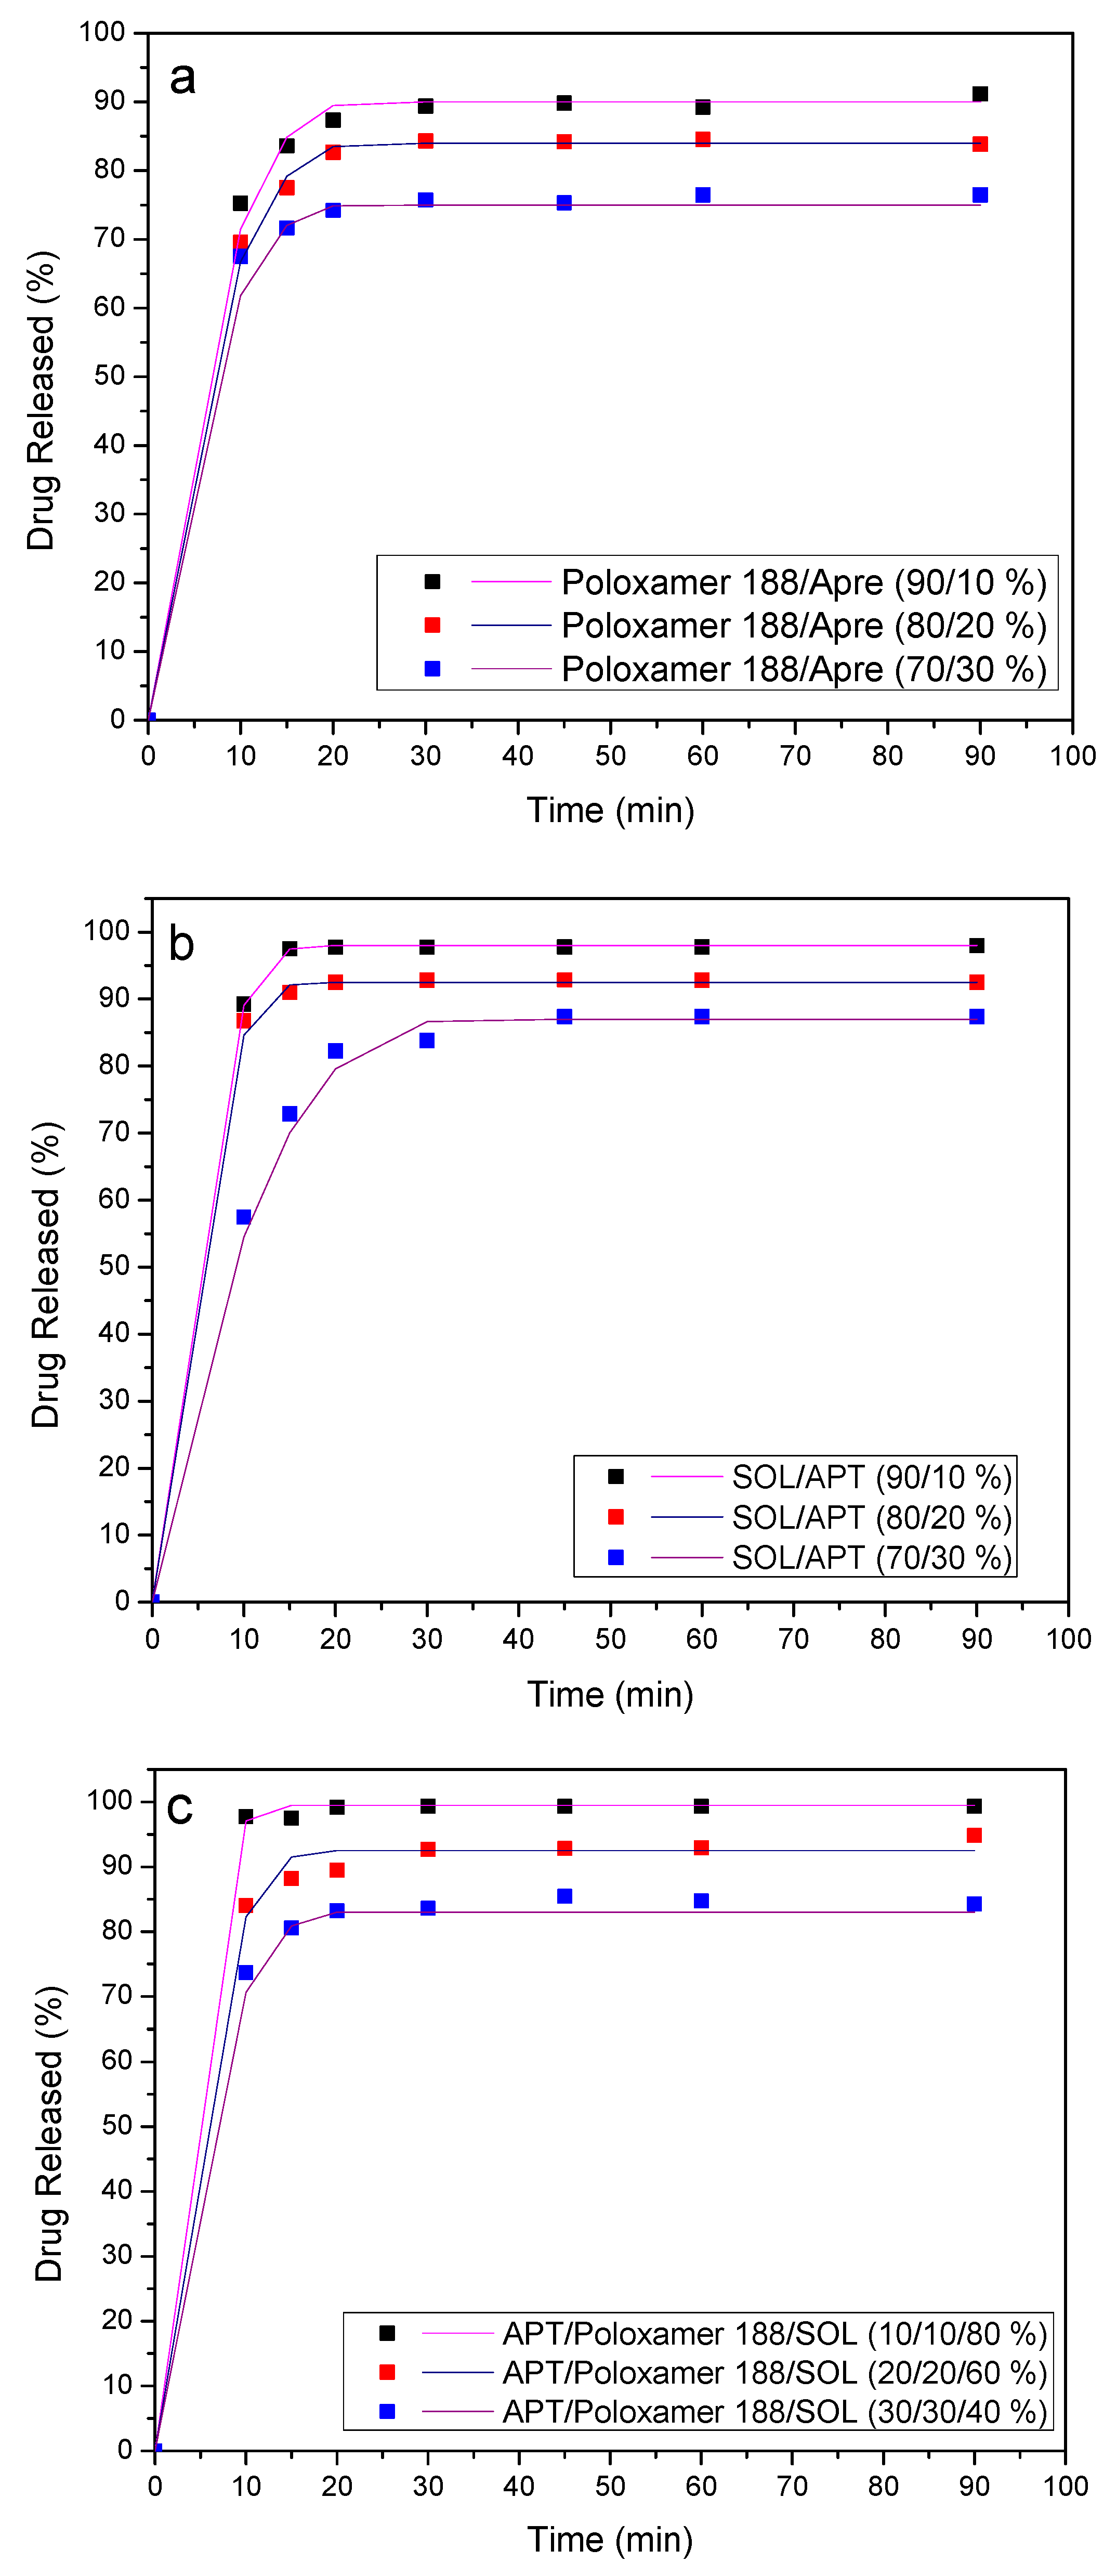
4. Release Mechanism Analysis

In the final section of the present manuscript, an attempt will be made in order to analyze the observed dissolution results based on the occurring physicochemical processes. The key aspect of dissolution mechanism is the degree of crystallinity in the solute, which directly affects API’s solubility. The larger the degree of crystallinity the smaller the solubility.
Initially, the mechanism of neat API release was evaluated. The governing equation for the drug concentration C in the dissolution vessel is:
V dC dt = K ( C C eq )
where, K (units: m3/min) is the effective overall dissolution rate constant. It is characterized as effective because it contains the drug-fluid interfacial area. The time is denoted as t, the liquid volume as V and the drug solubility as Ceq. The dissolution process consists of two steps: initially, the API dissociates in order to pass from the solid to the liquid phase, and then it is transferred from the region of the solid to the bulk of the fluid. The constant K contributes in both steps. It is important to note that Equation (1) appears similar to Noyes-Whitney equation [60] but there is a very important difference. The Noyes-Whitney equation considers that the dissolution depends only on the convection diffusion step, and hence the K constant is proportional to drug diffusivity in the liquid. However, the time constant of the order of one hour, appearing in the present release experiment, is extremely large for the convective diffusion step considering the high mixing rate (100 rpm) of the present experiments. This means that the K constant is completely dominated by the dissociation process and it is actually a dissociation constant.
The solid drug amount at time t in the vessel is denoted as m(t) with initial value of m(0) = mo, while m is equal to mo-VC. Additionally, the release rate (%) measured experimentally can be computed as 100(1 − m/mo). Combining all the above equations results:
Drug Released ( % ) = 100 VC eq m o ( 1 exp ( K V t ) )
The above equation is fitted to the experimental data and the fitted curve is shown in Figure 10. The parameter values resulted from the fitting procedure are VCeq/mo = 0.45 and KV = 0.045 min−1.
It is preferable not to use specific values for V and mo since the same values have been employed for all the experiments of the present work, and hence the normalized values presented for Ceq are directly comparable to each other.
In the next step, the mechanism of API released from the polymer matrices was evaluated. In these cases, mechanism of API release is probably matrix erosion, since the possibility of having an additional diffusion contribution, can be neglected as the drug is in the form of nano-crystals that cannot diffuse in the polymer matrix. Thus, the polymer matrix is eroded and the incorporated drug crystals are released into the dissolution medium. This means that the whole release process is dictated by polymer erosion characteristics. Since the SD particles used for the dissolution release experiments were sieved from a 1 mm sieve, a characteristic particle size diameter of 0.5 mm (corresponding to a radius of Ro = 0.25 mm) can be considered as a reasonable assumption.
Hence, for the erosion based release model, the key parameter is the linear polymer erosion rate constant k (m/min) [61], by assuming spherical particle shape with a radius evolving as R = Ro-kt. This means that (assuming a uniform drug distribution in the polymer particle) the fraction of the already released drug is the same with the fraction of the eroded polymer volume that is equal to 1 − (R/Ro)3. Based on the above (and after some algebraic calculations employed) the following equation is derived:
Drug Released ( % ) = 100 VC eq m o ( 1 ( 1 kt R o ) 3 )
The above equation is fitted to the release data profiles in order to determine the values of parameters A = VCeq/mo and B = k/Ro. The comparison between experimental release data and fitted profiles is shown in Figure 11.
The values of parameter A were 0.90, 0.84, 0.75 for Poloxamer 188 with 10%, 20%, 30% APT respectively; 0.98, 0.825, 0.87 for Soluplus with 10%, 20%, 30% APT respectively and 0.995, 0.925, 0.83 for ternary solid dispersion having 10%, 20% and 30% APT, respectively. The dimensionless APT solubility increases compared to value (0.45) calculated for neat APT. This is probably due to the fact that larger APT content leads to higher degree of recrystallization (consistent with the larger nanoparticle size observed) leading to lower API solubility.
In regards to B constant estimations, Poloxamer 188 based SDs showed a B value of 0.042 min−1 in all cases, indicating that the API erosion is independent to API content. In contrast of Poloxamer, SOL based SDs showed B values of 0.055, 0.055 and 0.028 min−1 for APT content of 10%, 20% and 30%, respectively, while in ternary SDs B constant values were 0.071, 0.052 and 0.047 min−1 for APT content of 10%, 20%, and 30%, respectively. Hence, it is obvious that the matrix erosion rate decreases as drug content increases. This could be an artificial result induced from the reduction of the APT dissolution rate as its content increases and recrystallization degree increases too. Unfortunately, the present experimental results do not admit the identification of a combined model including polymer erosion and drug dissolution occurring simultaneously. Additional experimental information (e.g., on polymer particle size evolution) is needed for this purpose.

5. Conclusions

In the present work APT ternary SDs were prepared successfully for first time using blends of SOL with Poloxamer 188. Melt mixing temperature for the preparation of either binary or ternary SDs determined via HSM revealed that Poloxamer 188 acts as a plasticizer to SOL. DSC, WAXD and SEM studies showed that nano-crystals of API were dispersed in the all SD systems, while FT-IR analysis showed that the API does not interact with either Poloxamer 188 or SOL. Dissolution studies of both binary and ternary SDs showed that Poloxamer 188 strongly affected release profile of APT, since an initial burst effect leading to high percentages of dissolution rate were observed in all ternary SDs. In all prepared solid dispersions the drug dissolution is substantially enhanced, compared to neat drug, proving that the chosen polymer matrices are appropriate to produce immediately release formulations. The release mechanic analysis showed that APT is mainly controlled via matrix erosion. Finally, it is proved that melt mixing is a successful technique to produce in short time solid dispersions with desired release properties.

Author Contributions

Investigation-performed the experiments; S.N. and R.M.E.; methodology-writing—original draft preparation, P.B.; performed the model analysis, M.K.; review and editing-supervision, E.K., writing—review and editing-supervision, D.B.

Funding

This research received no external funding.

Conflicts of Interest

The authors declare no conflict of interest.

References

  1. Poli-Bigelli, S.; Rodrigues-Pereira, J.; Carides, A.D.; Julie Ma, G.; Eldridge, K.; Hipple, A.; Evans, J.K.; Horgan, K.J.; Lawson, F. Addition of the neurokinin 1 receptor antagonist aprepitant to standard antiemetic therapy improves control of chemotherapy-induced nausea and vomiting. Results from a randomized, double-blind, placebo-controlled trial in Latin America. Cancer 2003, 97, 3090–3098. [Google Scholar] [CrossRef] [PubMed]
  2. Wu, Y.; Loper, A.; Landis, E.; Hettrick, L.; Novak, L.; Lynn, K.; Chen, C.; Thompson, K.; Higgins, R.; Batra, U.; et al. The role of biopharmaceutics in the development of a clinical nanoparticle formulation of MK-0869: A Beagle dog model predicts improved bioavailability and diminished food effect on absorption in human. Int. J. Pharm. 2004, 285, 135–146. [Google Scholar] [CrossRef] [PubMed]
  3. Aapro, M.; Carides, A.; Rapoport, B.L.; Schmoll, H.J.; Zhang, L.; Warr, D. Aprepitant and fosaprepitant: A 10-year review of efficacy and safety. Oncoloqist 2015, 20, 450–458. [Google Scholar] [CrossRef] [PubMed]
  4. Chan, V.T.; Yeo, W. Antiemetic therapy options for chemotherapy-induced nausea and vomiting in breast cancer patients. Breast Cancer (Dove Med Press) 2011, 3, 151–160. [Google Scholar] [PubMed]
  5. Cocquyt, V.; Van Belle, S.; Reinhardt, R.R.; Decramer, M.L.; O’Brien, M.; Schellens, J.H.; Borms, M.; Verbeke, L.; Van Aelst, F.; De Smet, M.; et al. Comparison of L-758,298, a prodrug for the selective neurokinin-1 antagonist, L-754,030, with ondansetron for the prevention of cisplatin-induced emesis. Eur. J. Cancer (Oxf. Engl.: 1990) 2001, 37, 835–842. [Google Scholar] [CrossRef]
  6. Kamboj, S.; Sharma, R.; Singh, K.; Rana, V. Aprepitant loaded solid preconcentrated microemulsion for enhanced bioavailability: A comparison with micronized Aprepitant. Eur. J. Pharm. Sci.: Off. J. Eur. Fed. Pharm. Sci. 2015, 78, 90–102. [Google Scholar] [CrossRef] [PubMed]
  7. Kesisoglou, F.; Wu, Y. Understanding the effect of API properties on bioavailability through absorption modeling. AAPS J. 2008, 10, 516–525. [Google Scholar] [CrossRef] [PubMed]
  8. Olver, I.; Shelukar, S.; Thompson, K.C. Nanomedicines in the treatment of emesis during chemotherapy: Focus on aprepitant. Int. J. Nanomed. 2007, 2, 13–18. [Google Scholar] [CrossRef]
  9. Bala, R.; Sharmab, S. Formulation optimization and evaluation of fast dissolving film of aprepitant by using design of experiment. Bull. Faculty Pharmacy, Cairo University 2018, 56, 159–168. [Google Scholar] [CrossRef]
  10. Sanchez, R.I.; Wang, R.W.; Newton, D.J.; Bakhtiar, R.; Lu, P.; Chiu, S.H.; Evans, D.C.; Huskey, S.E. Cytochrome P450 3A4 is the major enzyme involved in the metabolism of the substance P receptor antagonist aprepitant. Drug Metab. Dispos.: Biol. Fate Chem. 2004, 32, 1287–1292. [Google Scholar] [CrossRef]
  11. Singh, A.; Worku, Z.A.; Van den Mooter, G. Oral formulation strategies to improve solubility of poorly water-soluble drugs. Expert Opin. Drug Deliv. 2011, 8, 1361–1378. [Google Scholar] [CrossRef] [PubMed]
  12. Kesisoglou, F.; Mitra, A. Crystalline nanosuspensions as potential toxicology and clinical oral formulations for BCS II/IV compounds. AAPS J. 2012, 14, 677–687. [Google Scholar] [CrossRef] [PubMed]
  13. Shono, Y.; Jantratid, E.; Kesisoglou, F.; Reppas, C.; Dressman, J.B. Forecasting in vivo oral absorption and food effect of micronized and nanosized aprepitant formulations in humans. Eur. J. Pharm. Biopharm. Off. J. Arb. Fur Pharm. Verfahr. E.V 2010, 76, 95–104. [Google Scholar] [CrossRef] [PubMed]
  14. Ren, L.; Zhou, Y.; Wei, P.; Li, M.; Chen, G. Preparation and pharmacokinetic study of aprepitant-sulfobutyl ether-beta-cyclodextrin complex. Aaps Pharmscitech 2014, 15, 121–130. [Google Scholar] [CrossRef] [PubMed]
  15. Angi, R.; Solymosi, T.; Otvos, Z.; Ordasi, B.; Glavinas, H.; Filipcsei, G.; Heltovics, G.; Darvas, F. Novel continuous flow technology for the development of a nanostructured aprepitant formulation with improved pharmacokinetic properties. Eur. J. Pharm. Biopharm.: Off. J. Arb. Fur Pharm. Verfahr. E.V 2014, 86, 361–368. [Google Scholar] [CrossRef] [PubMed]
  16. Barmpalexis, P.; Grypioti, A.; Eleftheriadis, G.K.; Fatouros, D.G. Development of a New Aprepitant Liquisolid Formulation with the Aid of Artificial Neural Networks and Genetic Programming. Aaps Pharmscitech 2018, 19, 741–752. [Google Scholar] [CrossRef]
  17. Chandrasekhara Rao, B.; Vidyadhara, S.; Sasidhar, R.; Chowdary, Y.A. Dissolution enhancement of poorly soluble drug aprepitant by hot melt extrusion method using hydrophilic polymer: A solid dispersion technique. Res. J. Pharm. Biol. Chem. Sci. 2014, 5, 1469–1485. [Google Scholar]
  18. Liu, J.; Zou, M.; Piao, H.; Liu, Y.; Tang, B.; Gao, Y.; Ma, N.; Cheng, G. Characterization and Pharmacokinetic Study of Aprepitant Solid Dispersions with Soluplus(R). Molecules 2015, 20, 11345–11356. [Google Scholar] [CrossRef]
  19. Penumetcha, S.S.; Gutta, L.N.; Dhanala, H.; Yamili, S.; Challa, S.; Rudraraju, S.; Rudraraju, S.; Rudraraju, V. Hot melt extruded Aprepitant-Soluplus solid dispersion: Preformulation considerations, stability and in vitro study. Drug Dev. Ind. Pharm. 2016, 42, 1609–1620. [Google Scholar] [CrossRef]
  20. Puncochova, K.; Ewing, A.V.; Gajdosova, M.; Sarvasova, N.; Kazarian, S.G.; Beranek, J.; Stepanek, F. Identifying the mechanisms of drug release from amorphous solid dispersions using MRI and ATR-FTIR spectroscopic imaging. Int. J. Pharm. 2015, 483, 256–267. [Google Scholar] [CrossRef]
  21. Puncochova, K.; Vukosavljevic, B.; Hanus, J.; Beranek, J.; Windbergs, M.; Stepanek, F. Non-invasive insight into the release mechanisms of a poorly soluble drug from amorphous solid dispersions by confocal Raman microscopy. Eur. J. Pharm. Biopharm.: Off. J. Arb. Fur Pharm. Verfahr. E.V 2016, 101, 119–125. [Google Scholar] [CrossRef] [PubMed]
  22. Bikiaris, D.N. Solid dispersions, part I: Recent evolutions and future opportunities in manufacturing methods for dissolution rate enhancement of poorly water-soluble drugs. Expert Opin. Drug Deliv. 2011, 8, 1501–1519. [Google Scholar] [CrossRef] [PubMed]
  23. Bikiaris, D.N. Solid dispersions, part II: New strategies in manufacturing methods for dissolution rate enhancement of poorly water-soluble drugs. Expert Opin. Drug Deliv. 2011, 8, 1663–1680. [Google Scholar] [CrossRef] [PubMed]
  24. Pappa, C.; Nanaki, S.; Giliopoulos, D.; Triantafyllidis, K.; Kostoglou, M.; Avgeropoulos, A.; Bikiaris, D. Nanostructured Composites of Sodium Montmorillonite Clay and PEO Used in Dissolution Improvement of Aprepitant Drug by Melt Mixing. Appl. Sci. 2018, 8, 786. [Google Scholar] [CrossRef]
  25. Aho, J.; Edinger, M.; Botker, J.; Baldursdottir, S.; Rantanen, J. Oscillatory Shear Rheology in Examining the Drug-Polymer Interactions Relevant in Hot Melt Extrusion. J. Pharm. Sci. 2016, 105, 160–167. [Google Scholar] [CrossRef] [PubMed]
  26. Edueng, K.; Mahlin, D.; Bergstrom, C.A.S. The Need for Restructuring the Disordered Science of Amorphous Drug Formulations. Pharm. Res. 2017, 34, 1754–1772. [Google Scholar] [CrossRef] [PubMed] [Green Version]
  27. Maniruzzaman, M.; Morgan, D.J.; Mendham, A.P.; Pang, J.; Snowden, M.J.; Douroumis, D. Drug-polymer intermolecular interactions in hot-melt extruded solid dispersions. Int. J. Pharm. 2013, 443, 199–208. [Google Scholar] [CrossRef] [PubMed]
  28. Patil, H.; Tiwari, R.V.; Repka, M.A. Hot-Melt Extrusion: From Theory to Application in Pharmaceutical Formulation. Aaps Pharmscitech 2016, 17, 20–42. [Google Scholar] [CrossRef] [PubMed]
  29. Tiwari, R.V.; Patil, H.; Repka, M.A. Contribution of hot-melt extrusion technology to advance drug delivery in the 21st century. Expert Opin. Drug Deliv. 2016, 13, 451–464. [Google Scholar] [CrossRef] [PubMed]
  30. Maniruzzaman, M.; Boateng, J.S.; Snowden, M.J.; Douroumis, D. A Review of Hot-Melt Extrusion: Process Technology to Pharmaceutical Products. Isrn Pharm. 2012, 2012, 9. [Google Scholar] [CrossRef]
  31. Maniruzzaman, M.; Nair, A.; Scoutaris, N.; Bradley, M.S.; Snowden, M.J.; Douroumis, D. One-step continuous extrusion process for the manufacturing of solid dispersions. Int. J. Pharm. 2015, 496, 42–51. [Google Scholar] [CrossRef] [PubMed]
  32. Maniruzzaman, M.; Rana, M.M.; Boateng, J.S.; Mitchell, J.C.; Douroumis, D. Dissolution enhancement of poorly water-soluble APIs processed by hot-melt extrusion using hydrophilic polymers. Drug Dev. Ind. Pharm. 2013, 39, 218–227. [Google Scholar] [CrossRef] [PubMed]
  33. Papageorgiou, G.Z.; Bikiaris, D.; Karavas, E.; Politis, S.; Docoslis, A.; Park, Y.; Stergiou, A.; Georgarakis, E. Effect of physical state and particle size distribution on dissolution enhancement of nimodipine/PEG solid dispersions prepared by melt mixing and solvent evaporation. AAPS J. 2006, 8, E623–E631. [Google Scholar] [CrossRef] [PubMed] [Green Version]
  34. Vithani, K.; Maniruzzaman, M.; Slipper, I.J.; Mostafa, S.; Miolane, C.; Cuppok, Y.; Marchaud, D.; Douroumis, D. Sustained release solid lipid matrices processed by hot-melt extrusion (HME). Colloids Surf. Bbiointerfaces 2013, 110, 403–410. [Google Scholar] [CrossRef] [PubMed]
  35. Dengale, S.J.; Grohganz, H.; Rades, T.; Lobmann, K. Recent advances in co-amorphous drug formulations. Adv. Drug Deliv. Rev. 2016, 100, 116–125. [Google Scholar] [CrossRef] [PubMed]
  36. Keen, J.M.; McGinity, J.W.; Williams, R.O., III. Enhancing bioavailability through thermal processing. Int. J. Pharm. 2013, 450, 185–196. [Google Scholar] [CrossRef] [PubMed]
  37. Ouyang, D. Investigating the molecular structures of solid dispersions by the simulated annealing method. Chem. Phys. Lett. 2012, 554, 177–184. [Google Scholar] [CrossRef]
  38. Thiry, J.; Krier, F.; Evrard, B. A review of pharmaceutical extrusion: Critical process parameters and scaling-up. Int. J. Pharm. 2015, 479, 227–240. [Google Scholar] [CrossRef]
  39. Li, Y.; Pang, H.; Guo, Z.; Lin, L.; Dong, Y.; Li, G.; Lu, M.; Wu, C. Interactions between drugs and polymers influencing hot melt extrusion. J. Pharm. Pharmacol. 2014, 66, 148–166. [Google Scholar] [CrossRef]
  40. Albadarin, A.B.; Potter, C.B.; Davis, M.T.; Iqbal, J.; Korde, S.; Pagire, S.; Paradkar, A.; Walker, G. Development of stability-enhanced ternary solid dispersions via combinations of HPMCP and Soluplus((R)) processed by hot melt extrusion. Int. J. Pharm. 2017, 532, 603–611. [Google Scholar] [CrossRef]
  41. Davis, M.T.; Potter, C.B.; Mohammadpour, M.; Albadarin, A.B.; Walker, G.M. Design of spray dried ternary solid dispersions comprising itraconazole, soluplus and HPMCP: Effect of constituent compositions. Int. J. Pharm. 2017, 519, 365–372. [Google Scholar] [CrossRef] [PubMed] [Green Version]
  42. Janssens, S.; de Armas, H.N.; Roberts, C.J.; Van den Mooter, G. Characterization of ternary solid dispersions of itraconazole, PEG 6000, and HPMC 2910 E5. J. Pharm. Sci. 2008, 97, 2110–2120. [Google Scholar] [CrossRef] [PubMed]
  43. Meng, F.; Gala, U.; Chauhan, H. Classification of solid dispersions: Correlation to (i) stability and solubility (ii) preparation and characterization techniques. Drug Dev. Ind. Pharm. 2015, 41, 1401–1415. [Google Scholar] [CrossRef] [PubMed]
  44. Prasad, D.; Chauhan, H.; Atef, E. Amorphous stabilization and dissolution enhancement of amorphous ternary solid dispersions: Combination of polymers showing drug-polymer interaction for synergistic effects. J. Pharm. Sci. 2014, 103, 3511–3523. [Google Scholar] [CrossRef] [PubMed]
  45. Prasad, D.; Chauhan, H.; Atef, E. Role of Molecular Interactions for Synergistic Precipitation Inhibition of Poorly Soluble Drug in Supersaturated Drug-Polymer-Polymer Ternary Solution. Mol. Pharm. 2016, 13, 756–765. [Google Scholar] [CrossRef]
  46. Six, K.; Verreck, G.; Peeters, J.; Brewster, M.; Van Den Mooter, G. Increased physical stability and improved dissolution properties of itraconazole, a class II drug, by solid dispersions that combine fast- and slow-dissolving polymers. J. Pharm. Sci. 2004, 93, 124–131. [Google Scholar] [CrossRef]
  47. Barmpalexis, P.; Koutsidis, I.; Karavas, E.; Louka, D.; Papadimitriou, S.A.; Bikiaris, D.N. Development of PVP/PEG mixtures as appropriate carriers for the preparation of drug solid dispersions by melt mixing technique and optimization of dissolution using artificial neural networks. Eur. J. Pharm. Biopharm. 2013, 85, 1219–1231. [Google Scholar] [CrossRef]
  48. Fousteris, E.; Tarantili, P.A.; Karavas, E.; Bikiaris, D. Poly(vinyl pyrrolidone)–poloxamer-188 solid dispersions prepared by hot melt extrusion. J. Therm. Anal. Calorim. 2013, 113, 1037–1047. [Google Scholar] [CrossRef]
  49. Kyaw Oo, M.; Mandal, U.K.; Chatterjee, B. Polymeric behavior evaluation of PVP K30-poloxamer binary carrier for solid dispersed nisoldipine by experimental design. Pharm. Dev. Technol. 2017, 22, 2–12. [Google Scholar] [CrossRef]
  50. Papadimitriou, S.A.; Barmpalexis, P.; Karavas, E.; Bikiaris, D.N. Optimizing the ability of PVP/PEG mixtures to be used as appropriate carriers for the preparation of drug solid dispersions by melt mixing technique using artificial neural networks: I. Eur. J. Pharm. Biopharm. 2012, 82, 175–186. [Google Scholar] [CrossRef]
  51. Baghel, S.; Cathcart, H.; O’Reilly, N.J. Investigation into the Solid-State Properties and Dissolution Profile of Spray-Dried Ternary Amorphous Solid Dispersions: A Rational Step toward the Design and Development of a Multicomponent Amorphous System. Mol. Pharm. 2018, 15, 3796–3812. [Google Scholar] [CrossRef]
  52. Miao, L.; Liang, Y.; Pan, W.; Gou, J.; Yin, T.; Zhang, Y.; He, H.; Tang, X. Effect of supersaturation on the oral bioavailability of paclitaxel/polymer amorphous solid dispersion. Drug Deliv. Transl. Res. 2018. [Google Scholar] [CrossRef]
  53. Tang, J.; Bao, J.; Shi, X.; Sheng, X.; Su, W. Preparation, Optimization, and in vitro—In vivo Evaluation of Febuxostat Ternary Solid Dispersion. J. Microencapsul. 2018, 1–34. [Google Scholar] [CrossRef]
  54. Bikiaris, D.; Papageorgiou, G.Z.; Stergiou, A.; Pavlidou, E.; Karavas, E.; Kanaze, F.; Georgarakis, M. Physicochemical studies on solid dispersions of poorly water-soluble drugs: Evaluation of capabilities and limitations of thermal analysis techniques. Thermochim. Acta 2005, 439, 58–67. [Google Scholar] [CrossRef]
  55. Kanaze, F.I.; Kokkalou, E.; Niopas, I.; Georgarakis, M.; Stergiou, A.; Bikiaris, D. Dissolution enhancement of flavonoids by solid dispersion in PVP and PEG matrixes: A comparative study. J. Appl. Polym. Sci. 2006, 102, 460–471. [Google Scholar] [CrossRef]
  56. Karavas, E.; Georgarakis, E.; Bikiaris, D.; Thomas, T.; Katsos, V.; Xenakis, A. Hydrophilic Matrices as Carriers in Felodipine Solid Dispersion Systems; Springer: Berlin/Heidelberg, Germany, 2001; Volume 181, pp. 149–152, Progress in Colloid and Polymer Science. [Google Scholar]
  57. Docoslis, A.; Huszarik, K.L.; Papageorgiou, G.Z.; Bikiaris, D.; Stergiou, D.; Georgarakis, E. Characterization of the distribution, polymorphism, and stability of nimodipine in its solid dispersions in polyethylene glycol by micro-Raman spectroscopy and powder X-ray diffraction. AAPS J. 2007, 9, E361–E370. [Google Scholar] [CrossRef]
  58. Karavas, E.; Georgarakis, M.; Docoslis, A.; Bikiaris, D. Combining SEM, TEM, and micro-Raman techniques to differentiate between the amorphous molecular level dispersions and nanodispersions of a poorly water-soluble drug within a polymer matrix. Int. J. Pharm. 2007, 340, 76–83. [Google Scholar] [CrossRef]
  59. Papageorgiou, G.Z.; Docoslis, A.; Georgarakis, M.; Bikiaris, D. The effect of physical state on the drug dissolution rate. J. Therm. Anal. Calorim. 2009, 95, 903–915. [Google Scholar] [CrossRef]
  60. Hattori, Y.; Haruna, Y.; Otsuk, M. Dissolution process analysis using model-free Noyes–Whitney integral equation. Colloids Surf. B Biointerfaces 2013, 102, 227–231. [Google Scholar] [CrossRef]
  61. Parker, A.; Vigouroux, F.; Reed, W.F. Dissolution Kinetics of Polymer Powders. AIChE J. 2000, 46, 1290–1299. [Google Scholar] [CrossRef]
Scheme 1. Molecular structure of Aprepitant drug.
Sci 01 00048 sch001
Figure 1. Thermographic analysis (TGA) showing mass loss (%) profile (a) and first derivative (b) of pure APT, SOL and Poloxamer.
Sci 01 00048 g001
Figure 2. HSM micrographs obtained under polarized light for APT/Poloxamer 188 (a), APT/SOL (b) and APT/Poloxamer 188/SOL (c) physical mixtures at 10 % wt. of API.
Sci 01 00048 g002
Figure 3. HSM micrographs obtained under polarized light for APT/Poloxamer 188 20/80 physical mixture heated isothermally at 160 °C after (a), 2 min (b) 8 min and (c) 12 min.
Sci 01 00048 g003
Figure 4. DSC thermograms of APT, Poloxamer, 188 and SOL, along with binary and ternary SDs at several weight ratios.
Sci 01 00048 g004
Figure 5. FT-IR spectra of APT/Poloxamer 188 (a) and APT/SOL (b) binary SDs along with APT/Poloxamer 188/SOL (c) ternary SDs at various weight ratios.
Sci 01 00048 g005
Figure 6. WAXD diffractograms of APT/Poloxamer 188 (a) and APT/SOL (b) binary SDs along with APT/Poloxamer 188/SOL (c) ternary SDs at various weight ratios.
Sci 01 00048 g006
Figure 7. SEM micrographs of binary (APT/Poloxamer 188 and APT/SOL) and ternary (APT/Poloxamer 188/SOL) SDs containing: (a) 10.0 % wt. APT, (b) 20.0 % wt. APT and (c) 30.0 % wt. APT.
Sci 01 00048 g007
Figure 8. EDAX diagrams of APT/Poloxamer 188 (a), APT/SOL (b) and APT/Poloxamer 188/SOL (c) SDs containing 20.0 % wt. APT.
Sci 01 00048 g008
Figure 9. Dissolution profiles of neat APT and (a) APT/Poloxamer 188, (b) APT/SOL and (c) APT/Poloxamer 188/SOL SDs.
Sci 01 00048 g009
Figure 10. Comparison between experimental (symbols) and model (continuous line) dissolution profiles for neat APT.
Sci 01 00048 g010
Figure 11. Comparison between experimental (symbols) and model (continuous lines) dissolution profiles for (a) APT/Poloxamer 188, (b) APT/SOL and (c) APT/Poloxamer 188/SOL SDs.
Sci 01 00048 g011
Table 1. Melt mixing parameters and composition of the prepared APT binary and ternary solid dispersions.
SampleTemperature (°C)Mixing Time (min)
Binary SDs
 Poloxamer/APT (90/10 w/w)160.015.0
 Poloxamer/APT (80/20 w/w)160.015.0
 Poloxamer/APT (70/30 w/w)160.015.0
 SOL/APT (90/10 w/w)160.015.0
 SOL/APT (80/20 w/w)160.015.0
 SOL/APT (70/30 w/w)160.015.0
Ternary SDs
 SOL/Poloxamer/APT (80/10/10 w/w/w)160.015.0
 SOL/Poloxamer/APT (60/20/20 w/w/w)160.015.0
 SOL/Poloxamer/APT (40/30/30 w/w/w)160.015.0

