
A QGIS-Based Road Network Analysis for Sustainable Road Network Infrastructure: An Application to the Cachar District in Assam, India


Department of Applied Science and Humanities, Assam University, Silchar 788011, Cachar, Assam, India
Infrastructures 2022, 7(9), 114; https://doi.org/10.3390/infrastructures7090114
Submission received: 20 July 2022
/
Revised: 12 August 2022
/
Accepted: 27 August 2022
/
Published: 30 August 2022
Abstract
:Efficient transportation and road network infrastructure plays the most significant role in the development of any region. However, the effectiveness of a road network is often affected by problems like road condition, traffic congestion, road blockage, road accidents etc. Digitization of the road network and its analysis can therefore be an effective tool towards resolving these issues. The free and open-source software Quantum Geographic Information System (QGIS) is well suited for such an analysis. QGIS can be used for construction of suitable road network maps of certain areas which provide sufficient information for such analysis. Cachar district of Assam, particularly Silchar circle, suffers frequently from traffic problems for being a network hub for other neighbouring revenue circles and some neighbouring north-eastern states. The scientific visualization and analysis of the road network of this district using GIS tools is still not available in literature. The results of the current study and their application could help the administrators and decisionmakers to build a sustainable road network. In this paper, we make an attempt to digitize the existing road network of Cachar district for its proper analysis. We compile the major and minor road density maps for the five revenue circles of the district. We use OpenStreetMap (OSM) to access and download existing road network in the district. Further, using the shortest path tool in QGIS, we find and display the shortest route between two junction points in the road network. Finding optimal route can be of great utility during emergency medical responses or fire or flood situations. Most of the major and minor roads within Cachar district were digitized in QGIS environment to perform the road network analysis.
Keywords:
QGIS; network analysis; Cachar district; shortest route; road density map; digitization; shapefile1. Introduction
Traffic congestion has become a serious problem in the everyday life of the people of Cachar district, particularly in Silchar city. Blockage of footpath by unauthorized shops, setting up unauthorized parking spaces, uncontrolled number of autorikshaws and personal vehicles, narrow roads are some of the prevalent reasons for the same. Frequent flash floods and water-logging have also become a menace for the people of the district. Rapid and unplanned urbanization and extending beyond limits the streets, lanes and driveways, cutting of trees, all such activities have contributed to these problems. Hence, to obtain a sustainable and efficient road network, its digitization and analysis has become essential.
A Geographic Information System (GIS) is a computer system that analyzes and displays geographically referenced information. It combines software tools for managing, analyzing, editing and visualizing such information [1]. QGIS has a very useful network analysis tool that serves the purpose towards solving road network related issues [2]. Road graph plugin has to be configured in this connection and OSM can provide the necessary road network data. The shortest path tool in QGIS finds and displays the shortest route between two points in the network.
1.1. Literature Review
Kurtin [3] presented a review, assessment and projection of network analysis in geographic information science. Poser and Dransch [4] utilized GIS data for disaster management with application to rapid flood damage estimation. Mukherjee [5] performed a statistical analysis of the road network of India and proposed a novel approach to identify the potential congestion points, reduce congestion and improve the performance of the highway network. Hecht et al. [6] described a method for measuring completeness of building footprints in OSM over space and time. Graser and Olaya [7] presented a Python framework for the seamless integration of geoprocessing tools in QGIS.
Balla et al. [8] determined, compared and geovisualized different water quality indices in an eastern Hungarian settlement during the period 2011–2019 using a WebGIS application. In this significant study, it was found that the inner and south-eastern areas of the settlement were the most polluted in the period before the sewerage network was established. In the period following the establishment of the sewerage network, the degree of contamination in the inner areas of the settlement decreased by 1–2 categories in almost all wells. Geovisualization with the help of WebGIS application played a very important part in their study. The most important advantage of developed geovisualization tools is the visualized spatial environmental data, which makes valuable information understandable for both the public and decisionmakers. In the current study also we have attempted to geovisulalize the 2D maps using QGIS application to present a scientific road network analysis of our study area that can be used by the decisionmakers for the improvement of the road infrastructure.
A review on flood modelling tools for transformation of spatial and non-spatial data to 3D geovisualization was presented by Muhammad et al. [9]. Fuhrmann and Pike [10] described user centered design of collaborative geovisualization tools. A software reference architecture for service-oriented 3D geovisualization systems was developed by Hildebrandt [11].
Chiesa et al. [12] presented a system for monitoring of the particulate content in an urban environment. They developed a decision support system based on a GIS platform to elaborate the data in real time for helping the city’s administrators to develop a smart road infrastructure.
For further significant research contributions in connection with geovisualization tools and techniques and future possibilities, we refer to the works of MacEachren et al. [13], Dykes et al. [14], Evangelidis et al. [15], Farkas [16], Haklay et al. [17], Jiang and Li [18], Molnar et al. [19], Zichar [20]
However, geovisualization possibilities are frequently faced with technical research challenges which have been efficiently described by MacEachren and Kraak [21].
Recently, Debashis et al. [22] performed the road network analysis of Guwahati city of India using GIS.
1.2. Motivation
After a watchful literature review, it was observed that in most of the research, road network analysis of major highways of particular countries are done although the minor roads of a particular region are equally significant. Motivated by this fact, in the current study, we perform a road network analysis for Cachar district in QGIS environment. In our analysis, we consider both the major and minor roads of our study area. Our findings will be greatly useful in other disciplines particularly in environmental sciences in the sense that a sustainable road network infrastructure will result in reducing the air pollutants emitted from vehicles. It will also pave the way for finding plantation grounds with the help of geovisualization of the road network maps. The novelty of the current study lies in the fact that such scientific visualization and analysis of the road network of Cachar district using WebGIS applications is still not available in literature. The results of the current study and their application could help the administrators and decisionmakers to build a sustainable road network.
1.3. Research Questions
We attempt to address the following research queries in our study: (a) how can we develop a more efficient and editable road network system than the ones provided by Google maps and other similar web services? (b) how can we replicate and utilize our results in other fields such as medical emergencies, fire emergencies, floods etc.? (c) road network analysis of Cachar district in Assam, India is not available in literature. How to address this issue? (d) what are the limitations of our study and how can we overcome them? (e) what are the future research directions?
We organize the current research in the following manner: after providing a relevant and concise literature review and addressing the existing research gaps in Section 1, we present the methodology (Section 2) of our work. In the methodology, we describe the study area, discuss the methods and provide software links. In Section 3, we provide the analysis of the used algorithm. The results are presented in Section 4 whereas the discussion is done in Section 5. The limitations of the current study are talked about in Section 6. Finally, conclusion and future research directions are indicated in Section 7.
2. Methodology
2.1. Description of Study Area
Our study area is Cachar district which is situated at the most southern part of the state of Assam, India. It holds a special importance in the state sharing boundary with two other states Mizoram and Manipur. It also has an international boundary with Bangladesh that extends along the Barak Valley region. On the northern side it shares boundaries with the state of Meghalaya along the Jaintia hills district and Hills of North Cachar Hills district. These two hill districts distinguish Cachar from Meghalaya state and the Brahmaputra Valley. Further, Manipur surrounds the east part of Cachar, while its southern border is bounded by the state of Mizoram. On the west part, the district shares its boundary with Bangladesh and the Hailakandi district. Cachar district is situated between longitude East and East and latitudes North and North. The geographical area of Cachar district is 3786 km as per record.
The details about the Cachar district can be found in the state government website www.cachar.gov.in (accessed on 15 June 2022).
2.2. Methods
For the road network analysis of Cachar district, a street basemap of the district road network was added in QGIS from the Google Earth Pro satellite imagery and geo-referenced to obtain the coordinates. Initially, a .kml file was created from the Google Earth and the road network data was downloaded from that file using OSM and a .osm file was created. A road data shapefile was created from that .osm file.
For the analysis purpose, the road data was categorized into two layers such as major roads (primary roads and trunks) and minor roads (secondary, tertiary and track roads). The basemap was digitized for each layer. In the process of digitization, a real world object gets converted into an electronic version. Thus, digitization ensures that a real world object can be stored, displayed, edited in computer and transmitted over networks.
A geo-referenced demarcation basemap was drawn as a layer over the district based on the administrative map of Cachar district available from the official website of Assam State Disaster Management Authority (ASDMA) (http://sdmassam.nic.in/, accessed on 15 June 2022) (Figure 1).
2.3. Software Links
Latest and old versions of QGIS can be downloaded from the link: https://www.qgis.org/en/site/forusers/download.html, accessed on 25 May 2022.
We would also like to refer to the work of Lacaze et al. [23] where the authors highlighted the value of the combination of QGIS and GRASS, which allows both complex spatial processing and the presentation of optimized results.
Cachar district is divided into five revenue circles—Katigora, Lakhipur, Silchar, Sonai and Udarbond. However, an extended road network map of Cachar district (which includes major and minor roads as well as lanes and bye lanes) is available in Figure 2.
3. Analysis
Network analysis in QGIS forms is foundation from the two branches of mathematics—graph theory and topology. With the advancement of urbanization, the role of urban road network in everyday life of the population becomes extremely important. Efficiency of road network and traffic congestion have a direct impact on a region’s economic development and travel industry [24].
Routing may be described as the act of choosing a course of travel, and it is conceivably the most fundamental logistical operation in network analysis.
Network analysis in GIS was initially limited to some simple routing functions. But recently there has been development in the areas of object oriented data structures, the generation of multi-modal networks, the introduction of dynamic networks, and the use of simulation methods to generate solutions to network problems. Zielstra et al. [25] proposed a model for using free and proprietary data to compare shortest-path lengths for effective pedestrian routing in street network. Georeferencing of topographical maps using ArcGIS was studied by Herbei et al. [26].
Numerous significant network design problems exist in literature with exceeding amount of combinatorial complexity due to which finding their optimal solution becomes equally difficult [27]. Determination of travel demand from an urban facility to a particular place and the determination of shortest path are absolutely essential for setting up a sustainable complex road network in urban facilities [28]. A number of effective algorithms exist in literature for determining optimal route between two points in a network [29]. The most celebrated algorithm for shortest path was developed by Edsgar Dijkstra (in the year 1959) [30] which forms the basis for the shortest path tool in QGIS.
The pseudocode for Dijkstra’s algorithm (Algorithm 1) is given below.
| Algorithm 1 Dijkstra’s algorithm |
|
To execute the analysis over the digitized road network of the district, we constructed a vector layer consisting of the junction points connected topologically to each other via roads which are considered as edges (Figure 3). Analysis of each of the five revenue circle was carried out using the intersection and clipping tools of QGIS. The start point and end point were selected in the layer as per requirement to solve the network for determination of the shortest route to achieve the objective of the study.
4. Results
We interpret the results of the study as follows:
Cachar district has been divided into five revenue circles—Katigora, Lakhipur, Silchar, Sonai and Udarbond. As mentioned earlier, two types of roads were considered for the circle-wise analysis: major roads (primary roads and trunks) and minor roads (secondary, tertiary and track roads). A combined map of major and minor roads in the district can be found in Figure 4. From the road network analysis of each of the circles we observe the following.
Analysis of the major road network (Figure 5).
Total length of major roads in Cachar district is 504.15 km (approx.). Most of the major roads pass through the Silchar circle covering a total length of 190 km (approx.) although in terms of area Silchar is second largest revenue circle in the district after Sonai. Total length of major roads in Sonai is 91.86 km (approx.) The major road density of Silchar is 0.1957 which is highest in the district whereas that of Sonai is 0.0797 which is the lowest. From the analysis it is quite understandable that the traffic density and congestion is expected to be much higher in Silchar than the other circles of the district.
Major road densities of the remaining circles are—Udarbond (0.1442), Katigora (0.1088) and Lakhipur (0.0806). As expected, these circles do not experience too much of traffic density as compared to Silchar.
The percentage of major roads in the district covered by each of the revenue circles are—Katigora (18.09%), Lakhipur (12.65%), Silchar (37.68%), Sonai (18.22%) and Udarbond (13.35%) (Figure 6). It can be observed that Silchar covers the highest percentage of total major roads in the district whereas Lakhipur covers the least.
Analysis of the minor road network (Figure 7).
Regarding the minor roads the results and observations are listed next.
Total length of minor roads in Cachar district is 1223.08 km (approx.). Again we observe that most of the minor roads pass through the Silchar circle covering a total length of 442.87 km (approx.). Total length of minor roads in Sonai is 253.58 km (approx.) The minor road density of Silchar is 0.4562 which is highest in the district whereas that of Sonai is 0.2202 which is again the lowest.
Minor road densities of the remaining circles are—Udarbond (0.2242), Katigora (0.2299) and Lakhipur (0.2899). Minor road densities in these three circles are almost identical and much lower as compared to Silchar circle.
The percentage of minor roads in the district covered by each of the revenue circles are—Katigora (15.75%), Lakhipur (18.74%), Silchar (36.21%), Sonai (20.73%) and Udarbond (8.55%) (Figure 8). It can be observed that Silchar covers the highest percentage of total minor roads in the district whereas Udarbond covers the least.
5. Discussion
The main theme of working with GIS is visualization of geographical data. In the current state of the art, two ideas are particularly relevant in the context of visualization of data in terms of maps using QGIS: (a) combining multiple layers (b) on-screen rendering and its interactivity.
In a map, we normally find several types of information, and that is not just for the sake of space but because it helps the map user to understand and interpret the main information. For instance, contour lines help to understand the shapes of rivers and lakes, providing a valuable context.
From the field survey, it has been observed that although both the major and minor road densities are higher in Silchar as compared to other circles, tremendous traffic congestion occurs frequently in Silchar city. Such congestion leads to increased vehicle operating cost, delay, air and sound pollution, warming up of urban area etc. Field survey also revealed that almost half of the vehicles use different and longer routes than the shortest ones as per QGIS. There are many reasons behind this such as different traffic movement policy for different vehicles, poor road conditions and quite often unawareness about the shortest route.
Determination of the shortest route using QGIS can therefore help people to reach their destination with ease and with reduced cost. Available data from such analysis may also be utilized for uniform distribution of the vehicles among the available roads to reduce traffic congestion.
Below we determine and display two shortest routes as per QGIS as examples. However, this calculation assumes that traffic congestion has not been considered.
There are several available roads to reach Silchar Medical College from Katigora town. QGIS determines that the shortest one is of length 41.75 km and is displayed in black in Figure 9.
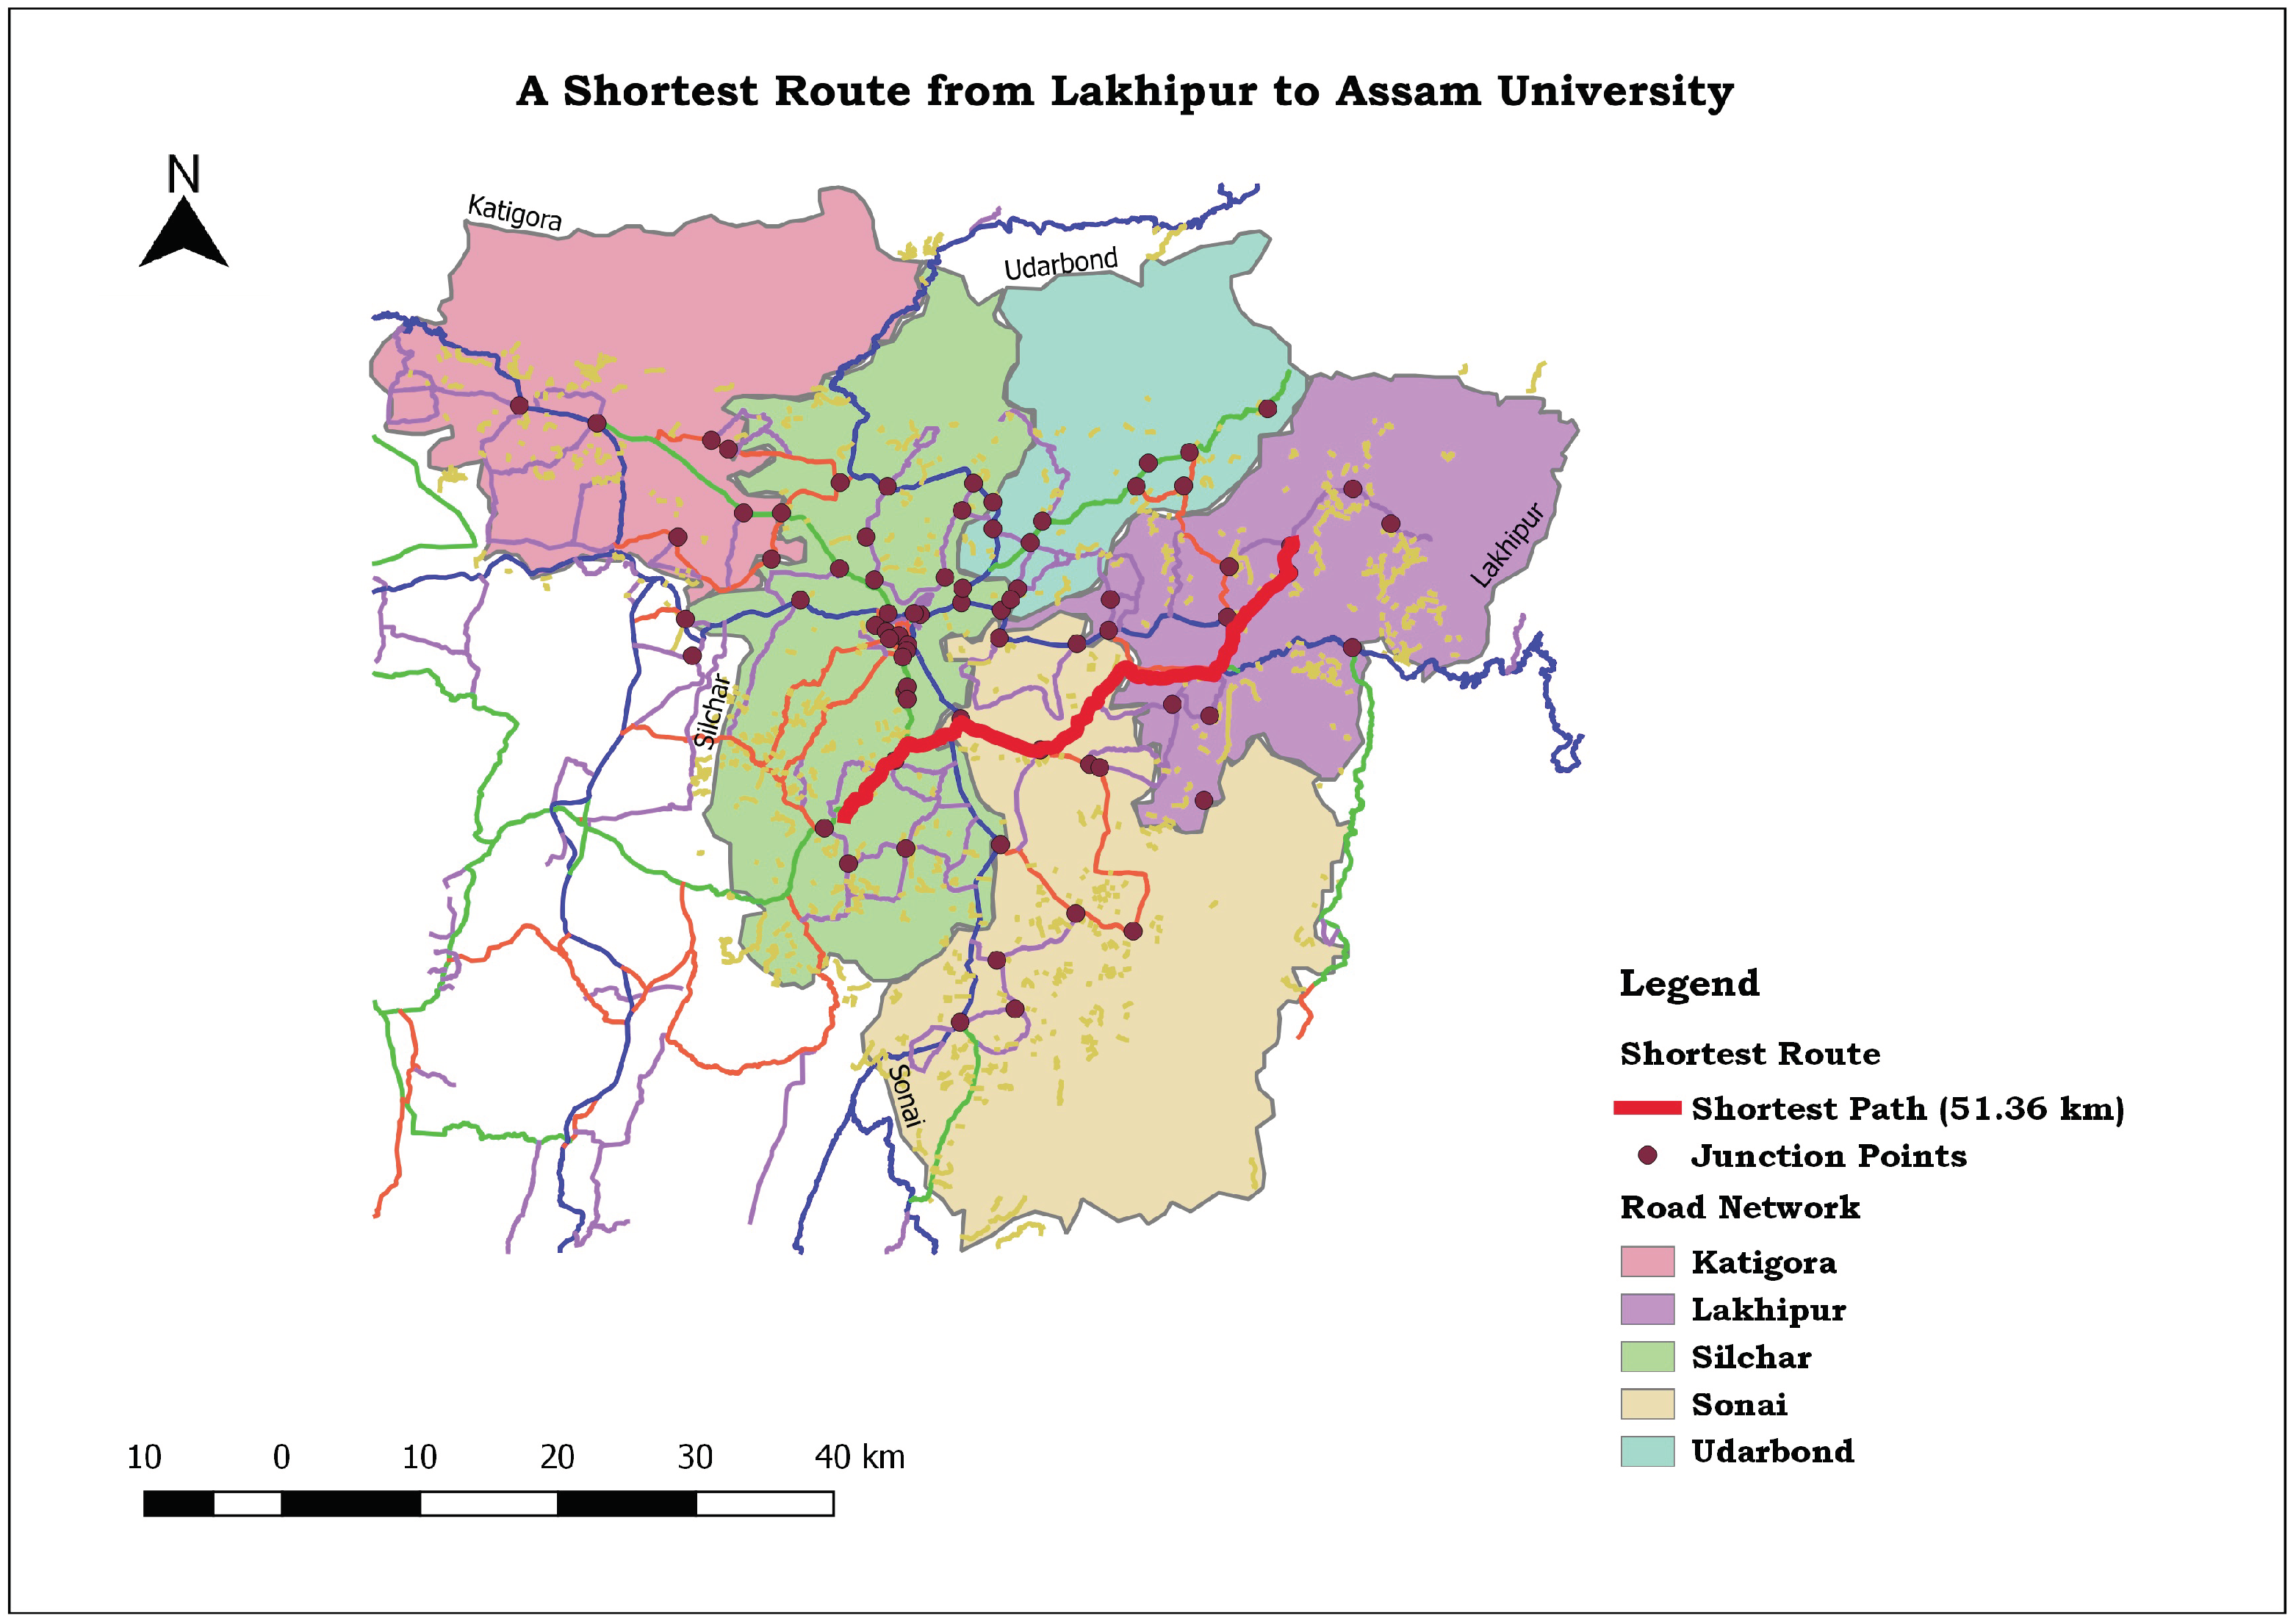
Similarly, there are several available roads to reach Assam University from Lakhipur town. QGIS determines that the shortest one is of length 51.36 km and is displayed in red in Figure 10.
6. Limitations of the Study
Locating the shortest path between two places is no longer a new activity these days for the masses using Google maps. However, there are places with very poor or no internet connectivity where QGIS shortest route maps can be the alternative to Google maps. The novelty of QGIS not only lies in shortest route detection but it also provides solutions to transportation planning problems. Based on the travel demand and availability of particular types of roads, QGIS can be used to locate zones where schools, colleges, health centers, fire stations, shopping malls are most reasonable to set up. Such type of well planned establishments will ensure proper access to those facilities by the population and result in economic growth of the region.
In the maps constructed by QGIS, different layers can be projected like what is lying beneath the earth surface which Google maps cannot provide. Thus QGIS maps can help better planning and construction of roads and buildings in a region.
However, our current study has certain limitations. The current study is mainly concerned with the analysis of OSM data available through intrinsic quality indicators. But we have assessed only the line type features. Inclusion of other types of features such as unclassified ones or relations will be helpful for the assessment and completeness of the dataset. Preparation of suitable spatial datasets for comparing rural and urban facilities can further improve the efficiency of the models. Another deficiency of the current study lies in the fact that the entire study has been conducted using open source tools. As such, there can be slight variation in the obtained dataset from their actual values. Barron et al. [31] reported that there are certain bugs in the OSM history importer. Further, the shortest routes have been located based on availability of roads and not considering other factors like traffic density and maximum permissible speed of vehicles. Incorporation of longitudinal studies are expected to improve the results towards generalization of heuristic measures.
7. Conclusions and Future Work
Network analysis using QGIS is a very powerful tool for solving real time transportation problems. It has replaced many conventional methods of analyzing and emerged as an essential instrument for transportation planning and destination studies. Adequate knowledge of the shortest route will enable the drivers and passengers to achieve low operating cost of vehicles and reach destination in optimal time. QGIS therefore have plenty of applications in transportation industry as effective communication network directly impacts the economic development of a region.
In the current study we have performed the road network analysis on the existing major and minor road network of Cachar district of Assam, India. The study reveals that both the major and minor road densities are highest in one particular circle Silchar and much lower in other circles. Shortest routes between different points in the network have also been determined. This analysis may be utilized for proper transportation planning in the district and for uniform distribution of the vehicles among the roads to avoid/reduce traffic congestion and provide immediate response in times of emergencies like flood or fire or road accidents.
Similar road network analysis can be performed in connection with fire and medical emergencies as future work. Also different parameters such as travel time, traffic density, road conditions may be incorporated in the analysis for obtaining more accurate and infallible results. Time impedance factor may also be included in the study to enhance efficiency and accuracy of the analysis.
Funding
This research received no external funding.
Institutional Review Board Statement
Not applicable.
Informed Consent Statement
Not applicable.
Data Availability Statement
The data used to support the findings of this study are available from the author upon request.
Acknowledgments
The author acknowledges his exposure to QGIS during his participation in “NGP-DST Summer School on Geospatial Technologies (Level 1)” conducted from 25 May to 14 June 2022 by NIT Agartala, India. The author greatly appreciates the efforts of all the three learned referees and their constructive comments which have improved the manuscript. The maps in this manuscript have been constructed by the free and open-source software QGIS 2.18.
Conflicts of Interest
The author declares that he has no known competing financial interests or personal relationships with anyone that could have appeared to influence the work reported in this paper.
References
- Longley, P.A.; Goodchild, M.F.; Maguire, D.J.; Rhind, D.W. (Eds.) Geographical Information Systems: Principles, Techniques, Management and Applications; Abridged, Wiley: Chichester, UK, 2005. [Google Scholar]
- Congalton, R.G. A review of assessing the accuracy of classification of remotely sensed data. Remote Sens. Environ. 1991, 37, 35–46. [Google Scholar] [CrossRef]
- Kurtin, K.M. Network analysis in geographic information science: Review, assessment and projections. Cartogr. Geogr. Inf. Sci. 2007, 34, 103–111. [Google Scholar] [CrossRef]
- Poser, K.; Dransch, D. Volunteered geographic information for disaster management with application to rapid flood damage estimation. Geomatica 2010, 64, 89–98. [Google Scholar]
- Mukherjee, S. Statistical analysis of the road network of India. Pramana—J. Phys. 2012, 79, 483–491. [Google Scholar] [CrossRef]
- Hecht, R.; Kunze, C.; Hahmann, S. Measuring completeness of building footprints in openstreetmap over space and time. ISPRS Int. J. Geo-Inf. 2013, 2, 1066. [Google Scholar] [CrossRef]
- Graser, A.; Olaya, V. Processing: A Python framework for the seamless integration of geoprocessing tools in QGIS. ISPRS Int. J. Geo-Inf. 2015, 4, 2219–2245. [Google Scholar] [CrossRef]
- Balla, D.; Zichar, M.; Kiss, E.; Szabo, G.; Mester, T. Possibilities for assessment and geovisualization of spatial and temporal water quality data uswing a WebGIS application. ISPRS Int. J. Geo-Inf. 2022, 11, 108. [Google Scholar] [CrossRef]
- Muhammad, Y.R.; Rabiah, A.K.; Mohamad, T.I.; Azlina, A. A review on flood modelling tools for transformation of spatial and non-spatial data to 3D visualization. Int. J. Adv. Sci. Technol. 2019, 28, 197–206. [Google Scholar]
- Fuhrmann, S.; Pike, W. User-centered design of collaborative geovisualization tools. In Exploring Geovisualization; Elsevier: Amsterdam, The Netherlands, 2015; pp. 591–609. [Google Scholar]
- Hildebrandt, D. A software reference architecture for service-oriented 3D visualization systems. ISPRS Int. J. Geo-Inf. 2014, 3, 1445–1490. [Google Scholar] [CrossRef]
- Chiesa, S.; Pietro, A.D.; Pollino, M.; Taraglio, S. Urban air pollutant monitoring through a low-cost mobile device connected to a smart road. ISPRS Int. J. Geo-Inf. 2022, 11, 132. [Google Scholar] [CrossRef]
- MacEachren, A.M.; Gahegan, M.; Pike, W.; Brewer, I.; Cai, G.; Hardisty, F. Geovisualization for knowledge construction and decision support. IEEE Comput. Graph. Appl. 2004, 24, 13–17. [Google Scholar] [CrossRef]
- Dykes, J.; MacEachren, A.M.; Kraak, M.J. (Eds.) Exploring Geovisualization; Elsevier: Amsterdam, The Netherlands, 2005. [Google Scholar]
- Evangelidis, K.; Ntouros, K.; Makridis, S.; Papatheodorou, C. Geospatial services in the cloud. Comput. Geosci. 2014, 63, 116–122. [Google Scholar] [CrossRef] [Green Version]
- Farkas, G. Applicability of of open-source web mapping libraries for building massive Web GIS Clients. J. Geogr. Syst. 2017, 19, 273–295. [Google Scholar] [CrossRef]
- Haklay, M.; Singleton, A.; Parker, C. Web Mapping 2.0: The Neogeography of the GeoWeb. Geogr. Compass 2008, 2, 2011–2039. [Google Scholar] [CrossRef]
- Jiang, B.; Li, Z. Geovisualization: Design, enhanced visual tools and applications. Cartogr. J. 2005, 42, 3–4. [Google Scholar] [CrossRef]
- Molnar, A.; Lovas, I.; Domozi, Z. Practical application possibilities for 3D models using low-resolution thermal images. Acta Polytech. Hung. 2021, 18, 199–212. [Google Scholar] [CrossRef]
- Zichar, M. Geovisualization based upon KML. J. Argic. Inform. 2019, 3, 19–26. [Google Scholar] [CrossRef]
- MacEachren, A.M.; Kraak, M.-J. Research challenges in geovisualization. Cartogr. Geogr. Inf. Sci. 2001, 28, 3–12. [Google Scholar] [CrossRef]
- Debashis, D.; Ojha, A.K.; Kramsapi, H.; Baruah, P.P.; Dutta, M.K. Road network analysis of Guwahati city using GIS. SN Appl. Sci. 2019, 1, 906. [Google Scholar]
- Lacaze, B.; Dudek, J.; Picard, J. GRASS GIS software with QGIS. In QGIS and Generic Tools; Baghdadi, N., Mallet, C., Zribi, M., Eds.; Wiley: Hoboken, NJ, USA, 2018; Chapter 3; Volume 1. [Google Scholar]
- Mahabir, R.; Stefanidis, A.; Croitoru, A.; Crooks, A.; Agouris, P. Authoritative and volunteered geographical information in a developing country: A comparative case study of road datasets in Nairobi, Kenya. ISPRS Int. J. Geo-Inf. 2017, 6, 24. [Google Scholar] [CrossRef]
- Zielstra, D.; Hochmair, H. Using free and proprietary data to compare shortest-path lengths for effective pedestrian routing in street network. Transp. Res. Rec. J. Transp. Res. Board 2012, 2299, 41–47. [Google Scholar] [CrossRef]
- Herbei, M.H.; Ciolac, V.; Smuleac, A.; Nistor, E.; Ciolac, L. Georeferencing of topographical maps using the software ArcGIS. Res. J. Agric. Sci. 2010, 42, 595–606. [Google Scholar]
- Magnati, T.L.; Wong, R.T. Network design and transportation planning: Models and algorithms. Transp. Sci. 1984, 18, 1–55. [Google Scholar] [CrossRef]
- Wu, L.; Xiao, X.; Deng, D.; Cong, G.; Zhu, A.D.; Zhou, S. Shortest path and distance queries on road networks: An experimental evaluation. VLDB 2012, 5, 406–417. [Google Scholar] [CrossRef]
- Khaing, O.; Wai, H.; Myat, E. Using Dijkstra’s algorithm for public transportation system in Yangon based on GIS. Int. J. Sci. Eng. Appl. 2018, 7, 442–447. [Google Scholar] [CrossRef]
- Cormen, T.H.; Leiserson, C.E.; Rivest, R.L.; Stein, C. Introduction to Algorithms; MIT Press: Cambridge, MA, USA, 2001. [Google Scholar]
- Barron, C.; Neis, P.; Zipf, A. A comprehensive framework for intrinsic openstreetmap quality analysis. Trans. GIS 2014, 18, 877–895. [Google Scholar] [CrossRef]
Figure 1.
Administrative map of Cachar district.
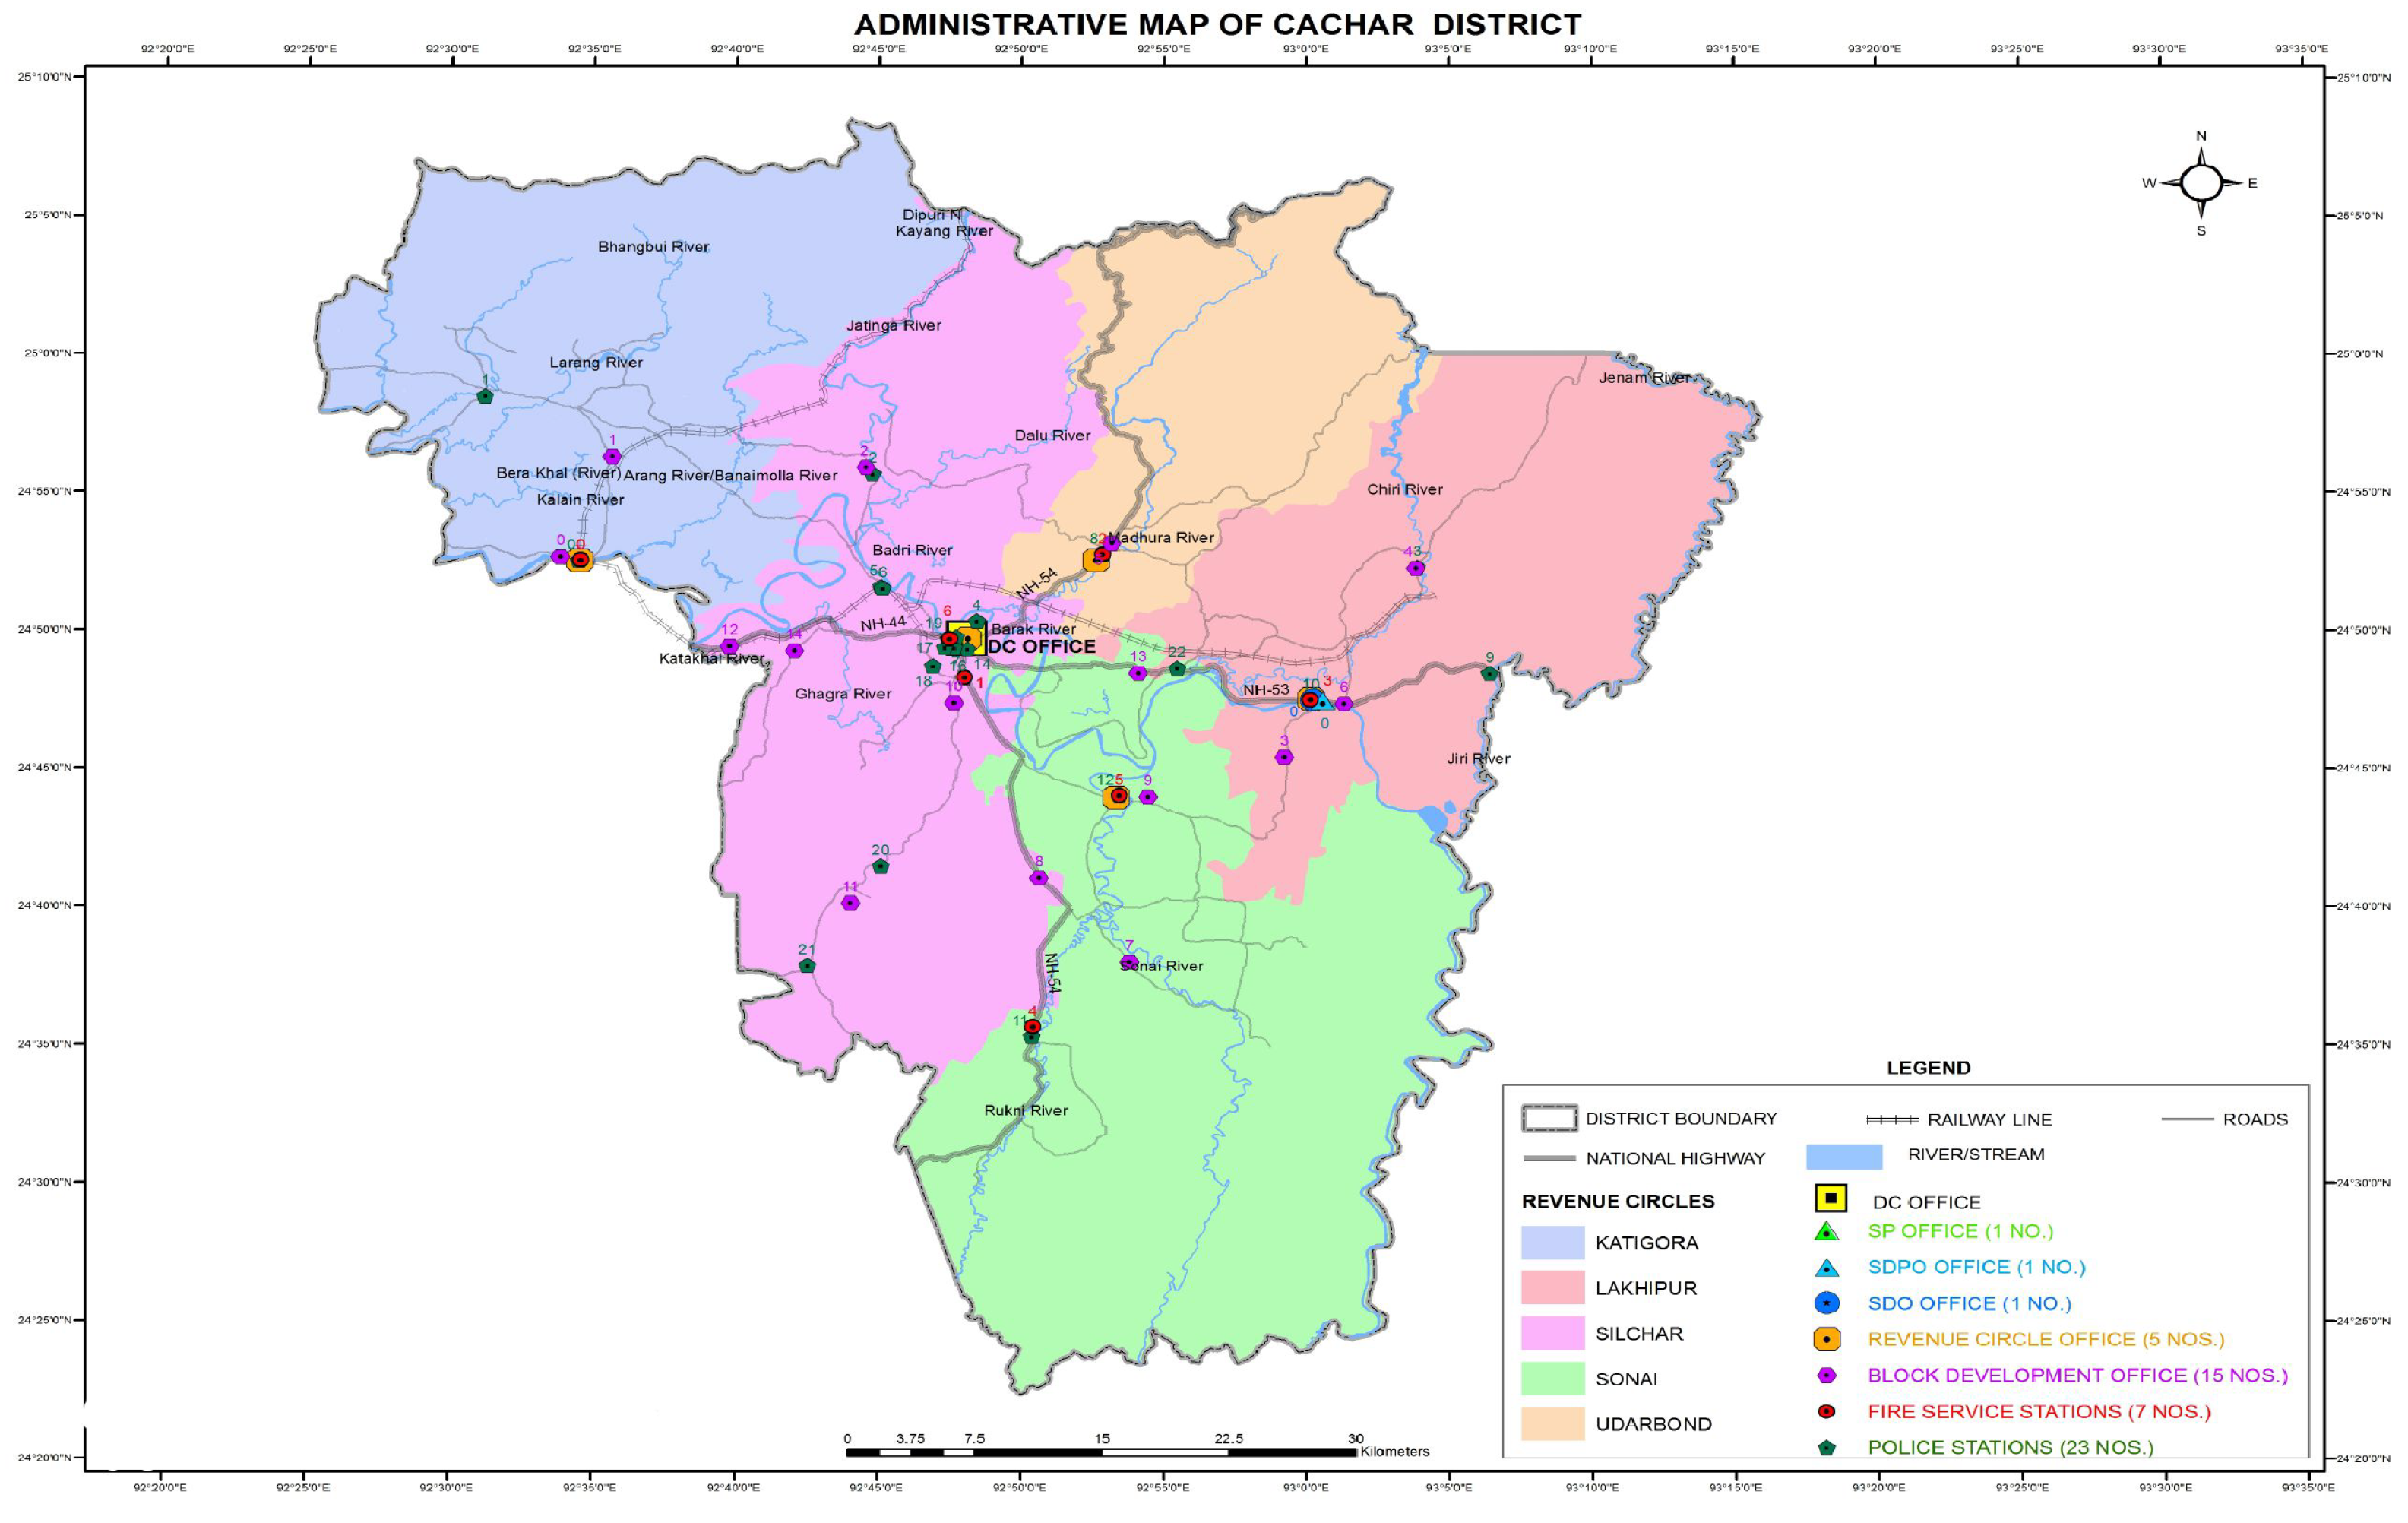
Figure 2.
Extended road network map of Cachar district.

Figure 3.
Junctions in the road network.
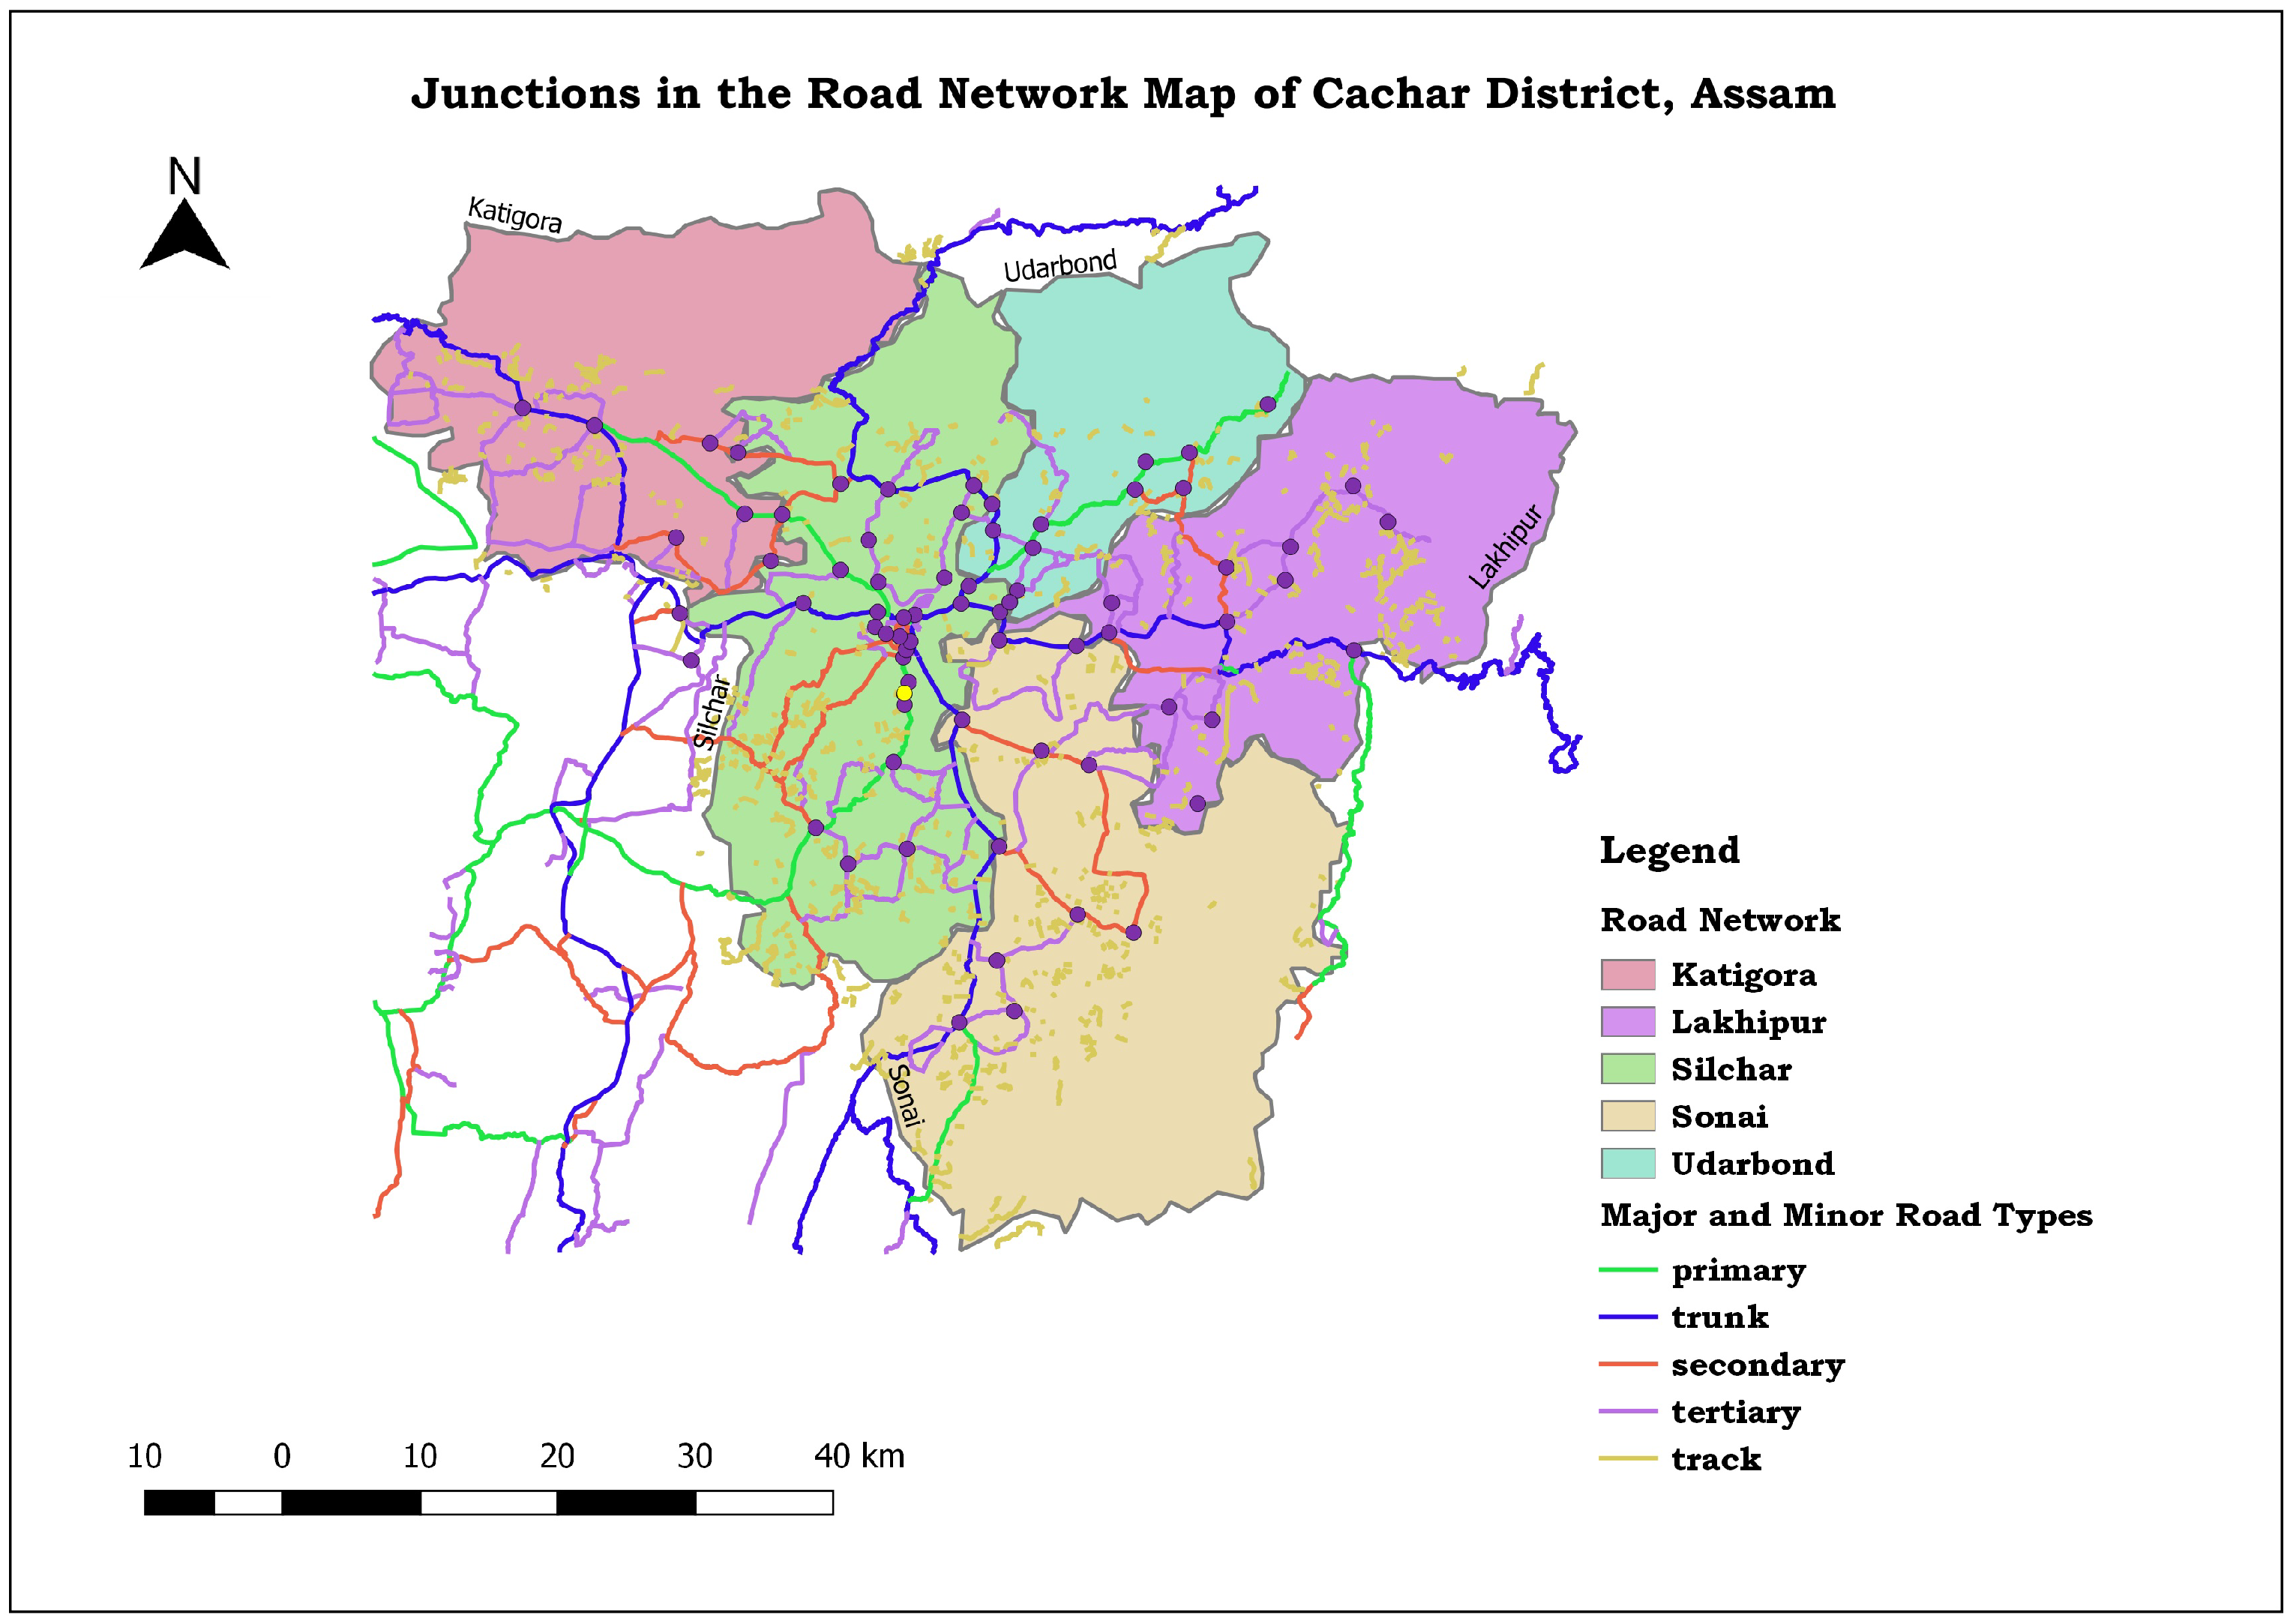
Figure 4.
Major and minor roads in Cachar district.

Figure 5.
Major road density map.
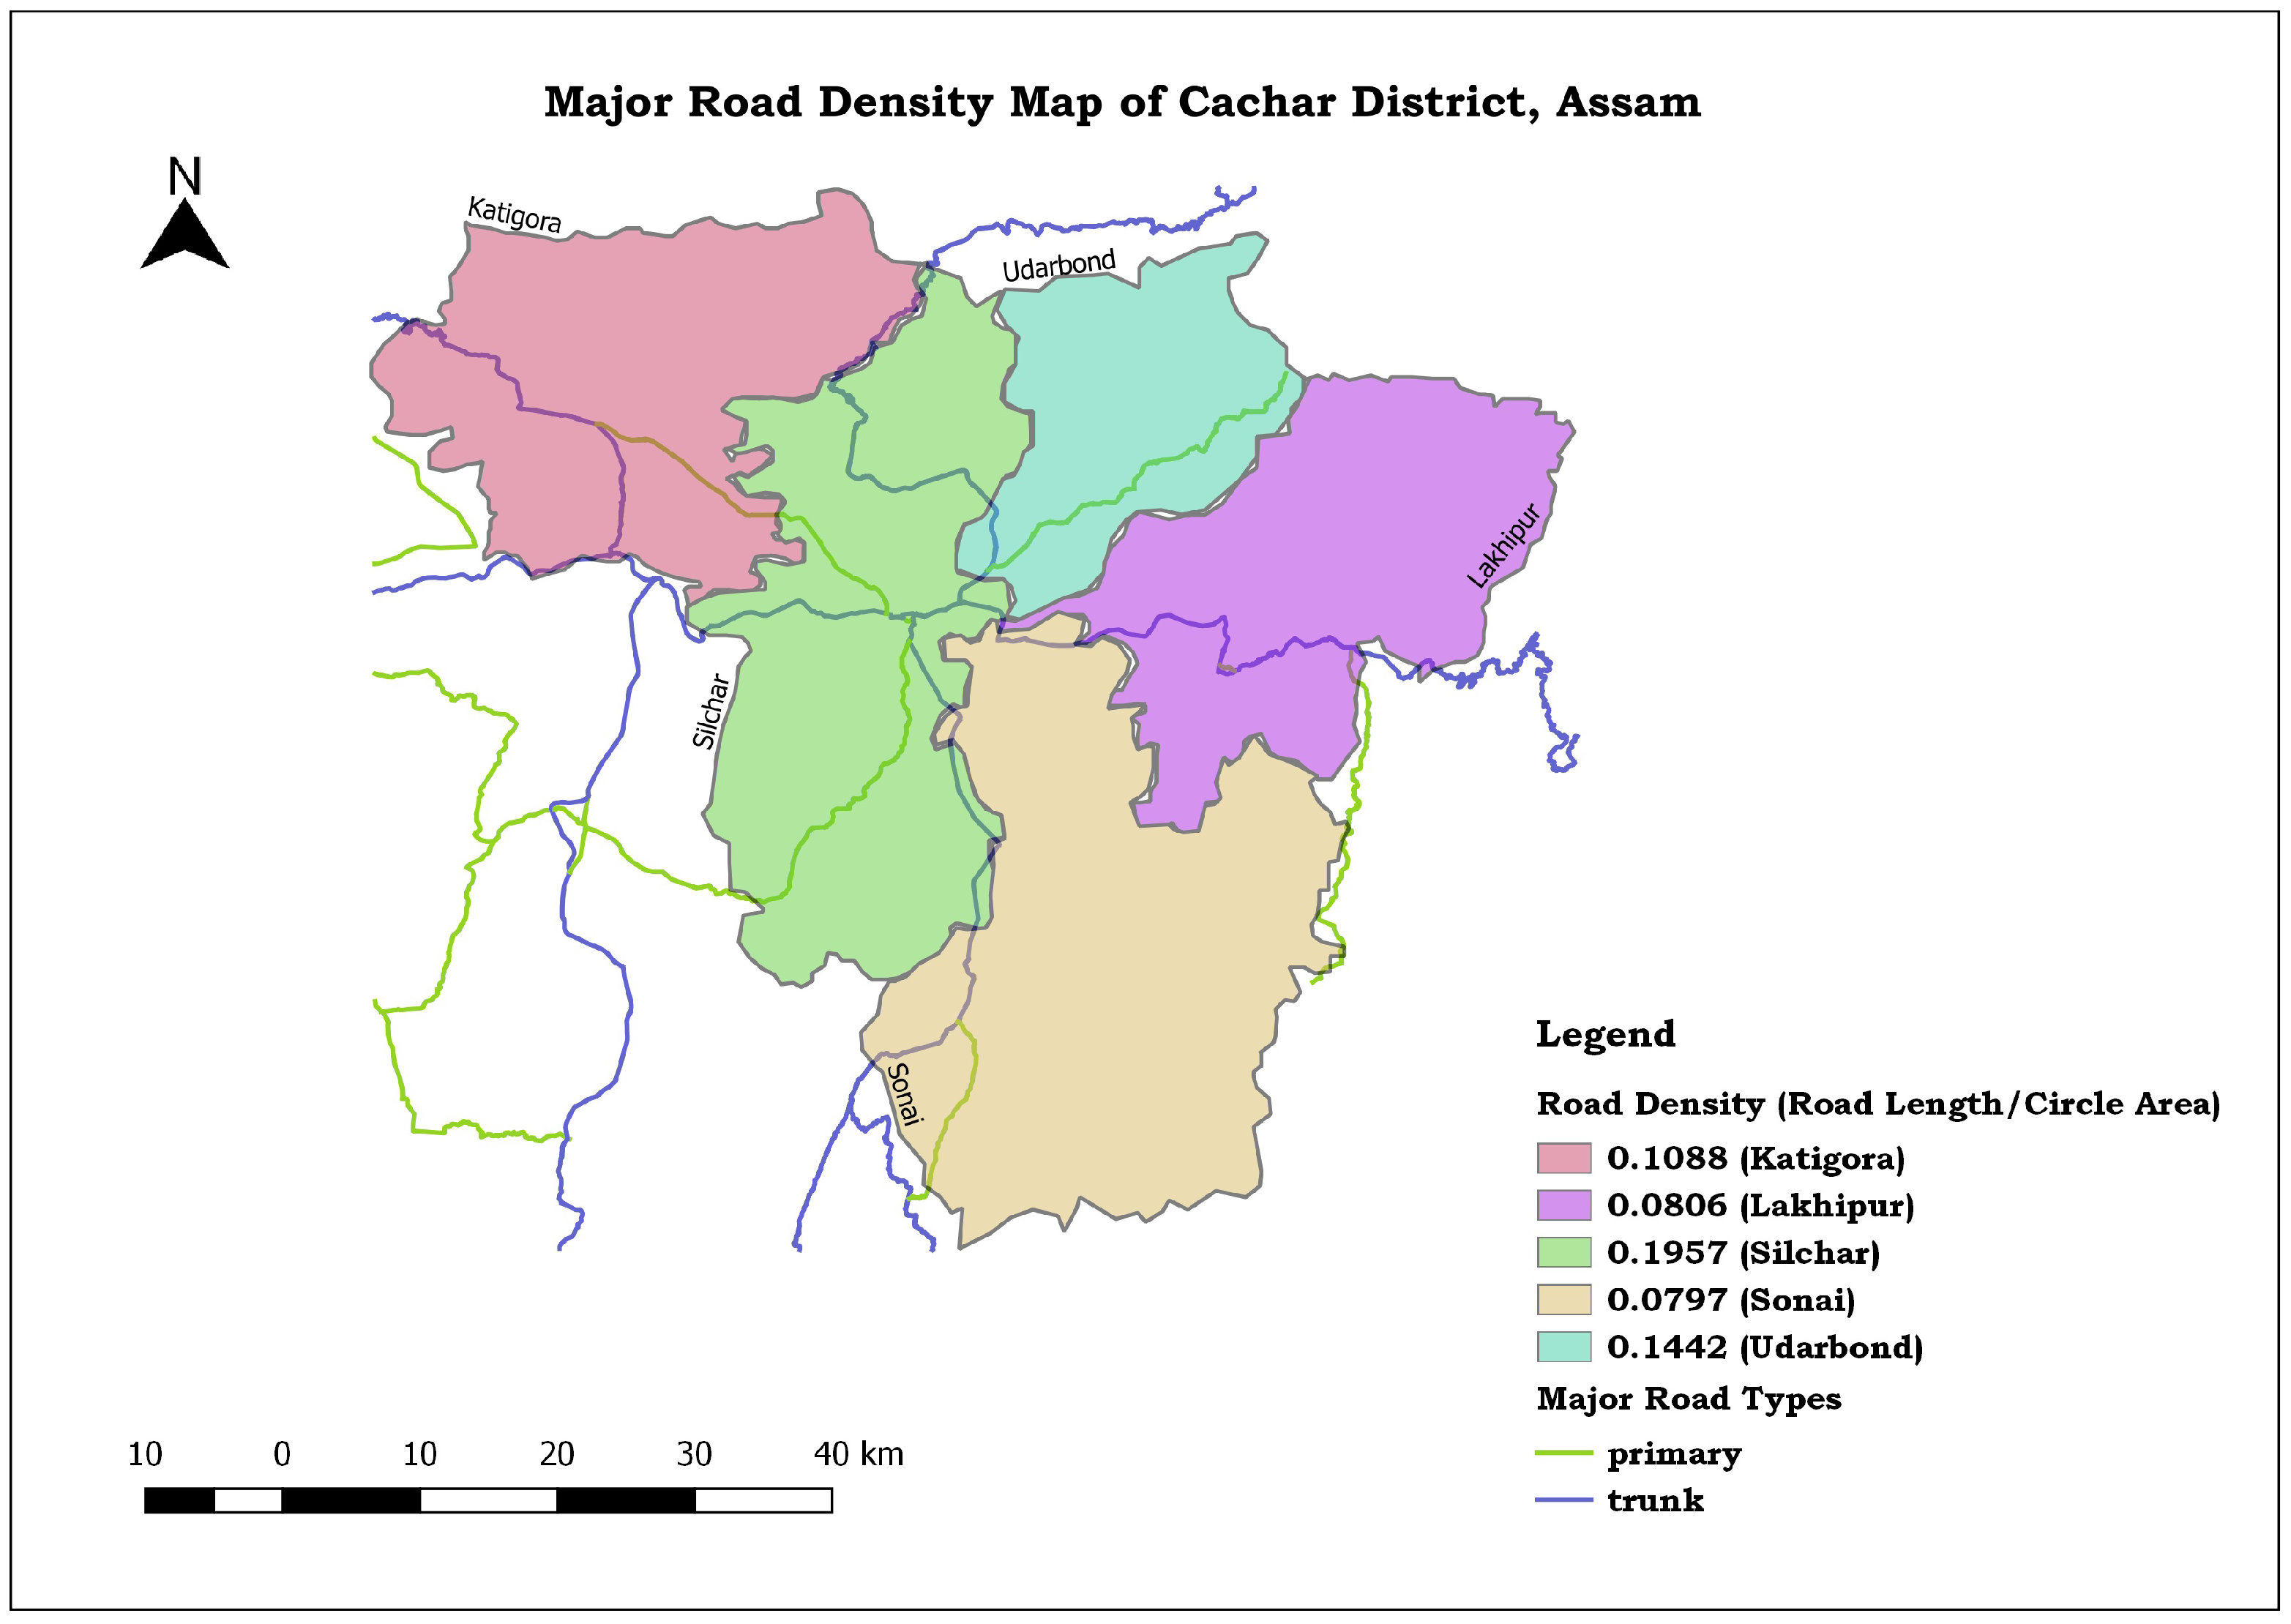
Figure 6.
Percentage of major roads in Cachar district.
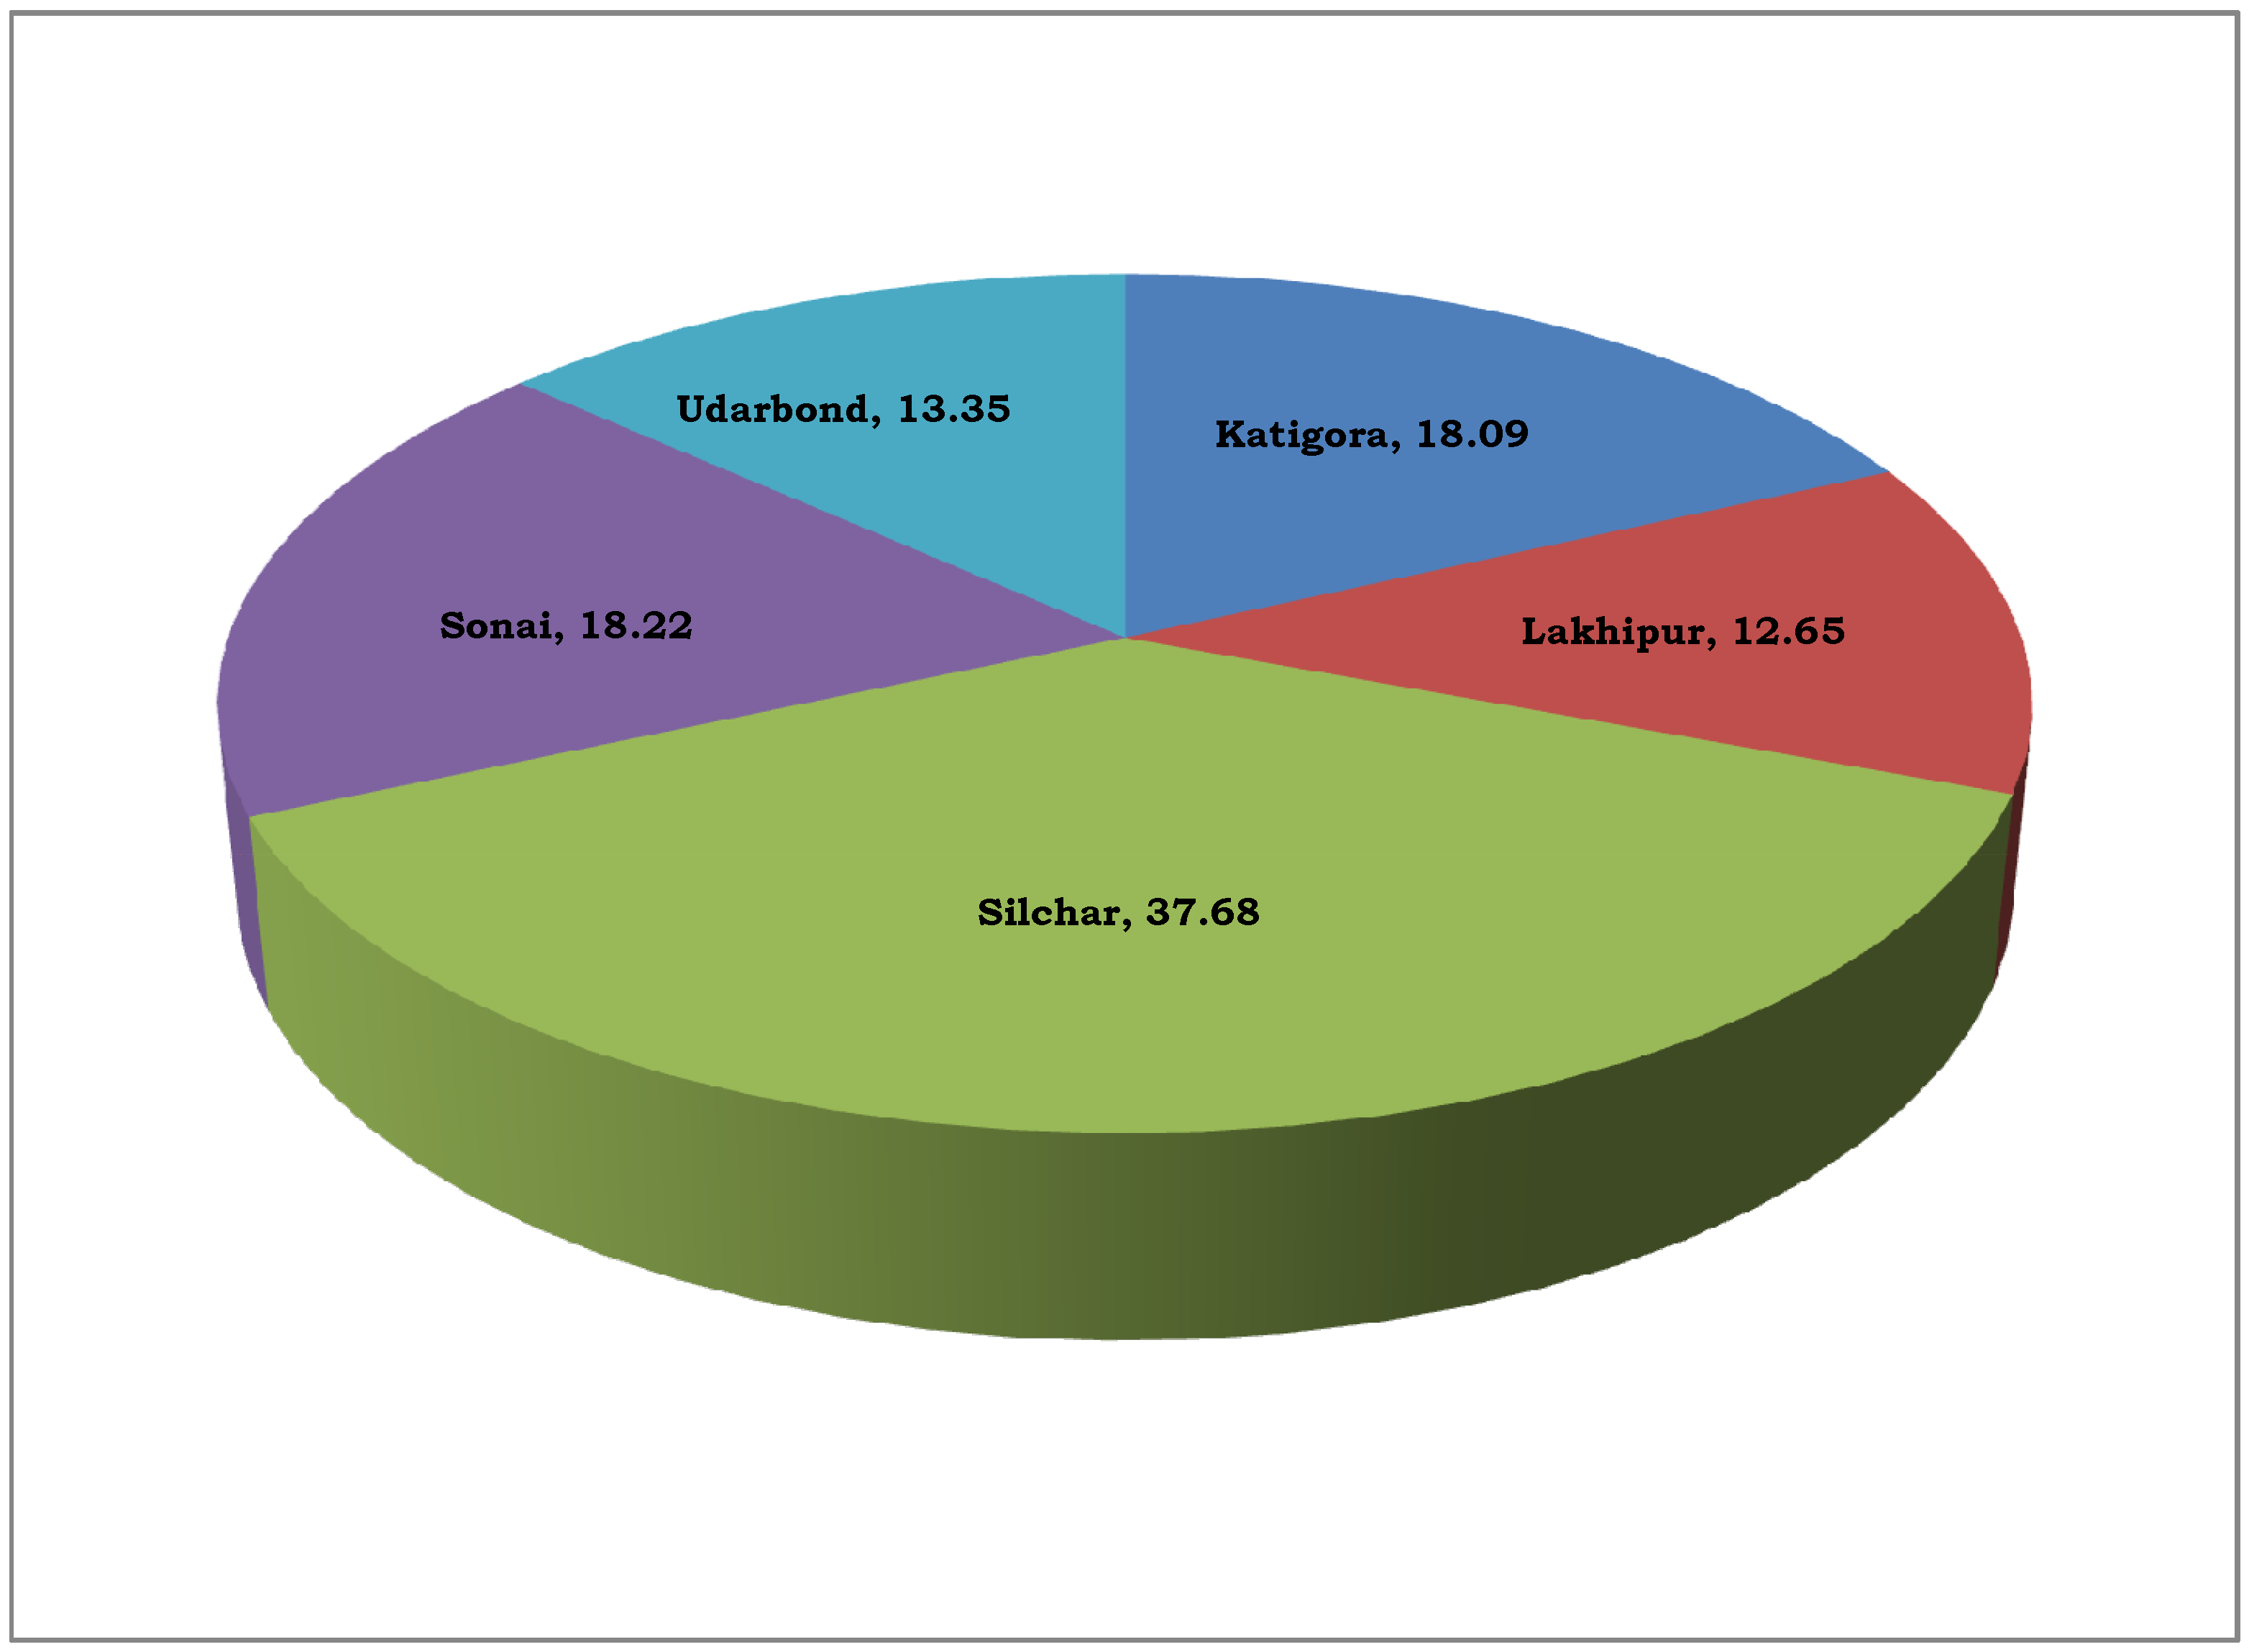
Figure 7.
Minor road density map.
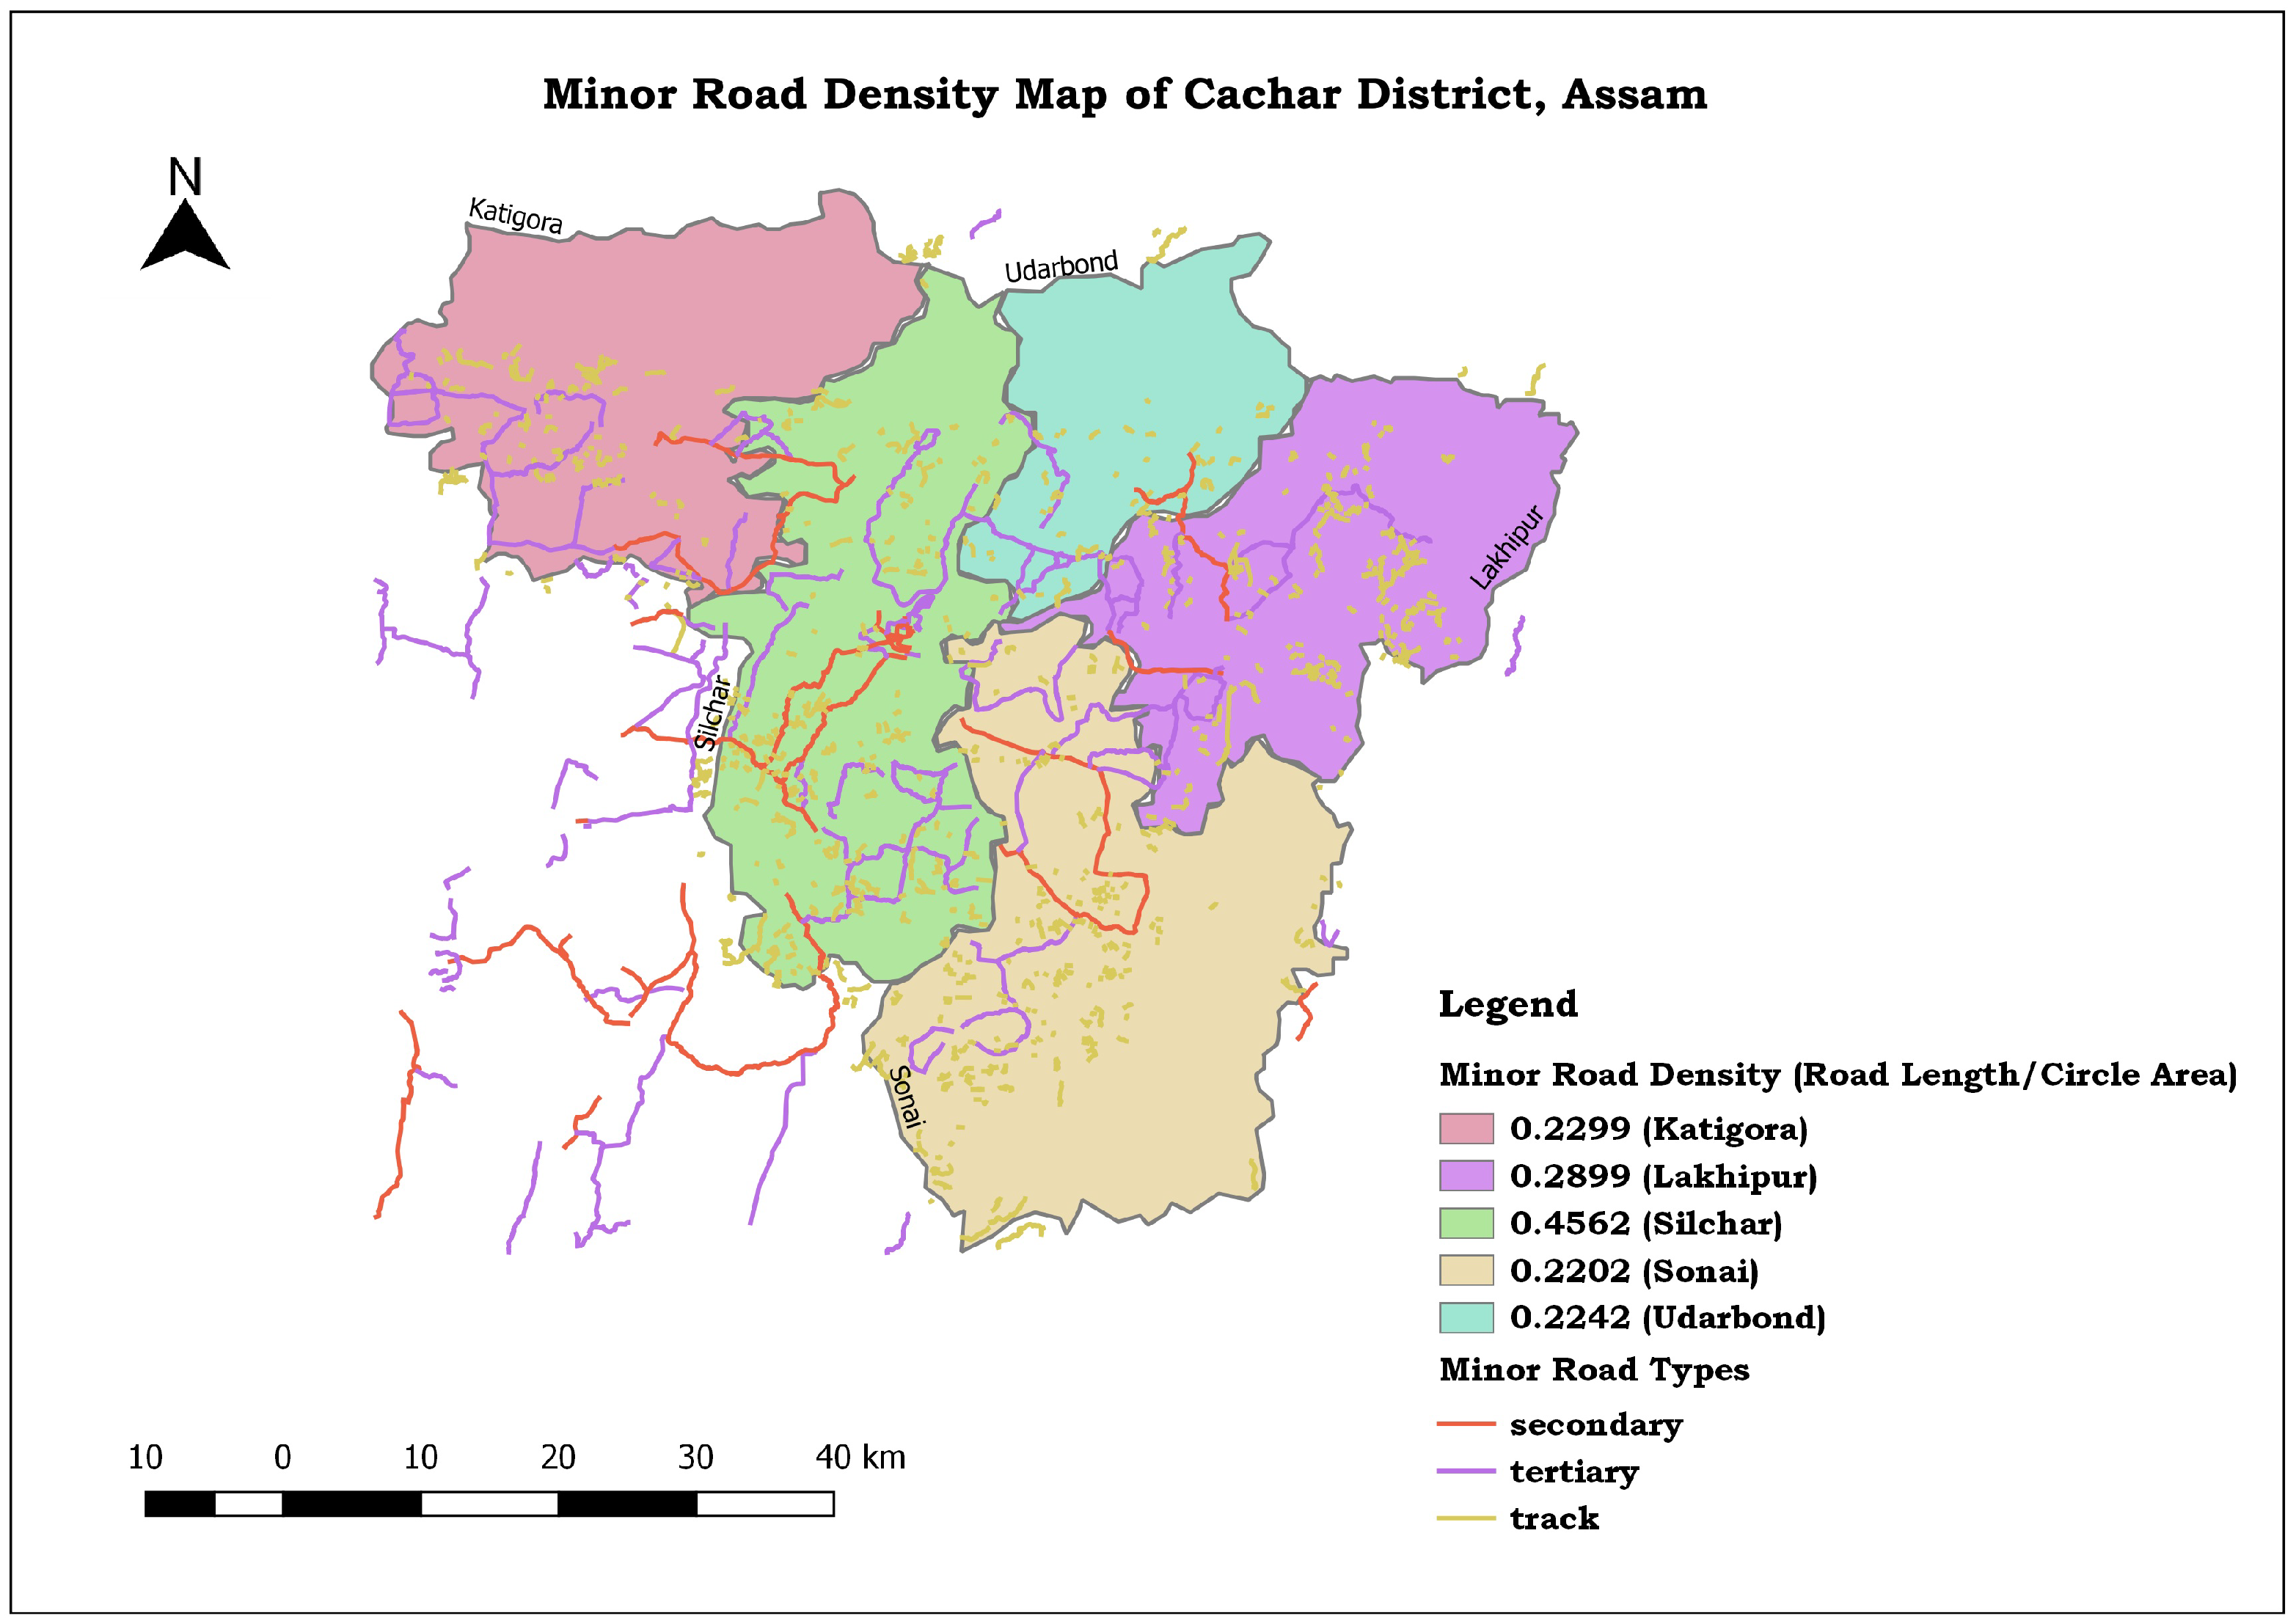
Figure 8.
Percentage of minor roads in Cachar district.

Figure 9.
A shortest route from Katigora to Silchar Medical College.

Figure 10.
A shortest route from Lakhipur to Assam University.
Publisher’s Note: MDPI stays neutral with regard to jurisdictional claims in published maps and institutional affiliations. |
© 2022 by the author. Licensee MDPI, Basel, Switzerland. This article is an open access article distributed under the terms and conditions of the Creative Commons Attribution (CC BY) license (https://creativecommons.org/licenses/by/4.0/).
Share and Cite
MDPI and ACS Style
Debnath, P. A QGIS-Based Road Network Analysis for Sustainable Road Network Infrastructure: An Application to the Cachar District in Assam, India. Infrastructures 2022, 7, 114. https://doi.org/10.3390/infrastructures7090114
AMA Style
Debnath P. A QGIS-Based Road Network Analysis for Sustainable Road Network Infrastructure: An Application to the Cachar District in Assam, India. Infrastructures. 2022; 7(9):114. https://doi.org/10.3390/infrastructures7090114
Chicago/Turabian StyleDebnath, Pradip. 2022. "A QGIS-Based Road Network Analysis for Sustainable Road Network Infrastructure: An Application to the Cachar District in Assam, India" Infrastructures 7, no. 9: 114. https://doi.org/10.3390/infrastructures7090114