
A Geotechnical Perspective on a Complex Geological Environment in a High-Speed Railway Tunnel Excavation (A Case Study from Türkiye)
 , ,
, ,
Abstract
:1. Introduction
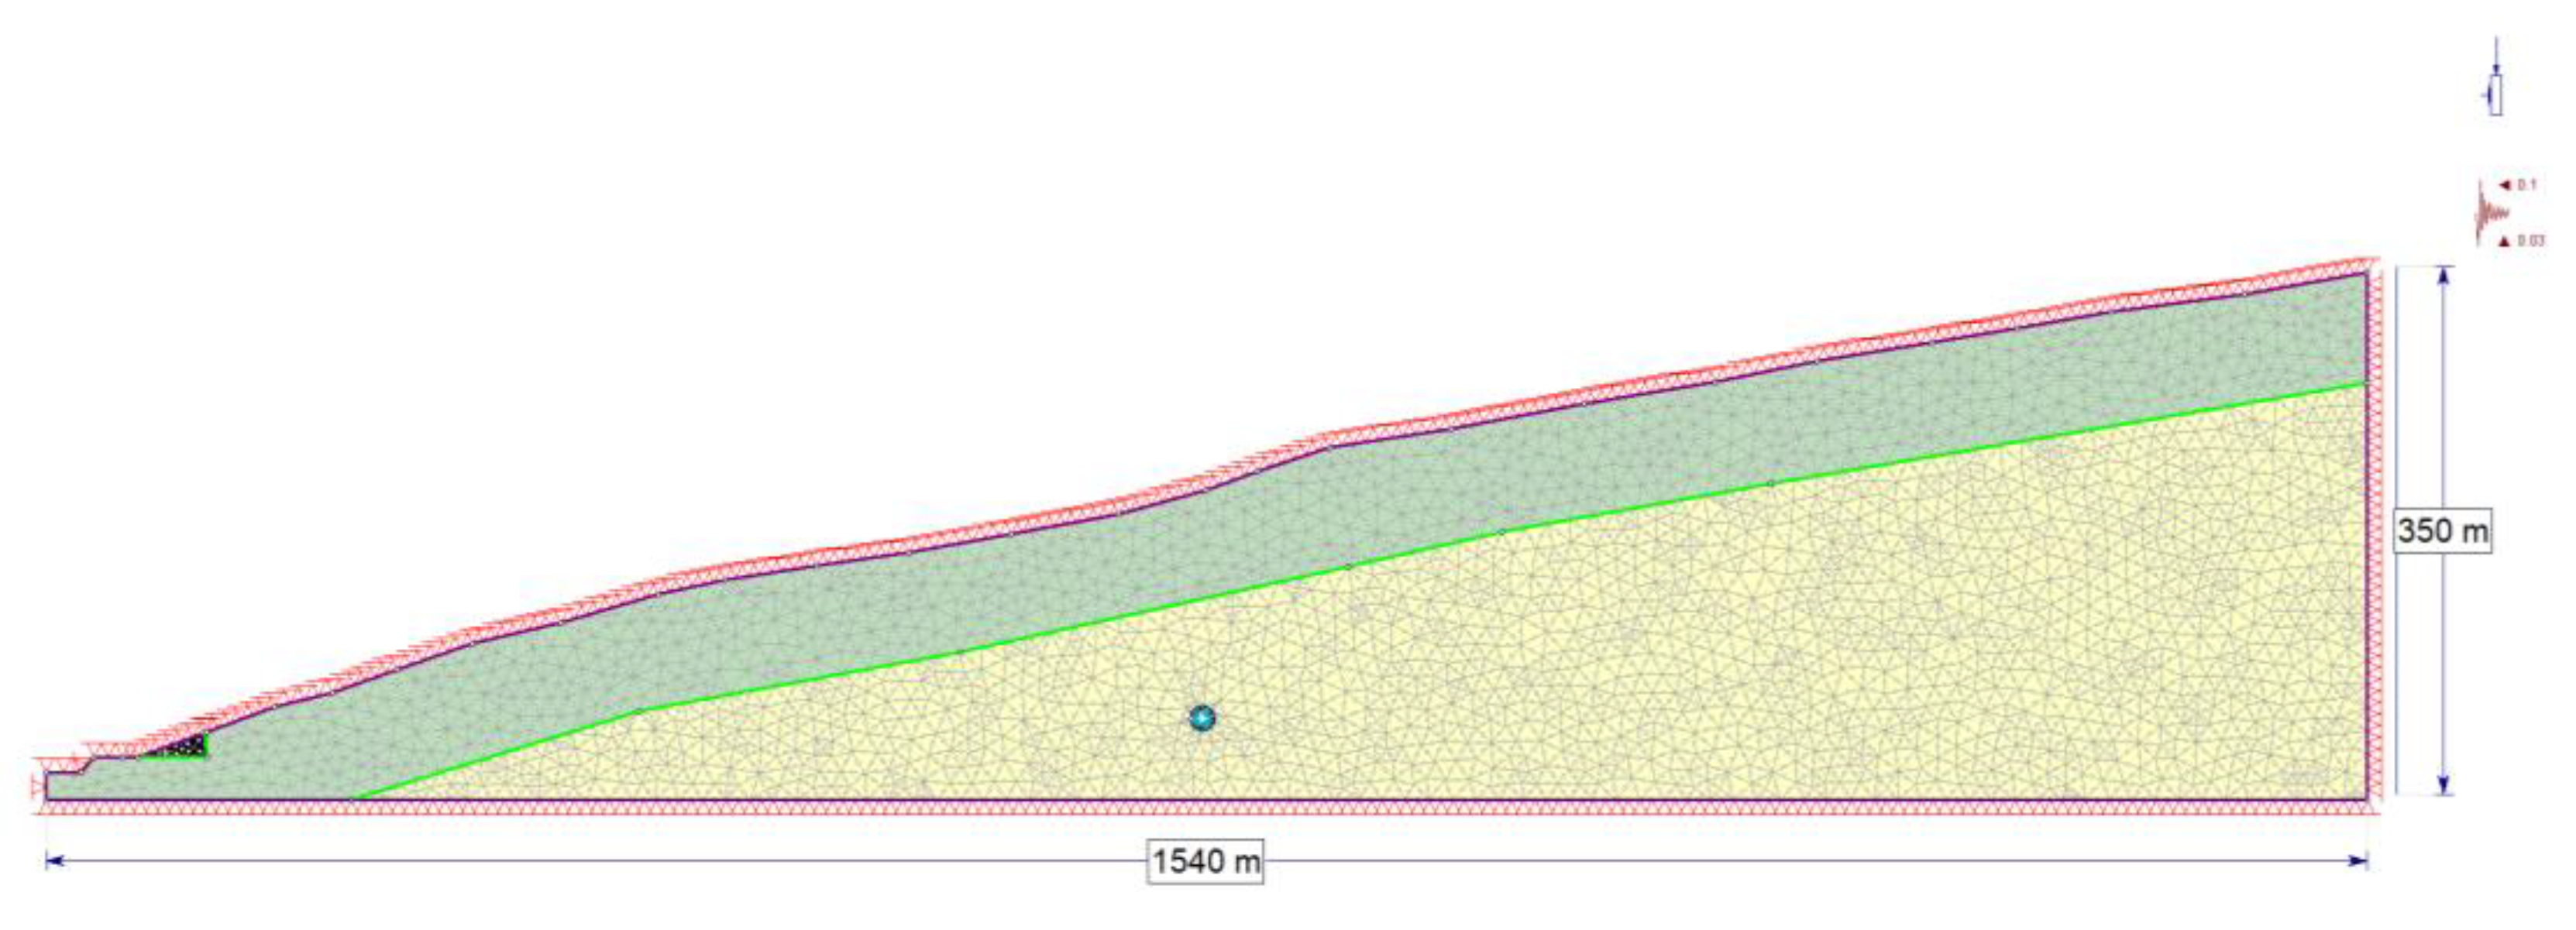
2. T26 Tunnel
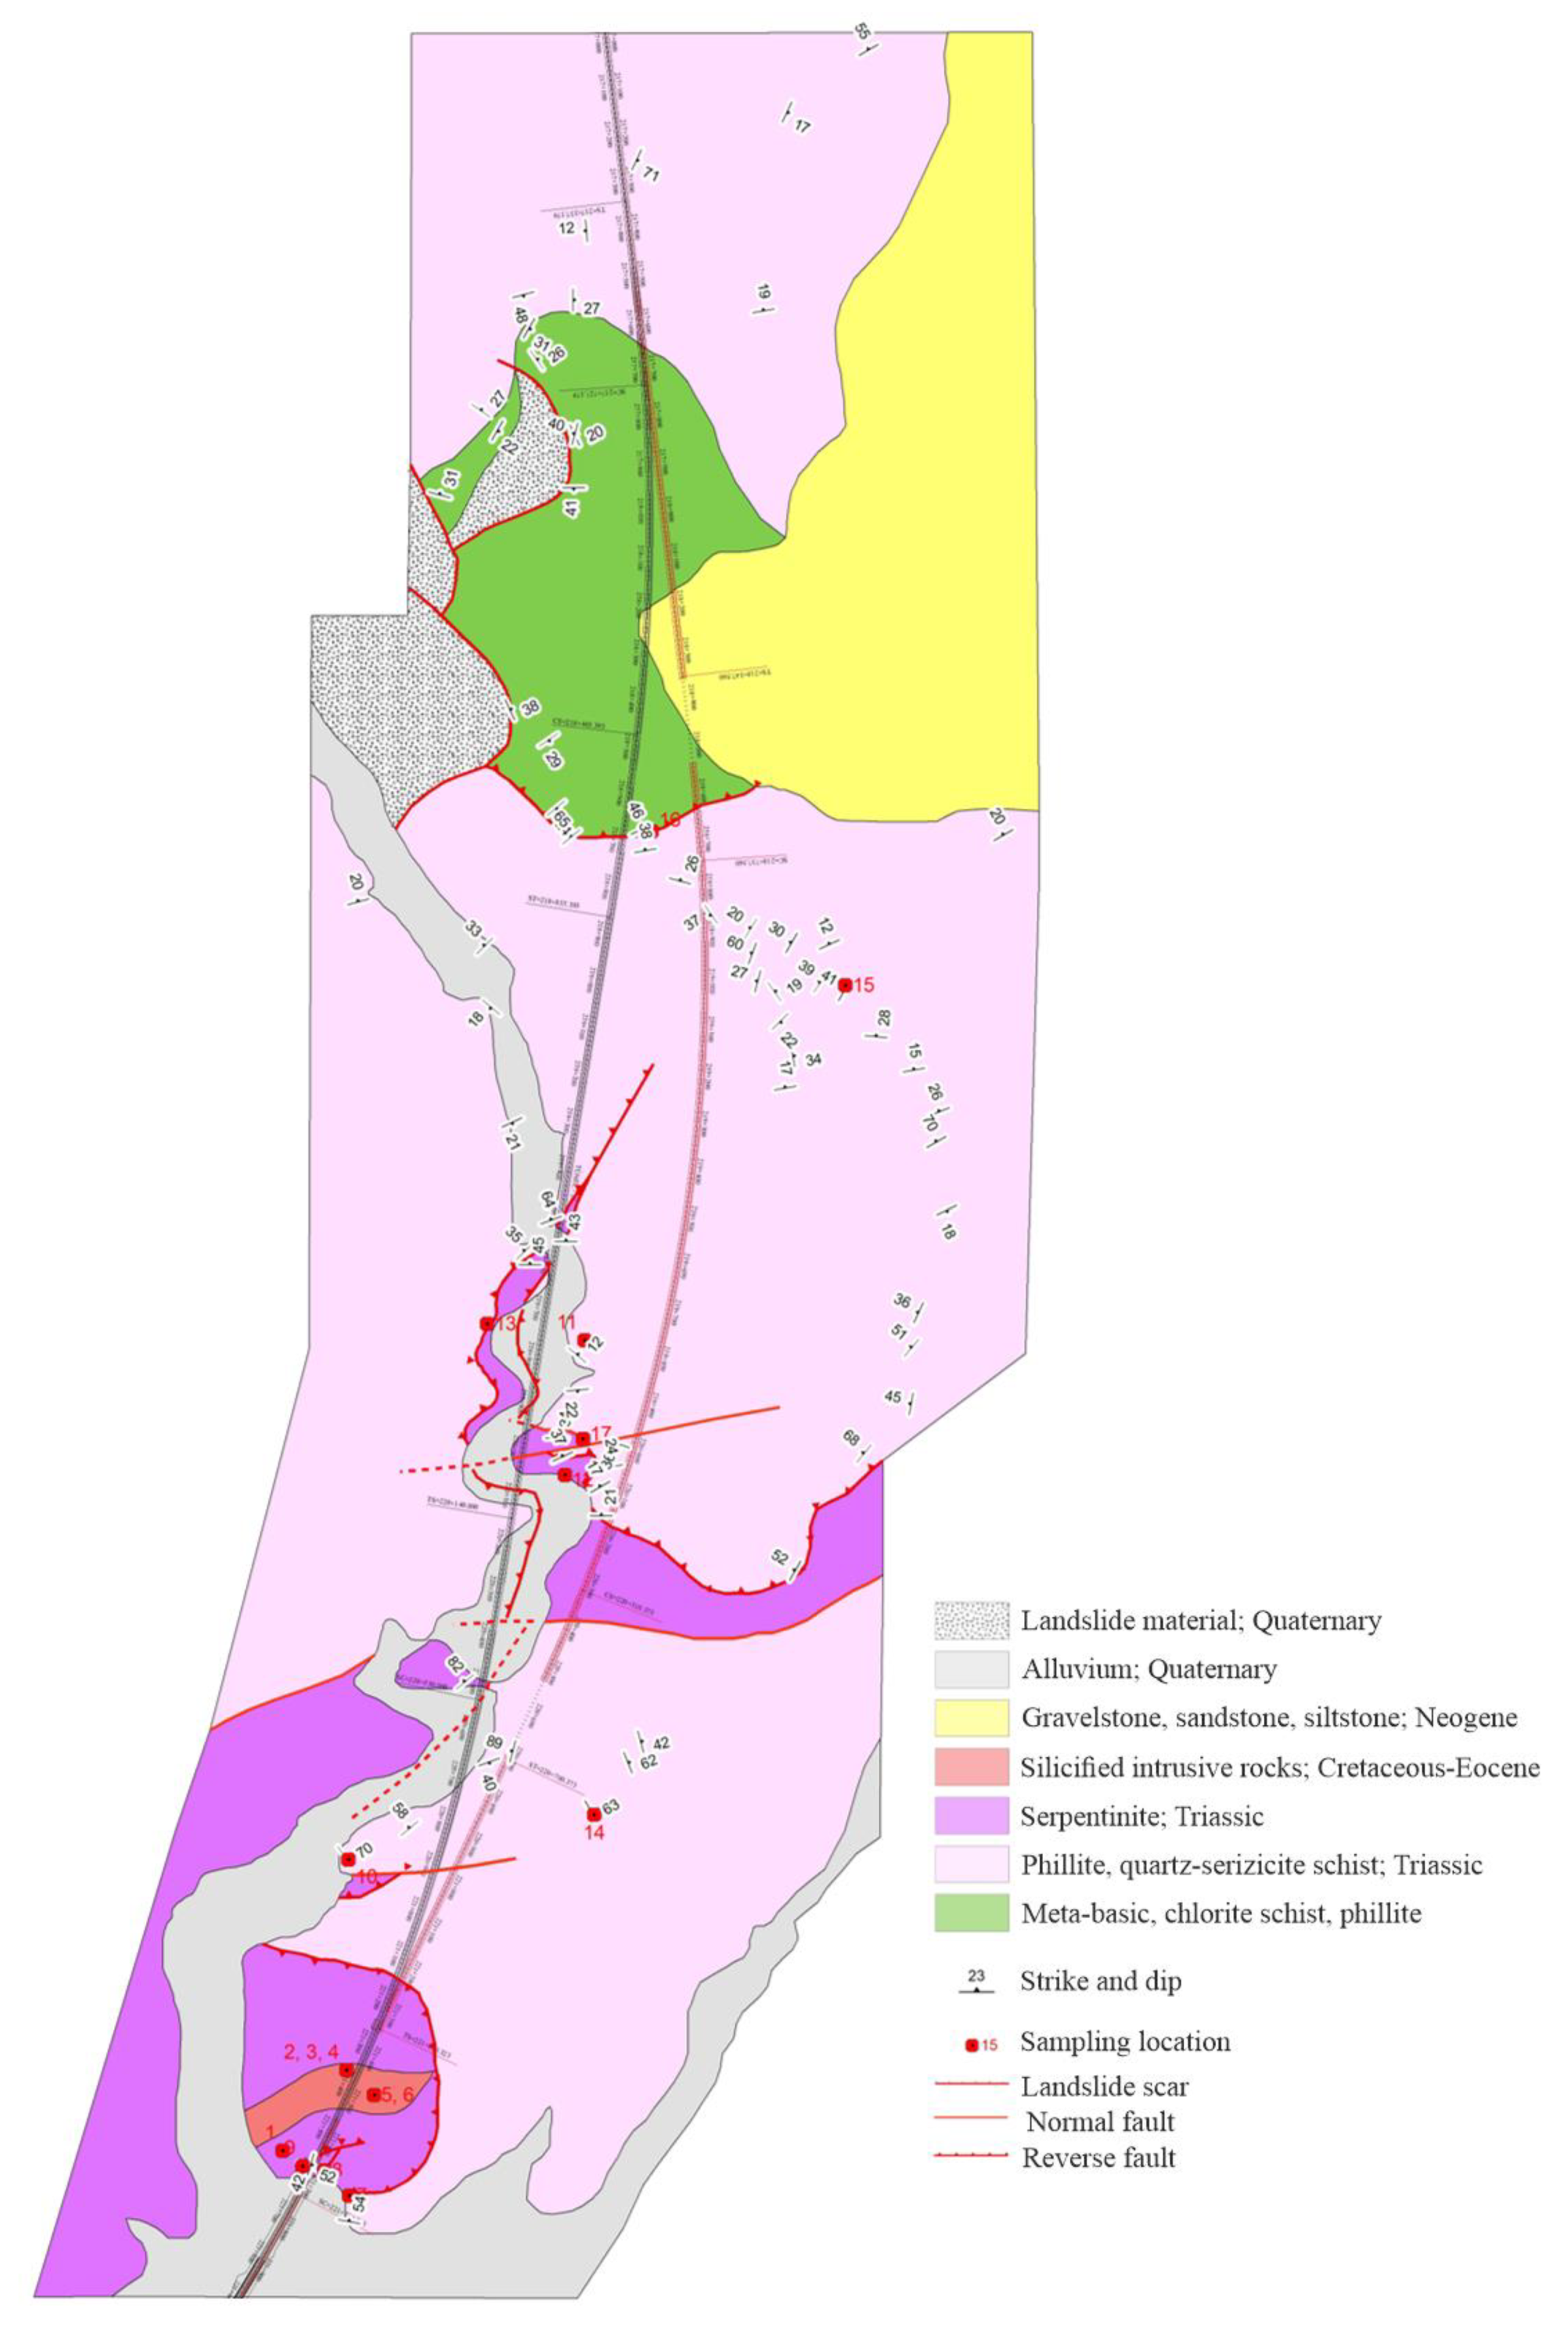
3. Geology of the Site Vicinity
4. Difficulties Encountered during Excavation
4.1. Excavation of the T26 Tunnel with TBM
4.2. Settlements and Subsidence on the Surface along the Route
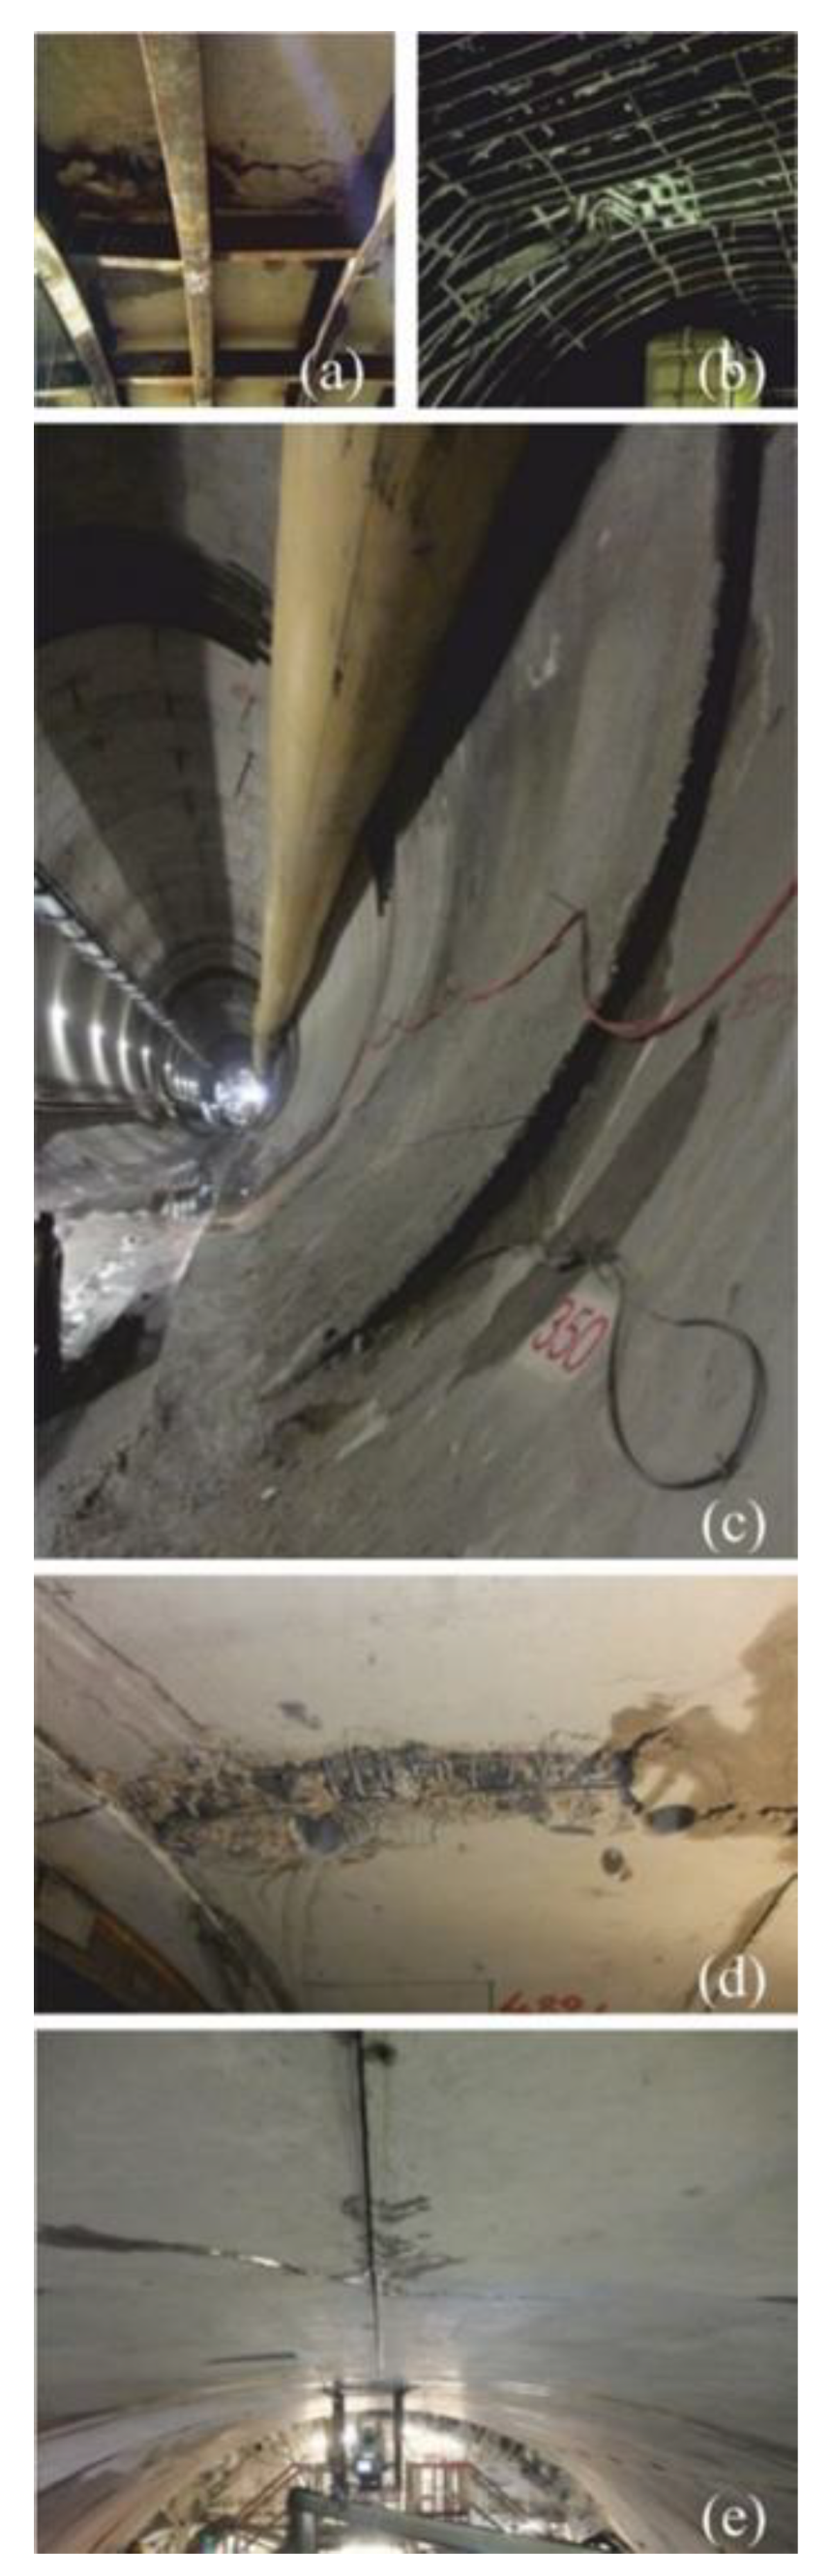
4.3. Failures and Fractures Observed on the TBM Segments
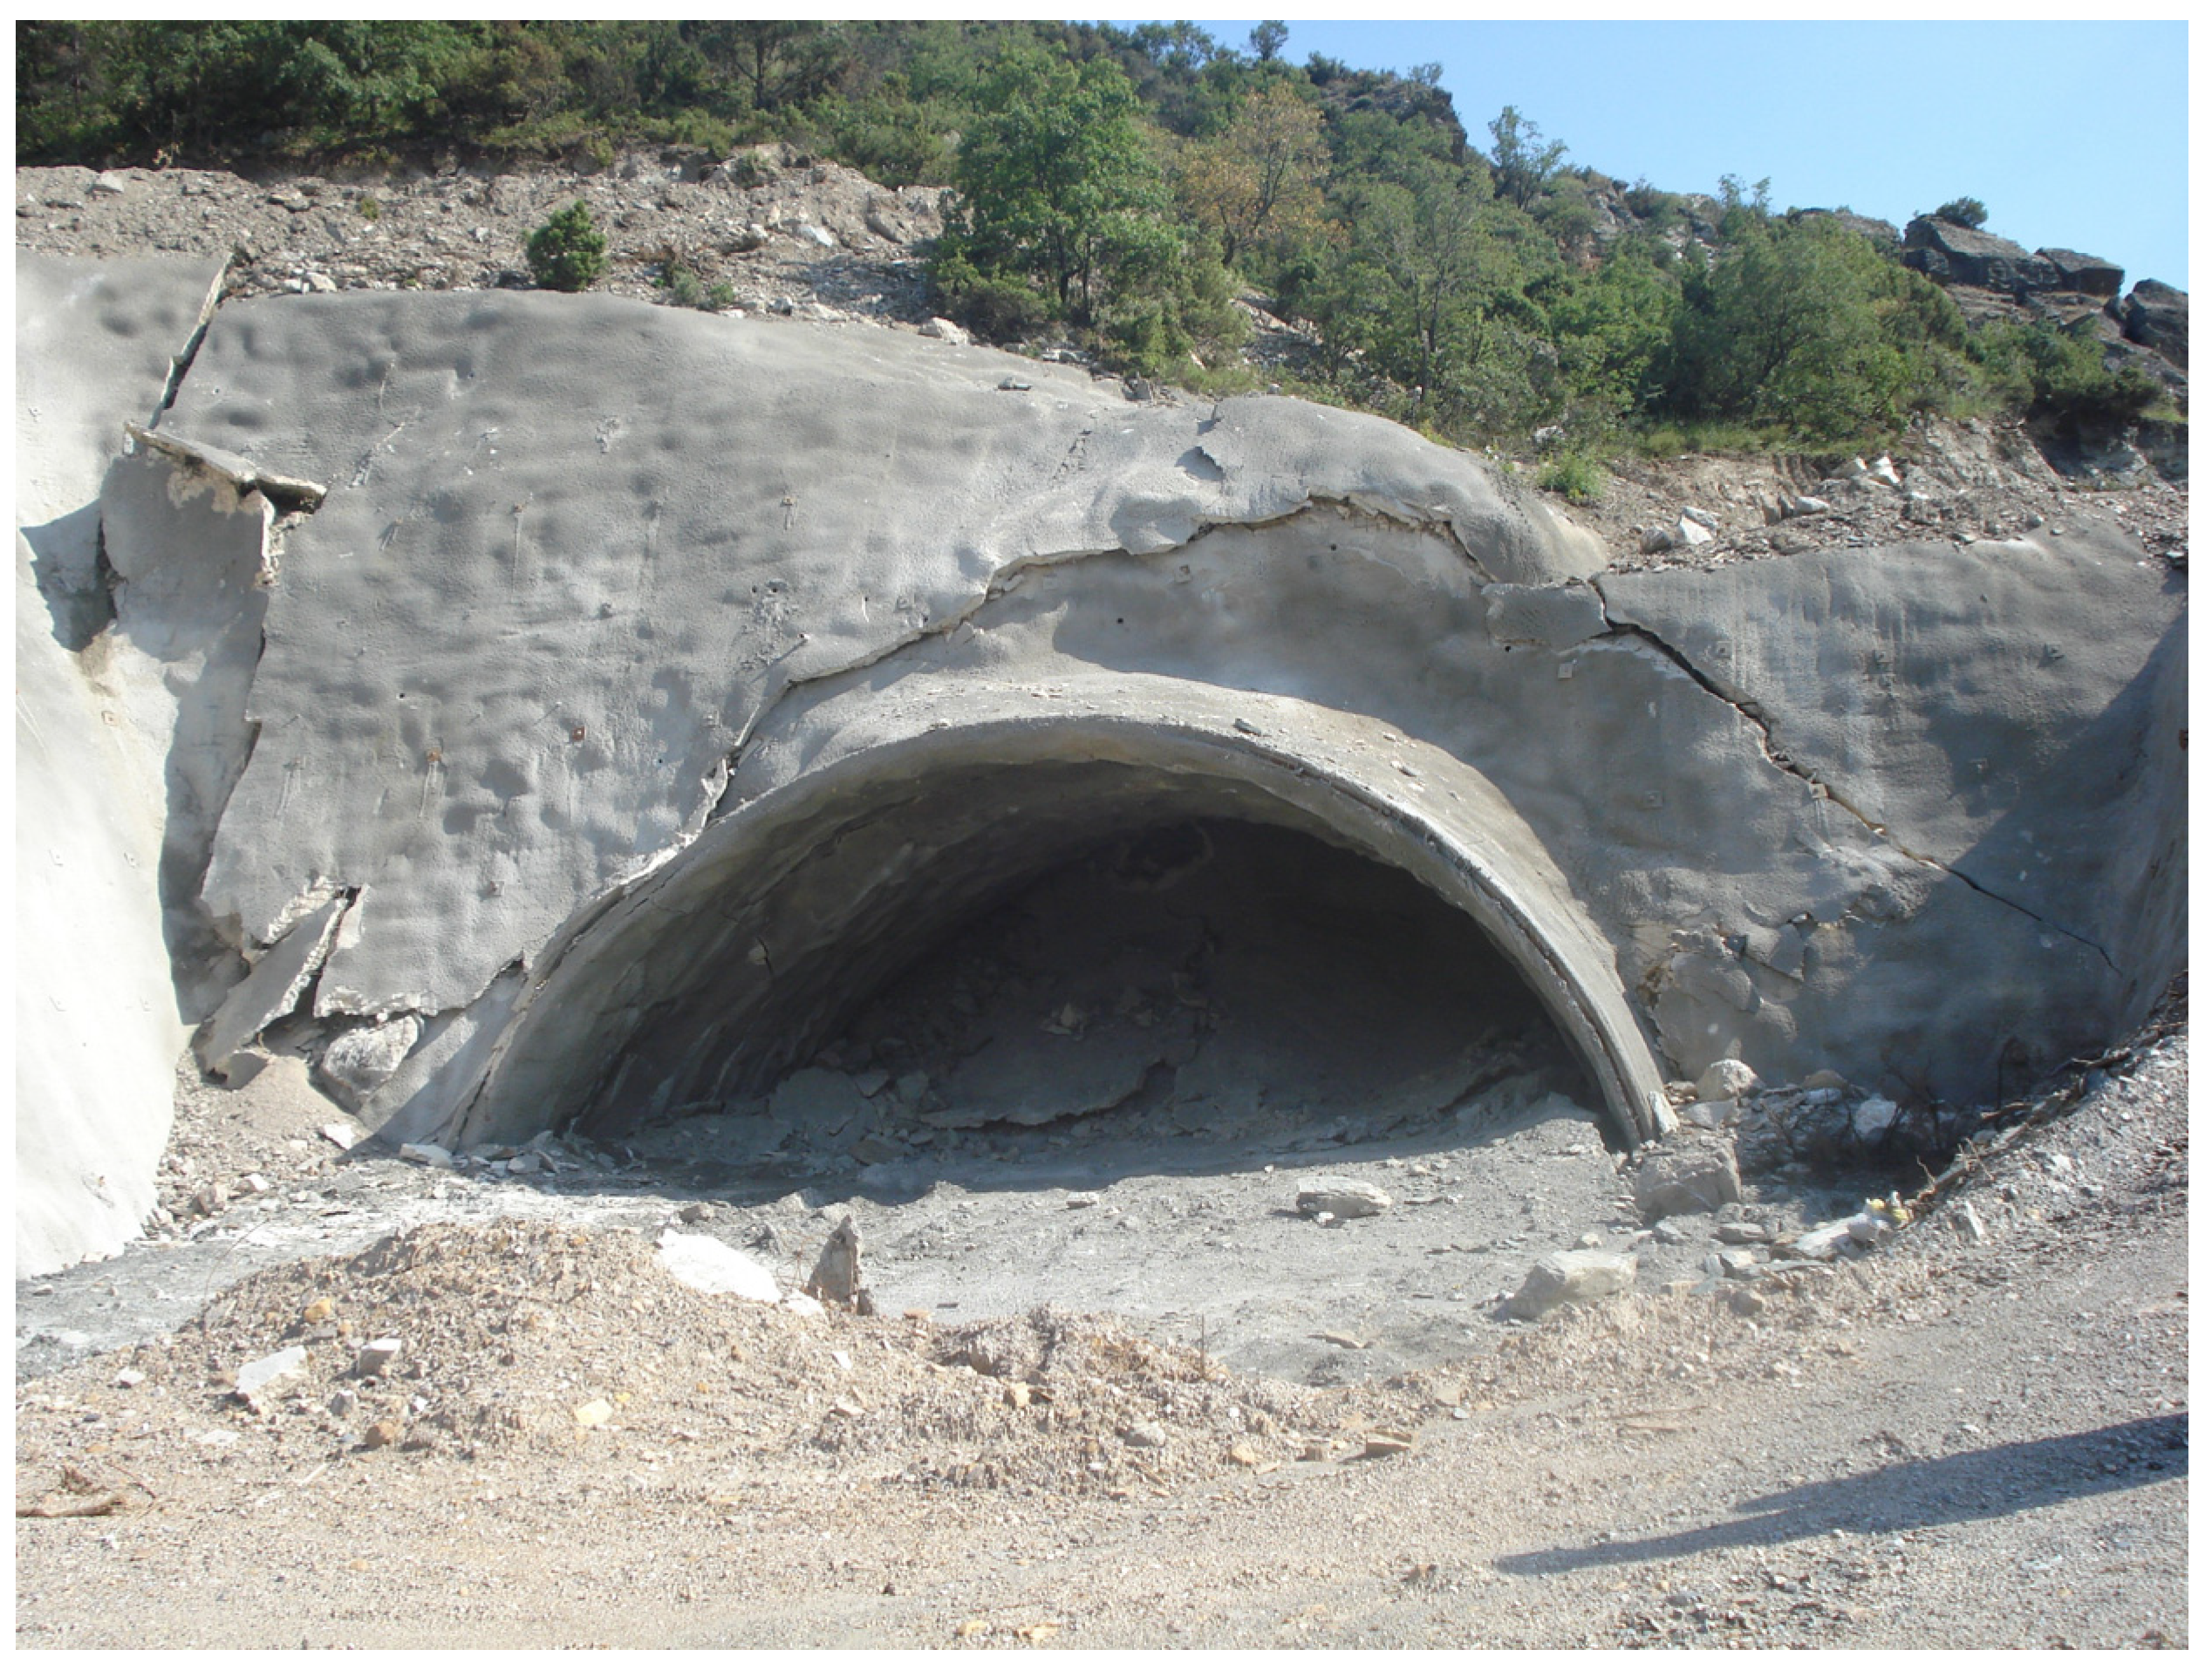
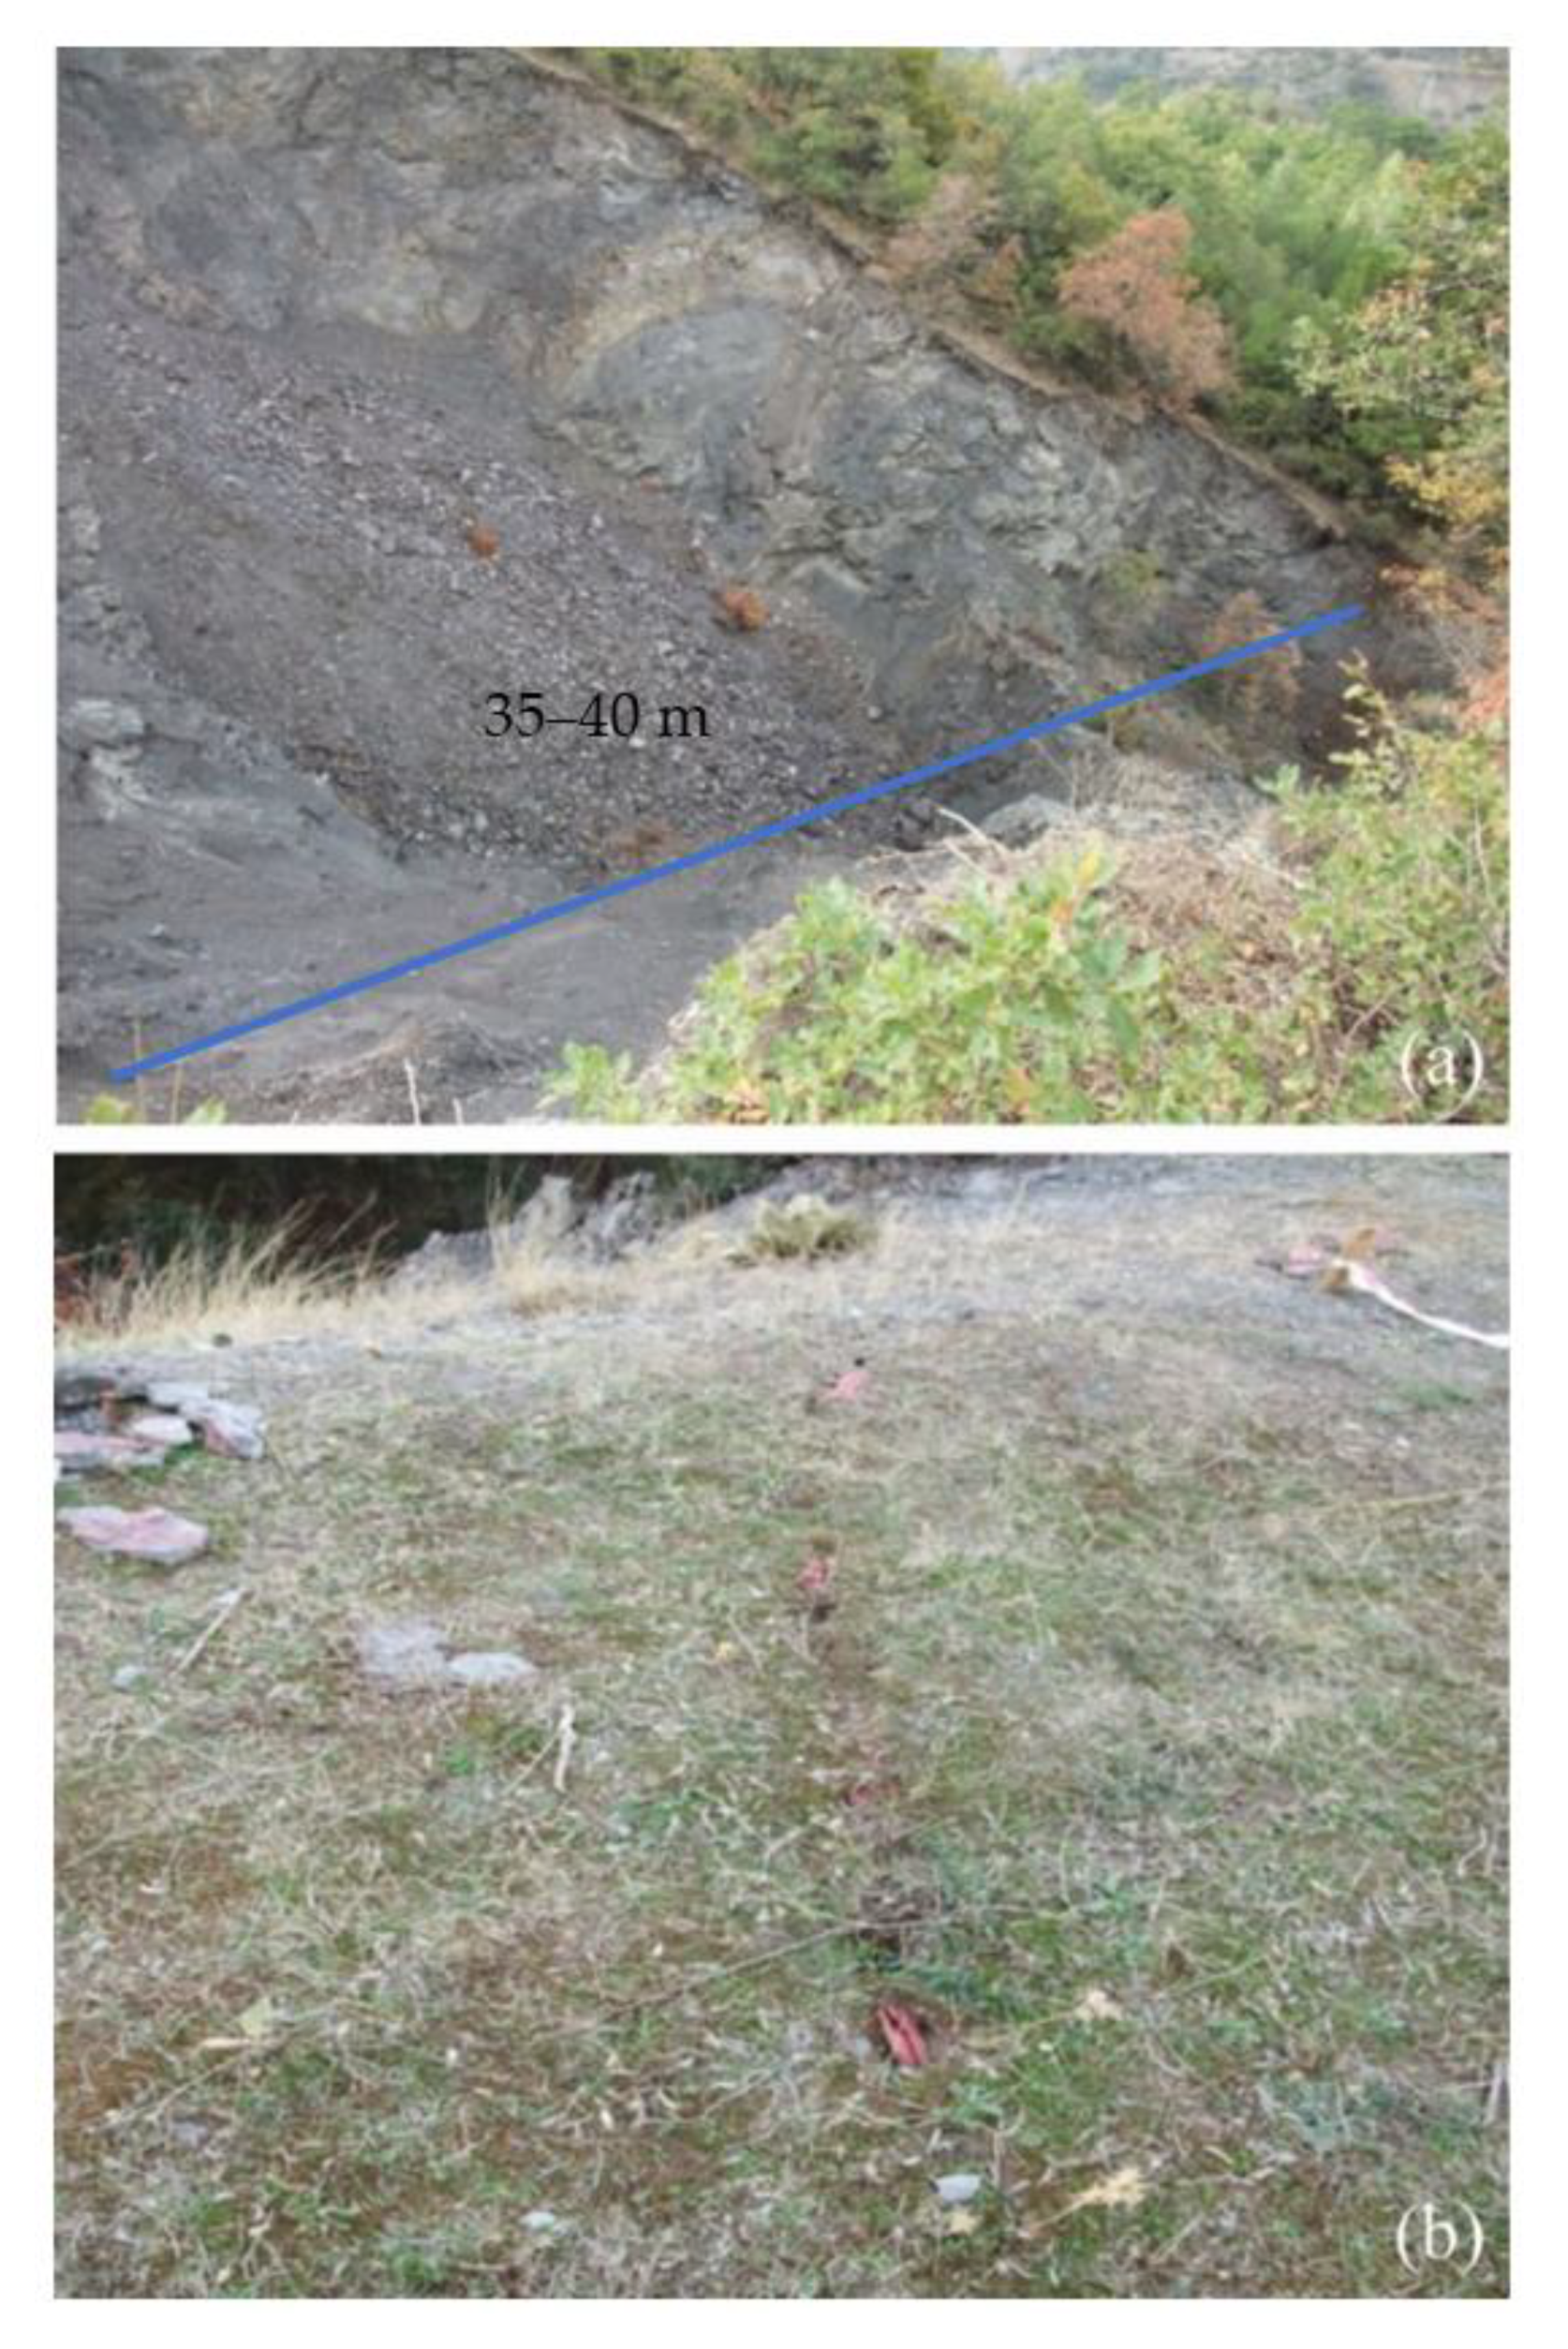
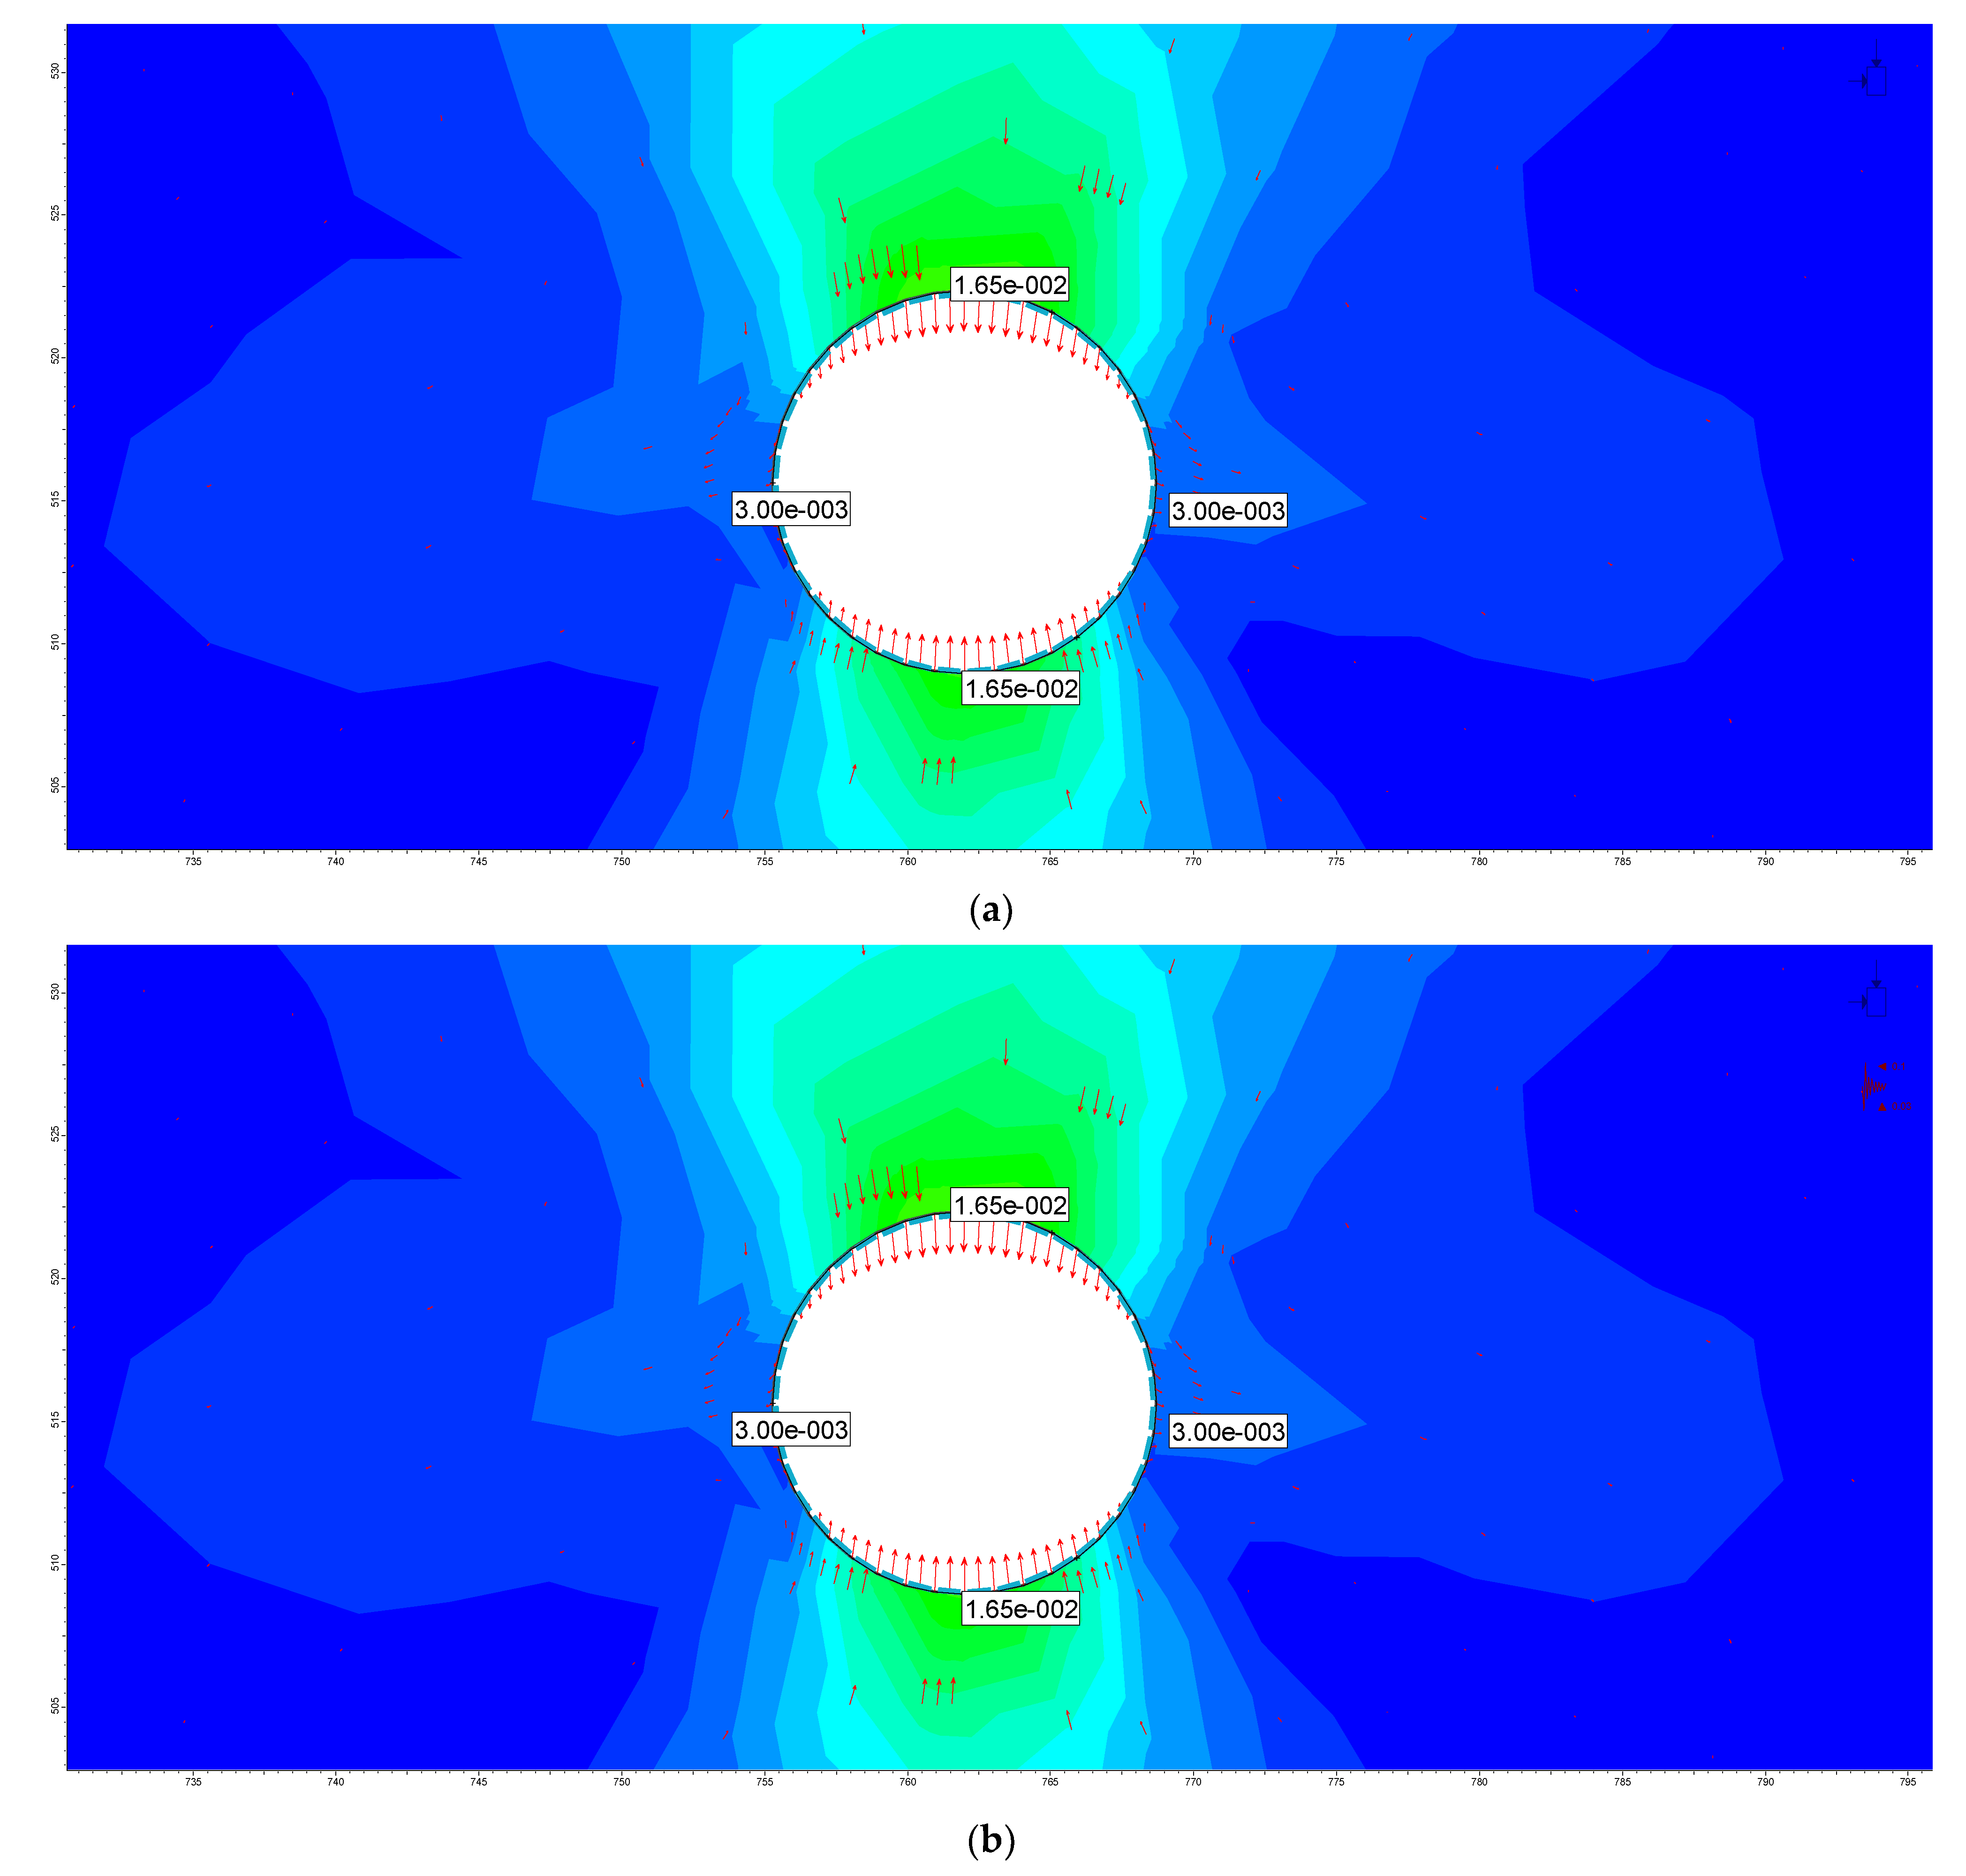
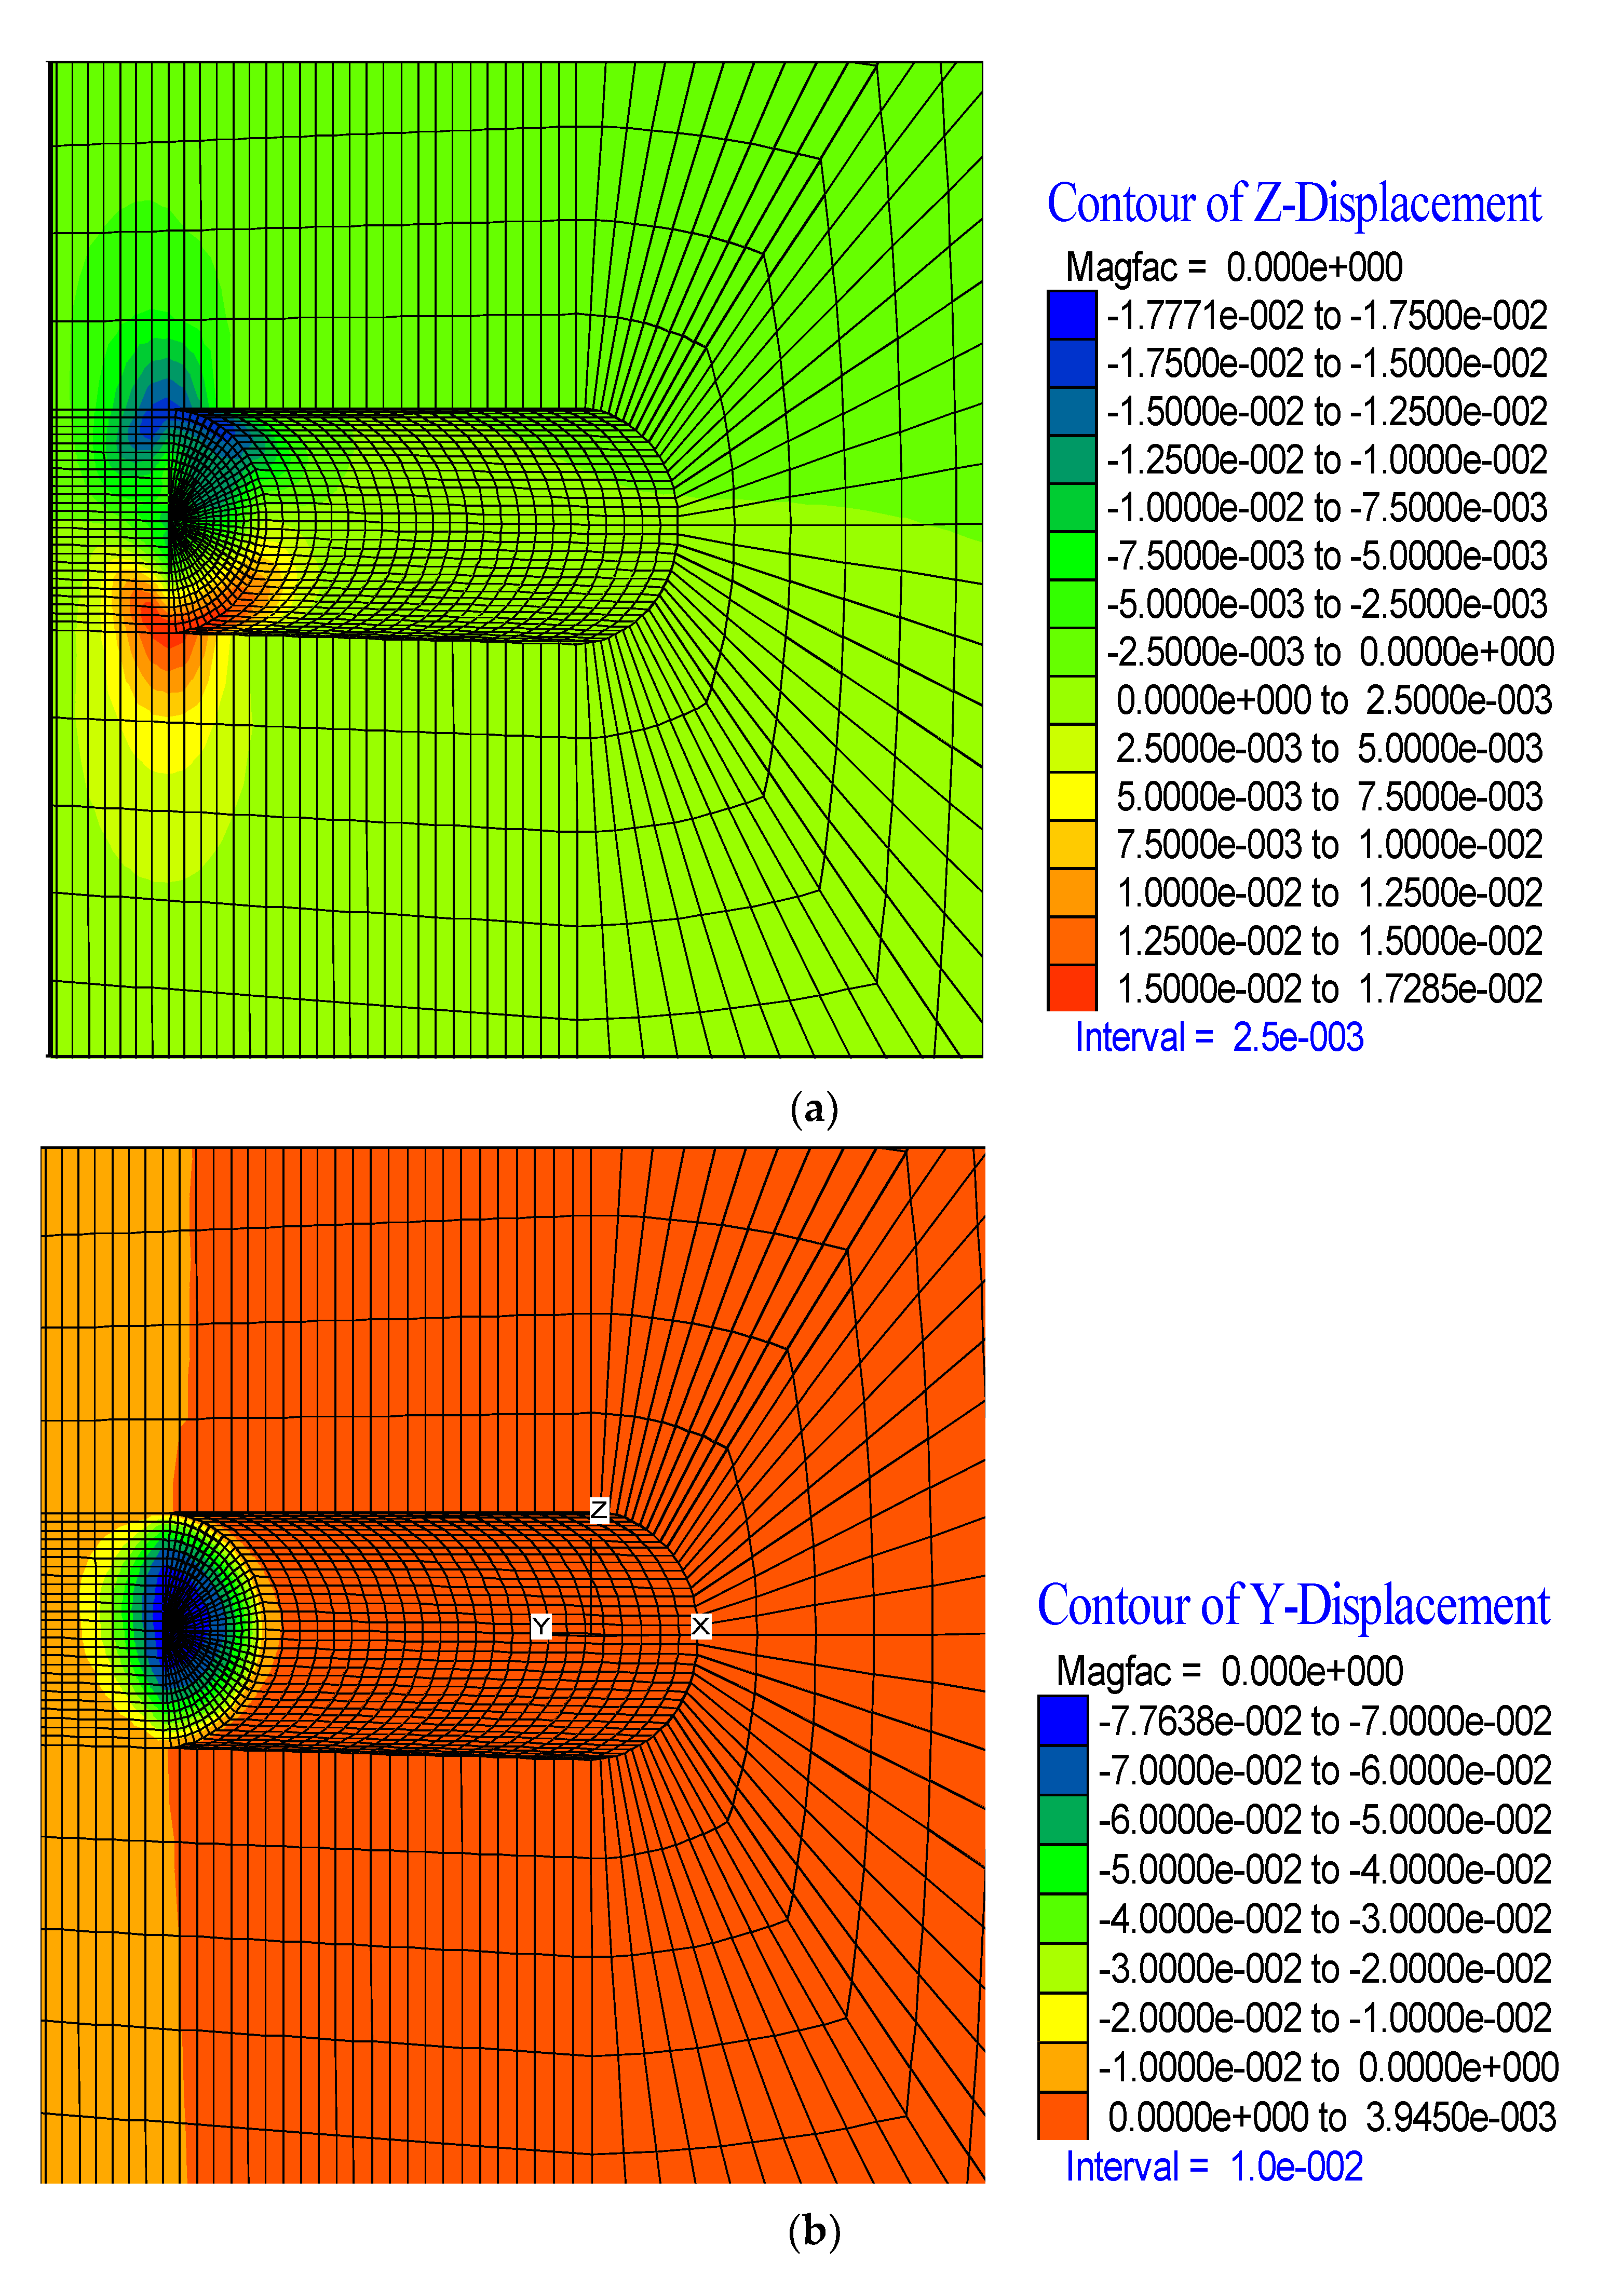
4.4. Investigation of the Collapsed Zone and Squeezing Mechanism
4.5. Analysis of TBM Section under Squeezing Conditions
4.6. Analysis for TBM Section under Squeezing Conditions
5. Discussions and Conclusions
- (a)
- Unexpected conditions are likely to occur in extremely complex geological environments. This uncertainty must be taken into account, especially if excavations are applied with TBM in long tunnels to be constructed in extremely complex geological environments.
- (b)
- Especially in high-speed railway projects, construction works must be carried out in adverse geological conditions due to geometric limitations. These issues must be taken into account at the project stage.
- (c)
- If there are landslides or paleo-landslides along the tunnel route, the failure surfaces of these landslides should be determined and their relationship with the tunnel should be described. In addition, landslides must be taken into account in numerical analysis. The reactivation of paleo-landslides is possible due to tunnel excavations.
- (d)
- As in the case of T26, high deformations occur, especially due to squeezing in tunnels constructed in extremely weak rock masses. Therefore, the excavation stages should be kept at the shortest possible distance and the ring should be closed and the invert should be completed immediately.
Author Contributions
Funding
Data Availability Statement
Acknowledgments
Conflicts of Interest
References
- Barton, N. TBM Prognoses in Hard Rock with Faults Using QTBM Methods; IoM3 Institute of Materials, Minerals & Mining: Hong Kong, China, 2009. [Google Scholar]
- Barton, N. TBM Tunnelling in Jointed and Faulted Rock; Balkema: Rotterdam, The Netherlands, 2000; p. 173. [Google Scholar]
- Landrin, H.; Blucekert, C.; Perrin, J.P.; Stacey, S.; Stolfa, A. ALOP/DSU Coverage for Tunneling Risks? International Association of Engineering Insurers: Boston, MA, USA, 2006. [Google Scholar]
- Shang, Y.; Xue, J.; Wang, S.; Yang, Z.; Yang, J. A case history of Tunnel Boring Machine jamming in an inter-layer shear zone at the Yellow River Diversion Project in China. Eng. Geol. 2003, 71, 199–211. [Google Scholar] [CrossRef]
- Farrokh, E.; Rostami, J. Effect of adverse geological condition on TBM operation in Ghomroud tunnel conveyance project. Tunn. Undergr. Space Technol. 2009, 24, 436–446. [Google Scholar] [CrossRef]
- Huang, X.; Liu, Q.; Peng, X.; Lei, G.; Liu, H. Mechanism and forecasting model for shield jamming during TBM tunnelling through deep soft ground. Eur. J. Environ. Civ. Eng. 2017, 23, 1035–1068. [Google Scholar] [CrossRef]
- Aydan, O.; Hasanpour, R.E. Estimation of ground pressures on a shielded TBM in tunneling through squeezing ground and its possibility of jamming. Bull. Eng. Geol. Environ. 2019, 78, 5237–5251. [Google Scholar] [CrossRef]
- Xu, Z.; Wang, W.; Lin, P.; Nie, L.; Wu, J.; Li, Z. Hard-rock TBM jamming subject to adverse geological conditions: Influencing factor, hazard mode and a case study of Gaoligongshan Tunnel. Tunn. Undergr. Space Technol. 2020, 108, 103683. [Google Scholar] [CrossRef]
- Lin, P.; Xiong, Y.; Xu, Z.; Wang, W.; Shao, R. Risk assessment of TBM jamming based on Bayesian networks. Bull. Eng. Geol. Environ. 2021, 81, 47. [Google Scholar] [CrossRef]
- Lin, P.; Yu, T.; Xu, Z.; Shao, R.; Wang, W. Geochemical, mineralogical, and microstructural characteristics of fault rocks and their impact on TBM jamming: A case study. Bull. Eng. Geol. Environ. 2022, 81, 64. [Google Scholar] [CrossRef]
- Ramoni, M.; Anagnostou, G. The Interaction Between Shield, Ground and Tunnel Support in TBM Tunnelling Through Squeezing Ground. Rock Mech. Rock Eng. 2010, 44, 37–61. [Google Scholar] [CrossRef] [Green Version]
- Maleki, M.R.; Dehnavi, R.N. Influence of Discontinuities on the Squeezing Intensity in High In Situ Stresses (a Tunnelling Case Study; Actual Evidences and TBM Release Techniques). Rock Mech. Rock Eng. 2018, 51, 2911–2933. [Google Scholar] [CrossRef]
- Zolfaghari, M.; Mokhtari, E. Geological evidences of collapse zones in TBM Tunneling; a Case Study of Ghomroud Water Conveyance Tunnel, Iran. In Proceedings of the First Asian and 9th Iranian Tunneling Symposium, Tehran, Iran, 31 October–3 November 2011. [Google Scholar]
- Giacomini, L.; Bartimoccia, F.; Rodriguez, C.D. Kishanganga hydroelectric project (Jammu and Kashmir India) head race tunnel tunneling by TBM under Himalaya mountains dealing with adverse conditions. In Underground—The Way to the Future! Anagnostou, G., Ehrbar, H., Eds.; World Tunnel Congress: Geneva, Switzerland, 2013. [Google Scholar]
- Miyazawa, K.; Nakano, K.; Shiromoto, M.; Sasao, H. Rapid Excavation with TBM in Hard Bedrock, Utilizing Information-Oriented Technique; Tunneling Association of Canada: Toronto, ON, Canada, 2010. [Google Scholar]
- Lin, C.C.; Yu, C.W. Discussion and Solution of the TBM Trapped in the Westbound Hsuehshan Tunnel. In Proceedings of the 2005 International Symposium on Design, Construction and Operation of Long Tunnels, Taipei, Taiwan, January 2005; pp. 383–393. [Google Scholar]
- Aygar, E.B.; Gokceoglu, C. Problems Encountered during a Railway Tunnel Excavation in Squeezing and Swelling Materials and Possible Engineering Measures: A Case Study from Turkey. Sustainability 2020, 12, 1166. [Google Scholar] [CrossRef]
- Aygar, E.B.; Gokceoglu, C. A special support design for a large-span tunnel crossing an active fault (T9 Tunnel, Ankara–Sivas High-Speed Railway Project, Turkey). Environ. Earth Sci. 2021, 80, 37. [Google Scholar] [CrossRef]
- Aygar, E.B.; Karahan, S.; Gullu, S.; Gokceoglu, C. Analytical and Numerical Analyses of the Support System for a Large-span Tunnel in Challenging and Seismically Active Ground Conditions. Transp. Infrastruct. Geotechnol. 2022, 1–44. [Google Scholar] [CrossRef]
- Gokceoglu, C. Assessment of rate of penetration of a tunnel boring machine in the longest railway tunnel of Turkey. SN Appl. Sci. 2021, 4, 19. [Google Scholar] [CrossRef]
- Sengor, A.M.C.; Yilmaz, Y. Tethyan evolution of Turkey: A plate tectonic approach. Tectonophysics 1981, 75, 181–241. [Google Scholar] [CrossRef]
- Tuysuz, O.; Genc, S.C. Geology of Turkish State Railways (TCDD) Ankara-Istanbul High Speed Train Project Vezirhan-Inonu-Stage T26 Tunnel Route. CIB Joint Venture. 2012; unpublished work. p. 24. [Google Scholar]
- Okay, A. Metamorphic belts in the Northwest Anatolia. Ketin Semp. Bull. Geol. Soc. Turk. 1984, 1, 83–92. [Google Scholar]
- Okay, A.I.; Sunal, G.; Sherlock, S.; Kylander-Clark, A.R.C.; Özcan, E. İzmir-Ankara Suture as a Triassic to Cretaceous Plate Boundary—Data From Central Anatolia. Tectonics 2020, 39, e2019TC005849. [Google Scholar] [CrossRef]
- Ocakoglu, F.; Acikalin, S.; Gokceoglu, C.; Nefeslioglu, H.A.; Sonmez, H. Back-analysis of the source of the 1956 Eskisehir Earthquake using attenuation equation and damage data. Bull. Eng. Geol. Environ. 2006, 66, 353–360. [Google Scholar] [CrossRef]
- Ocakoglu, F.; Acikalin, S.; Gokceoglu, C.; Karabacak, V.; Cherkinsky, A. A multistory gigantic subaerial debris flow in an active fault scarp in NW Anatolia, Turkey: Anatomy, mechanism and timing. Holocene 2009, 19, 955–965. [Google Scholar] [CrossRef]
- Okay, A.I.; Noble, P.J.; Tekin, U.K. Devonian radiolarian ribbon cherts from the Karakaya Complex, Northwest Turkey: Implications for the Paleo-Tethyan evolution. C. R. Palevol 2011, 10, 1–10. [Google Scholar] [CrossRef]
- Sayıt, K.; Göncüoglu, M.C. Geodynamic evolution of the Karakaya Mélange Complex, Turkey: A review of geological and petrological constraints. J. Geodyn. 2013, 65, 56–65. [Google Scholar] [CrossRef]
- Ustaömer, T.; Ustaömer, P.A.; Robertson, A.H.F.; Gerdes, A. Implications of U–Pb and Lu–Hf isotopic analysis of detrital zircons for the depositional age, provenance and tectonic setting of the Permian–Triassic Palaeotethyan Karakaya Complex, NW Turkey. Int. J. Earth Sci. 2016, 105, 7–38. [Google Scholar] [CrossRef]
- Marroni, M.; Göncüoğlu, M.C.; Frassi, C.; Sayit, K.; Pandolfi, L.; Ellero, A.; Ottria, G. The Intra-Pontide ophiolites in Northern Turkey revisited: From birth to death of a Neotethyan oceanic domain. Geosci. Front. 2020, 11, 129–149. [Google Scholar] [CrossRef]
- Altinli, I.E. Geology of Central Sakarya. In 50th Anniversary of Turkish Republic Earth Science Congress; Mineral Research and Exploration Institute: Turkey Ankara, 1975; pp. 159–191. [Google Scholar]
- Altinli, I.E. Orta Sakarya Jeolojisi. Cumhuriyetin 50. Yili Yerbilim. Kongr. Teblig. Maden Tetk. Aram. Enstitüsü. 1975, pp. 159–191. Available online: https://www.worldcat.org/title/tebligler-cumhuriyetin-50-yl-yerbilimleri-kongresi-17-19-aralk-1973/oclc/63757814 (accessed on 12 October 2022).
- Yilmaz, Y. Petrogenetic Evolution of the “Old Base Complex” around Bilecik-Sogut. Associate Professorship Dissertation, Faculty of Science, İstanbul University, Istanbul, Türkiye, 1977; p. 169. [Google Scholar]
- Yilmaz, Y. Polymetamorphism in Sogut-Bilecik Region and Geotechnical Meaning of Them. Bull. Geol. Soc. Turk. 1979, 22, 85–100. [Google Scholar]
- Cogulu, H.E.; Delaloye, M.; Chessex, R. Sur l’age de quelques roches plutoniques acides dans la région d’Eskisehir-Turquie. Arch. Sci. Geneve 1965, 18, 692–699. [Google Scholar]
- Fugro Sial Geosciences Consulting and Engineering Ltd. Ankara Istanbul High Speed Railway Project Vezirhan Kosekoy Section, Geological-Geotechnical Excavation and Support Design Project of T26 Tunnel, Geotechnical Investigation Report of T26 Tunnel and Project Report of T26 Tunnel and Geotechnical Investigation Report of Exit Portal of T26 Tunnel. 2016; unpublished work. [Google Scholar]
- Gall Zeidler Consultants. Ankara-Istanbul High Speed Train Project, Phase 2-T26 Tunnel, Executive Summary Report on Segment Damages. 2012, unpublished work; p. 36.
- Mott MacDonald. Tunnel Review and Recommendations. 2012; unpublished work. [Google Scholar]
- Swiss Federal Institute of Technology. Eskisehir-Kosekoy Railway Project, Assessment of Squeezing Problems Report. 2012; unpublished work. [Google Scholar]
- Zou, J.; Chen, G.; Qian, Z. Tunnel face stability in cohesion-frictional soils considering the soil arching effect by improved failure models. Comput. Geotech. 2019, 106, 1–17. [Google Scholar] [CrossRef]
- Ding, W.; Liu, K.; Shi, P.; Li, M.; Hou, M. Face stability analysis of shallow circular tunnels driven by a pressurized shield in purely cohesive soils under undrained conditions. Comput. Geotech. 2019, 107, 110–127. [Google Scholar] [CrossRef]
- Zhang, C.; Han, K.; Zhang, D. Face stability analysis of shallow circular tunnels in cohesive–frictional soils. Tunn. Undergr. Space Technol. 2015, 50, 345–357. [Google Scholar] [CrossRef]
- Lü, X.; Zhou, Y.; Huang, M.; Zeng, S. Experimental study of the face stability of shield tunnel in sands under seepage condition. Tunn. Undergr. Space Technol. 2018, 74, 195–205. [Google Scholar] [CrossRef]
- Elbaz, K.; Yan, T.; Zhou, A.; Shen, S.-L. Deep learning analysis for energy consumption of shield tunneling machine drive system. Tunn. Undergr. Space Technol. 2022, 123, 104405. [Google Scholar] [CrossRef]
- Tu, S.; Li, W.; Zhang, C.; Chen, W. Effect of inclined layered soils on face stability in shield tunneling based on limit analysis. Tunn. Undergr. Space Technol. 2023, 131, 104773. [Google Scholar] [CrossRef]
- Mollon, G.; Dias, D.; Soubra, A.-H. Face Stability Analysis of Circular Tunnels Driven by a Pressurized Shield. J. Geotech. Geoenviron. Eng. 2010, 136, 215–229. [Google Scholar] [CrossRef] [Green Version]
- Ramoni, M.; Anagnostou, G. Thrust force requirements for TBMs in squeezing ground. Tunn. Undergr. Space Technol. 2010, 25, 433–455. [Google Scholar] [CrossRef]
- Itasca. Flac3d User Manual, Getting Started. 2002. Available online: https://www.itascacg.com/learning/tutorials/flac3d-quick-start-tutorial (accessed on 5 January 2022).
- Gokceoglu, C.; Turer, A.; Nefeslioglu, H.; Turer, D.; Meral, C. Safety assessment of limestone-based engineering structures to be partially flooded by dam water: A case study from northeastern Turkey. Eng. Geol. 2016, 209, 44–55. [Google Scholar] [CrossRef]
- Gokceoglu, C.; Kocaman, S.; Nefeslioglu, H.A.; Ok, A.O. Use of multisensor and multitemporal geospatial datasets to extract the foundation characteristics of a large building: A case study. Bull. Eng. Geol. Environ. 2021, 80, 3251–3269. [Google Scholar] [CrossRef]
- Aygar, E.B.; Gokceoglu, C. Analytical solutions and 3D numerical analyses of a shallow tunnel excavated in weak ground: A case from Turkey. Int. J. Geo-Eng. 2021, 12, 9. [Google Scholar] [CrossRef]
- Can, A.; Baskose, Y.; Gokceoglu, C. Stability assessments of a triple-tunnel portal with numerical analysis (south of Turkey). Geotech. Res. 2022, 9, 116–128. [Google Scholar] [CrossRef]
- Ramoni, M.; Anagnostou, G. Tunnel boring machines under squeezing conditions. Tunn. Undergr. Space Technol. 2010, 25, 139–157. [Google Scholar] [CrossRef]
- Larsen, I.J.; Montgomery, D.R.; Korup, O. Landslide erosion controlled by hillslope material. Nat. Geosci. 2010, 3, 247–251. [Google Scholar] [CrossRef]
- IAEG (Commision on Landslides). Suggested Nomenclature for Landslides. Bull. Int. Assoc. Eng. Geol. 1990, 41, 13–16. [Google Scholar] [CrossRef]
- WP/WLI (International Geotechnical Societies UNESCO Working Party on World Landslide Inventory). A Suggested method for reporting a landslide. Bull. Int. Assoc. Eng. Geol. 1990, 41, 5–12. [Google Scholar] [CrossRef]
- Hammah, R.E.; Yacoub, T.E.; Corkum, B.C.; Curran, J.H. The Shear Strength Reduction Method for the Generalized Hoek-Brown Criterion. In Proceedings of the 40th US Symposium on Rock Mechanics (USRMS): Rock Mechanics for Energy, Mineral and Infrastructure Development in the Northern Regions, Anchorage, AK, USA, 25–29 June 2005. ARMA/USRMS 05-810. [Google Scholar]


| Uniaxial Comp. Strength | Geological Strength Index | Material Constant | Elastic Modulus | Unit Weight | Cohesion | Internal Friction Angle | Deformation Modulus |
|---|---|---|---|---|---|---|---|
| UCS | GSI | mi | Ei | γn | c | ϕ | Em |
| (MPa) | (MPa) | (kN/m3) | (kPa) | (°) | (MPa) | ||
| 27 | 25 | 10 | 4500 | 22.0 | 240 | 37 | 270 |
| Deformation Modulus (MPa) | Cohesion (kPa) | Internal Friction Angle (ϕ) | Bulk Modulus (MPa) | Shear Modulus (MPa) | |
|---|---|---|---|---|---|
| Analysis-1 | 270 | 100 | 15 | 225 | 103 |
| Analysis-2 | 150 | 50 | 15 | 125 | 58 |
| Analysis-3 | 100 | 20 | 15 | 83 | 38 |
| Displacement in Y-Direction | Displacement in Z-Direction | |
|---|---|---|
| Analysis-1 | 10 cm | 2.42 cm |
| Analysis-2 | 34 cm | 9.8 cm |
| Analysis-3 | 300 cm | 223 cm |
| Element | Ei (GPa) | √ | ϒ (kg/m3) | ds (cm) | fck (MPa) |
|---|---|---|---|---|---|
| Segment Lining | 34 | 0.25 | 2500 | 45 | 40 |
| Stages | Phase |
|---|---|
| 1 | Initial stresses |
| 2 | Reset of the displacements |
| 3 | Excavation and installation of the segments between 40 to 42 m |
| 4 | Excavation and installation of the segments between 42 to 44 m |
| 5 | Excavation and installation of the segments between 44 to 46 m |
| 6 | Excavation and installation of the segments between 46 to 48 m |
| 7 | Excavation and installation of the segments between 48 to 50 m |
| 8 | Excavation and installation of the segments between 50 to 52 m |
| 9 | Excavation and installation of the segments between 52 to 54 m |
| Stage | Vertical Displacement (cm) | Horizontal Displacement (cm) | Face Displacement(cm) |
|---|---|---|---|
| 3 (Between 40 to 42 m) | 76 | 8.56 | 126 |
| 4 (Between 42 to 44 m) | 149 | 26.8 | 221 |
| 5 (Between 44 to 46 m) | 199 | 45.3 | 288 |
| 6 (Between 46 to 48 m) | 251 | 61.2 | 335 |
| 7 (Between 48 to 50 m) | 285 | 71.7 | 365 |
| 8 (Between 50 to 52 m) | 304 | 77.5 | 381 |
| 9 (Between 52 to 54 m) | 306 | 80.1 | 385 |
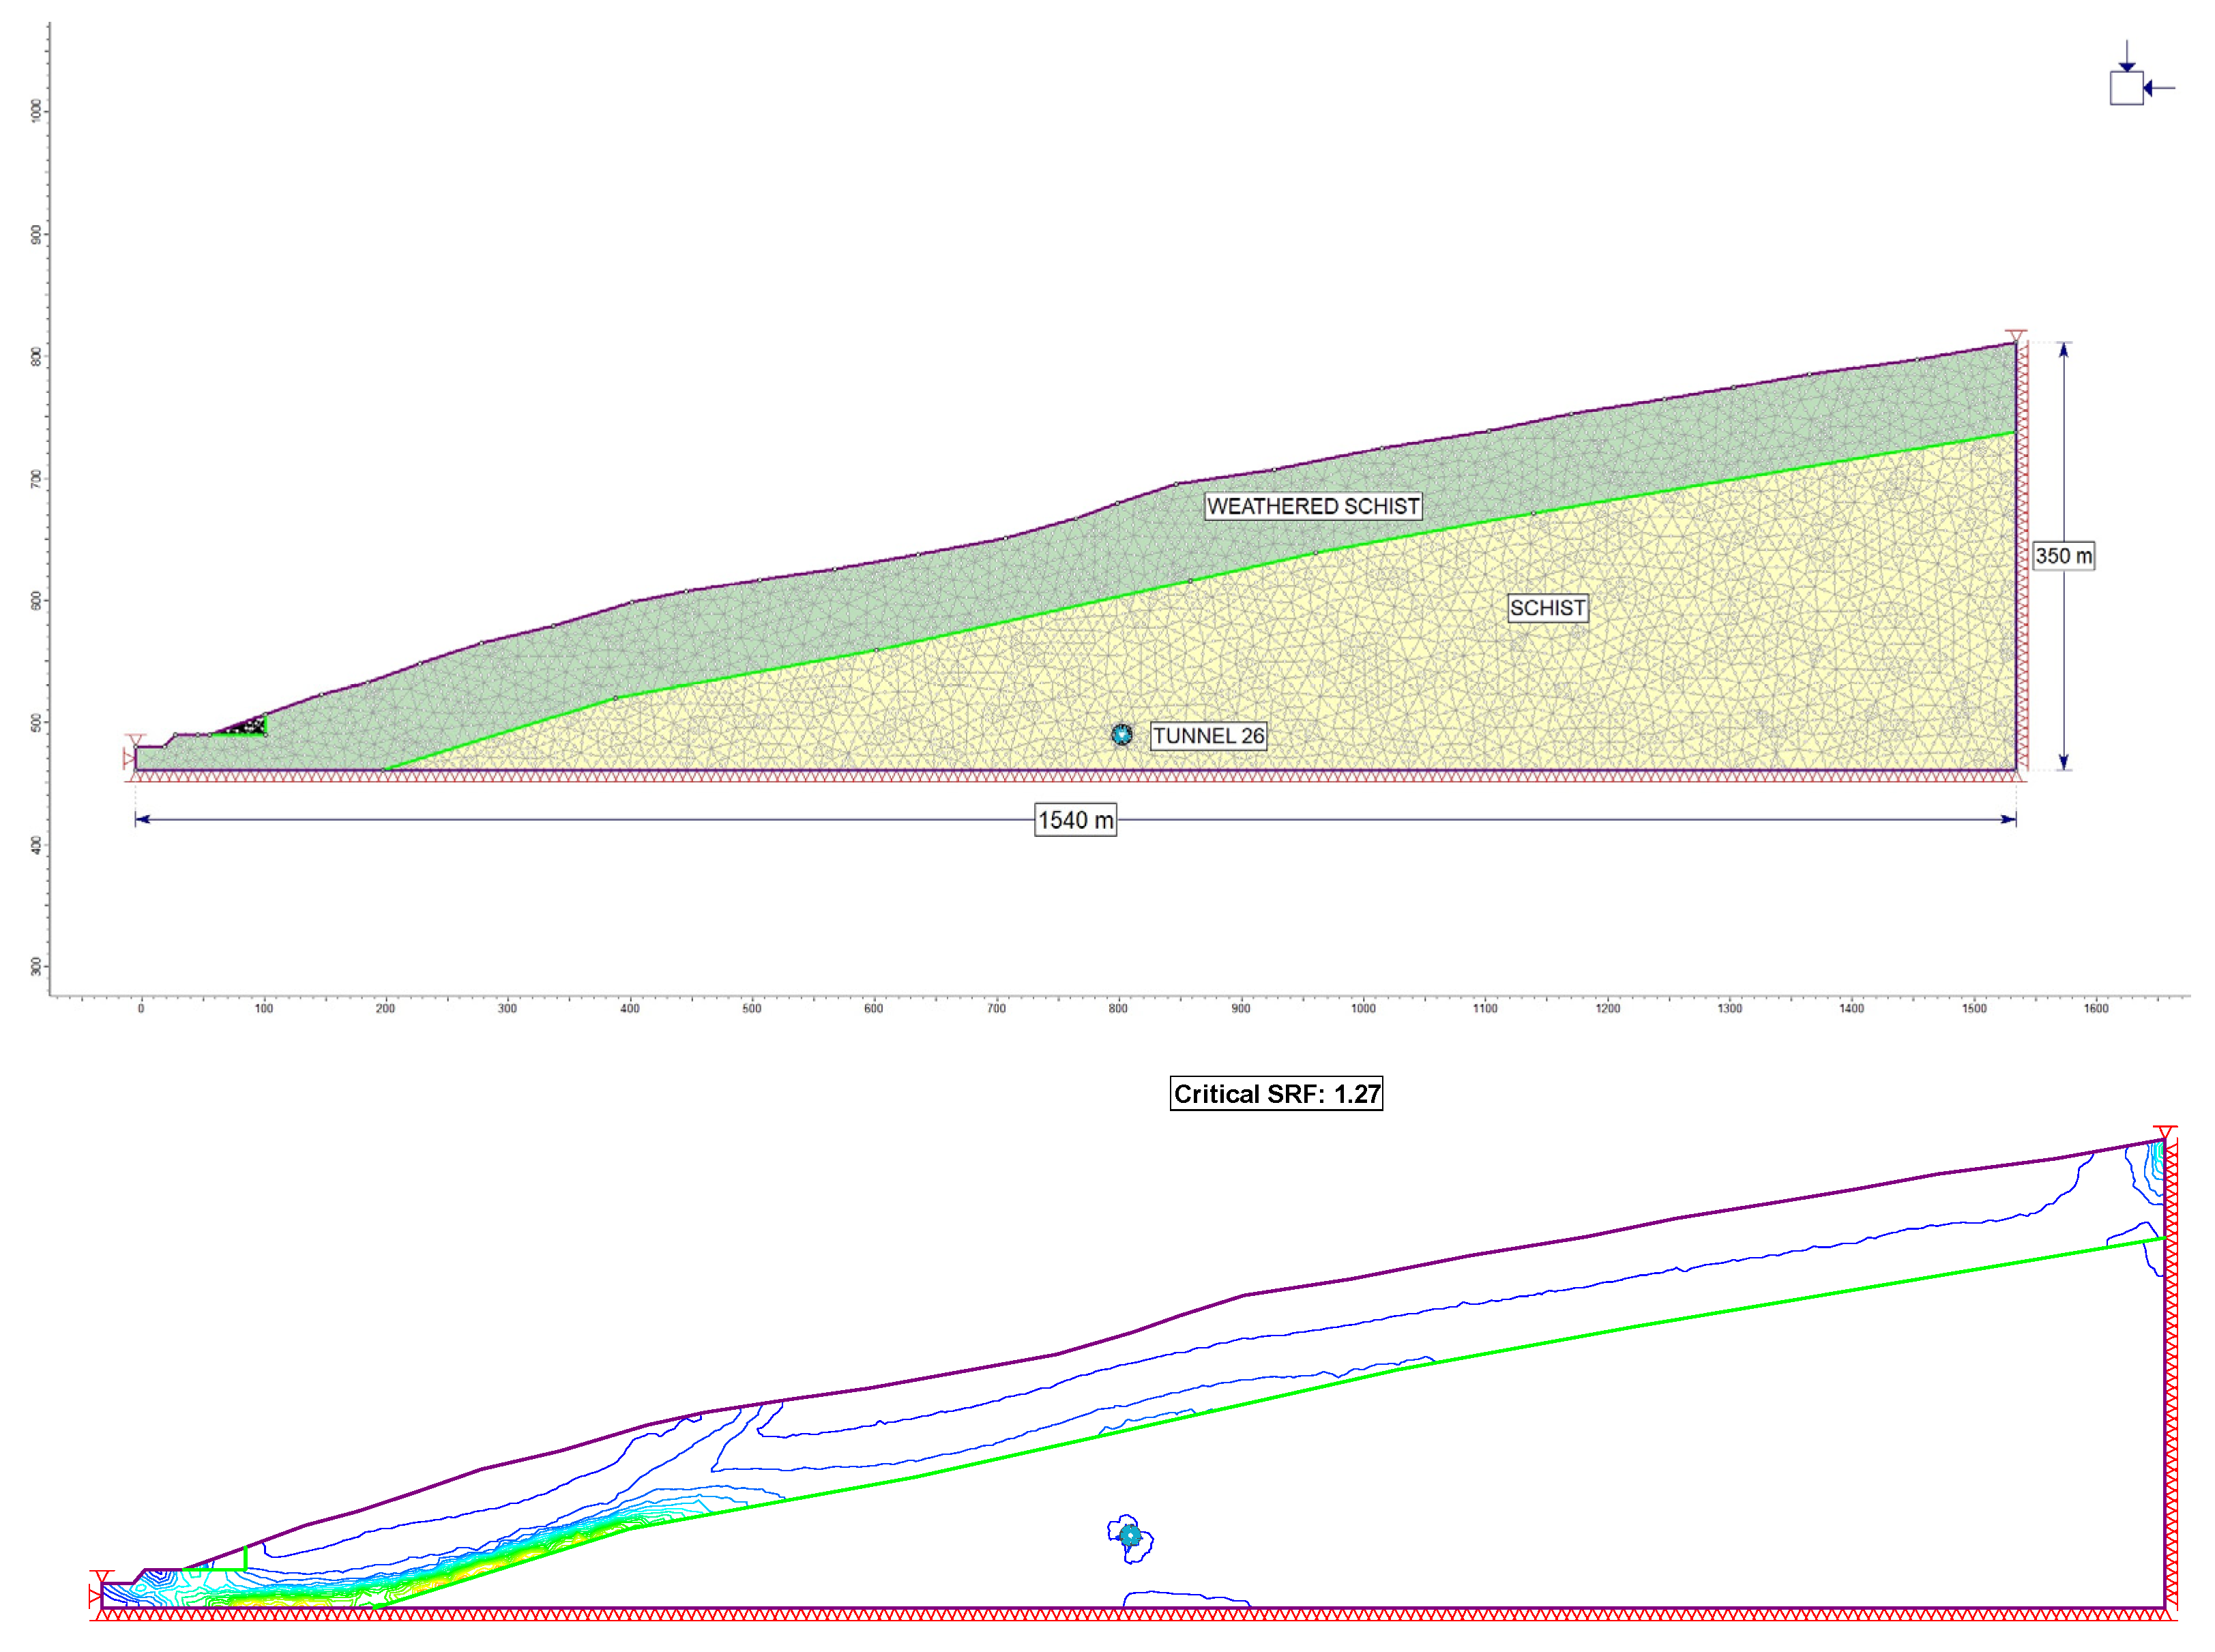
| Landslide | Area (m2) | Volume (m3) | Estimated Deepest Failure Surface Depth (m) |
|---|---|---|---|
| Ls-1 | 95658 | 629,033.28 | 39.46 |
| Ls-2 | 702,216 | 8,950,593.95 | 76.48 |
| Ls-3 | 131,957 | 965,536.86 | 43.90 |
| Ls-4 | 466,271 | 5,187,752.06 | 66.76 |
| Ls-5 | 120,715 | 857,548.76 | 42.62 |
Publisher’s Note: MDPI stays neutral with regard to jurisdictional claims in published maps and institutional affiliations. |
© 2022 by the authors. Licensee MDPI, Basel, Switzerland. This article is an open access article distributed under the terms and conditions of the Creative Commons Attribution (CC BY) license (https://creativecommons.org/licenses/by/4.0/).
Share and Cite
Gokceoglu, C.; Aygar, E.B.; Nefeslioglu, H.A.; Karahan, S.; Gullu, S. A Geotechnical Perspective on a Complex Geological Environment in a High-Speed Railway Tunnel Excavation (A Case Study from Türkiye). Infrastructures 2022, 7, 155. https://doi.org/10.3390/infrastructures7110155
Gokceoglu C, Aygar EB, Nefeslioglu HA, Karahan S, Gullu S. A Geotechnical Perspective on a Complex Geological Environment in a High-Speed Railway Tunnel Excavation (A Case Study from Türkiye). Infrastructures. 2022; 7(11):155. https://doi.org/10.3390/infrastructures7110155
Chicago/Turabian StyleGokceoglu, Candan, Ebu Bekir Aygar, Hakan A. Nefeslioglu, Servet Karahan, and Suat Gullu. 2022. "A Geotechnical Perspective on a Complex Geological Environment in a High-Speed Railway Tunnel Excavation (A Case Study from Türkiye)" Infrastructures 7, no. 11: 155. https://doi.org/10.3390/infrastructures7110155