


The Relationship between Structural Features of Lignocellulosic Materials and Ethanol Production Yield

1
Department of Chemical Engineering, Auburn University, Auburn, AL 36849, USA
2
Department of Chemical Engineering, Isfahan University of Technology, Isfahan 84156-83111, Iran
3
Department of Chemical Engineering, Vrije Universiteit Brussel, 1050 Brussels, Belgium
*
Author to whom correspondence should be addressed.
Designs 2022, 6(6), 119; https://doi.org/10.3390/designs6060119
Submission received: 14 October 2022
/
Revised: 13 November 2022
/
Accepted: 17 November 2022
/
Published: 1 December 2022
(This article belongs to the Special Issue Advanced Thermal Management Technologies: Experimental Case Studies, Numerical Modelling, and Topology Optimization)
Abstract
:Lignocellulosic materials are a mixture of natural polymers which can be considered a great alternative source of chemical products and energy. Hence, pinewood, poplar wood, and rice straw, as representatives of different types of lignocelluloses, were subjected to several pretreatment types in order to increase ethanol production yield. All pretreatments increased enzymatic hydrolysis and ethanol yield, specifically pretreatment with phosphoric acid. This pretreatment increased ethanol yields by 304.6% and 273.61% for poplar wood and pinewood, respectively, compared to untreated substrates. In addition, a number of analyses, including a BET test, buffering capacity, crystallinity, accessible surface area, and composition measurement, were conducted on the pretreated substrates to investigate their structural modifications in detail. Accessible surface area, as one of the most important parameters for performance of enzymes and microorganisms in the fermentation process, was examined by the water retention value test. The results of this method (using centrifuge) showed that the maximum accessible surface area was related to the pretreated samples with phosphoric acid so that it increased WRV to 132.19%, 149.41%, and 68.44% for poplar wood, pinewood, and rice straw, respectively, as compared to untreated substrates. On the whole, pretreatments restructured and opened up the tangled structure of lignocelluloses, resulting in a considerable increase in ethanol yields. Moreover, in this study, for the first time, a new correlation was presented for each substrate which indicates the relationship between ethanol yield and structural features of the lignocellulosic substrate.
1. Introduction
Growing concerns regarding depletion of oil resources, environmental impacts, fluctuations in the petroleum products market, and increasing demand for energy have promoted extensive research on renewable and clean alternative fuels [1,2,3,4]. Air pollution intensifies the risk of noncommunicable diseases (such as cancer), and during the Coronavirus disease pandemic, it may have increased susceptibility to COVID-19 infection [5]. Hence, biofuels can partially alleviate the concerns of these issues [6] and contribute to reducing greenhouse gas emissions [7]. One of the most common biofuels in the world is bioethanol, which can be used instead of fossil fuels in car engines [8,9]. Biomass conversion is the main method of bioethanol production [10], and lignocellulosic materials can be considered great raw materials for this operation because they are abundant, available, and inexpensive resources worldwide [11]. In addition, the use of waste lignocelluloses is a great solution to avoid the “food vs. fuel” conflict [12] and saves food sources, such as corn and wheat, from being consumed to produce fuel [13]. Despite first-generation biofuels which are produced from food crops, second-generation biofuels are obtained from nonfood and waste lignocellulosic materials such as forest waste and agricultural residues [14].
Lignocelluloses are complicated materials that are composed of lignin, hemicellulose, and cellulose [15]. With regard to their age, species, and storage condition, they have a different composition compared to each other [16]. Cellulose as the major constituent [17], making the scaffold of these compounds, is bounded by hemicellulose, and lignin covers them as a shield [18]. Lignin has a complicated structure that is made up of hydroxyl phenylpropanoid units [19,20]. It covers microfibers as glue, and its principal role is to enhance resistance against external stress, making these materials recalcitrant. This recalcitrant structure does not allow the structural sugars to digest easily [21]. Pretreatment as an initial process has been developed to break up this complex structure [18,22]. There are several physical, chemical, or biological techniques for pretreatment which decrease the degree of polymerization and increase accessible surface area for enzymes and microorganisms [23].
Autohydrolysis, as the most common pretreatment, is a simple, inexpensive, and nontoxic method which is also named the liquid hot water method [24,25]. Moreover, this method has other merits such as a short treatment time and low power consumption [26]. Chemical pretreatments are usually effective methods with high efficiency [27]; however, in recent years, several studies have examined the function of pretreatments with phosphoric acid, sulfuric acid, sodium hydroxide, and sodium carbonate. Obeng et al. [28] showed that pretreatment with 75% (v/v) phosphoric acid after a step of physical treatment improves the enzymatic hydrolysis yield of a durian peel from about 13% to 90%. They contended that this process decreases the hemicellulose content and increases accessible surface area to enzymes. Moreover, Syaichurrozi et al. [29] used diluted sulfuric acid in their study as a low-cost acid for pretreatment. They showed that this pretreatment reduces lignin content and increases the nonfiber carbohydrate. Because of the minimal reaction conditions and low-cost operation, alkaline pretreatments, particularly those using sodium hydroxide and sodium carbonate, have been reported to be extremely successful [30,31]. Penetration of sodium ions after alkaline pretreatment is the main cause of an increase in bioconversions of lignocelluloses [32]. For instance, Noori and Karimi [33] in a study examined the effects of pretreatment with 8 wt% sodium hydroxide at low, moderate, and hot temperatures on elmwood. They showed that pretreatment with 8 wt% sodium hydroxide remarkably modifies the structure of hardwoods and enhances the glucose yield in enzymatic hydrolysis. In addition, Molaverdi et al. [31] showed that 5-hour pretreatment with 0.5 M sodium carbonate solution slightly decreased the total crystallinity index (TCI) of rice straw from 1.55 to 1.18. They contended that a decrease in crystallinity leads to the improvement of glucose and ethanol production.
In this study, pinewood as a softwood, poplar wood as a hardwood, and rice straw as an agricultural residue were chosen to be analyzed. Pretreatment of these materials was conducted by liquid hot water, phosphoric acid, sulfuric acid, sodium hydroxide, and sodium carbonate. The final aim of pretreatment is to provide appropriate conditions to enzymes and microorganisms to produce more sugar and following that, more ethanol. Hence, enzymatic hydrolysis and fermentation analysis were used to examine the effects of pretreatments on lignocelluloses. Moreover, one of the salient parameters in the bioconversion of lignocelluloses is the accessible surface area [34] which was examined with water swelling capacity and BET techniques. In addition, to better understand the role of pretreatment in the structure of lignocelluloses, some other techniques such as FTIR, XRD, buffering capacity, as well as determination of biomass composition were performed.
This study examined the effects of alkaline and acidic pretreatments on the structural features of lignocellulosic materials. Afterward, it was shown that these structural features have an important relationship with ethanol production yield. Hence, in order to quantitatively examine this case, for the first time, three correlations for these substrates were presented which show the relationship between the ethanol yield and structural features index. These correlations can be very useful for future researchers in order to conduct quantitative examination in the ethanol production field.
2. Materials and Methods
2.1. Raw Materials and Enzymes
Poplar wood and pinewood, obtained from Isfahan University of Technology Forest (Isfahan, Iran, 32.7191° N, 51.5320° E), and rice straw, acquired from Lenjan fields (Isfahan, Iran, 32.4750° N, 51.3051° E), were used as substrates in this study. After debarking poplar wood and pinewood, they were cut and milled along with rice straw. All substrates were screened to achieve uniform size using 20 and 80 mesh (DG, Scientific products Co., Tehran, Iran). The substrates were well-protected from heat, moisture, or contamination until further use.
A 9:1 (volumetric proportion) blend of Cellic®, CTec, and Cellic HTec produced by Novozymes Denmark was employed to perform enzymatic hydrolysis and simultaneous saccharification and fermentation (SSF). The enzyme solution activity was measured 95 FPU mL−1, according to the method of Adney and Baker [35]. A culture collection of Saccharomyces cerevisiae (CCUG 53310), which was provided by the University of Gothenburg, was used for fermentation. The collection was propagated in a growth medium according to the method provided by Karimi et al. (2006).
2.2. Pretreatment Methods
Optimum pretreatment conditions were carefully chosen and recreated based on previous studies. All treated substrates were dehydrated at −80 °C for 24 h using a freeze dryer (Alpha 1-2 LDplus, Martin Christ, Osterode, Germany). Total solids of the untreated and dried-treated substrates were determined by the standard method presented by the National Renewable Energy Laboratory (NREL) [36].
2.2.1. Autohydrolysis
A quantity of 90 ± 0.01 g distilled water was added to 10 ± 0.01 g (on dry basis) of the substrate and mixed thoroughly for 15 min. A 500 mL high-pressure stainless-steel reactor was used to heat the mixture afterward. The mixture’s temperature was gradually increased to 180 °C and held for 30 min with a heating rate of 5 °C/min. The reactor was then cooled, and the solid fraction of the blend was recovered and neutralized by excess water immediately [24].
2.2.2. Dilute Sulfuric Acid
A biomass sample of 10 ± 0.01 g on dry basis was mixed thoroughly in 90 ± 0.01 g of 0.5% (w/w) sulfuric acid for 15 min. The same heating and neutralization steps as the autohydrolysis process were performed afterward [37].
2.2.3. Concentrated Phosphoric Acid
A quantity of 8 mL of 85% phosphoric acid was added to a 50 mL centrifuge tube containing 1 ± 0.01 g (on dry basis) of the substrate and mixed well for 5 min using a glass rod. Then, sealed tube was put into a 50 °C water bath for 30 min. Afterward, 20 mL of pre-cooled acetone was stirred into the solution to quench the ongoing reaction. The solution was centrifuged at 3400 rpm for 20 min (TL320, Selecta Lab, Tianjin, China), and the separated liquid phase was removed. Another 30 mL of pre-cooled acetone was added, mixed, centrifuged, and eventually removed two more times. The last washing step was applied three more times using distilled water instead of acetone to neutralize the biomass. However, an additional step of washing with excess distilled water was sometimes needed to enhance the neutralization [37].
2.2.4. Sodium Hydroxide
About 190 ± 0.01 g of 2 molar solution of NaOH was added to 10 ± 0.01 g (on dry basis) of the substrate, mixed thoroughly, and endured 3 straight hours of thermal treating and sporadic mixings. Pretreatment with sodium hydroxide was conducted in two different thermal conditions. The hot condition (100 °C) was created in the same reactor that was used for autohydrolysis with a heating rate of 3.5 °C/min, while the cold treatment (4 °C) was simply performed in an ice-water bath. The solid fraction of the blend was separated and washed with plenty of distilled water [33].
2.2.5. Sodium Carbonate
The procedure for sodium carbonate pretreatment was quite similar to the hot sodium hydroxide pretreatment process. A quantity of 190 ± 0.01 g of 0.5 M sodium carbonate was used to pretreat 10 ± 0.01 g (on dry basis) of the substrate at 100 °C for 3 h [38].
2.3. Enzymatic Hydrolysis
The treated and untreated substrates were subjected to enzymatic hydrolysis to investigate the effect of pretreatment on hydrolysis rate and yield. Following the Jeyhanipour et al. [39] method, the hydrolysis was performed at 45 °C and 130 rpm for 72 h in a citrate sodium buffer containing 50 g/L of substrate, 15 FPU of Cellulase/g substrate, and 0.8 g/L of sodium azide. To evaluate hydrolysis progress, seven samples were taken at 1st, 2nd, 3rd, 8th, 24th, 48th, and 72nd hour of the process. The samples were kept in an 80 °C water bath for 10 min, as conducted by Kootstra et al. [40], centrifuged at 900 rpm for 10 min to cease enzyme activity effectively, and finally stored at −18 °C until further use. This experiment was repeated once more to confirm data. An additional set of substrates underwent the same procedure, only without adding the enzyme. Samples of the latter set were taken at 24 h.
The amount of released glucose into the buffer was quantified by applying Miller’s method [41] on all samples. The glucose content of some samples was further examined by a high-pressure liquid chromatography (HPLC) equipped with a refractive index (RI) detector (using Bio-Rad Aminex HPX-87H column, 0.6 mL/min eluent of 5 mN sulfuric acid, at 60 °C) to double-check DNS results.
The initial rate of hydrolysis was calculated by drawing the best curve to fit data and finding the curve’s slope at zero point. Hydrolysis yield was measured using Equation (1) [33]:
where GH is glucose concentration in hydrolysate (g/L), MG is glucan content of biomass, 50 (g/L) is substrate concentration, and 1.111 is the conversion factor which was used to dehydrate glucan to glucose.
2.4. Fermentation
Simultaneous fermentation and hydrolysis were conducted under a procedure described by Karimi et al. [42]. A quantity of 1 ± 0.01 g of substrate on dry basis was added to an autoclaved container of 20 mL sodium-citrate-buffer (50 mM)-based media. The container held 5 g/L yeast extract, 7.5 g/L (NH4)2SO4, 3.5 g/L K2HPO4, 0.75 g/L MgSO4.7H2O, and 1 g/L CaCl2.2H2O, pH was adjusted to 5. A quantity of 15 FPU enzyme, and 0.02 g Saccharomyces cerevisiae per gram of dry substrate were added to the solution. SSF was performed under the anaerobic conditions at 37 °C and 130 rpm for 72 h. Accumulated gas was discharged regularly to prevent inhibition. Samples were taken after 24 and 72 h and analyzed by HPLC (An Aminex HPX-87H column, Bio-Rad, Hercules, CA, USA) equipped with a refractive index (RI) detector (Jasco International Co., Tokyo, Japan). The test was repeated four times to refine the results data. Ethanol yield was determined through Equation (2) [43].
where the denominator equals the maximum theoretical produced ethanol (g/L). Glycerol yield was calculated by Equation (3) [42].
2.5. Solids Characterization
2.5.1. Biomass Composition
Carbohydrate, lignin, and ash content of both the treated and untreated biomass were determined according to NREL chemical analysis and testing procedure [44]. Using a two-step technique provided by Sluiter et al. [45], extractives were derived out of untreated biomass beforehand to prevent any interference with the process. In addition, solid recovery was calculated based on Equation (4).
2.5.2. Accessible Surface Area
Nitrogen Adsorption (BET)
The specific surface area as an index for the accessible surface area was measured using Brunauer–Emmett–Teller (BET) test. All samples were milled (vibrating mill 60775S, Shimadzu, Kyoto, Japan) and vacuum-dried (25,829, Memmert, Schwabach, Germany) at 100 °C for 12 h before conducting a nitrogen adsorption test at 77 k through the use of a specific surface area by porosity analyzer (PHS-1020, PHS, Shanghai, China).
Water Retention Value (WRV)
Water retention value was obtained from two different methods. The first was determined by a centrifuge technique. Based on Cheng et al. [46], around 0.2 g (on dry basis) of untreated and treated substrates was soaked in distilled water for 2–3 days, transferred to special setups, and centrifuged at 1350 g for 20 min. The hand-made setup was basically a centrifuge tube containing a fixed perforated plastic cap in the middle of tube height and a removable Whatman filter paper (No. 42, GE healthcare, the U.S.) on top of the cap. Before the test, the weighed filter paper should be slightly wet to minimize errors. Following centrifugation, samples that still contained some water in their pores remained on the filter paper, and excess water shifted to the bottom of the tube. The sample and filter paper were weighed and put into 103 °C oven until their weights were fixed. Each test was repeated three times. Equation (5) was used to calculate WRV.
where Wwet is sample’s weight just after centrifugation, and Wdry is the weight of the oven-dried sample.
WRV = (Wwet − Wdry)/Wdry
The second method for determining WRV was nonwoven bags method. Following Hashemi et al.’s method [47], a quantity of 0.1 ± 0.001 g of each substrate (on dry basis) was placed in analogous weighed polyester bags and secured with plastic yarns. The bags were soaked in distilled water at room temperature for 1 h and carefully weighed afterward. Once more, WRV was obtained from Equation (5). To avoid any misjudgments, the test was repeated three times, and an empty bag was always being used as a blank.
2.5.3. Buffering Capacity
Noori and Karimi [33]’s method was applied to evaluate the pH resistance of substrates in an aqueous environment. About 1 ± 0.01 g of both untreated and treated materials was added to 80 mL of deionized water and swirled gently and continuously. Two hours later, pH was determined through the use of a pH meter (744 pH meter, Metrohm, Switzerland) as initial pH. Enough 0.1 N sodium hydroxide was added to acidic solutions at intervals and neutralized. Afterward, all solutions were titrated with 0.1 N hydrochloric acid to reach a pH of 4 gradually. Titratable alkalinity and titratable acidity are the volume of used NaOH and HCL for each sample in milliliters, respectively. Base buffering capacity and acid buffering capacity were estimated by Equations (6) and (7).
2.5.4. FTIR Spectra
FTIR analysis examined compositional and structural changes in samples after pretreatment [48] using a spectrometer (Rayleigh WQF-510 FTIR, BFRL, Beijing, China), equipped with DTGS detector. On average, 32 scans were obtained in the wavelength range of 400–4000 cm−1 with a resolution of 1 cm−1 for each of the spectra. The absorbance axis was normalized to 0 and 1, according to the highest peak in each spectrum. Common crystallinity indices, such as total crystallinity index (TCI = α1377/α2922), lateral order index (LOI = α1421/α893), and lignin to cellulose ratio (α1510/α900), were quantified according to the modified spectra [49].
2.5.5. X-ray Diffraction (XRD)
An X-ray diffractometer (Asenware AW/XDM 300, China) equipped with a Cu kα radiation source (λ = 0.154 nm) operating at 30 mA and 40 kV scanned and recorded the molecular structure of moisture-free samples. Scanning was conducted at 2θ = 5–55° with the step size of 0.05° and step of 1 s. After modifying the raw spectrum’s baseline, a six-point average trend line was applied to make the spectrum smooth. Crystallinity index (CrI) was calculated according to Equation (8) (Segal’s equation) as it is the most common method and provides better opportunities for comparison with other studies [49,50].
where I002 is peak intensity at 2θ ≈ 22.5°, and IAM is the lowest peak between 101 and 002 planes which appears at about 2θ ≈ 18° [50]. Scherrer equation was employed to determine the crystallite size of the samples.
where β is the width of the peak at half the maximum height in radians, k is the Scherrer constant factor (about 1), λ is the wavelength of the applied X-ray (= 0.154 nm), τ is the crystallite size plane, and θ is half the Bragg angle [51].
2.6. Statistical Analysis
Analysis of variance of the results was conducted by ANOVA test using SAS® 9.4 for WRV, enzymatic hydrolysis, and SSF. Tukey’s method with 95 percent confidence coefficient was carried out to determine the remarkable differences among the experimental results. Error bars show standard deviations (SD) from the means.
3. Results and Discussion
Softwood, hardwood, and agricultural residues are the three most common groups of lignocellulosic material. In this study, pinewood, poplar wood, and rice straw as representatives of these groups were subjected to autohydrolysis, dilute sulfuric acid, concentrated phosphoric acid, sodium hydroxide at low temperatures, and sodium carbonate at high-temperature pretreatments, and each of these pretreatments possesses its own condition and mechanism. In order to examine the structural changes in lignocellulosic materials after pretreatment, some analytical tests such as FTIR, XRD, and buffering capacity were performed. Accessible surface area as one of the most important parameters of lignocelluloses in enzymatic hydrolysis and fermentation was analyzed using the WRV technique and BET. Moreover, initial hydrolysis rate, enzymatic hydrolysis yield, as well as ethanol production yield were obtained from SSF and enzymatic hydrolysis experiments.
3.1. Effects of Pretreatment on the Composition of lignocelluloses
The total solid content of substrates was determined in order to investigate the effects of pretreatment on the composition of lignocelluloses. As mentioned before, pretreatments break the complex structure of lignocelluloses. The results of this experiment are summarized in Table 1. As shown in Table 1, the glucan content of all samples was increased, and hemicellulosic sugar (the sum of xylan, galactan, arabinan, and mannan) content of these was decreased after pretreatment. Pretreatment of rice straw with hot sodium hydroxide is a salient example of this change. The glucan content of rice straw increased from 41.76% to 71.25% after pretreatment with hot sodium hydroxide.
According to this table, the xylan content of poplar wood and rice straw samples was declined after pretreatment. In contrast, in the vast majority of samples of pinewood, xylan content was not considerably decreased and it was slightly increased after pretreatment with hot sodium hydroxide. This may indicate that softwood xylan is more resistant to hydrolysis. Softwood xylan is highly acetylated and has several side chains of methyl glucuronic acid, which makes xylan hydrolysis difficult [53]. It should be noted that the increase in xylan after pretreatment with hot sodium hydroxide was relative, and its mass amount did not increase. In fact, with the more severe elimination of mannan and arabinan during the pretreatment, the ratio of xylan to total solid increased. In addition, in all cases of rice straw, lignin content was reduced after pretreatment. On the contrary, in some wood samples, the lignin content was increased. For these cases, it means that pretreatment broke some parts of the cellulose and hemicellulose chain and removed them from the lignocellulose structure. Hence, despite lignin removal in the pretreatment process, the percentage of lignin content was increased. Moreover, as the most important result of pretreatment, the sum of lignin and hemicellulosic sugar percentage was decreased in all substrates after pretreatment.
In this research, crystallinity, as one of the crucial parameters in lignocelluloses affecting enzymatic hydrolysis and fermentation, was investigated using FTIR and XRD analyses. The results of the FTIR test are presented in Tables S2–S4. The wavenumbers of 898, 1111, 1160, 1425, 1455, 2900, and 3400 are bands that are related to cellulose I and cellulose II, and depending on the type of substrate they have a slight change in their positions. As shown in these tables, most of the band positions have no considerable change in adsorption, which means subtle parts of the structure have changed. Most of these slight changes corresponded to the removal of other parts of the sample. However, drastic change is obvious in poplar wood samples, which were pretreated with sulfuric acid, and rice straw and pinewood samples which were pretreated with phosphoric acid. It means that some parts of cellulose I and cellulose II were certainly eliminated in substrates after pretreatment with the mentioned acids. In most of the cases in rice straw, adsorption of bands at 1111 and 1455 were decreased or eliminated after alkaline pretreatment.
Amorphous cellulose and xylan were designated by positions at 898 and 1425, respectively. Adsorption of these positions was decreased just by pretreatment with sulfuric acid in all substrates. Previously, as shown in Table 1, xylan contents of the substrates were reduced after pretreatment with sulfuric acid. Hence, the results of the FTIR analysis confirm the xylan removal after pretreatment with sulfuric acid.
Positions 1267, 1510, and 1595 exclusively indicate the presence of lignin. The peak height in 1267 cm−1 in the raw poplar wood spectrum is 0.448, in the raw pinewood spectrum, it is 0.488, and in rice straw, it is not identified. Since this peak is related to guaiacyl lignin, and the relative amounts of guaiacyl lignin in softwood are the highest and lowest in agricultural wastes, these observations are justified. Adsorption of 1267 cm−1 after most different pretreatments in pinewood changed slightly (less than 10%), and only after the pretreatment with phosphoric acid its value increased by 12%. However, in poplar wood samples, adsorption at this band was decreased well, and even in pretreated poplar with phosphoric acid, no peaks were found. The peak absorption ratio of 1510 to 1595 in raw poplar wood was 0.97, in raw pinewood was 1.49, and in raw rice straw was 0.61, which indicated the predominance of syringyl lignin in poplar wood, guaiacyl lignin in pinewood, and relatively low amounts of guaiacyl lignin in rice straw. Colom et al. [54] examined Buxus sempervirens (as a softwood) and Populus tremula (as a hardwood) and stated that in softwoods the peak height in 1510 cm−1 was more than the peak height in 1595 cm−1 due to the predominance of guaiacyl lignin, having an equal value in hardwoods.
According to the FTIR spectra of samples—shown in Figures S1–S3 in Supplementary—TCI, LOI, and lignin to cellulose ratio α (1510/900) are calculated and presented in Table 2.
Generally, hardwoods and agricultural residues after pretreatment with acids had a maximum value of TCI and after pretreatment with alkalis had a minimum value. The reason for this is the dissolution of the hemicellulose and amorphous parts at low pH and the separation and dissolution of lignin at high pH. Motaung et al. [55] reported pretreated materials with acid to have higher crystallinity than the same pretreated materials with alkali. In addition, pretreated samples by the autohydrolysis process always had higher crystallinity than the pretreated samples with sulfuric acid because the power of sulfuric acid is higher than acetic acid which is produced in autohydrolysis in partial degradation of cellulose. Similarly, pretreatment with phosphoric acid reduced TCI in poplar wood more than pretreatment with sulfuric acid. Among alkaline pretreatments, sodium carbonate, which is a weaker base and its concentration was lower in pretreatment, had less effect on reducing the crystallinity. The amount of TCI in softwood was decreased by a similar amount after pretreatment, with the exception of phosphoric acid. The high power of phosphoric acid in dissolution further reduced the total crystallinity of pinewood.
TCI refers to the crystallinity of cellulose I and II of the sample, and LOI shows the crystallinity of cellulose I. After pretreatment with phosphoric acid and cold sodium hydroxide, LOI decreased, which indicates definitive dissolution of part of cellulose I in all samples. An increase in LOI after pretreatment with sulfuric acid states that more area of amorphous parts in lignocelluloses was dissolved than cellulose I.
The lignin to cellulose ratio in pretreated samples with dilute acid and autohydrolysis was clearly higher than pretreated samples with a base which indicates more successful removal of lignin in alkaline pretreatment. This is consistent with prior results in Table 1. A larger α (1508/898) after pretreatment with sulfuric acid than autohydrolysis in woods indicates two points. Firstly, as mentioned before, cellulose was dissolved slightly in the presence of sulfuric acid, and secondly, it confirms the phenomenon of condensation and displacement of lignin and replacement on the substrate surface, which is very common in intense acidic pretreatments. The ratio α (1508/898) in woods after pretreatment with phosphoric acid and cold sodium hydroxide and in rice straw after pretreatment with sodium carbonate and hot sodium hydroxide had the lowest value.
The crystallinity index was obtained by the X-ray diffraction method describing the crystallinity of total biomass. The crystallinity indices obtained from the Fourier transform infrared spectroscopy deals only with the crystallization of cellulose, and the presence of hemicellulose and lignin in the lignocellulosic material will cause an error in measuring this crystallinity [49]. Therefore, the crystallinity index obtained by the XRD method is generally more reliable, but it is not possible to track the details of structural changes as is possible in the FTIR test.
The crystallinity index (CrI) was determined according to Segal’s method [56]. Cellulose I, cellulose II, amorphous cellulose, lignin, as well as hemicellulose affect crystallinity [50]. As summarized in Table 2, after phosphoric acid, cold sodium hydroxide has a good performance in reducing crystallinity (CrI) due to its high ability to dissolve lignocellulosic substances, just like phosphoric acid. In fact, in the field of crystallization reduction, the dissolution mechanism seems to be superior to the destructive mechanism. Only in the case of rice straw, the pretreatment with sodium carbonate was able to change the structure of substrate well and reduce its crystallinity as much as the pretreated sample with cold sodium hydroxide and even a little more. It is possible that the destructive power of sodium carbonate, due to the ability of its anion to penetrate along with the sodium ion into the structure of rice straw, has doubled and has made this pretreatment superior to the others. The relative increase in crystallinity after some pretreatments, such as sulfuric acid, autohydrolysis, and hot sodium hydroxide, is due to the removal of the amorphous area and remaining of their crystalline part in the solid fraction.
Scherrer relationship (Equation (9)) was used to calculate the crystal size. The size of the crystallites generally increases after pretreatments due to the removal of amorphous parts of the sample. The increase in crystallite size of softwood from 5.02 to 6.52 nm, hardwood from 5.09 to 5.58 nm, and cotton liner from 7.24 to 7.59 nm after 4 h of hydrolysis with cellulase was previously reported by Chao and Tan [57]. In this study, only phosphoric acid was able to reduce the crystallite size by 40 to 50%, which again indicates the ability of phosphoric acid to dissolve solid cellulose crystals.
3.2. Accessible Surface Area
The accessible surface area as an efficacious parameter affecting enzymatic hydrolysis was measured using a BET test and WRV method. According to Figure 1, the specific surface area (BET test results) increased after pretreatment in all poplar wood and rice straw cases, with the exception of pretreatment of rice straw with phosphoric acid.
Although pretreatment of poplar wood with phosphoric acid increased specific surface area, it was not remarkable. It is possible that the high power of phosphoric acid resulted in the dissolution of some parts of the amorphous area and the relocation of other components in this process. The FTIR and XRD results justified this reason. On the contrary, in pinewood, the specific surface area was decreased after pretreatment. As shown in Table S5, the percentage of lignin and hemicellulose removal in pinewood samples was lower than other substrates, and also lignin and hemicellulose have a great impact on the accessible surface area. Therefore, it can be a good justification for the decrease in specific surface area in pinewood.
Results of the BET test are strongly dependent on adsorption time, vacuum time, vacuum level, sample preparation, type of sample, and its characteristics. Therefore, a wide range of specific surface area for each substrate has been reported in the literature [58].
According to the results of the WRV method (using centrifuge) in Figure 2, the maximum increase in WRV was related to pretreated samples with phosphoric acid and cold sodium hydroxide, respectively.
Both of these pretreatments were foremost in the reduction in crystallinity. This is probably due to the high ability of these pretreatments in the dissolution of lignocellulosic materials, specifically part of the cellulose crystalline region. As a result, the change in the crystal structure of cellulose after pretreatment was one of the effective parameters for increasing the swelling capacity of substrates in this study. Following, pretreatment with sodium carbonate on poplar wood and rice straw increased the swelling capacity and even performed better than hot sodium hydroxide. Such superiority was also observed in increasing the specific surface area in the BET test. The larger anion of sodium carbonate intensified the destruction of the lignocellulose structure more than hot sodium hydroxide. On the other hand, the performance of hot sodium hydroxide was better than sodium carbonate in pinewood, which can be justified by considering the very strong structure of softwoods, their different lignin type, and the impossibility of large anions penetrating into them. In this case, the higher concentration and ionic strength of sodium hydroxide were the reasons for the superiority of this solvent over sodium carbonate. In general, Na+ ions are so small that they can penetrate and move into the smallest cavities in cellulose. Therefore, pretreatment with sodium hydroxide and sodium carbonate enhances the ionic properties of the pretreated samples and increases the water swelling capacity. Moreover, rice straw had the highest WRV, and pinewood had the lowest value among the substrates. Differences in the type and amount of lignin, internal structure, and bonds in these materials are the reasons for this difference.
In contrast, the results of the experiment using nonwoven bags do not show a justifiable trend. In addition, the standard deviation values were higher in this method, which means that the repeatability of this method was lower (Figure S4). The WRV experiment using polymer bags seems to have low accuracy for the following reasons: presence of droplets trapped between the cloth bag and the sample, high dependence of the results on exact weighing time, passage of a number of solid particles through fabric cavities into the water bath, surface evaporation, and continuous change in sample weight.
3.3. Buffering Capacity
In order to investigate the effect of resistance of pretreated samples against pH changes, a buffering capacity test was performed on all pretreated and untreated samples, and its results are summarized in Table 3. The initial pH of untreated poplar, pine, and rice straw was 4.78, 5.40, and 6.24 in the acidic pH range, respectively. Hence, it was first necessary to increase the pH to 7 by adding 0.1 N sodium hydroxide solution. Titratable alkalinity in untreated poplar, pine, and rice straw was 0.85, 0.20 and 0.05 mL, respectively, and titratable acidity to reduce the pH from 7 to 4 for these samples was 0.65, 0.6 and 0.9.
According to Table 3, the base buffering capacity of untreated rice straw was less than untreated pine, and untreated pine was less than untreated poplar. The acidic buffering capacities of pine and poplar were close to each other and less than rice straw. Generally, the acidic buffering capacity in pretreated samples with alkali was more than with acid. Base buffering capacity after all types of alkaline pretreatment was zero, and after other pretreatments, it was the opposite. Still, no specific trend was observed in them. Among the alkaline pretreated poplar wood and rice straw, sodium carbonate had the highest and cold sodium hydroxide had the lowest increase in acid buffering capacity value. In the alkaline pretreated pinewood, hot sodium hydroxide had the highest and cold sodium hydroxide had the lowest acid buffering capacity.
As seen in FTIR results, several pretreatments reduce acetylation groups and, consequently, increase free hydroxyl at the surface of the substrate. Increasing free hydroxyl means an increase in hydrophilicity and acid buffering capacity. Since the optimum pH of hydrolysis is in the acidic range, a sample with a higher buffering acid capacity can better control and stabilize pH of the hydrolysis medium.
3.4. Enzymatic Hydrolysis
The effects of several pretreatments on enzymatic hydrolysis of lignocelluloses were examined using a commercial enzyme. As shown in Figures S5–S7, all pretreated samples significantly produced more glucose after pretreatment. The concentration of sugar in the solution increases over time, but this increase does not have a constant rate and grows more rapidly in the early hours. This result supports a well-known theory that during enzymatic hydrolysis, first amorphous parts and then more crystalline regions are decomposed by enzymes. Due to the difference in the hydrogen bonding network between amorphous cellulose and crystalline cellulose, the rate of hydrolysis of amorphous cellulose is 3–30 times more than crystalline cellulose [59]. The inactivation of enzymes and an increase in lignin concentration during hydrolysis are also factors that reduce the rate of hydrolysis. Hence, the initial hydrolysis rate was calculated, and its results are shown in Figure 3. According to this diagram, the highest initial hydrolysis rate was related to pretreatment with phosphoric acid. Because of the high acidic power of this solvent, amorphous parts of the substrates were immediately depolymerized, and as a result, the initial hydrolysis rate of pretreated samples with phosphoric acid was dramatically increased, as compared to the other types.
The total amount of sugar produced for untreated poplar wood, pinewood, and rice straw was 8.1, 6.2 and 13.1 g/L, respectively. Similarly, the same trend in sugar release was seen for pretreated samples. In other words, under the same pretreatment conditions and different substrates, the highest amount of sugar was related to rice straw, poplar wood, and pinewood, respectively. Rice straw was more susceptible to pretreatment due to its weaker structure and more limited lignin content than wooden substrates. In contrast, pinewood clearly produced less sugar than other substrates. First, according to the previous results in Table 1, pine samples contain more lignin, generally. Lignin acts as a physical barrier for cellulase and prevents enzymes from returning to the bulk solution. Second, xylan in softwoods, such as pine, is less digestible for enzymes due to its higher content of methyl glucuronic acid side chains.
Pretreatment of pine and poplar wood with phosphoric acid produced the highest amount of sugar among other pretreatments. In the case of rice straw, probably due to its more fragile structure, it dissolved a large amount of its sugar during pretreatment with concentrated acid in the liquid fraction of pretreatment. Therefore, alkaline pretreatment is more useful for releasing more sugar in rice straw.
Pretreatment of all three substrates with sodium hydroxide resulted in more sugar production than pretreatment with sulfuric acid. This can be due to the condensation of lignin on the substrate surface after acidic pretreatment at high temperatures and a decrease in enzyme performance. In addition, alkaline pretreatment removes acetyl groups on hemicelluloses which reduces enzyme accessibility and partially depolymerizes cellulose.
As shown in Figure 4, the enzymatic hydrolysis yield of all substrates after pretreatment substantially increased. The hydrolysis yield of phosphoric acid pretreatment was the highest, and the hydrolysis yield of autohydrolysis was the lowest. Generally, among the substrates and in the same pretreatment condition, rice straw showed the best performance in enzymatic hydrolysis, and pinewood had the lowest hydrolysis yield. The enzymatic hydrolysis yield of pretreated samples with sodium hydroxide (both high and low temperatures) was higher than pretreated samples with sodium carbonate, which was previously reported by Taherzadeh and Karimi [60].
3.5. Simultaneous Enzymatic Hydrolysis and Fermentation
To investigate the effect of pretreatment of lignocelluloses on ethanol production, SSF was conducted using Saccharomyces cerevisiae and mixed enzyme solution for 72 h at 37 °C. The main advantage of SSF over separate fermentation and hydrolysis is the remarkable reduction in glucose and cellobiose inhibition due to their immediate consumption by microorganisms, and the main challenge in this approach is the operating temperature of the process, which is inevitably far from the optimum temperature of hydrolysis and fermentation.
According to Table 4, the ethanol yield of untreated woods was about 30% lower than untreated rice straw. Similarly, rice straw still had the highest yield after pretreatment. All pretreated rice straw samples had an acceptable and similar performance—an approximate increase of 60% in ethanol yield compared to the untreated sample. Poplar wood was more affected by pretreatment compared to the other substrates.
As seen in Table 4, pretreatment with phosphoric acid was very useful for wooden substrates and considerably increased ethanol production yield above 80%. After that, pretreatment with hot sodium hydroxide had the best performance in ethanol yield. In rice straw samples, pretreatment with hot sodium hydroxide showed a higher ethanol yield than pretreatment with phosphoric acid. Such an order was seen in glucose production (enzymatic hydrolysis section, Figure S7) for rice straw. Moreover, glycerol was the main byproduct in the SSF method, for which yield was calculated using Equation (3), and its results are presented in Table 4.
3.6. Ethanol Production Balance Based on Recovery
For all samples, the overall mass balance is summarized in Table 4. The results show that ethanol and glucose production was increased after pretreatment, specifically with phosphoric acid and cold sodium hydroxide. Maximum ethanol was produced by those samples which were treated with phosphoric acid in all wooden substrates. Moreover, maximum released glucose corresponded to the pretreated woods with phosphoric acid and pretreated rice straw with cold sodium hydroxide. For instance, ethanol production was increased from 115.52 g/kg rice straw to 206.24 g/kg rice straw after pretreatment of rice straw with phosphoric acid.
3.7. Prediction of Ethanol Production Yield Using Structural Features of Biomass
As mentioned before, structural features of lignocellulosic materials affect ethanol production, and pretreatment can bring about positive changes in their properties. Hence, in this study, the effects of pretreatment on lignocelluloses were examined by a number of analytical tests. As shown in Figure 5, there is a linear relationship between ethanol production yield and the structural features index. The correlation between them in poplar wood is presented as Equation (10).
In which EPY = ethanol production yield (%), and S = structural features index of lignocellulosic material which is defined below.
where IGlu = glucan index, IBET = specific surface area index, IWRV = water retention value index, IEn = enzymatic hydrolysis index, IR = lignin and hemicellulose removal, and ICr = XRD index.
All these indices were defined in the same way, with the exception of ICr:
and ICr defined as follows:
Similarly, as shown in Figure 6 and Figure 7, relationships between ethanol production yield and structural features index for pinewood and rice straw were obtained based on their diagrams. Equations (14) and (15) present ethanol yield for pinewood and rice straw, respectively.
Based on these correlations, and using the measurement of structural features of a number of untreated and pretreated samples of lignocellulosic materials, ethanol yield can be predicted.
4. Conclusions
For lignocellulosic biomass, structural properties play consequential roles in the bioconversion of these materials. Hence, in this review, several examinations on lignocelluloses were conducted, and as a result, lignin removal, accessible surface area, and crystallinity were presented as the most important structural features in ethanol production. Pretreatments led to improvements in these structural properties, specifically with phosphoric acid and sodium hydroxide. NREL results showed that the amount of glucan after pretreatment depends on the type of wood and the type of pretreatment. Moreover, hardwood, softwood, and rice straw had different reactions to the same pretreatment.
Accessible surface area as a key feature in the structure of lignocellulosic materials was measured by three different methods, among which the centrifuge method had the most reliable results compared to the BET and nonwoven bag methods.
The ethanol production yield of pretreated rice straw samples, specifically with phosphoric acid, was considerably more compared to the pretreated hardwood and softwood. Phosphoric acid as a powerful solvent destroyed the complicated structure of all substrates and resulted in a remarkable reduction in crystallinity. On the other hand, due to its high power, some parts of the amorphous area were dissolved in this solvent during the pretreatment process, and it also led to the relocation of some parts of the lignin content on the surface of the substrates. All in all, a decrease in crystallinity and destruction of the complex structure were more affected on lignocellulosic materials in the ethanol production yield. As shown, TCI results were the most consistent with the ethanol production yield results trend.
Pretreatment with phosphoric acid is introduced as an efficacious process to improve the structural features of lignocelluloses and enhance ethanol production yield. Finally, all of the structural features affect ethanol production, and for the first time, their influence on ethanol yield was presented as three correlations for poplar wood, pinewood, and rice straw. These equations can be a starting point for future researchers in order to establish a quantitative relationship between the structure of lignocellulosic materials and ethanol production. By finding such correlations, quantitative relationships can be obtained for these materials. From then on, the calculations of ethanol production or fermentation can be performed theoretically, just like what can be seen in heat and mass transfer equations, and there is less of a need for experimental tests.
Supplementary Materials
The following supporting information can be downloaded at: https://www.mdpi.com/article/10.3390/designs6060119/s1, Figure S1: FTIR spectra obtained from scanning untreated and pretreated poplar wood, Figure S2: FTIR spectra obtained from scanning untreated and pretreated pinewood, Figure S3: FTIR spectra obtained from scanning untreated and pretreated rice straw, Figure S4: Water retention value of untreated and pretreated substrates using nonwoven bags, Figure S5: Glucose concentration during enzymatic hydrolysis of untreated and pretreated poplar wood, Figure S6: Glucose concentration during enzymatic hydrolysis of untreated and pretreated pinewood, Figure S7: Glucose concentration during enzymatic hydrolysis of untreated and pretreated rice straw, Table S1: Total solids, volatile solids, and pretreatment recovery percentages of substrates, Table S2: Relative change in adsorption at different wavenumbers after pretreating poplar wood, Table S3: Relative change in adsorption at different wavenumbers after pretreating pinewood, Table S4: Relative change in adsorption at different wavenumbers after pretreating rice straw, Table S5: The percentage of glucan, hemicellulose, and lignin content of poplar wood, pinewood, and rice straw.
Author Contributions
Conceptualization, methodology, software, validation, writing—original draft preparation: M.S.B.; formal analysis, investigation, writing—review and editing: F.E.; supervision, writing—review and editing: K.K. All authors have read and agreed to the published version of the manuscript.
Funding
This research received no external funding.
Institutional Review Board Statement
Not applicable.
Informed Consent Statement
Not applicable.
Data Availability Statement
Not applicable.
Conflicts of Interest
The authors declare no conflict of interest.
Nomenclature
BET theory: Brunauer–Emmett–Teller theory; FPU: Filter per Unit; RI: Refractive Index; SSF: Simultaneous Saccharification and Fermentation; CrI: Crystallinity Index; TCI: Total Crystallinity Index; LOI: Lateral Order Index; WRV: Water Retention Value; XRD: X-ray Diffraction; SD: Standard Deviations; ASL: Acid Soluble Lignin; AIL: Acid Insoluble Lignin; ND: Not Detected.
References
- Okolie, J.A.; Mukherjee, A.; Nanda, S.; Dalai, A.K.; Kozinski, J.A. Next-generation biofuels and platform biochemicals from lignocellulosic biomass. Int. J. Energy Res. 2021, 45, 14145–14169. [Google Scholar] [CrossRef]
- Sutrisno, J.; Dharma, S.; Silitonga, A.; Shamsuddin, A.; Sebayang, A. Experimental assessment of the performance and exhaust emissions characteristic of a diesel with Jatropa curcas-Ceiba pentandra mixture biodiesel/bioethanol blends. J. Mech. Eng. Res. Dev. 2020, 43, 396–412. [Google Scholar]
- Kim, E.J.; Kim, S.; Choi, H.-G.; Han, S.J. Co-production of biodiesel and bioethanol using psychrophilic microalga Chlamydomonas sp. KNM0029C isolated from Arctic sea ice. Biotechnol. Biofuels 2020, 13, 20. [Google Scholar] [CrossRef]
- Khorasani, R.; Khodaparasti, M.S.; Tavakoli, O. Hydrogen production from dairy wastewater using catalytic supercritical water gasification: Mechanism and reaction pathway. Int. J. Hydrog. Energy 2021, 46, 22368–22384. [Google Scholar] [CrossRef]
- Ravindra, K.; Kaur-Sidhu, M.; Mor, S.; Chakma, J.; Pillarisetti, A. Impact of the COVID-19 pandemic on clean fuel programmes in India and ensuring sustainability for household energy needs. Environ. Int. 2021, 147, 106335. [Google Scholar] [CrossRef] [PubMed]
- Yusoff, M.N.A.M.; Zulkifli, N.W.M.; Sukiman, N.L.; Chyuan, O.H.; Hassan, M.H.; Hasnul, M.H.; Zulkifli, M.S.A.; Abbas, M.M.; Zakaria, M.Z. Sustainability of palm biodiesel in transportation: A review on biofuel standard, policy and international collaboration between Malaysia and Colombia. Bioenerg Res. 2021, 14, 43–60. [Google Scholar] [CrossRef]
- Wolfaardt, F.J.; Fernandes, L.G.L.; Oliveira, S.K.C.; Duret, X.; Görgens, J.F.; Lavoie, J.-M. Recovery approaches for sulfuric acid from the concentrated acid hydrolysis of lignocellulosic feedstocks: A mini-review. Energy Convers. Manag. X 2021, 10, 100074. [Google Scholar] [CrossRef]
- Hirani, A.H.; Javed, N.; Asif, M.; Basu, S.K.; Kumar, A. A review on first- and second-generation biofuel productions. In Biofuels: Greenhouse Gas Mitigation and Global Warming; Kumar, A., Ogita, S., Yau, Y.-Y., Eds.; Springer: New Delhi, India, 2018; pp. 141–154. [Google Scholar] [CrossRef]
- Chacón-Navarrete, H.; Martín, C.; Moreno-García, J. Yeast immobilization systems for second-generation ethanol production: Actual trends and future perspectives. Biofuel Bioprod. Biorefin 2021, 15, 1549–1565. [Google Scholar] [CrossRef]
- Hou, J.; Zhang, X.; Liu, S.; Zhang, S.; Zhang, Q. A critical review on bioethanol and biochar production from lignocellulosic biomass and their combined application in generation of high-value byproducts. Energy Technol. 2020, 8, 2000025. [Google Scholar] [CrossRef]
- Sandesh, K.; Ujwal, P. Trends and perspectives of liquid biofuel-process and industrial viability. Energy Convers. Manag. X 2021, 10, 100075. [Google Scholar] [CrossRef]
- Kumar, N.; Muley, P.D.; Boldor, D.; Coty, I.V.G.G.; Lynam, J.G. Pretreatment of waste biomass in deep eutectic solvents: Conductive heating versus microwave heating. Ind. Crops Prod. 2019, 142, 111865. [Google Scholar] [CrossRef]
- Selvakumari, I.A.; Jayamuthunagai, J.; Senthilkumar, K.; Bharathiraja, B. Biofuels production from diverse bioresources: Global scenario and future challenges. In Biofuels Production–Sustainability and Advances in Microbial Bioresources; Yadav, A.N., Rastegari, A.A., Yadav, N., Gaur, R., Eds.; Springer: Berlin/Heidelberg, Germany, 2020; pp. 163–184. [Google Scholar]
- Fu, C.; Li, Z.; Jia, C.; Zhang, W.; Zhang, Y.; Yi, C.; Xie, S. Recent advances on bio-based isobutanol separation. Energy Convers. Manag. X 2020, 10, 100059. [Google Scholar] [CrossRef]
- Ou, L.; Dou, C.; Yu, J.H.; Kim, H.; Park, Y.C.; Park, S.; Kelley, S.; Lee, E.Y. Techno-economic analysis of sugar production from lignocellulosic biomass with utilization of hemicellulose and lignin for high-value co-products. Biofuel Bioprod. Biorefin 2021, 15, 404–415. [Google Scholar] [CrossRef]
- Krutul, D.; Antczak, A.; Radomski, A.; Drożdżek, M.; Kłosińska, T.; Zawadzki, J. The chemical composition of poplar wood in relation to the species and age of trees. For. Wood Technol. 2019, 107, 131–138. [Google Scholar]
- Amarasekara, A.S.; Wiredu, B.; Grady, T.L.; Obregon, R.G.; Margetić, D. Solid acid catalyzed aldol dimerization of levulinic acid for the preparation of C10 renewable fuel and chemical feedstocks. Catal. Commun. 2019, 124, 6–11. [Google Scholar] [CrossRef]
- Shi, F.; Wang, Y.; Davaritouchaee, M.; Yao, Y.; Kang, K. Directional structure modification of poplar biomass-inspired high efficacy of enzymatic hydrolysis by sequential dilute acid–alkali treatment. ACS Omega 2020, 5, 24780–24789. [Google Scholar] [CrossRef]
- Nevita, T.; Sharma, G.; Pandey, P. Differences in rice rhizosphere bacterial community structure by application of lignocellulolytic plant-probiotic bacteria with rapid composting traits. Ecol. Eng. 2018, 120, 209–221. [Google Scholar] [CrossRef]
- Davaritouchaee, M.; Chen, S.; Mancini, R.J. Delignification and enzyme-diffusion kinetics of radical systems treating wheat straw. Ind. Eng. Chem. Res. 2020, 59, 20656–20666. [Google Scholar] [CrossRef]
- Li, M.; Pu, Y.; Ragauskas, A.J. Current understanding of the correlation of lignin structure with biomass recalcitrance. Front. Chem. 2016, 4, 45. [Google Scholar] [CrossRef] [Green Version]
- Martín, C. Pretreatment of crop residues for bioconversion. Agronomy 2021, 11, 924. [Google Scholar] [CrossRef]
- Kumar, B.; Bhardwaj, N.; Agrawal, K.; Chaturvedi, V.; Verma, P. Current perspective on pretreatment technologies using lignocellulosic biomass: An emerging biorefinery concept. Fuel Process. Technol. 2020, 199, 106244. [Google Scholar] [CrossRef]
- Amiri, H.; Karimi, K. Autohydrolysis: A promising pretreatment for the improvement of acetone, butanol, and ethanol production from woody materials. Chem. Eng. Sci. 2015, 137, 722–729. [Google Scholar] [CrossRef]
- Chen, H. Lignocellulose biorefinery engineering: An overview. In Lignocellulose Biorefinery Engineering; Chen, H., Ed.; Woodhead Publishing: Cambridge, UK, 2015; pp. 1–17. [Google Scholar]
- Domínguez, E.; Nóvoa, T.; Pablo, G.; Garrote, G.; Romaní, A. Sequential two-stage autohydrolysis biorefinery for the production of bioethanol from fast-growing Paulownia biomass. Energy Convers. Manag. 2020, 226, 113517. [Google Scholar] [CrossRef]
- Conde-Mejia, C.; Jimenez-Gutierrez, A.; El-Halwagi, M. A comparison of pretreatment methods for bioethanol production from lignocellulosic materials. Process Saf. Environ. Prot. 2012, 90, 189–202. [Google Scholar] [CrossRef]
- Obeng, A.K.; Premjet, D.; Premjet, S. Fermentable sugar production from the peels of two durian (Durio zibethinus Murr.) cultivars by phosphoric acid pretreatment. Resources 2018, 7, 60. [Google Scholar] [CrossRef] [Green Version]
- Syaichurrozi, I.; Villta, P.K.; Nabilah, N.; Rusdi, R. Effect of sulfuric acid pretreatment on biogas production from Salvinia molesta. J. Environ. Chem. Eng. 2019, 7, 102857. [Google Scholar] [CrossRef]
- Sarbishei, S.; Goshadrou, A.; Hatamipour, M.S. Mild sodium hydroxide pretreatment of tobacco product waste to enable efficient bioethanol production by separate hydrolysis and fermentation. Biomass Convers. Biorefin 2020, 11, 2963–2973. [Google Scholar] [CrossRef]
- Molaverdi, M.; Karimi, K.; Mirmohamadsadeghi, S. Improvement of dry simultaneous saccharification and fermentation of rice straw to high concentration ethanol by sodium carbonate pretreatment. Energy 2019, 167, 654–660. [Google Scholar] [CrossRef]
- Deshpande, M.; Scheicher, R.H.; Ahuja, R.; Pandey, R. Binding strength of sodium ions in cellulose for different water contents. J. Phys. Chem. B 2008, 112, 8985–8989. [Google Scholar] [CrossRef]
- Noori, M.S.; Karimi, K. Detailed study of efficient ethanol production from elmwood by alkali pretreatment. Biochem. Eng. J. 2016, 105, 197–204. [Google Scholar] [CrossRef]
- Shi, S.; Guan, W.; Blersch, D.; Li, J. Improving the enzymatic digestibility of alkaline-pretreated lignocellulosic biomass using polyDADMAC. Ind. Crops Prod. 2021, 162, 113244. [Google Scholar] [CrossRef]
- Adney, B.; Baker, J. Measurement of Cellulase Activities; NREL/TP-510-42628; National Renewable Energy Laboratory: Golden, CO, USA, 2008. [Google Scholar]
- Sluiter, A.; Hames, B.; Hyman, D.; Payne, C.; Ruiz, R.; Scarlata, C.; Sluiter, J.; Templeton, D.; Wolfe, J. Determination of Total Solids in Biomass and Total Dissolved Solids in Liquid Process Samples; NREL/TP-510-42619; National Renewable Energy Laboratory: Golden, CO, USA, 2008; Volume 9, pp. 1–6. [Google Scholar]
- Zhang, Y.H.P.; Ding, S.Y.; Mielenz, J.R.; Cui, J.B.; Elander, R.T.; Laser, M.; Himmel, M.E.; McMillan, J.R.; Lynd, L.R. Fractionating recalcitrant lignocellulose at modest reaction conditions. Biotechnol Bioeng 2007, 97, 214–223. [Google Scholar] [CrossRef] [PubMed]
- Khaleghian, H.; Karimi, K.; Behzad, T. Ethanol production from rice straw by sodium carbonate pretreatment and Mucor hiemalis fermentation. Ind. Crops Prod. 2015, 76, 1079–1085. [Google Scholar] [CrossRef]
- Jeihanipour, A.; Karimi, K.; Niklasson, C.; Taherzadeh, M.J. A novel process for ethanol or biogas production from cellulose in blended-fibers waste textiles. Waste Manag. 2010, 30, 2504–2509. [Google Scholar] [CrossRef] [PubMed]
- Kootstra, A.M.J.; Beeftink, H.H.; Scott, E.L.; Sanders, J.P. Comparison of dilute mineral and organic acid pretreatment for enzymatic hydrolysis of wheat straw. Biochem. Eng. J. 2009, 46, 126–131. [Google Scholar] [CrossRef]
- Miller, G.L. Use of dinitrosalicylic acid reagent for determination of reducing sugar. Ana. Chem. 1959, 31, 426–428. [Google Scholar] [CrossRef]
- Karimi, K.; Emtiazi, G.; Taherzadeh, M.J. Ethanol production from dilute-acid pretreated rice straw by simultaneous saccharification and fermentation with Mucor indicus, Rhizopus oryzae, and Saccharomyces cerevisiae. Enzym. Microb. Technol. 2006, 40, 138–144. [Google Scholar] [CrossRef]
- Hashemi, S.S.; Mirmohamadsadeghi, S.; Karimi, K. Biorefinery development based on whole safflower plant. Renew. Energy 2020, 152, 399–408. [Google Scholar] [CrossRef]
- Sluiter, A.; Hames, B.; Ruiz, R.; Scarlata, C.; Sluiter, J.; Templeton, D.; Crocker, D.L.A.P. Determination of Structural Carbohydrates and Lignin in Biomass; NREL/TP-510-42618; National Renewable Energy Laboratory: Golden, CO, USA, 2012. [Google Scholar]
- Sluiter, A.; Ruiz, R.; Scarlata, C.; Sluiter, J.; Templeton, D. Determination of Extractives in Biomass; NREL/TP-510-42619; National Renewable Energy Laboratory: Golden, CO, USA, 2008. [Google Scholar]
- Cheng, Q.; Wang, J.; McNeel, J.; Jacobson, P. Water retention value measurements of cellulosic materials using a centrifuge technique. BioResources 2010, 5, 1945–1954. [Google Scholar]
- Hashemi, S.S.; Karimi, K.; Nosratpour, M.J.; Sárvári Horváth, I. Efficient biogas and ethanol production from safflower straw using sodium carbonate pretreatment. Energ Fuel 2016, 30, 10592–10601. [Google Scholar] [CrossRef]
- Kumar, N.; Gautam, R.; Stallings, J.D.; Coty, G.G.; Lynam, J.G. Secondary agriculture residues pretreatment using deep eutectic solvents. Waste Biomass Valorization 2021, 12, 2259–2269. [Google Scholar] [CrossRef]
- Shafiei, M.; Karimi, K.; Zilouei, H.; Taherzadeh, M.J. Enhanced ethanol and biogas production from pinewood by NMMO pretreatment and detailed biomass analysis. Biomed. Res. Int. 2014, 2014, 469378. [Google Scholar] [CrossRef]
- Park, S.; Baker, J.O.; Himmel, M.E.; Parilla, P.A.; Johnson, D.K. Cellulose crystallinity index: Measurement techniques and their impact on interpreting cellulase performance. Biotechnol. Biofuels 2010, 3, 10. [Google Scholar] [CrossRef] [Green Version]
- Garvey, C.J.; Parker, I.H.; Simon, G.P. On the interpretation of X-ray diffraction powder patterns in terms of the nanostructure of cellulose I fibres. Macromol. Chem. Phys. 2005, 206, 1568–1575. [Google Scholar] [CrossRef]
- He, J.; Cui, S.; Wang, S.Y. Preparation and crystalline analysis of high-grade bamboo dissolving pulp for cellulose acetate. J. Appl. Polym. Sci. 2008, 107, 1029–1038. [Google Scholar] [CrossRef]
- Alvira, P.; Ballesteros, M.; Negro, M.J. Progress on enzymatic saccharification technologies for biofuels production. Biofuel Technol. 2013, 145–169. [Google Scholar] [CrossRef]
- Colom, X.; Carrillo, F.; Nogués, F.; Garriga, P. Structural analysis of photodegraded wood by means of FTIR spectroscopy. Polym. Degrad. Stab. 2003, 80, 543–549. [Google Scholar] [CrossRef]
- Motaung, T.; Anandjiwala, R. Effect of alkali and acid treatment on thermal degradation kinetics of sugar cane bagasse. Ind. Crops Prod. 2015, 74, 472–477. [Google Scholar] [CrossRef]
- Segal, L.; Creely, J.J.; Martin Jr, A.; Conrad, C. An empirical method for estimating the degree of crystallinity of native cellulose using the X-ray diffractometer. Text. Res. J. 1959, 29, 786–794. [Google Scholar] [CrossRef]
- Cao, Y.; Tan, H. Study on crystal structures of enzyme-hydrolyzed cellulosic materials by X-ray diffraction. Enzym. Microb. Technol. 2005, 36, 314–317. [Google Scholar] [CrossRef]
- Zhang, Y.H.P.; Lynd, L.R. Toward an aggregated understanding of enzymatic hydrolysis of cellulose: Noncomplexed cellulase systems. Biotechnol. Bioeng. 2004, 88, 797–824. [Google Scholar] [CrossRef] [PubMed]
- Zhao, X.; Zhang, L.; Liu, D. Biomass recalcitrance. Part I: The chemical compositions and physical structures affecting the enzymatic hydrolysis of lignocellulose. Biofuel Bioprod. Bior. 2012, 6, 465–482. [Google Scholar] [CrossRef]
- Taherzadeh, M.J.; Karimi, K. Pretreatment of lignocellulosic wastes to improve ethanol and biogas production: A review. Int. J. Mol. Sci. 2008, 9, 1621–1651. [Google Scholar] [CrossRef] [PubMed]
Figure 1.
Specific surface area of untreated and pretreated substrates.
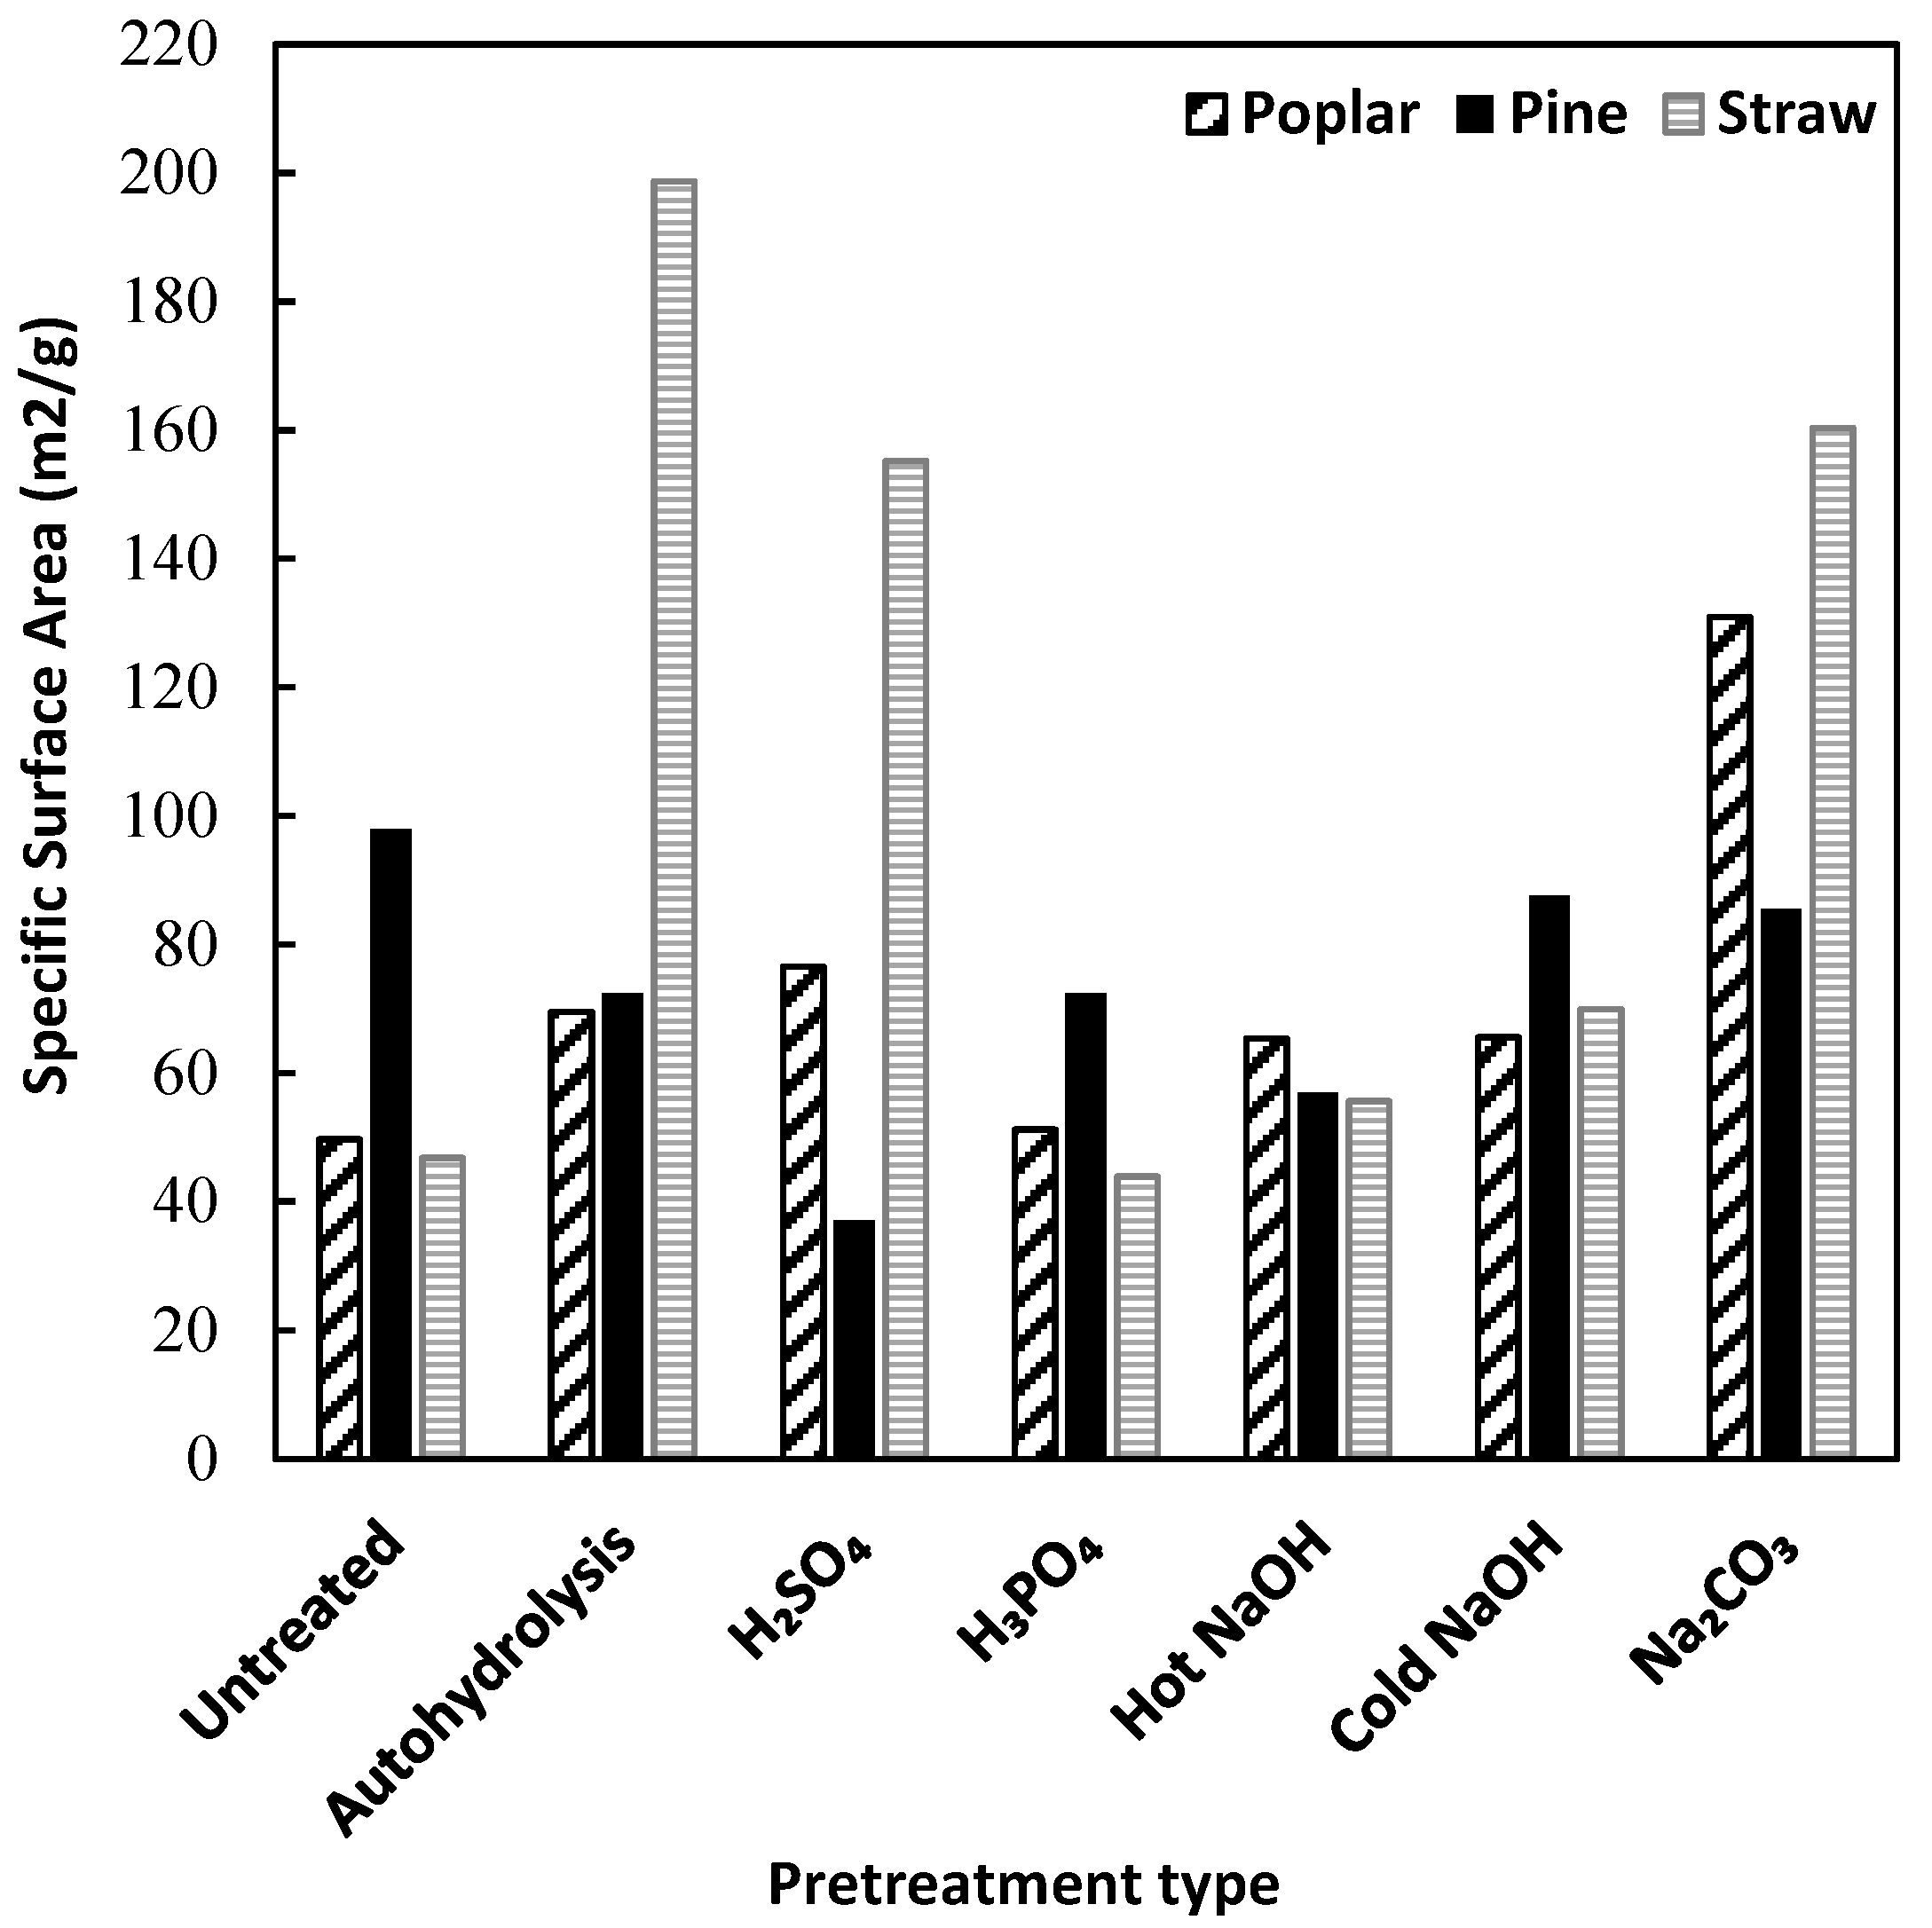
Figure 2.
Water retention value of untreated and pretreated substrates using a centrifuge method, considerable differences among the samples are seen by different letters by ANOVA test.
Figure 2.
Water retention value of untreated and pretreated substrates using a centrifuge method, considerable differences among the samples are seen by different letters by ANOVA test.

Figure 3.
Initial hydrolysis rate of untreated and pretreated poplar wood, pinewood, and rice straw.
Figure 3.
Initial hydrolysis rate of untreated and pretreated poplar wood, pinewood, and rice straw.
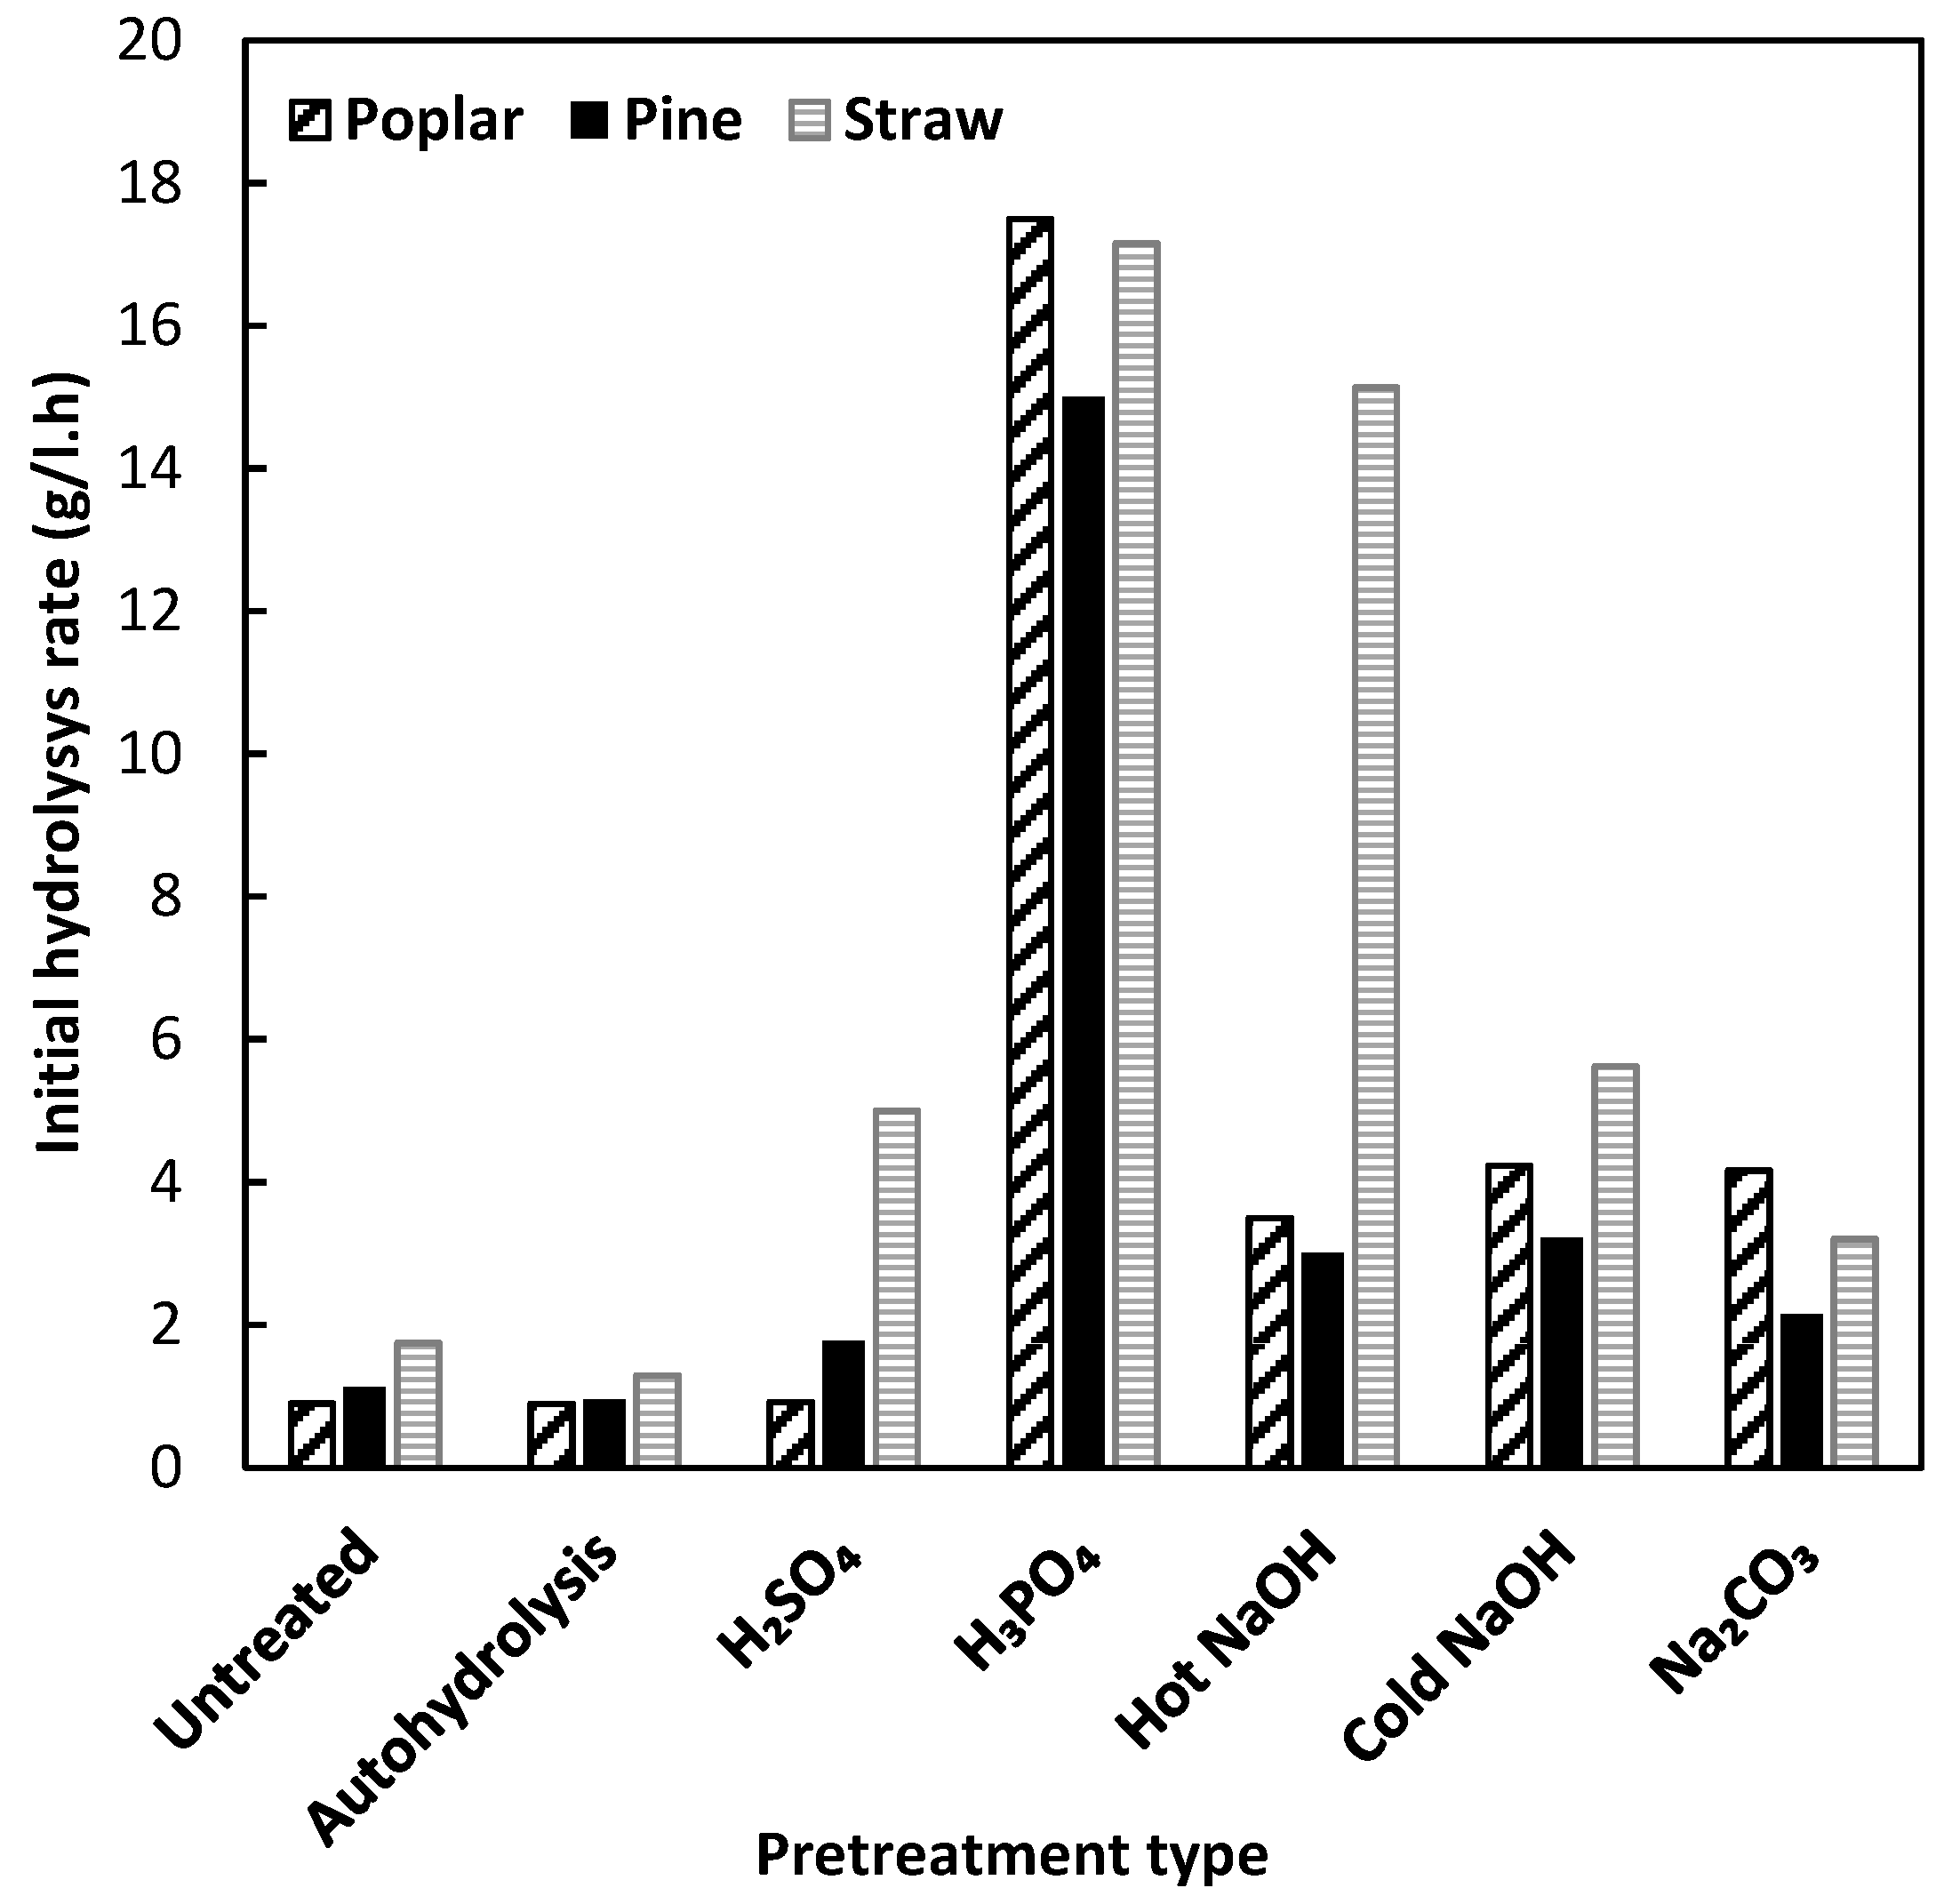
Figure 4.
Enzymatic hydrolysis yield of untreated and pretreated poplar wood, pinewood, and rice straw.
Figure 4.
Enzymatic hydrolysis yield of untreated and pretreated poplar wood, pinewood, and rice straw.
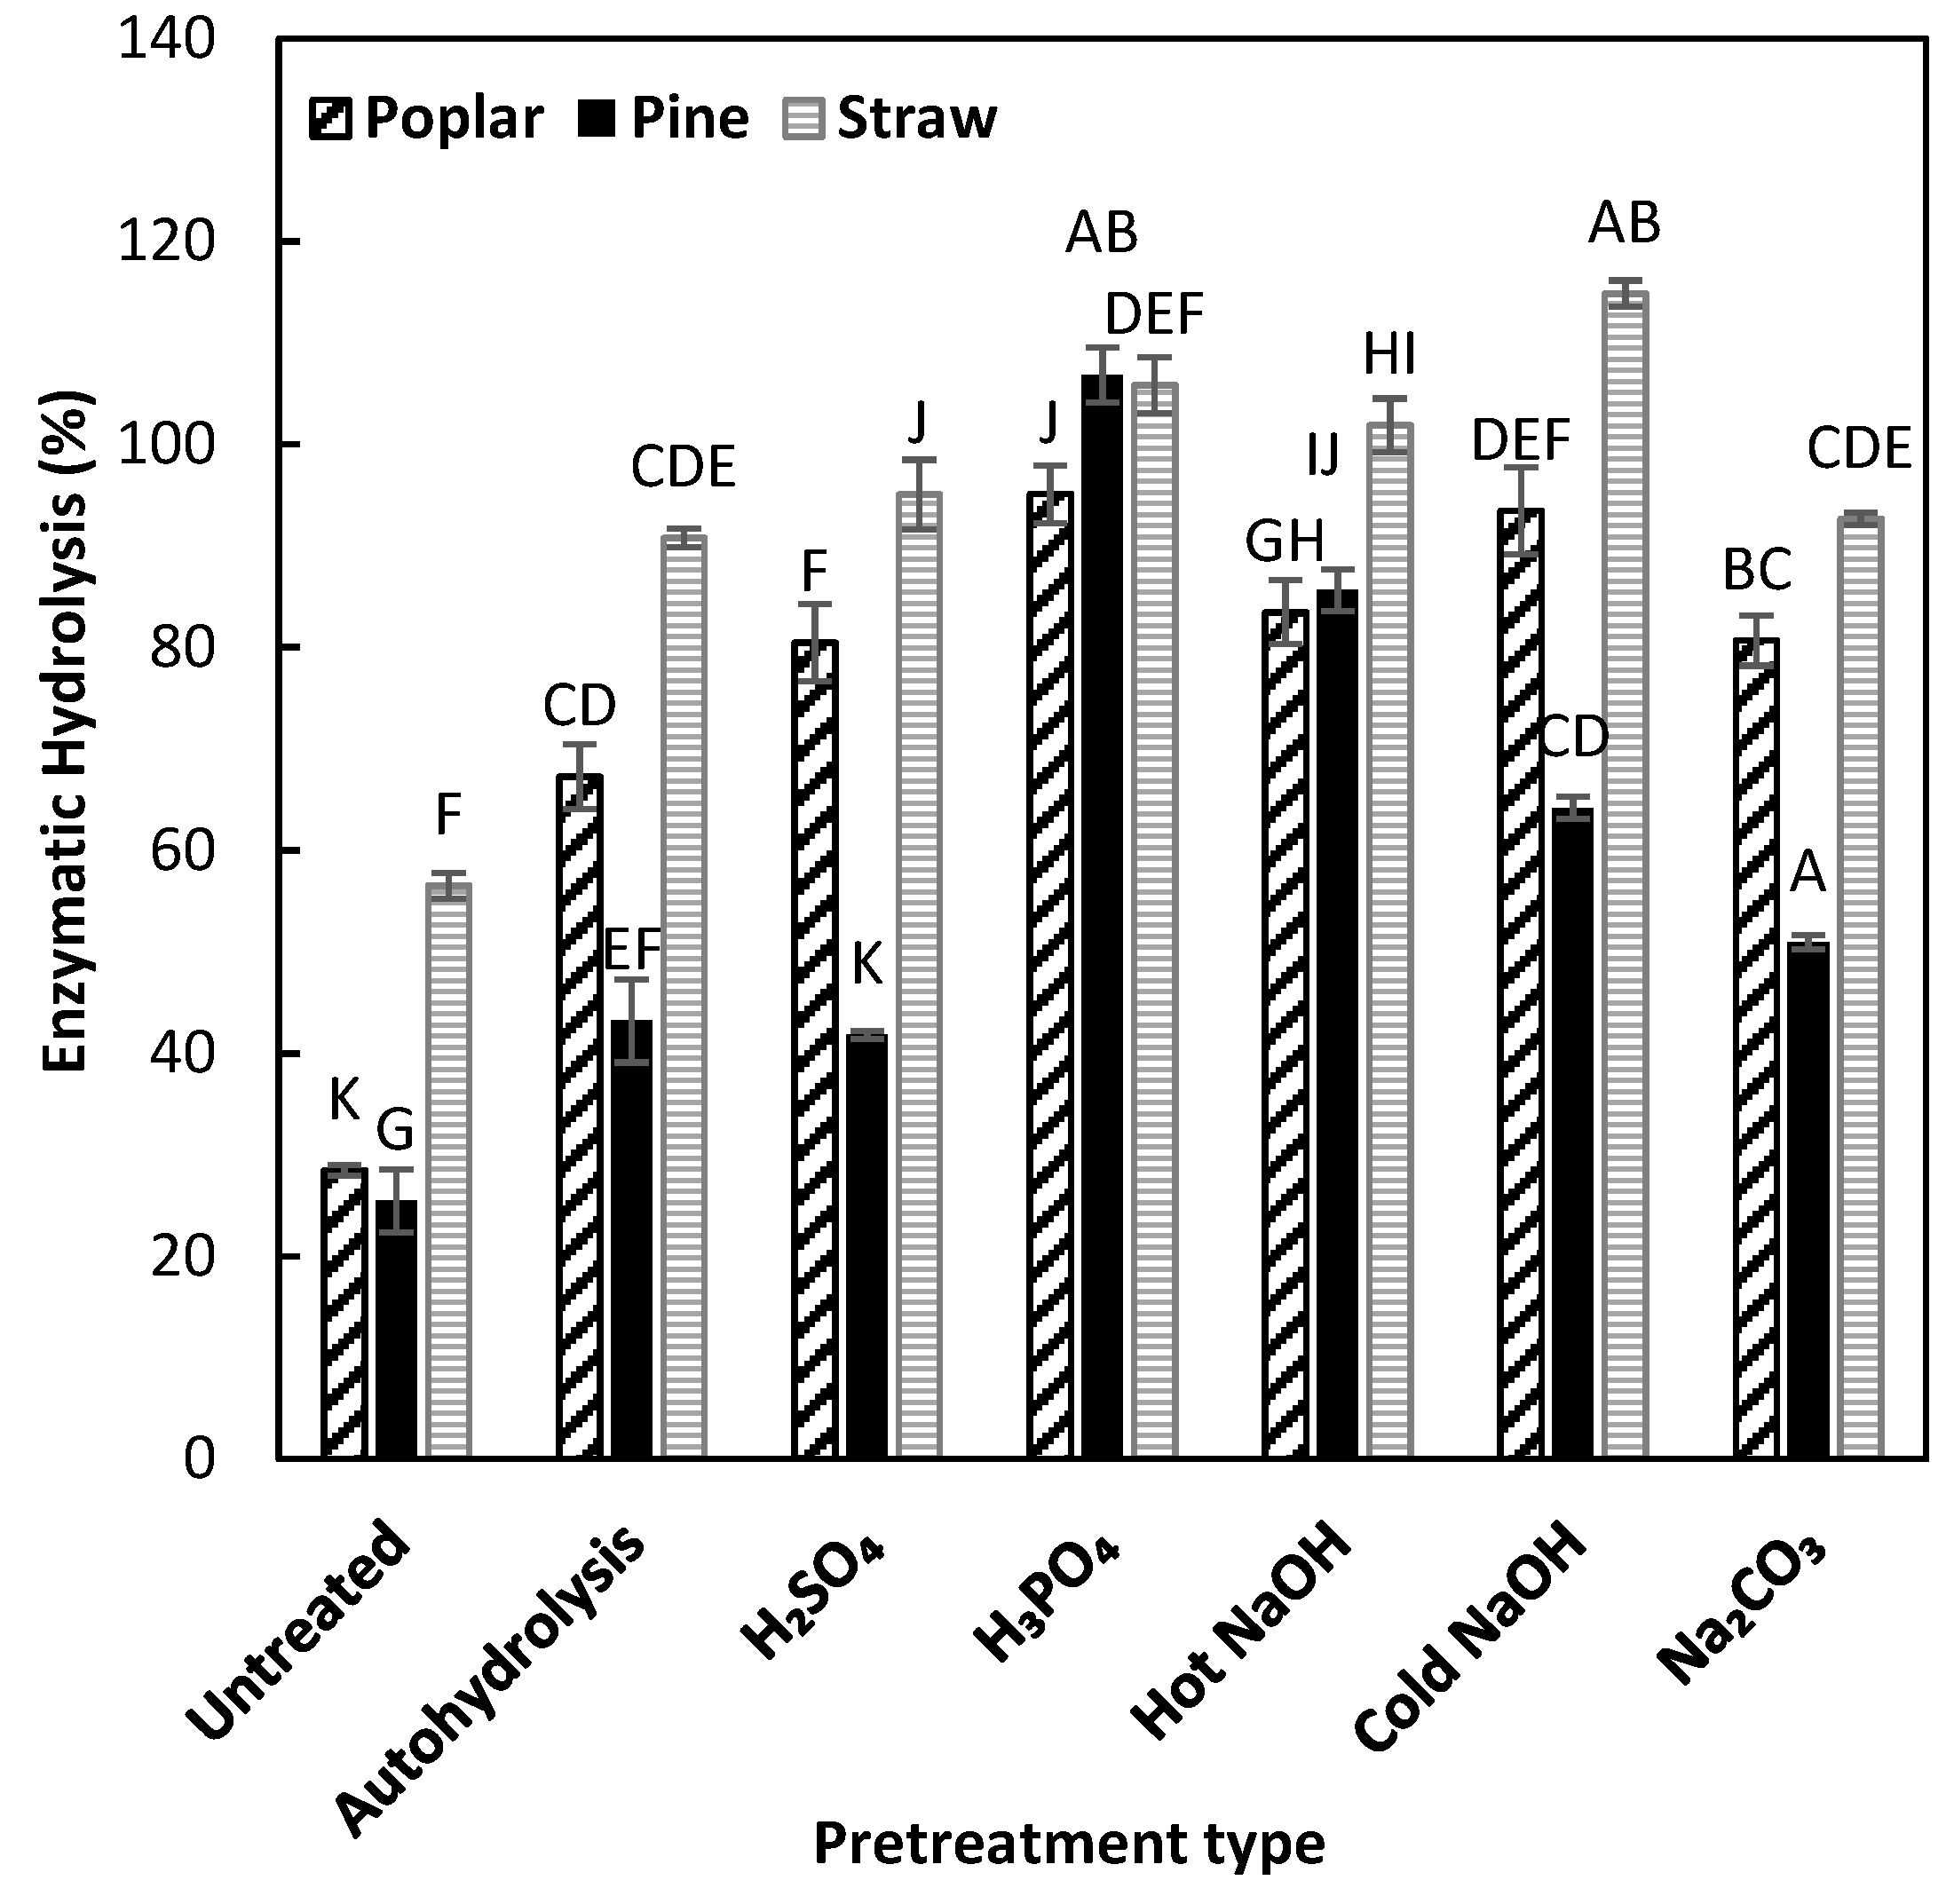
Figure 5.
Linear relationship between ethanol production yield and structural features index of poplar wood.
Figure 5.
Linear relationship between ethanol production yield and structural features index of poplar wood.
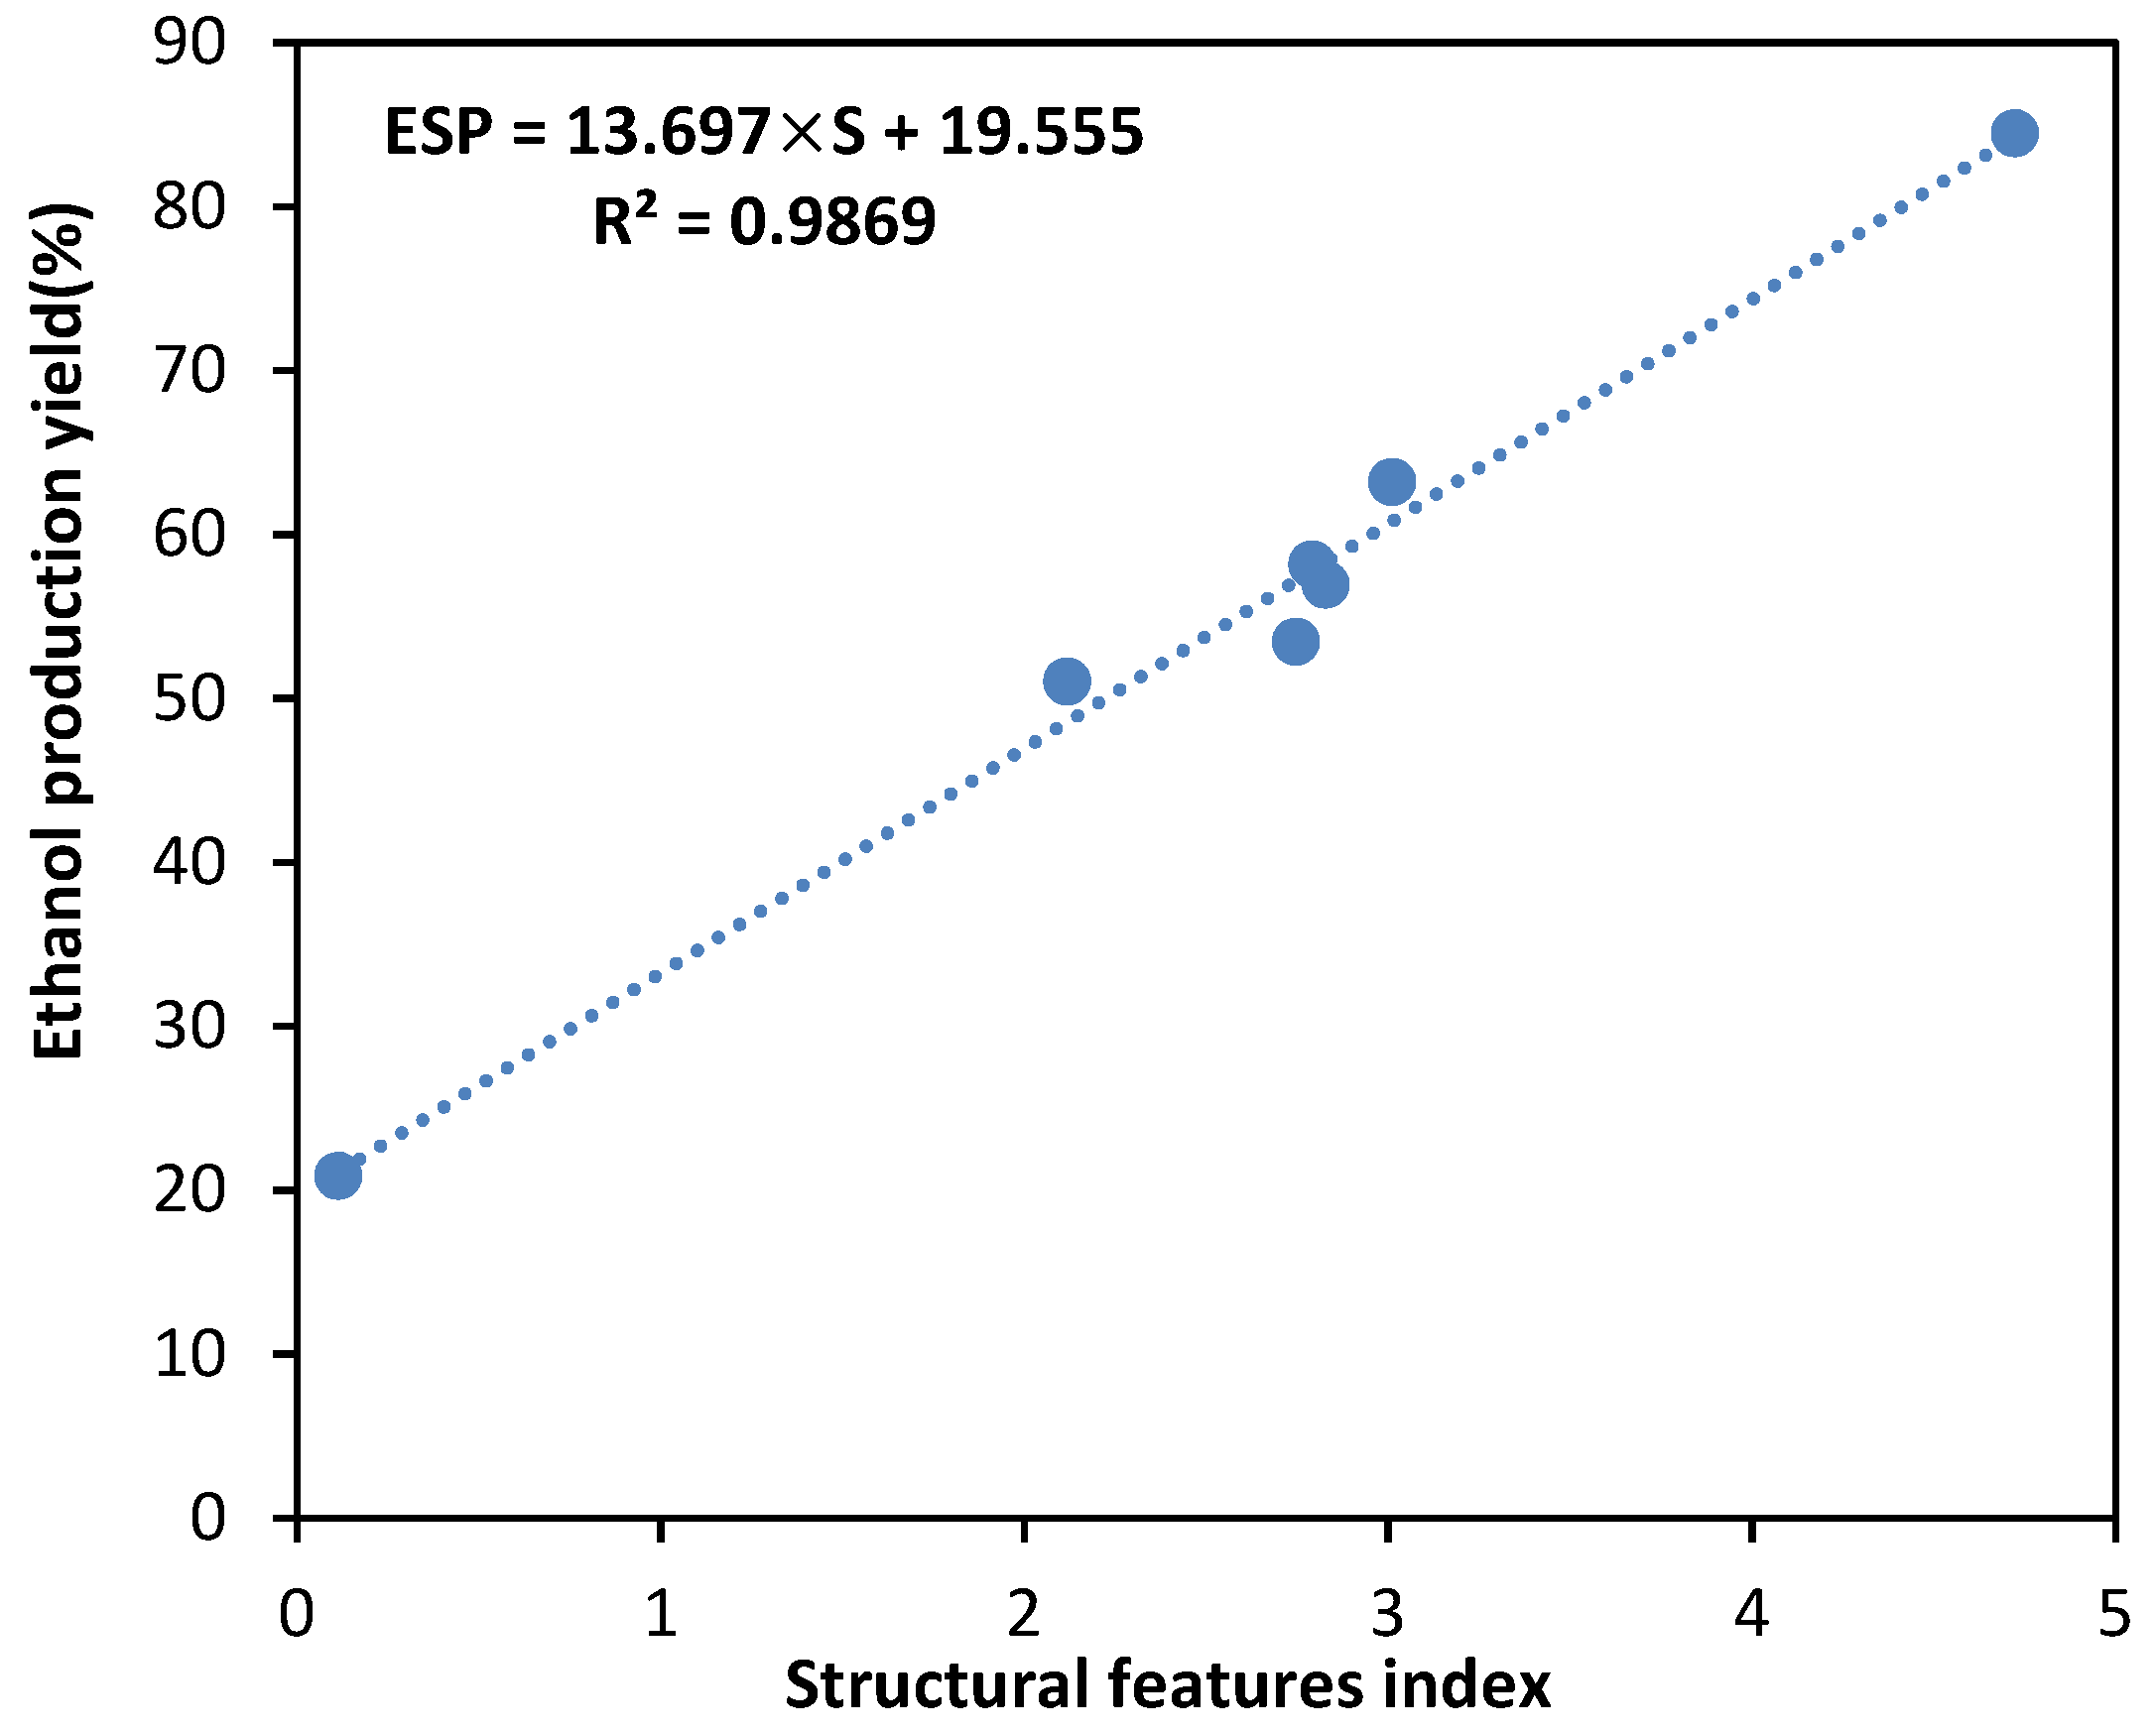
Figure 6.
Linear relationship between ethanol production yield and structural features index of pinewood.
Figure 6.
Linear relationship between ethanol production yield and structural features index of pinewood.
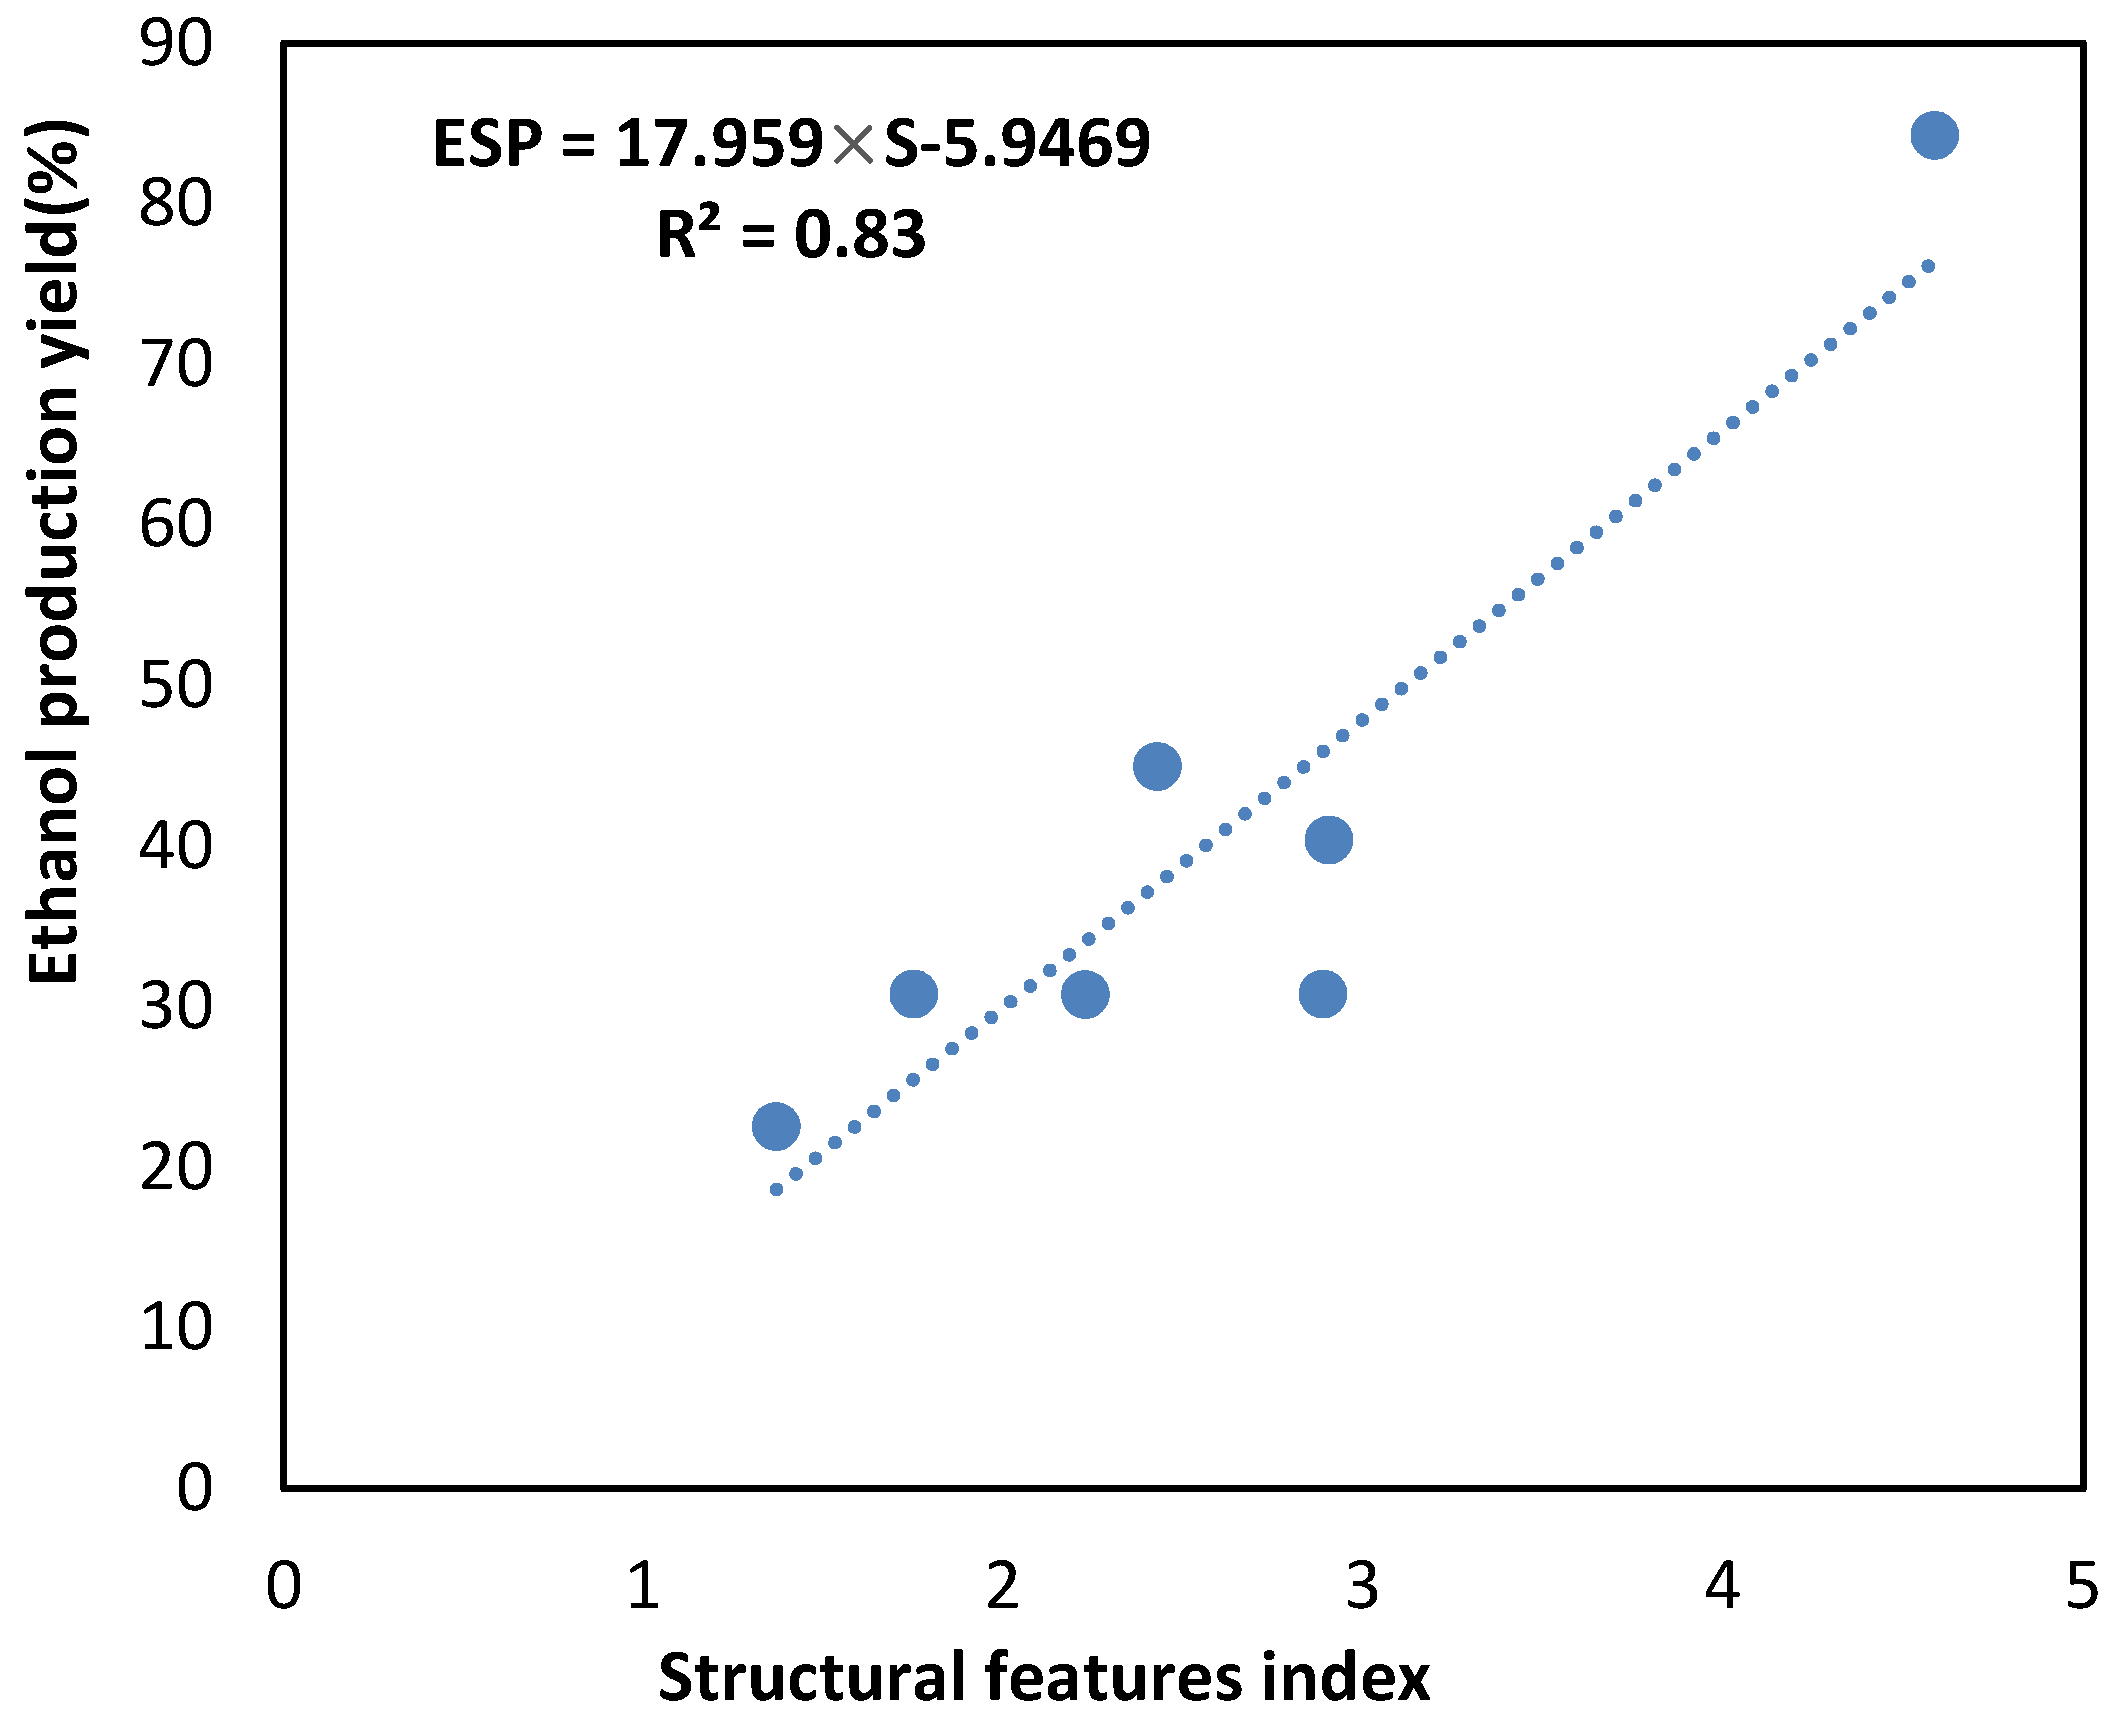
Figure 7.
Linear relationship between ethanol production yield and structural features index of rice straw.
Figure 7.
Linear relationship between ethanol production yield and structural features index of rice straw.


Table 1.
The composition of untreated and pretreated samples in poplar wood, pinewood, and rice straw.
Table 1.
The composition of untreated and pretreated samples in poplar wood, pinewood, and rice straw.
| Substrate | Pretreatment | Glucan 1 | Xylan | Galactan | Arabinan + Mannan | ASL 2 | AIL 3 | Total Lignin | Ash |
|---|---|---|---|---|---|---|---|---|---|
| Poplar | Untreated | 51.4 | 18.7 | 0.2 | 5.7 | 4.7 ± 0.1 | 20.4 ± 0.1 | 25.1 | 0.17 ± 0.10 |
| Autohydrolysis | 57.8 | 9.4 | ND4 | 3.5 | 2.7 ± 0.1 | 25.1 ± 0.1 | 27.8 | 0.93 ± 0.27 | |
| Sulfuric Acid | 64.1 | 4.7 | ND | 1.9 | 1.6 ± 0.1 | 31.3 ± 0.1 | 32.9 | 0.83 ± 0.17 | |
| Phosphoric Acid | 61.2 | 4.8 | ND | 3.2 | 2.7 ± 0.1 | 20.3 ± 0.1 | 23 | 0.34 ± 0.01 | |
| Hot Sodium Hydroxide | 65.3 | 9.2 | ND | 3.8 | 3.5 ± 0.2 | 19.7 ± 0.4 | 23.2 | 0.73 ± 0.05 | |
| Cold Sodium Hydroxide | 55.4 | 9.6 | ND | 4.1 | 3.9 ± 0.2 | 19.9 ± 0.2 | 23.8 | 0.36 ± 0.19 | |
| Sodium Carbonate | 52 | 9.7 | ND | 4.2 | 4.1 ± 0.1 | 19.2 ± 0.1 | 23.3 | 0.23 ± 0.49 | |
| Pine | Untreated | 44.2 | 6.8 | 1.3 | 11 | 2.9 ± 0.1 | 20.2 ± 0.1 | 23.1 | 0.55 ± 0.02 |
| Autohydrolysis | 51.8 | 4.1 | ND | 5.3 | 2.2 ± 0.1 | 19.7 ± 0.8 | 21.9 | 0.72 ± 0.14 | |
| Sulfuric Acid | 52.7 | 4 | ND | 3 | 2.7 ± 0.1 | 26.5 ± 0.1 | 29.2 | 0.89 ± 0.05 | |
| Phosphoric Acid | 47.4 | 3.1 | 1.6 | 3.2 | 2.7 ± 0.2 | 24.7 ± 0.4 | 27.4 | 0.72 ± 0.51 | |
| Hot Sodium Hydroxide | 47 | 8.6 | 0.7 | 3.2 | 3.1 ± 0.2 | 22.4 ± 0.7 | 25.5 | 0.33 ± 0.12 | |
| Cold Sodium Hydroxide | 45.9 | 5.9 | 1.3 | 5.4 | 2.9 ± 0.1 | 19.5 ± 0.4 | 22.4 | 0.43 ± 0.10 | |
| Sodium Carbonate | 48.6 | 6.6 | 1.1 | 3.7 | 3.2 ± 0.5 | 24.7 ± 0.5 | 27.9 | 0.56 ± 0.23 | |
| Rice Straw | Untreated | 41.8 | 18.7 | ND | 3.2 | 4.3 ± 0.1 | 15.7 ± 0.6 | 20 | 7.08 ± 0.25 |
| Autohydrolysis | 52.7 | 7.9 | ND | 5.4 | 2.5 ± 0.1 | 15.9 ± 0.7 | 18.4 | 7.91 ± 0.81 | |
| Sulfuric Acid | 59.8 | 5.6 | ND | 1.5 | 2.6 ± 0.1 | 16.8 ± 0.4 | 19.4 | 11.91 ± 0.16 | |
| Phosphoric Acid | 63 | 5.3 | ND | 3.2 | 2.6 ± 0.1 | 16.8 ± 0.2 | 19.4 | 11.44 ± 0.07 | |
| Hot Sodium Hydroxide | 71.2 | 8.9 | ND | 2.3 | 1.1 ± 0.1 | 8.7 ± 0.1 | 9.7 | 7.63 ± 0.05 | |
| Cold Sodium Hydroxide | 60.5 | 10.1 | ND | 2.7 | 2.0 ± 0.1 | 13.3 ± 0.3 | 15.3 | 8.45 ± 0.19 | |
| Sodium Carbonate | 57.8 | 12 | ND | 2.2 | 1.6 ± 0.1 | 9.2 ± 0.3 | 10.7 | 11.58 ± 0.32 |
1 According to previous studies, hemicellulosic sugars range in standard deviation between 3.5 and 4.8 in this method. 2 Acid Soluble Lignin. 3 Acid Insoluble Lignin. 4 Not Detected.
Table 2.
TCI, LOI, and lignin to cellulose ratio based on FTIR, and CrI, and crystallite size based on XRD spectra of untreated and pretreated substrates.
Table 2.
TCI, LOI, and lignin to cellulose ratio based on FTIR, and CrI, and crystallite size based on XRD spectra of untreated and pretreated substrates.
| Substrate | Pretreatment Type | LOI | TCI | α1508/898 | CrI (%) | Crystallite Size |
|---|---|---|---|---|---|---|
| Poplar | Untreated | 1.58 | 1.53 | 1.14 | 67.3 | 2.37 nm |
| Autohydrolysis | 1.62 | 1.47 | 1.37 | 60.03 | 2.38 nm | |
| Sulfuric Acid | 2.08 | 1.43 | 1.78 | 60.69 | 1.88 nm | |
| Phosphoric Acid | 1.5 | 1.37 | 1.09 | 31.38 | 0.93 nm | |
| Hot Sodium Hydroxide | 1.58 | 1.28 | 1.18 | 66.16 | 2.64 nm | |
| Cold Sodium Hydroxide | 1.46 | 1.26 | 1.11 | 56.14 | 2.09 nm | |
| Sodium Carbonate | 1.62 | 1.3 | 1.16 | 67.13 | 2.62 nm | |
| Pine | Untreated | 1.53 | 1.42 | 1.38 | 53.98 | 1.67 nm |
| Autohydrolysis | 1.41 | 1.33 | 1.45 | 59.1 | 2.47 nm | |
| Sulfuric Acid | 1.92 | 1.3 | 2.13 | 64.83 | 1.72 nm | |
| Phosphoric Acid | 1.3 | 1.25 | 1.23 | 23.92 | 0.86 nm | |
| Hot Sodium Hydroxide | 1.5 | 1.32 | 1.39 | 55.51 | 2.02 nm | |
| Cold Sodium Hydroxide | 1.45 | 1.33 | 1.33 | 45.2 | 1.56 nm | |
| Sodium Carbonate | 1.7 | 1.3 | 1.49 | 57.68 | 1.94 nm | |
| Rice Straw | Untreated | 1.83 | 1.31 | 1.27 | 66.25 | 1.78 nm |
| Autohydrolysis | 1.69 | 1.35 | 1.08 | 70.77 | 2.00 nm | |
| Sulfuric Acid | 1.86 | 1.25 | 1.26 | 68.25 | 1.98 nm | |
| Phosphoric Acid | 1.33 | 1.35 | 0.91 | 35.32 | 1.07 nm | |
| Hot Sodium Hydroxide | 1.36 | 1.17 | 0.6 | 73.56 | 3.27 nm | |
| Cold Sodium Hydroxide | 1.5 | 1.13 | 0.89 | 62.68 | 2.05 nm | |
| Sodium Carbonate | 1.61 | 1.29 | 0.84 | 60.35 | 2.14 nm |
Table 3.
Initial pH, acid buffering capacity, and base buffering capacity before and after pretreatment of poplar wood, pinewood, and rice straw.
Table 3.
Initial pH, acid buffering capacity, and base buffering capacity before and after pretreatment of poplar wood, pinewood, and rice straw.
| Substrate | Pretreatment | Initial pH | Acid Buffering Capacity (mL) | Base Buffering Capacity (mL) |
|---|---|---|---|---|
| Poplar | Untreated | 4.78 | 0.22 | 0.12 |
| Autohydrolysis | 6.33 | 0.2 | 0.01 | |
| Sulfuric Acid | 5.75 | 0.17 | 0.02 | |
| Phosphoric Acid | 7.14 | 0.27 | 0 | |
| Hot Sodium Hydroxide | 8.6 | 0.5 | 0 | |
| Cold Sodium Hydroxide | 9.49 | 0.42 | 0 | |
| Sodium Carbonate | 9.16 | 0.57 | 0 | |
| Pine | Untreated | 5.4 | 0.2 | 0.03 |
| Autohydrolysis | 7.3 | 0.24 | 0 | |
| Sulfuric Acid | 6.33 | 0.25 | 0.02 | |
| Phosphoric Acid | 6.02 | 0.4 | 0.04 | |
| Hot Sodium Hydroxide | 9.36 | 0.67 | 0 | |
| Cold Sodium Hydroxide | 8.77 | 0.54 | 0 | |
| Sodium Carbonate | 9.21 | 0.57 | 0 | |
| Rice Straw | Untreated | 6.24 | 0.3 | 0.01 |
| Autohydrolysis | 7.03 | 0.3 | 0 | |
| Sulfuric Acid | 6.5 | 0.3 | 0.01 | |
| Phosphoric Acid | 6.95 | 0.35 | 0 | |
| Hot Sodium Hydroxide | 10.5 | 0.63 | 0 | |
| Cold Sodium Hydroxide | 9.33 | 0.57 | 0 | |
| Sodium Carbonate | 8.88 | 0.97 | 0 |
Table 4.
Recovery (g per kg initial substrate), glucose production after enzymatic hydrolysis based on recovery (g per kg initial substrate), total ethanol production in SSF based on recovery (g per kg initial substrate), glycerol yield (%), and ethanol yield (%) for all untreated and pretreated substrates.
| Substrate | Pretreatment Type | Recovery (g/kg Substrate) | Glucose Production (g/kg Substrate) | Ethanol Production (g/kg Substrate) | Glycerol Yield (%) | Ethanol Yield (%) |
|---|---|---|---|---|---|---|
| Poplar | Untreated | - | 162.5 ± 0.2 | 60.2 ± 0.1 | 0.99 ± 0.2 | 20.87 ± 0.48 |
| Autohydrolysis | 677.9 | 292.8 ± 0.7 | 112.2 ± 0.6 | 1.64 ± 0.1 | 51.02 ± 2.54 | |
| Sulfuric Acid | 622.4 | 356.6 ± 1.3 | 119.6 ± 0.2 | 1.94 ± 0.1 | 53.45 ± 0.77 | |
| Phosphoric Acid | 763 | 493.3 ± 0.7 | 221.2 ± 0.1 | 3.24 ± 0.1 | 84.44 ± 0.42 | |
| Hot Sodium Hydroxide | 565 | 342.1 ± 2.1 | 130.7 ± 0.1 | 1.80 ± 0.2 | 63.19 ± 0.39 | |
| Cold Sodium Hydroxide | 773.5 | 459.2 ± 3.4 | 136.8 ± 0.1 | 1.54 ± 0.3 | 56.91 ± 0.24 | |
| Sodium Carbonate | 760.1 | 344.2 ± 0.6 | 128.9 ± 0.1 | 2.45 ± 0.2 | 58.15 ± 0.50 | |
| Pine | Untreated | - | 125.0 ± 3.2 | 55.9 ± 0.1 | 1.08 ± 0.1 | 22.55 ± 0.12 |
| Autohydrolysis | 714.2 | 177.6 ± 1.3 | 63.9 ± 0.1 | 1.07 ± 0.1 | 30.78 ± 0.29 | |
| Sulfuric Acid | 617.8 | 151.3 ± 0.1 | 56.2 ± 0.1 | 1.08 ± 0.1 | 30.80 ± 0.05 | |
| Phosphoric Acid | 792.8 | 446.0 ± 0.6 | 177.6 ± 0.1 | 2.80 ± 0.1 | 84.25 ± 0.16 | |
| Hot Sodium Hydroxide | 761.8 | 306.3 ± 0.4 | 90.2 ± 0.1 | 1.49 ± 0.4 | 44.97 ± 0.15 | |
| Cold Sodium Hydroxide | 936 | 340.5 ± 0.3 | 97.3 ± 0.3 | 1.35 ± 0.1 | 40.38 ± 1.30 | |
| Sodium Carbonate | 847.5 | 233.2 ± 0.2 | 71.1 ± 0.1 | 1.11 ± 0.2 | 30.76 ± 0.06 | |
| Rice Straw | Untreated | - | 262.5 ± 0.3 | 115.5 ± 0.2 | 1.94 ± 0.2 | 53.13 ± 0.58 |
| Autohydrolysis | 574.5 | 305.4 ± 0.2 | 142.7 ± 0.1 | 2.57 ± 0.2 | 84.12 ± 0.36 | |
| Sulfuric Acid | 510.8 | 322.6 ± 0.6 | 145.8 ± 0.1 | 3.16 ± 0.1 | 85.10 ± 0.17 | |
| Phosphoric Acid | 665.8 | 493.2 ± 0.6 | 206.2 ± 0.1 | 3.08 ± 0.4 | 87.64 ± 0.27 | |
| Hot Sodium Hydroxide | 332.3 | 267.8 ± 0.4 | 123.5 ± 0.1 | 4.22 ± 0.4 | 92.95 ± 0.01 | |
| Cold Sodium Hydroxide | 665.5 | 513.7 ± 0.3 | 195.1 ± 0.2 | 3.17 ± 0.1 | 86.41 ± 0.85 | |
| Sodium Carbonate | 593 | 352.9 ± 0.1 | 166.3 ± 0.2 | 4.40 ± 0.4 | 86.36 ± 1.11 |
Publisher’s Note: MDPI stays neutral with regard to jurisdictional claims in published maps and institutional affiliations. |
© 2022 by the authors. Licensee MDPI, Basel, Switzerland. This article is an open access article distributed under the terms and conditions of the Creative Commons Attribution (CC BY) license (https://creativecommons.org/licenses/by/4.0/).
Share and Cite
MDPI and ACS Style
Bay, M.S.; Eslami, F.; Karimi, K. The Relationship between Structural Features of Lignocellulosic Materials and Ethanol Production Yield. Designs 2022, 6, 119. https://doi.org/10.3390/designs6060119
AMA Style
Bay MS, Eslami F, Karimi K. The Relationship between Structural Features of Lignocellulosic Materials and Ethanol Production Yield. Designs. 2022; 6(6):119. https://doi.org/10.3390/designs6060119
Chicago/Turabian StyleBay, Mohammad Saber, Fatemeh Eslami, and Keikhosro Karimi. 2022. "The Relationship between Structural Features of Lignocellulosic Materials and Ethanol Production Yield" Designs 6, no. 6: 119. https://doi.org/10.3390/designs6060119