

Satellite Thermal Management Pump Impeller Design and Optimization

1
Romanian Research and Development Institute for Gas Turbines COMOTI, 061126 Bucharest, Romania
2
Doctoral School of Aerospace Engineering, National University of Science and Technology POLITEHNICA Bucharest, 011061 Bucharest, Romania
*
Author to whom correspondence should be addressed.
Inventions 2024, 9(3), 54; https://doi.org/10.3390/inventions9030054
Submission received: 26 March 2024
/
Revised: 19 April 2024
/
Accepted: 1 May 2024
/
Published: 6 May 2024
(This article belongs to the Special Issue New Sights in Fluid Mechanics and Transport Phenomena)
Abstract
:This study presents a numerical approach to the design and optimization of centrifugal impellers used in the pumps of active thermal control systems of spacecraft. Although launch costs have shrunk in the last decade, the performance requirements, such as efficiency and reliability, have increased, as such systems are required to work up to 15 years, depending on the mission. To that effect, our paper deals with the first step in this pump design, namely the hydraulic optimization of the impeller. Constructively, this type of impeller allows for certain balancing systems and labyrinth seals to be applied in a more effective way, as well as allowing for additive manufacturing methods to be used—however, details regarding these aspects are beyond the scope of the current paper. By combining empirical formulas, computational fluid dynamics (CFD) analysis, and artificial neural networks (ANNs), the research focuses on achieving high efficiency and fast manufacturing. A series of geometries have been sized and validated using steady-state RANS (Reynolds Averaged Navier-Stokes) simulations, leading to the identification of the most efficient configuration. Subsequent optimization using an ANN resulted in a refined impeller design with notable improvements in hydraulic performance: a 3.55% increase in efficiency and a 7.9% increase in head. Key parameters influencing impeller performance, including blade number, incidence, and backsweep angles, are identified. This approach offers a comprehensive method to address the evolving requirements of space missions and contributes to the advancement of centrifugal pump technology in the space domain.
1. Introduction
Over the past decade, the space industry has witnessed a surge in demand driven by the aspiration to comprehensively explore the outer reaches of our solar system, but also to deliver more efficient services for humankind. Consequently, there has been a substantial growth in the need for small launch vehicles [1,2], as well as for communication satellites with high throughput, leading to the need of active antennas, higher power needed, higher amounts of heat generated, and, implicitly, the need for a better thermal control system. The core of the thermal control system is the pump, a mechanical assembly which circulates a thermal fluid in a closed circuit, transporting heat between different sides of the spacecraft [3]. There are several types of pumps which can be used for this purpose; however, among these the centrifugal pump stands out as the most reliable one [4]; this one is equipped with a canned electric motor, which drives a centrifugal impeller.
Satellite pump impellers are typically designed to be more compact than standard impellers. This compactness allows them to be integrated into smaller spacecraft where space is limited, targeting high efficiency, improved functionality, and low mass. They are also characterized by low flow rates and high stability, as they are crucial for the precise control of the flow rate in space environments, where human intervention is not possible. Besides their geometrical characteristics, another important aspect is the material, which shall offer enhanced durability, corrosion resistance, and thermal stability within the active thermal control system (ATCS). Ultimately, the design and functionality of each spacecraft pump impeller is tailored to the specific challenges and constraints of the mission for which they are needed, setting them apart from conventional pump solutions utilized in terrestrial applications.
To meet these demands, innovative design methodologies have emerged, focused on creating impeller and volute geometries that can deliver the requisite performance levels to achieve the application’s objectives. Over the years, numerous characteristics of impeller geometry have been investigated, encompassing factors such as blade count, splitter blade dimensions, splitter blade angles, wrap angle, and more.
Jia et al. [5] studied the impeller influence on the pump stability, analyzing three types of impellers: closed impeller, semi-open impeller, and open impeller. For higher flow rates, the closed impeller exhibited the highest stability, while the open impeller performed the least reliably. This stability trend was also observed in the pressure fluctuations occurring near the casing tongue, primarily due to the interaction between the blade and casing tongue. The amplitude of these pressure fluctuations increased along the casing tongue and at the pump outlet. Depending on the impeller type, their intensity varied, with a 7.7% greater intensity for the open impeller and a 3.5% increase for the semi-open impeller when compared to the closed impeller. In terms of vibration, the area around the tongue was the least stable, with the closed impeller causing the least casing vibration, and the open impeller resulting in the highest vibration levels. Additionally, the interaction between the volute and the impeller influenced flow stability and led to fluctuations in pressure distribution around the circumference of the volute [5,6,7].
Siddique et al. [8] found that incorporating splitter blades in conjunction with other parameters led to an enhancement in overall pump efficiency by 3% and an increase in head by 8.2%. This improvement is attributed to achieving a uniform distribution of blade loading across the impeller blade span and a reduction in pressure fluctuations. Peng et al. [9], in their use of response surface methodology to optimize the geometry of a multistage pump impeller, determined that the interaction between the blade wrap angle and blade outlet had no significant impact on head. Instead, it was found that the most influential factors affecting head were the number of blades relative to the impeller diameter, the impeller diameter in relation to the blade outlet, and the width in relation to the blade wrap angle.
The impeller blade exit angle is another crucial parameter that has a significant impact on the input power of a centrifugal pump and can be considered as a design variable in a multi-objective optimization function. Extensive research using Reynolds-averaged Navier–Stokes (RANS) analysis, as highlighted in [10], has demonstrated that the blade exit angle directly influences the shaft power and efficiency of the pump, without affecting the head at the best efficiency point. This insight has led to notable gains, with pump efficiency seeing an improvement of approximately 10%. By employing multi-objective optimization design techniques coupled with computational fluid dynamics (CFD) analysis, it is possible to define various models for pump geometry by varying key parameters of both the impeller and volute. This approach offers optimized solutions in significantly shorter timeframes compared to traditional design methods, as indicated in references [11,12,13,14,15].
Enhancing hydraulic efficiency can indeed be achieved by minimizing losses near the blade surfaces and within the impeller passage. To accomplish this, researchers have concentrated on design variables related to the blade angles at the leading and trailing edges, employing a multi-surrogate-based optimization methodology [16]. Furthermore, strategies for augmenting hydraulic efficiency have been explored in studies such as [17,18,19,20,21], which primarily focus on shape optimization. These investigations delve into various methods for improving efficiency. Another avenue of research dedicated to boosting hydraulic efficiency and operational stability can be found in [22], where a surrogate-based optimization technique was coupled with RANS analysis to refine the shape of the impeller and volute within a centrifugal pump. The key design variables under consideration comprised the blade outlet angle, impeller outlet width, and the cross-sectional area of the volute. These variables were strategically adjusted to enhance the pump’s overall performance.
An alternative optimization approach, as described in [23], combines entropy generation theory with particle swarm optimization. Hydraulic losses typically stem from two main sources: turbulent entropy generation and wall entropy generation. By reducing entropy generation by 5.41%, this method resulted in a notable efficiency increase of 3.89%. This emphasizes the significance of entropy generation reduction in improving pump performance. In the quest to pinpoint the locations of these losses, Majeed et al. [24] harnessed entropy generation theory to investigate turbulent dissipation in centrifugal pumps. Their work sheds light on the areas within the pump where these losses occur.
Cao et al. [25], on the other hand, utilized computational fluid dynamics (CFD) techniques to evaluate entropy production in a mixed flow pump with an annular volute. The findings revealed that, within each component of the pump, power losses primarily arise from turbulence dissipation rather than viscous effects. Notably, these losses are more pronounced in the annular volute compared to other hydraulic components, with the most significant losses occurring around the diffuser outlet. In the pursuit of optimizing impeller shape, a study outlined in [26] employed artificial neural networks (ANN) and the artificial bee colony algorithm, coupled with a validated three-dimensional Navier–Stokes flow solver. Through this multi-objective approach, enhanced efficiency was achieved.
An effective strategy for improving centrifugal pump performance involves utilizing surrogate models based on shape optimization, as discussed in [27]. In this approach, design variables such as blade number and blade angles were manipulated to define the blade shape. The study employed RANS analysis along with the standard k-epsilon turbulence model for steady, incompressible flow simulations. Blade shape optimization contributed to increased hydraulic efficiency by reducing flow and disc friction losses. Specifically, optimizing the outlet blade angle led to a larger outlet cross-sectional area, contributing to higher head generation and efficiency enhancement.
An overview of surrogate methods and their applicability in optimizing pump impellers is outlined in [28]. The paper outlines key design parameters influencing pump performance and the effectiveness of optimization techniques. Parameters such as blade profile shape, the profile of the vaned diffuser, and interactions between pump components significantly influence performance. Similar findings are presented in [29], where efficiency and head improvements of 3.2% and 8.9%, respectively, were achieved for the pump. Another method to optimize the pump design is described in [30], and it relies on the three-dimensional (3D) geometry parametrization method based on Bezier surfaces. This approach seeks to optimize pump design. The study finds that the impeller and vaneless diffuser have the most significant impact on pump efficiency, with minimal influence from the volute. This is primarily due to the limited number of design variables used for the parametrization of the volute. Through the optimization process, changes were made to the blade loading, resulting in a reduction in cavitation issues. Specifically, the optimization procedure addressed the low-pressure area near the leading edge, which was reduced.
The aforementioned studies offer solutions for optimizing pumps through a combination of CFD analysis and various optimization techniques such as genetic algorithms and artificial neural networks. It is essential to emphasize that each implementation must be tailored to suit the specific requirements of the pump’s intended applications and operating conditions.
The paper under discussion is primarily concerned with developing an optimization methodology tailored for a compact centrifugal pump intended for utilization in spacecraft ATCS. This methodology concentrates on enhancing the geometrical characteristics of the impeller. The overarching aim is to accomplish two primary objectives: enhancing pump efficiency and reducing pressure losses. Key requirements for this pump were the electric driver motor (which is limited in its speed), size, and specific diameter/height, as well as its axial positioning and balancing system. The requirement that the fluid should not be contaminated during its 10 years of continuous operation excludes the use of ball bearings; hence, various proprietary secondary flow devices were required.
2. Optimization Method
A schematic workflow of the design stages is presented in Figure 1, illustrating the approach towards designing and optimizing centrifugal pump components, including the volute. While the paper primarily emphasizes impeller design and optimization, the methodology extends to the entire centrifugal pump, acknowledging the significant impact of the connection between the impeller and the discharge device on its performance.
The first design stage included a series of “n” impellers candidates, designed through different methods (pump theory design based on analytic calculus, dedicated design software), validated through CFD analysis (3D RANS model) and ranked according to the objective function (OF), by verification with the pump-imposed requirements. A specific threshold was set for the OF, and impellers failing to meet this threshold were subsequently discarded. The OF objectives in Figure 1 were formulated with the following S.M.A.R.T. (Specific, Measurable, Attainable, Relevant, Time-bound) attributes:
- Specific (only the hardline and OF relevant parameters should be formulated);
- Measurable (each parameter should be implemented either in the OF or as a hardline requirement);
- Attainable within the envisioned project (parameters should not be unrealistic and their absolute values and weight within the OF should be constantly re-evaluated for each batch or pool);
- Relevant to the project, as well as the upstream and downstream components (the weights of the parameters in the OF will mirror their relevance);
- Time-bound (all time penalties and contingencies will need to be accounted for).
After the initial evaluation and ranking process, the validated impeller pool (VIP) was obtained. From this pool, the first five impellers underwent the CFD optimization process and the resulting performance was re-evaluated. If necessary, the original batch of five impellers were to be supplemented with the next best impeller from the VIP, until satisfactory results were reached. At the end of the process, the optimized impeller pool (OIP) was obtained. From this OIP, the top candidate impellers (at least three) can be paired with their optimal discharge device (simple volute, semi-volute, n-volutes, etc.).
In terms of pre-processing (geometry definition, parametrization, export/import, translation to related CAE (Computer-Aided Engineering) software, and meshing), processing (the CFD process, its monitoring, convergence criteria, and batch optimization), and post-processing (data interpretation, reporting, and correlation), these operations were performed according to the standard operational procedures [31] in turbomachinery established in COMOTI, regardless of the development stage. A study towards increasing the technological readiness level of the additive manufacturing (AM) of complex closed centrifugal pump impellers without internal support structures for space applications, manufactured by means of a selective laser melting (SLM) process, was presented in [32]. Different (pre- and post-) processing activities were performed, in order to obtain an improved geometrical stability and roughness. Taking into consideration the findings described in [32], the paper aims to further optimize a pump impeller in terms of hydraulic performance (head and efficiency), by optimizing the flow channel, blade thickness and curvature, angles, etc. This takes advantage of the AM technology, as such features cannot be obtained by means of conventional fabrication techniques which generally include the manufacturing of the impeller from two components and then joined together by welding, causing potential stress concentrations and defects over long periods of time.
The optimization process allows the user to subsequently reject an impeller–volute pair if the results are suboptimal, and fall back on the next best impeller, which will have a volute tailored for itself and put through the same analyses. This process will be reiterated as long as it is necessary to obtain a suitable batch of three candidates that can be further manufactured by rapid prototyping for a faster geometry assessment and tested using a dedicated hydraulic test bench.
The objective function (OF) is defined through the pump requirements, which are taken into account when designing the hydraulic components. In this case, although both geometric restrictions and hydraulic requirements factor in, the geometry “bounding box” is already at its maximum, since the speed of the impeller is not very high. Therefore, in actual practice, the only design flexibility allowed is the distribution of thickness and blade-set angle, plus the number of blades.
The OF contains the specific parameters to be compared and their weight for the designer. The specific parameters are divided into hardline specifications and softline specifications, as presented in Table 1.
3. Results and Discussions
3.1. Impeller Design
In the thermodynamic design of the stage, the specific speeds (NS), diameters, and pump loading (head and mass flow) were chosen. From this, the detailed CFD analyses were performed, which enabled the refining and fine-tuning of the design. Although this is not a very in-depth step, because it is based on outside correlations, it is the foundation on which all subsequent optimization/design work will be undertaken. Hence, it is important to properly explore the space of variations in terms of NS, DS (specific diameter), and loading, so that the full potential of the pump will not be missed.
For the impeller’s preliminary design, CfTurbo 2023 R1 [34] software was utilized as a starting point to establish a basic impeller configuration. Further modifications, such as changes to the blade shape, thickness distribution, and blade angles, were made using ANSYS BladeGen 2022 R2.
Several impeller designs underwent sizing and evaluation through CFD analysis. However, certain designs did not meet the required standards and were ultimately discarded even after attempts were made to enhance their performance through modifications. Figure 2 illustrates the configurations that yielded satisfactory outcomes concerning pressure augmentation and impeller efficiency, while also showcasing some of the key geometric characteristics of the impeller. One of the primary objectives of these simulations was to prevent cavitation and flow detachment from the impeller blades.
The primary differences between the impeller cases were the blade shape, thickness, number of blades, and blade angles. Case (I) had a bulbous trailing edge to prevent flow detachment in the outlet region, and the results met the pump requirements without needing an additional splitter to prevent flow detachment. Cases (II) and (III) produced higher pressure losses, due to boundary layer detachment from the impeller blades. Case (V) had a different blade profile compared to the other cases, utilizing a modified NACA (National Advisory Committee for Aeronautics) profile in the trailing edge area to prevent boundary layer detachment. Case (VI) was obtained through Cadence ANN optimization, utilizing Case (IV) as the baseline.
In the generation of the impeller design, the following aspects were taken into account:
- Meridional contouring was carried out in accordance with the technological possibilities and blade angle distributions (metal angles and rake angles);
- Blade count and beta distribution was correlated with the meridional contouring and the leading and trailing edge locations and curvatures;
- Thickness distribution was correlated with the beta distribution and were set according to manufacturing capabilities and streamline requirements in order to prevent flow separation and to avoid local pressure drop below the vaporization curve.
After the impeller’s geometry has been established, the next step was to prepare the case for computational analysis. The initial phase included specifying the mesh parameters tailored to the impeller. Subsequently, in the case setup stage, the initial conditions and boundary conditions were defined.
Upon analyzing the outcomes of the initial numerical simulations, several essential characteristics for modeling the impeller were identified, including the following:
- Extreme pinching was necessary to stabilize individuals in the database (with the side effect that some unstable cases did not crash and had to be removed by hand);
- Impellers were assessed at their trailing edge because of the blade wake;
- Hub and shroud surfaces needed to be trimmed before the vaneless diffuser because of their influence on torque and pressure ratio.
As the design approach necessitates the utilization of the full optimization process (i.e., hundreds of geometric variations for database generation, ANN training, and GA use of the ANN reduced order model), and because the individuals have very shallow outflow angles, a pinching was required in the vaneless diffuser. This pinch re-accelerates the fluid through-flow velocity, making the outflow angle more manageable and avoiding retarded flow-generated VDRS (vaneless diffuser rotating stall). This stabilized a sufficient number of individuals in order to create a composite database for the ANN training. The individuals were evaluated at the pinch outlet for the optimization process, as this was the only correct way (i.e., the measuring plane was free of any vortices and the distance from the trailing edge identical).
In Figure 3, the pinch strategies considered for the impeller modeling are mentioned and also used in the optimization process. Various VLD (vaneless diffuser) pinches were considered in order to minimize their influence on the overall rotor performance. However, the minimally invasive ones in the first design iterations turned out to be insufficient to stabilize the flow in the database variations. Therefore, the final pinch, although aggressive, is necessary in this particular design theme.
3.2. Pre-Processing
One important aspect of the pre-processing stage was given by the mesh generation and its characteristics. For Figure 2a–e, the mesh was created in ANSYS TurboGrid 2022 R2, while Figure 2f’s mesh was generated in Cadence/Autogrid due to the optimization process being conducted entirely in Cadence.
In order to avoid numerical errors caused by grid discretization, a grid independence study was performed involving five different mesh sizes (0.5, 1, 1.3, 2.7, and 5 million elements/channel). The meshes generated were aiming for a y+ close to one, in order to resolve the boundary layer. Metrics including total pressure rise coefficient, isentropic efficiency, outlet velocity, flow angle, and wall shear stress were analyzed across each mesh size (see Figure 4). A marginal deviation of 0.6% in the flow angle parameter was observed between the 1.3 million- and 2.6 million-element meshes, while variances in other parameters remained even lower. Furthermore, between 1 million and 1.6 million elements, the maximum deviation recorded was 0.378% for wall shear stress. These findings demonstrate the consistency of results across the three grid sizes, affirming the 1.3 million-element mesh as optimal for the investigated scenario.
Figure 5 presents one of the impeller’s meshes, emphasizing the leading and trailing edges. The maximum y+ distribution on the impeller blades and hub was two, obtained at the cut-off trailing edge, while the value on the blades was lower than one. Its representation on the impeller blades and hub is presented in Figure 6.
In terms of the CFD methodology for the impeller domain simulation, a counter rotating hub and shroud patch were defined at the blade trailing edge (see Figure 7). This was carried out to avoid the additional (parasitic) torque induced by end wall friction. The interface between the rotating and stationary domains is located on an outward radius, for stability reasons. However, the impeller performances were evaluated on a plane located at the blade trailing edge.
The computational analysis for the impellers was performed on one channel with rotational periodicity defined, and a mesh connection of 1:1. The blades were modeled as adiabatic walls with no slip, without surface roughness (machined surface). Turbulence was modeled using the k-ω SST (Shear Stress Transport) formulation with the streamline curvature acceleration corrections [35].
3.3. Turbulence Model Validation for the Optimized Impeller
Choosing an appropriate turbulence model to determine the fluid flow structure and impeller performances for the case studied represents a complex challenge. Therefore, seven turbulence models were selected to simulate the flow in the pump, one-equation models (Baldwin–Lomax model, Spalart–Allmaras model), two-equation models (k-epsilon, Shear Stress Transport, Wilcox k-ω model, and v2-f), and the Reynolds stress model.
Numerical simulations were performed for steady-state RANS, using Cadence Fine Turbo software. The grid quality was evaluated through y+ distribution ~1 unit, as well as skewness and growth ratio metrics. To achieve this value, near the blade surfaces, inflation layers were added to capture properly the flow structure. The grid generated was structured with a value of 1.3 million nodes. In Figure 8, one can observe the y+ distribution for the hub and blades, the overall value being less than three, which jumps when the wall becomes stationary.
Boundary conditions were applied to the inlet domain (setting total pressure and total temperature) and the outlet domain (setting mass flow), while the walls were treated as adiabatic with no-slip conditions. All numerical studies were one passage simulations with periodic interfaces.
Figure 9 presents the friction coefficient distribution for the turbulence models with the highest impact on the performances, namely the following: Spalart–Allmaras – rotation correction (SA-RC) (a), k-ω Shear Stress Transport (b), and k-epsilon standard (c). Primarily due to friction coefficient influence on the pinched vaneless diffuser, it was determined in this case study that the most conservative estimation of the head and efficiency was obtained with the Spalart–Allmaras model.
The outlier models were the one-equation ones (the Spalart–Allmaras and Baldwin–Lomax models), both of which underrated the velocity and flow angle of the impeller domain (see Figure 10). This is coupled with the overrating of the friction coefficient by the two models.
When evaluating the performances in terms of static and total pressure (see Figure 11a,b) in the impeller outlet area, again the outliers are the one-equation models; however, it is remarkable that the k-epsilon and SST models are closer to each other than the SST and Wilcox k-ω. This would suggest that the phenomena (and their modelling) of the far field region (rather than near-wall) flow are dominant in the bladed part of the pump.
The most pessimistic model appears to be the SA; however, this is of little help, since its implementation in CFX is still unstable for this particular case study.
Figure 12 presents the pump impeller performances reported as torque (a) and efficiency (b). As can be seen, the torque alone has a much tighter distribution across the turbulence models used here, when compared with the efficiency estimation. This stems from the very wide discrepancies in the pressure estimation.
At this particular Reynolds and Taylor number range, apparently conventional RANS turbulence models are not as accurate as they typically are. It is interesting to see that, for the bladed part, the SA and Baldwin–Lomax models give higher viscous losses (and so lower head) than the RSM (Reynolds stress model) and the two-equations models (k-epsilon and SST). This is not typical, because SA and SST should be more similar to each other in their results, since they resolve the boundary layer. The observation here is that the grouping of the single equation models is quite far from all other models. This will definitely require further attention.
The one-equation turbulence models are less computationally demanding and, in particular, SA is typically considered to be of similar accuracy to the SST model. However, in this particular case study, it was found that this assumption does not hold. Moreover, a comparison against the RSM results revealed that both one-equation models were outliers from the rest of the group. Therefore, the model used in the optimization process was the SST, which provided the best balance between robustness and computational effort.
3.4. Optimization Process
The optimization process of the pump impeller was carried out using Cadence FINE™/Design3D v16 software. Figure 13 presents the steps necessary to optimize an impeller, starting from the baseline case and ending with the validation process through numerical simulation. The main geometrical parameters of the baseline case (case IV) subjected to the optimization process are reported in Table 2.
The relations between the geometric variations and flow parameters were analyzed with an artificial neural network. Those correlations were used to upgrade the low-order model which was used instead of the CFD fully viscous RANS computations. It was acknowledged that low-order models were initially imprecise, and, therefore, the precision improved with a larger data set. All design loop iterations that ran as part of the optimization verification step were added to the original database, increasing its resolution primarily in the space where either the error was misleadingly optimistic or where the global optimum really existed. With each new addition to the database, the precision increased, making the ANN capable of predicting the OF almost identically to the 3D RANS CFD—note that this was restricted only to the parameters that feed into the objective function, not other flow parameters.
Figure 14 presents the blade fitting process as an iterative loop that executes until the parametric model obtained is considered satisfactory by the designer. Parameterized fitting was the basis of the impeller shape optimization design. It includes the definitions of meridional curve, stream surface, 2D blade profile, the camber line, pressure, and suction surface. After parameterization, the DoE database is generated by Cadence FINE™/Design3D v16.
The optimal result was evaluated by the OF. This will be the sole discriminant between the impellers (in the first step of the process) and the stages (for the final designs, where each impeller has its own tailored volute).
The target of the optimization process and some important aspects observed through the process are mentioned below:
- The main blade was allowed to vary 5% for each of the six points defining the beta distribution (three on hub, three on shroud);
- The goal was to reach 100% efficiency (i.e., maximize efficiency) by targeting the nominal pressure difference while setting the nominal mass flow as a boundary condition;
- The database of surviving individuals with Latin hypercube was 61/200 and with Optimal D was 16/50 sampling methods (even with very few free parameters and a highly pinched diffuser);
- In all databases, a number of 85 converged individuals were obtained (with a minimum of 36 was recommended by Cadence for this number of free parameters).
The results were assessed and it was determined if the OF had been effective and if the sampling method, number of samples, variation intervals, and stop criteria needed to be updated. Another aspect was to eliminate the geometric free parameters, which did not have a strong enough correlation with either flow parameter in the OF. This allowed for more samples per geometric parameter and, therefore, a better-quality low-order model.
The Pearson coefficient was calculated based on the interpretation of the database generated, linking all geometric free parameters to the flow field parameters which were assumed may go into the penalty function (see Table 3).
The expression for calculating the Pearson correlation coefficient between two variables x and y with sample sizes n is as follows:
where xi and yi are individual data points, and and are the means of the x and y variables.
This coefficient serves as a measure of the linear relationship between two variables, with values falling within the range of −1 to 1. A value of 1 indicates a perfect positive linear relationship, −1 indicates a perfect negative linear relationship and indicates no linear relationship.
The conditions of the penalty function are presented in Equations (2) and (3), as follows:
where p2 and p1 are the total pressure at the pump inlet and outlet, respectively; is the liquid density; g is the gravitational acceleration; H is the head; Q is the volumetric flow; and P is the power.
Both sub-functions have equal weight (50%–50%) in the final penalty function. The first sub-function is the embodiment of the hardline requirement, of minimal head. The 100% efficiency target is actually the function “maximize”, not an expectation of zero operational losses.
Table 3 and Table 4 describes the correlation between the parameters involved in the optimization process. The data underwent post-processing in Microsoft Excel, employing conditional formatting based on their values. The color spectrum spanned from blue to red, with blue denoting the lowest value and red representing the highest. In Pearson correlations, positive values signify that, as one variable increases, the other variable correlated with it also increases in a perfectly linear fashion. From both tables, it can be seen that, primarily, the efficiency correlated positively with the peripheral camber points, whereas the absolute total pressure correlated positively with the first camber point. Both were consistent with the “dogma” of incidence and backsweep angles; however, it was important to know in this particular case the exact numbers behind the correlations, in order to generate the reduced order surrogate model.
3.4.1. Valid Impeller Baseline Pool
After defining multiple impellers, from the entire pool of impellers generated, the ones that had higher performances and fulfilled the objective function conditions were selected for further optimization. The optimization process was conducted using Cadence software (https://www.cadence.com/en_US/home/support/software-downloads.html, accessed on 15 June 2023) and the artificial neural network technique. The ANN optimization was based on the two following pillars: one set of variables that fully described the geometry of the blades and one penalty function which described the requirements from the user.
While the latter could easily be changed when re-iterating the optimization process, the former required a balance between the number of free parameters (degrees of freedom) and their variation interval. Three categories of free parameters were used here, across multiple databases where the variation intervals were iteratively increased, so that the meshing phase had a good “survivability” rate. The free parameters were the meridional x radius vs. theta coordinates, designated Camber_H, which was the equivalent of the theta parameter, maintaining the MxR (meridional direction x radial location) position. The splitter and main blades were made independent. The secondary parameters were the half-thickness distributions, with a variation interval of 1% in some databases and up to 4% in other databases used. Half-thickness also maintained the MxR position and main splitter independence. Lastly, the number of blade passages varied between four and seven passages.
When using the Latin hypercube sampling, a good rule of thumb is to have at least three samples per DoF (degree of freedom). This requirement is a minimal number for the logic of the post-processor when developing the reduced order model that will serve as a surrogate CFD. However, in this case, it was observed that due to the high blade set angles and skewness, this relatively low number of samples led to failed mesh or failed CFD runs. There are two fixes for this problem, which follow: (1) reduce the variation intervals and (2) increase the number of samples per degree of freedom.
For the blade parametrization, because the end wall definition was very case-specific and the blade skewness was highly dependent on it, it was opted to “freeze” the hub and shroud. That is, the two end walls are described by a high number of points, but none of them will be allowed to vary, i.e., they will not constitute DoFs. On the other hand, blades—particularly the ones with curved leading edges—have multiple blade-to-blade cross sections which are, themselves, described by in-depth variables. In fact, most of the degrees of freedom refer to the blade setting angles and thickness distribution.
3.4.2. Refinement of the Objective Function
Following the impeller barebone design validation with fully viscous 3D RANS, a “pool of baseline impellers” was put together. From this pool, candidates were selected to undergo an optimization process, using similar fully viscous 3D RANS evaluation and various improvement methods. These methods included an initial user/designer improvement by hand-tailoring the blades and end walls to eliminate cavitation regions, high speed/high shear regions, and attached and thorough going vortices inside the impeller. After this hand-tailoring, a decision was made regarding whether or not an ANN/GA optimization process was required. The cut-off would be at around 92% impeller efficiency (hydraulic, without seals), since, from previous experience, an optimized impeller never surpassed 93%. If the performance was deemed sufficient, the impeller could move forward to volute matching.
It is worth noting that priority was given to rotors without splitters, as friction losses make up a larger than usual part of the total losses. Also, outflow velocity and angle were hardline criteria (go/no go), since they can lead to cavitation and stall, respectively. If the case arose that, for whatever reason, the first (most promising impeller) was unfit for the whole assembly (e.g., a volute design could not be created without significant losses or the experiment invalidated the results), the next most-promising impeller was passed through the same process.
Various typologies of rotors were tested using CFD, leading to the conclusion that viscous losses had a very important contribution to total pressure loss. Hence, the concept of increasing the blade surface area (by adding splitters or blades) turned out to be counterproductive, as this did not lead to a significant reduction in rotor diameter. Also, it was observed that flow velocity magnitude should be minimized where possible—i.e., the bladed area where the risk of flow angles degenerating into AIRS (abrupt impeller rotating stall) was limited.
Thickness distribution was tested with the “NACA’’ configuration, and the result suggested that, at this high backsweep angle, a NACA thickness distribution was not very effective. In this particular case, the cut-off chord percentage was very high—making the leading edge essentially the only region where the thickness distribution was significantly different than that used by the other rotors. Even so, it did have a positive impact, however small.
3.5. Post-Processing
After meeting the convergence criteria, the results were post-processed using Ansys CFX-Post. Figure 15 presents the results used to assess pump performance. Case (I) demonstrated a uniform static pressure distribution on the impeller channel without flow detachment from the impeller blades, as it can also be seen in the blade-to-blade view. The overall performance for this case fulfilled the minimum requirements of the pump.
Cases (II) and (III), from Figure 2, depicted more intricate impeller geometries in terms of blade shape and number of splitters (two or three splitters). The pressure losses for these two configurations were higher than in the other cases, and flow detachment was also visible in the vector field representation in Figure 15b. Geometries from Cases (IV) to (VI) were enhanced through numerous iterations involving changes in the blade shape, thickness, outlet angle, etc., or by using ANN optimization (Case (IV)). The objective of each iteration was to avoid flow detachment, reduce pressure losses, and achieve higher isentropic efficiency.
Figure 16 and Figure 17 provide further details on the impeller Cases (IV) to (VI) results, showcasing their flow characteristics through total pressure and velocity distribution. The blade-to-blade and meridional views illustrate the fluid flow pattern, with velocity and vector fields depicting possible flow detachment from the blade. Case (V) displayed a more uniform total pressure distribution on the trailing edge area along the blade height, leading to a significantly higher total pressure, compared to Cases (IV) and (VI).
Figure 18 and Figure 19 summarize the performance results of the studied impellers in terms of pressure increase and isentropic efficiency. In terms of pressure, all configurations achieved the required pressure increase. However, when comparing the efficiency of the six cases, the differences between them were significant, ranging from a minimum of 0.751 to a maximum of 0.933 for Case VI. The high efficiency of Case VI was achieved through the optimization process, which aimed to increase efficiency while ensuring the necessary pressure increase for the pump application.
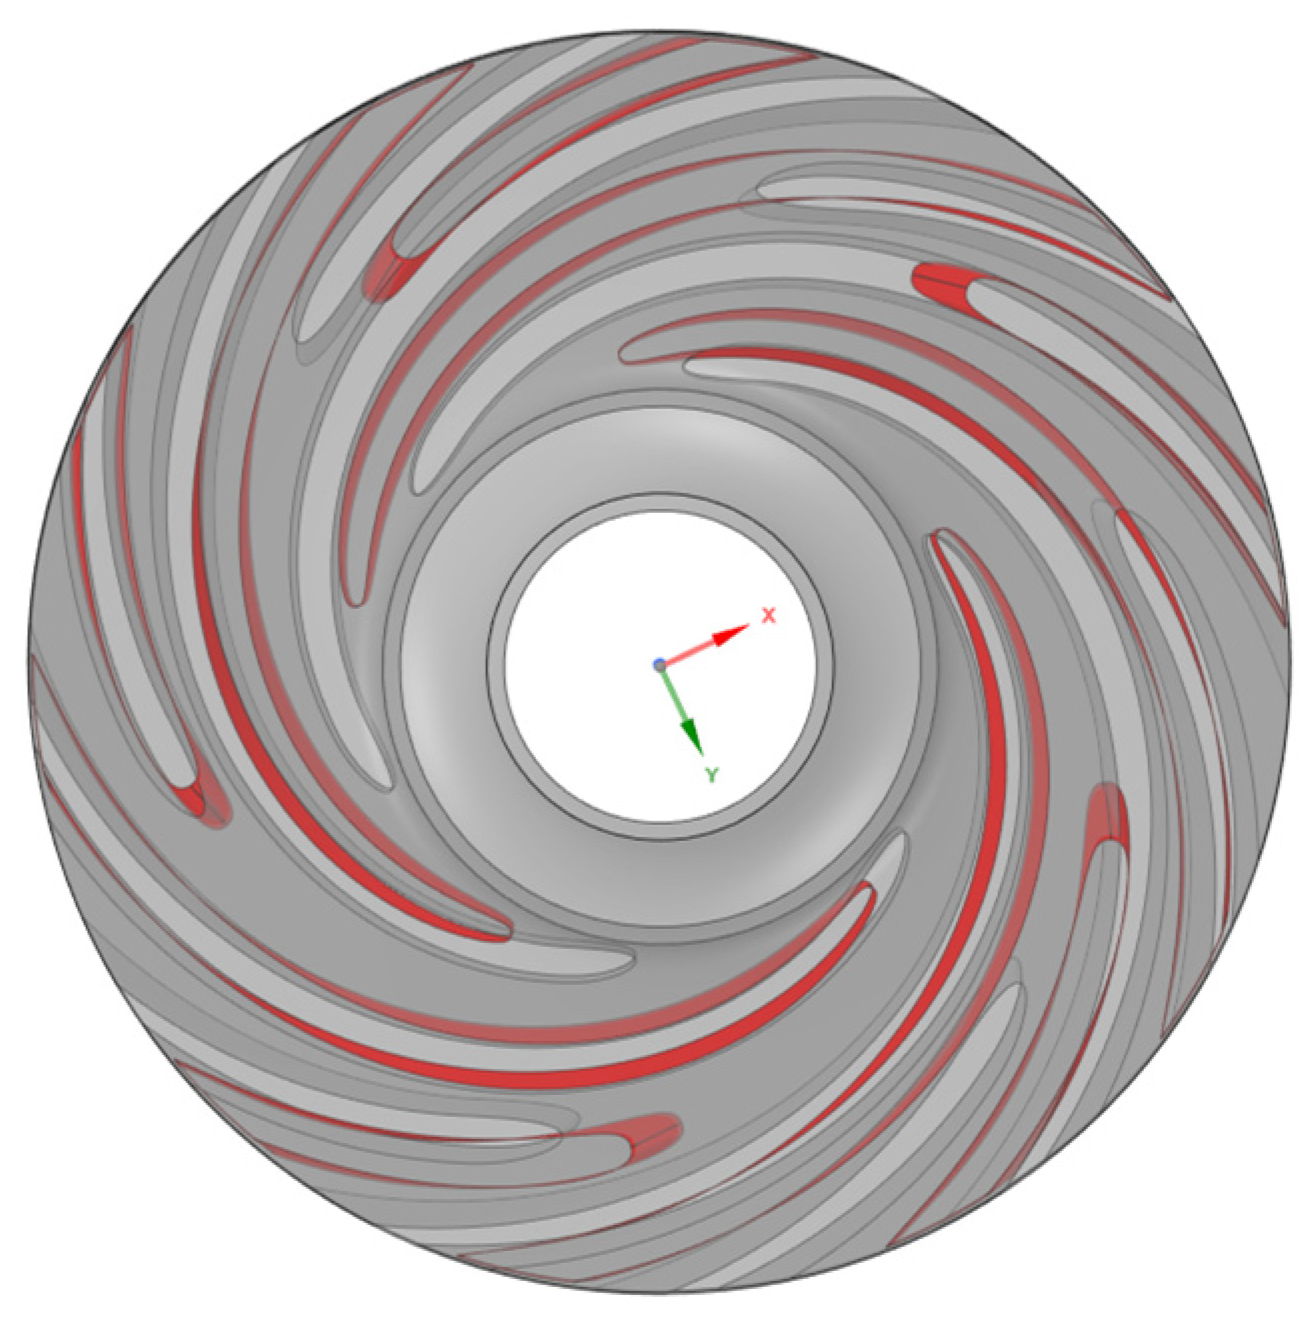
Figure 20 illustrates the contrast between the baseline (Case IV) and optimized (Case VI) performances in terms of isentropic efficiency, revealing a discrepancy of approximately 3%. This variance was attributed to modifications in blade geometry, beta distribution, rake angle, thickness distribution, and other factors. Additionally, Figure 21 illustrates the overlay of the two cases, highlighting the discrepancies in blade geometry (red —optimized case, gray—baseline case).
4. Conclusions
In this paper, the design optimization of a centrifugal pump via ANN models was presented. It involved shape optimization of the impeller, with the main objective of maximizing the pump efficiency and ensuring a uniform pressure distribution at the impeller outlet. The baseline geometry was obtained through an iterative process, involving changes on the blade shape, thickness distribution, and blade angles.
The feasibility of the impeller was verified through CFD simulations conducted using Ansys CFX (https://www.ansys.com/academic/students, accessed on 15 June 2023) and Cadence/Numeca (https://www.numeca.de/en/, accessed on 15 June 2023) software packages. All the numerical simulations conducted followed a steady-state RANS approach, combined with the k-ω SST turbulence model.
Utilizing the ANN-based optimization procedure allowed for a more thorough exploration of the design space, facilitating the discovery of the globally optimal solution according to the specified objectives. In the studied application, it was established that impeller performance was notably affected by factors such as peripheral camber points, incidence angles, and backsweep angles. In the case of the best geometry (referred to as case VI), both head and efficiency exhibited significant improvements compared to the baseline case (case IV), showing enhancements of 7.9% and 3.55%, respectively. The optimized impeller geometry also featured substantial alterations in the blade profile.
As part of future work, there is a plan to manufacture the optimized pump and, subsequently, compare the experimental data with the CFD results. This step will provide a valuable opportunity to validate the computational findings and ensure the practical performance of the pump meets the anticipated standards.
Author Contributions
Conceptualization, V.D., O.D., C.D. and I.F.P.; methodology, V.D. and O.D.; software, V.D. and O.D.; validation, V.D., O.D. and C.D.; formal analysis, V.D. and O.D.; investigation, V.D. and O.D.; resources, V.D. and I.F.P.; data curation, V.D. and O.D.; writing—original draft preparation, O.D.; writing—review and editing, V.D., C.D. and I.F.P.; visualization, V.D. and O.D.; supervision, V.D. All authors have read and agreed to the published version of the manuscript.
Funding
This research was funded by the “Nucleu” Program, part of the National Plan for Research, Development and Innovation 2022–2027, carried out with the support of the Romanian Ministry of Research, Innovation and Digitalisation, project no. PN 23.12.06.01.
Data Availability Statement
Data are contained within the article.
Conflicts of Interest
The authors declare no conflicts of interest. The funders had no role in the design of the study; in the collection, analyses, or interpretation of data; in the writing of the manuscript; or in the decision to publish the results.
Nomenclature
| liquid density | |
| f | function |
| g | gravitational acceleration |
| n | sample size |
| p | pressure |
| r | Pearson correlation coefficient |
| xi | individual data points |
| yi | individual data points |
| means of x variable | |
| means of y variable | |
| ANN | artificial neural networks |
| ATCS | active thermal control system |
| CAE | Computer-Aided Engineering |
| CFD | computational fluid dynamics |
| DoE | design of experiments |
| DoF | degree of freedom |
| DS | specific diameter |
| GA | genetic algorithms |
| H | head |
| M | meridional direction |
| NS | specific speeds |
| OF | objective function |
| OIP | optimized impeller pool |
| P | power |
| Q | volumetric flow |
| R | radial location |
| RANS | Reynolds-averaged Navier–Stokes |
| RSM | Reynolds stress model |
| SA | Spalart–Allmaras |
| SST | Shear Stress Transport |
| VIP | validated impeller pool |
| VDRS | vaneless diffuser rotating stall |
| VLD | vaneless diffuser |
References
- Choi, J.; Huh, H.; Ki, W. Technology and Development Trends of Small Launch Vehicles. J. Korean Soc. Propuls. Eng. 2020, 24, 91–102. [Google Scholar] [CrossRef]
- Kopacz, J.R.; Herschitz, R.; Roney, J. Small satellites an overview and assessment. Acta Astronaut. 2020, 170, 93–105. [Google Scholar] [CrossRef]
- van ES, J.; van Gerner, H.J.; van Bethem, R.C.; Lapensee, S.; Schwaller, D. Component Developments in Europe for Mechanically Pumped Fluid Loop Systems (MPLs) for Cooling Applications in Space. In Proceedings of the 46th International Conference on Environmental Systems, Vienna, Austria, 10–14 July 2016. [Google Scholar]
- Mugurusa, D.; Arner, M.; Patruski, C.; Adamson, G.; Hansen, H. Development of a Low Specific Speed, Centrifugal, Mini Pump for a Two Phase Mechanically Pumped Fluid Loop. In Proceedings of the 49th International Conference on Environmental Systems, Boston, MA, USA, 7–11 July 2019. [Google Scholar]
- Jia, X.; Chu, Q.; Zhang, L.; Zhu, Z. Experimental Study on Operational Stability of Centrifugal Pumps of Varying Impeller Types Based on External Characteristic, Pressure Pulsation and Vibration Characteristic Tests. Front. Energy Res. 2022, 10, 866037. [Google Scholar] [CrossRef]
- Cui, B.; Chen, D.; Xu, W.; Jin, Y.; Zhu, Z. Unsteady flow characteristic of low-specific-speed centrifugal pump under different flow-rate conditions. J. Therm. Sci. 2015, 24, 17–23. [Google Scholar] [CrossRef]
- Guleren, K. Automatic optimization of a centrifugal pump based on impeller–diffuser interaction. Proc. Inst. Mech. Eng. Part A J. Power Energy 2018, 232, 1004–1018. [Google Scholar] [CrossRef]
- Siddique, M.H.; Samad, A.; Hossain, S. Centrifugal pump performance enhancement: Effect of splitter blade and optimization. Proc. Inst. Mech. Eng. Part A J. Power Energy 2021, 236, 391–402. [Google Scholar] [CrossRef]
- Peng, G.; Hong, S.; Chang, H.; Zhang, Z.; Fan, F. Optimization design of multistage pump impeller based on response surface methodology. J. Theor. Appl. Mech. 2021, 59, 595–609. [Google Scholar] [CrossRef]
- Jaiswal, A.K.; Siddique, H.; Paul, A.R.; Samad, A. Surrogate-based design optimization of a centrifugal pump impeller. Eng. Optim. 2021, 54, 1395–1412. [Google Scholar] [CrossRef]
- Nguyen, V.T.T.; Vo, T.M.N. Centrifugal Pump Design: An Optimization. Eurasia Proc. Sci. Technol. Eng. Math. 2022, 17, 136–151. [Google Scholar] [CrossRef]
- Benturki, M.; Dizene, R.; Ghenaiet, A. Multi-Objective Optimization of Two-Stage Centrifugal Pump using NSGA-II Algorithm. J. Appl. Fluid Mech. 2018, 11, 929–943. [Google Scholar] [CrossRef]
- Wu, T.; Wu, D.; Gao, S.; Song, Y.; Ren, Y.; Mou, J. Multi-objective optimization and loss analysis of multistage centrifugal pumps. Energy 2023, 284, 128638. [Google Scholar] [CrossRef]
- Zhang, Y.; Hu, S.; Wu, J.; Zhang, Y.; Chen, L. Multi-objective optimization of double suction centrifugal pump using Kriging metamodels. Adv. Eng. Softw. 2014, 74, 16–26. [Google Scholar] [CrossRef]
- Shuiguang, T.; Hang, Z.; Huiqin, L.; Yue, Y.; Jinfu, L.; Feiyun, C. Multi-objective optimization of multistage centrifugal pump based on surrogate model. J. Fluids Eng. 2019, 142, 011101. [Google Scholar] [CrossRef]
- Bellary, S.A.I.; Samad, A. Improvement of Efficiency by Design Optimization of a Centrifugal Pump Impeller. In Proceedings of the ASME Turbo Expo 2014: Turbine Technical Conference and Exposition. Volume 2D: Turbomachinery, Düsseldorf, Germany, 16–20 June 2014. [Google Scholar] [CrossRef]
- Han, X.; Kang, Y.; Sheng, J.; Hu, Y.; Zhao, W. Centrifugal pump impeller and volute shape optimization via combined NUMECA, genetic algorithm, and back propagation neural network. Struct. Multidiscip. Optim. 2019, 61, 381–409. [Google Scholar] [CrossRef]
- Benamara, T. Full-Field Multi-Fidelity Surrogate Models for Optimal Design of Turbomachines. Ph.D. Thesis, Mechanics, Université de Technologie de Compiègne, Compiegne, France, 2017. NNT: 2017COMP2368 (In English). [Google Scholar]
- Westa, R.W. Inverse-Design and Optimization Methods for Centrifugal Pump Impellers. Master’s Thesis, University of Twente, Enschede, The Netherlands, 2008. [Google Scholar]
- Zhou, L.; Shi, W.; Wu, S. Performance Optimization in a Centrifugal Pump Impeller by Orthogonal Experiment and Numerical Simulation. Adv. Mech. Eng. 2013, 5, 385809. [Google Scholar] [CrossRef]
- Pei, J.; Wang, W.J.; Yuan, S.Q.; Zhang, J.F. Optimization on the Impeller of a Low-specific-speed Centrifugal Pump for Hydraulic Performance Improvement. Chin. J. Mech. Eng. 2016, 29, 992–1002. [Google Scholar] [CrossRef]
- Shim, H.-S.; Kim, K.-Y. Design Optimization of the Impeller and Volute of a Centrifugal Pump to Improve the Hydraulic Performance and Flow Stability. J. Fluids Eng. 2020, 142, 101211. [Google Scholar] [CrossRef]
- Qi, H.; Li, W.; Ji, L.; Liu, M.; Song, R.; Pan, Y.; Yang, Y. Performance optimization of centrifugal pump based on particle swarm optimization and entropy generation theory. Front. Energy Res. 2023, 10, 1094717. [Google Scholar] [CrossRef]
- Osman, M.K.; Wang, W.; Yuan, J.; Zhao, J.; Wang, Y.; Liu, J. Flow loss analysis of a two-stage axially split centrifugal pump with double inlet under different channel designs. Proc. Inst. Mech. Eng. Part C J. Mech. Eng. Sci. 2019, 233, 5316–5328. [Google Scholar] [CrossRef]
- Cao, J.; Pei, J.; Gu, Y.; Wang, W.; Yuan, S. Flow losses analysis in a mixed flow pump with annular volute by entropy production evaluation. IOP Conf. Ser. E Environ. Sci. 2019, 240, 032047. [Google Scholar] [CrossRef]
- Derakhshan, S.; Pourmahdavi, M.; Abdolahnejad, E.; Reihani, A.; Ojaghi, A. Numerical shape optimization of a centrifugal pump impeller using artificial bee colony algorithm. Comput. Fluids 2013, 81, 145–151. [Google Scholar] [CrossRef]
- Bellary, S.A.I.; Samad, A. Centrifugal Impeller Blade Shape Optimization Through Numerical Modeling. Int. J. Fluid Mach. Syst. 2016, 9, 313–324. [Google Scholar] [CrossRef]
- Siddique, M.H.; Afzal, A.; Samad, A. Design Optimization of the Centrifugal Pumps via Low Fidelity Models. Math. Probl. Eng. 2018, 2018, 3987594. [Google Scholar] [CrossRef]
- Siddique, H.; Mrinal, K.R.; Samad, A. Optimization of a Centrifugal Pump Impeller by Controlling Blade Profile Parameters. In Proceedings of the ASME TURBO EXPO 2016: Turbine Technical Conference and Exposition, Seoul, Republic of Korea, 13–17 June 2016. [Google Scholar]
- De Donno, R.; Fracassi, A.; Ghidoni, A.; Morelli, A.; Noventa, G. Surrogate-Based Optimization of a Centrifugal Pump with Volute Casing for an Automotive Engine Cooling System. Appl. Sci. 2021, 11, 11470. [Google Scholar] [CrossRef]
- ASME V V 20-2009; Standard for Verification and Validation in Computational Fluid Dynamics and Heat Transfer. Distributed through American National Standards Institute (ANSI): New York, NY, USA, 2009; ISBN 0791832090.
- Adiaconitei, A.; Vintila, I.S.; Mihalache, R.; Paraschiv, A.; Frigioescu, T.; Vladut, M.; Pambaguian, L. A Study on Using the Additive Manufacturing Process for the Development of a Closed Pump Impeller for Mechanically Pumped Fluid Loop Systems. Materials 2021, 14, 967. [Google Scholar] [CrossRef]
- 3M Novec 7200 Engineered Fluid. Available online: https://multimedia.3m.com/mws/media/199819O/3m-novec-7200-engineered-fluid-en.pdf (accessed on 15 June 2023).
- CFturbo Pump Design. Available online: https://cfturbo.com/software/pumps (accessed on 1 May 2023).
- Menter, F.; Kuntz, M.; Laugtry, R.B. Ten years of industrial experience with the SST turbulence model. In Turbulence, Heat and Mass Transfer; Begell House: Antalya, Turkey, 2003; Volume 4. [Google Scholar]
Figure 1.
Workflow for designing centrifugal pump components.

Figure 2.
Impeller geometries. (a) Case I—bulbous trailing edge; (b) Case II—impeller with three splitters; (c) Case III—impeller with two splitters and a bulbous trailing edge; (d) Case IV—constant thickness with the splitter off-center; (e) Case V—profile NACA thickness distribution optimization; (f) Case VI—impeller optimized with ANN (artificial neural network).
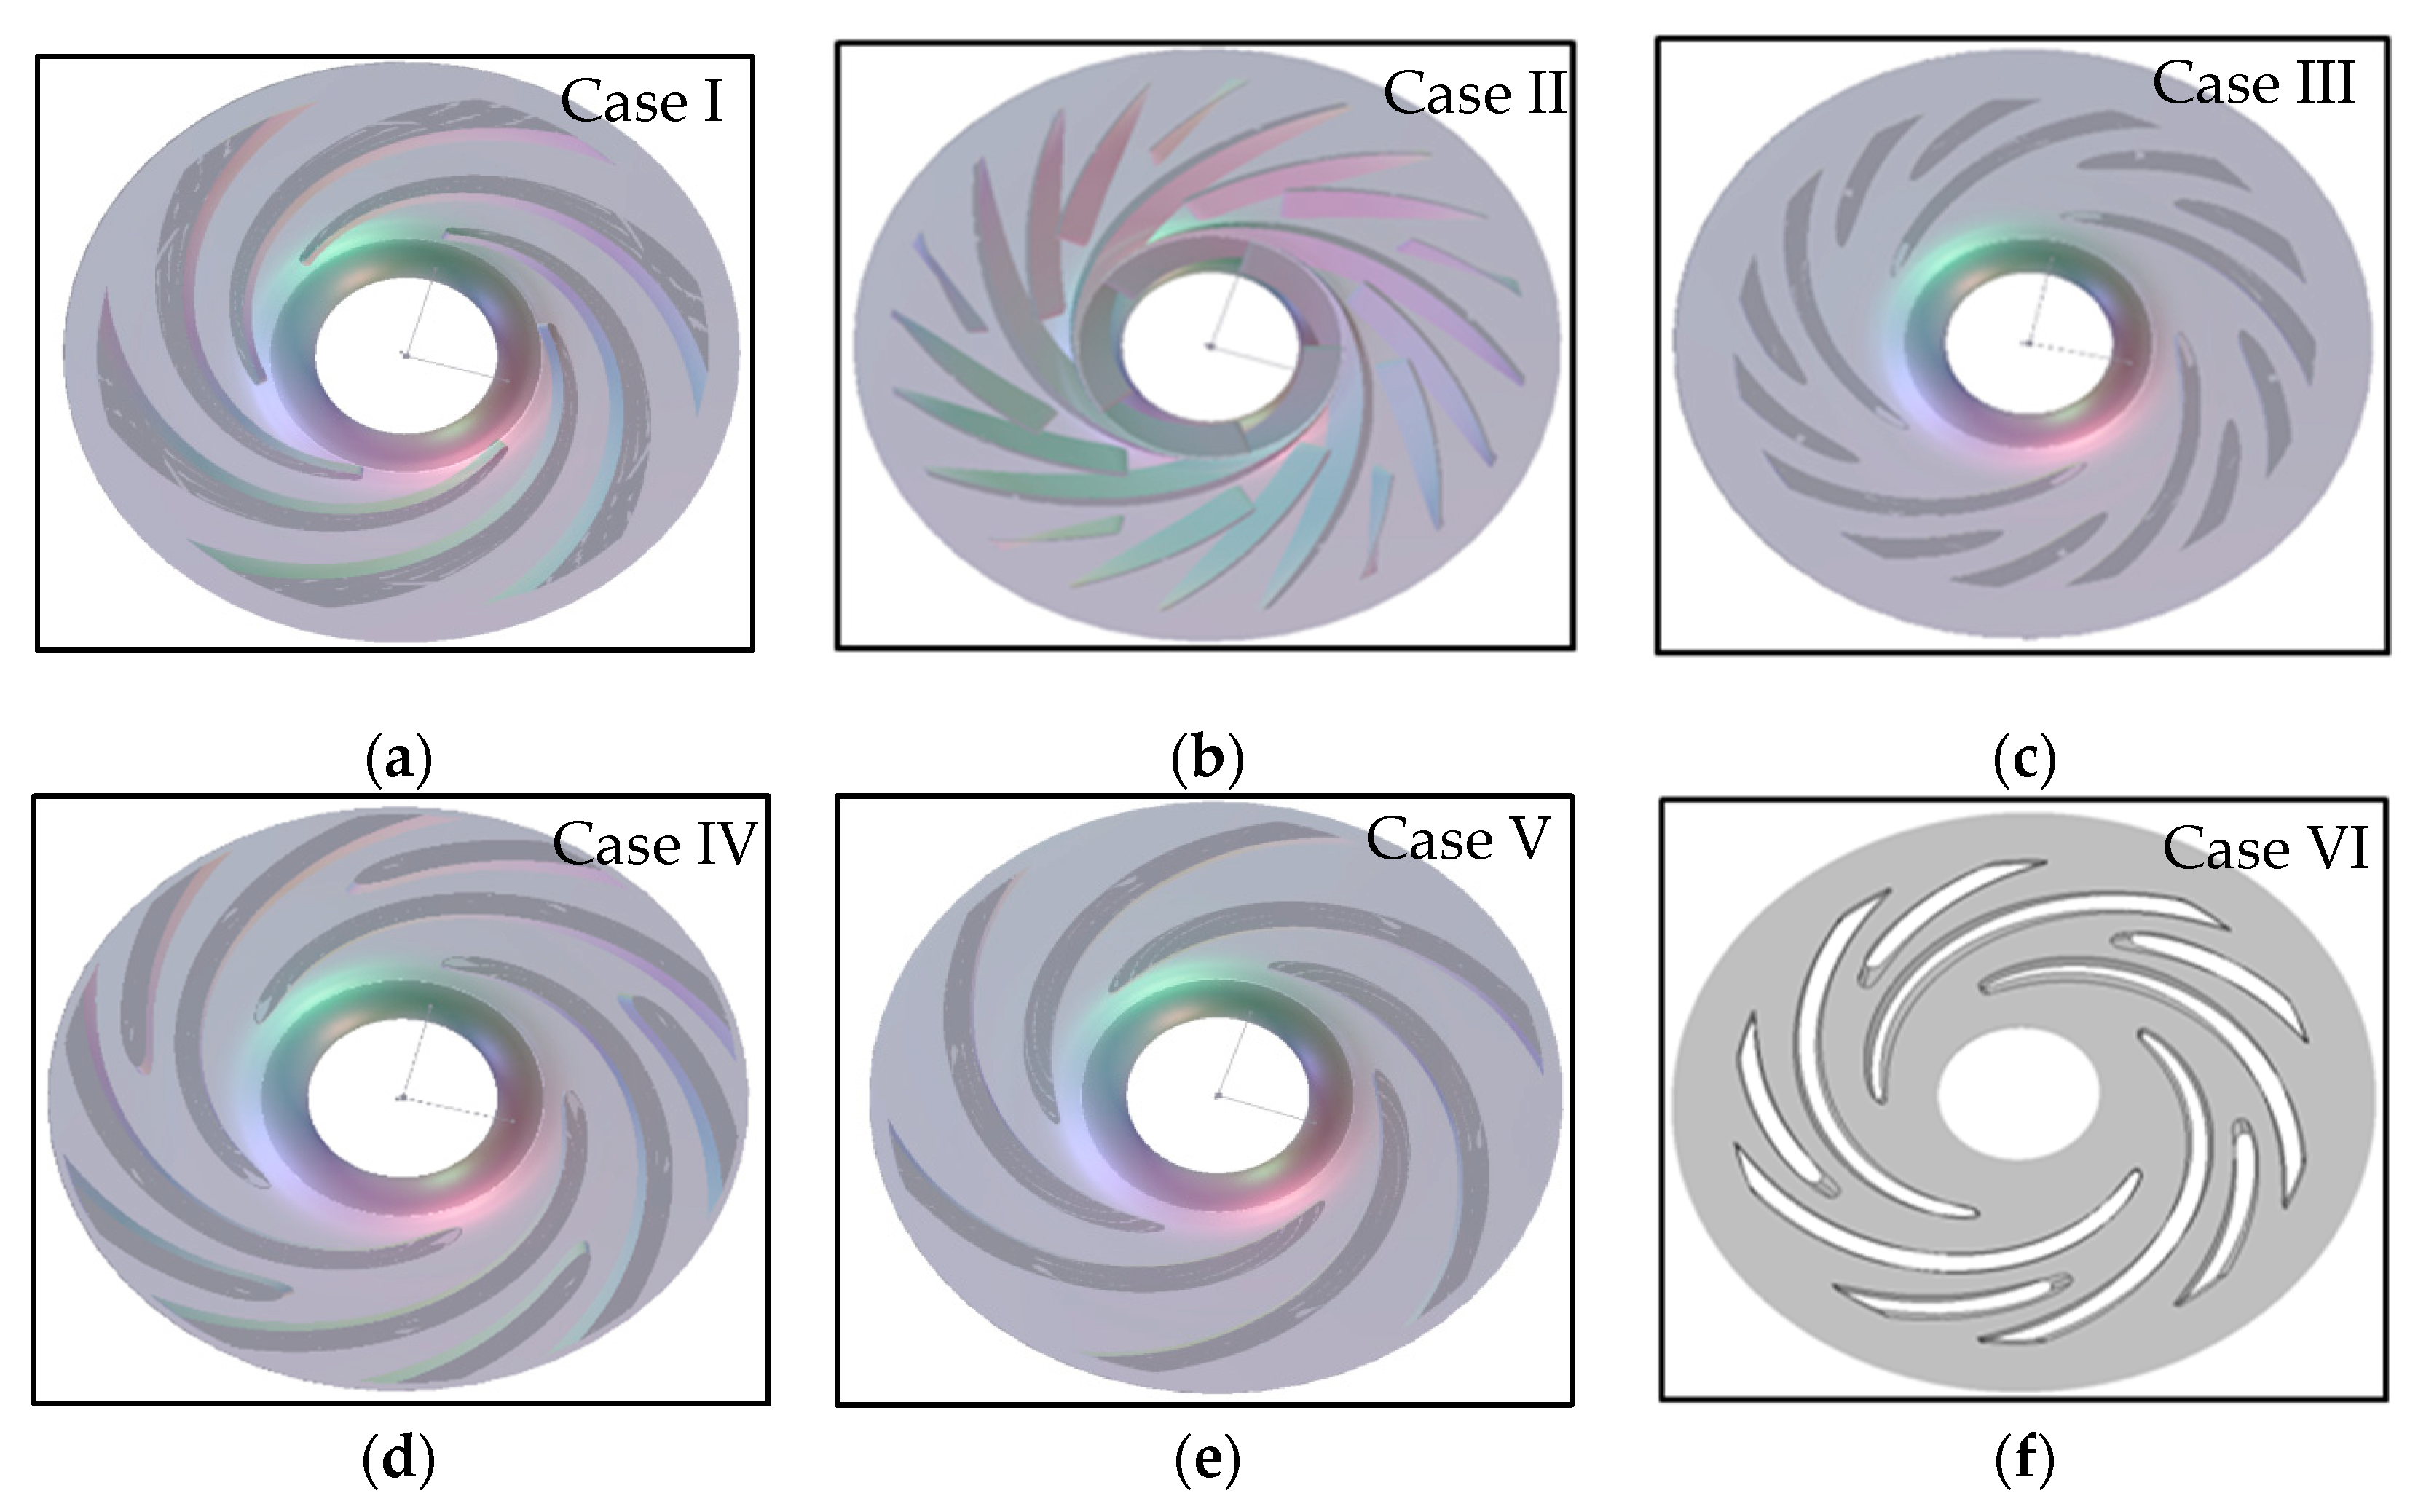
Figure 3.
Pinching strategies after the optimization process. (a) Original database pinch; (b) extended pinch iteration 1; (c) extended pinch iteration 2; (d) extended pinch iteration 3; (e) final pinch for optimization database.
Figure 3.
Pinching strategies after the optimization process. (a) Original database pinch; (b) extended pinch iteration 1; (c) extended pinch iteration 2; (d) extended pinch iteration 3; (e) final pinch for optimization database.

Figure 4.
Mesh independence study for the impeller (values are relative to the ones corresponding to the 1.3 million-cell mesh).
Figure 4.
Mesh independence study for the impeller (values are relative to the ones corresponding to the 1.3 million-cell mesh).
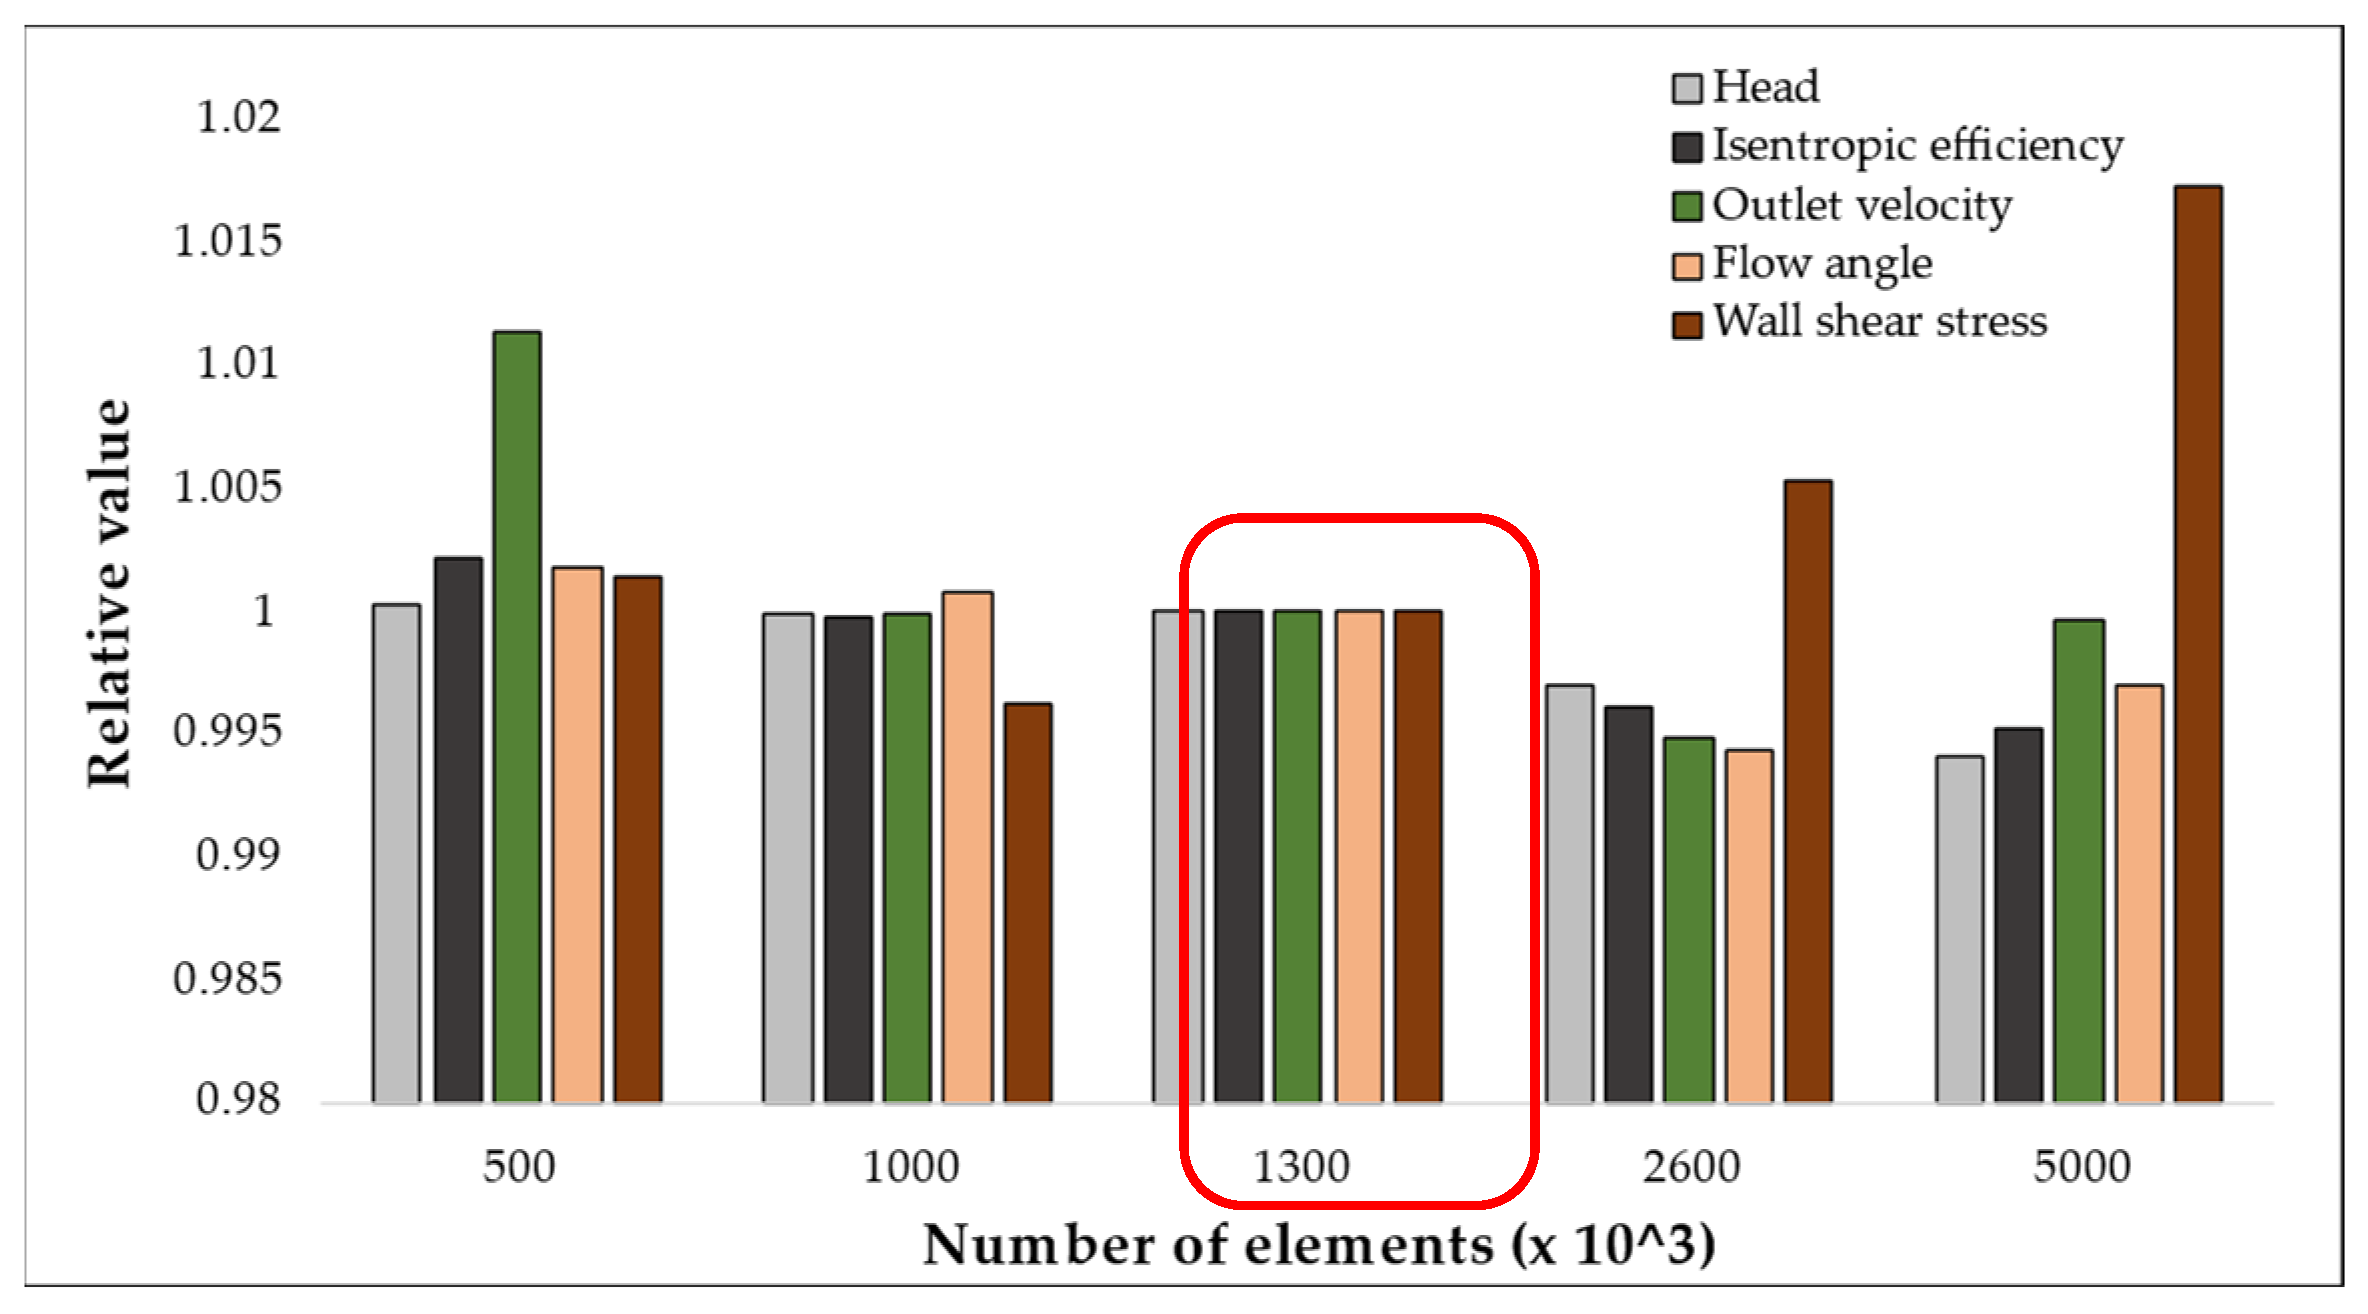
Figure 5.
Boundary layer mesh refinement (case V). (a) Leading edge; (b) trailing edge.

Figure 6.
The y+ distribution (case V).

Figure 7.
Definition of the stationary patch for CFX and Cadence analysis. (a) CFX—the stationary patch is independent; (b) Cadence—end wall rotation limitation (area rotation).
Figure 7.
Definition of the stationary patch for CFX and Cadence analysis. (a) CFX—the stationary patch is independent; (b) Cadence—end wall rotation limitation (area rotation).
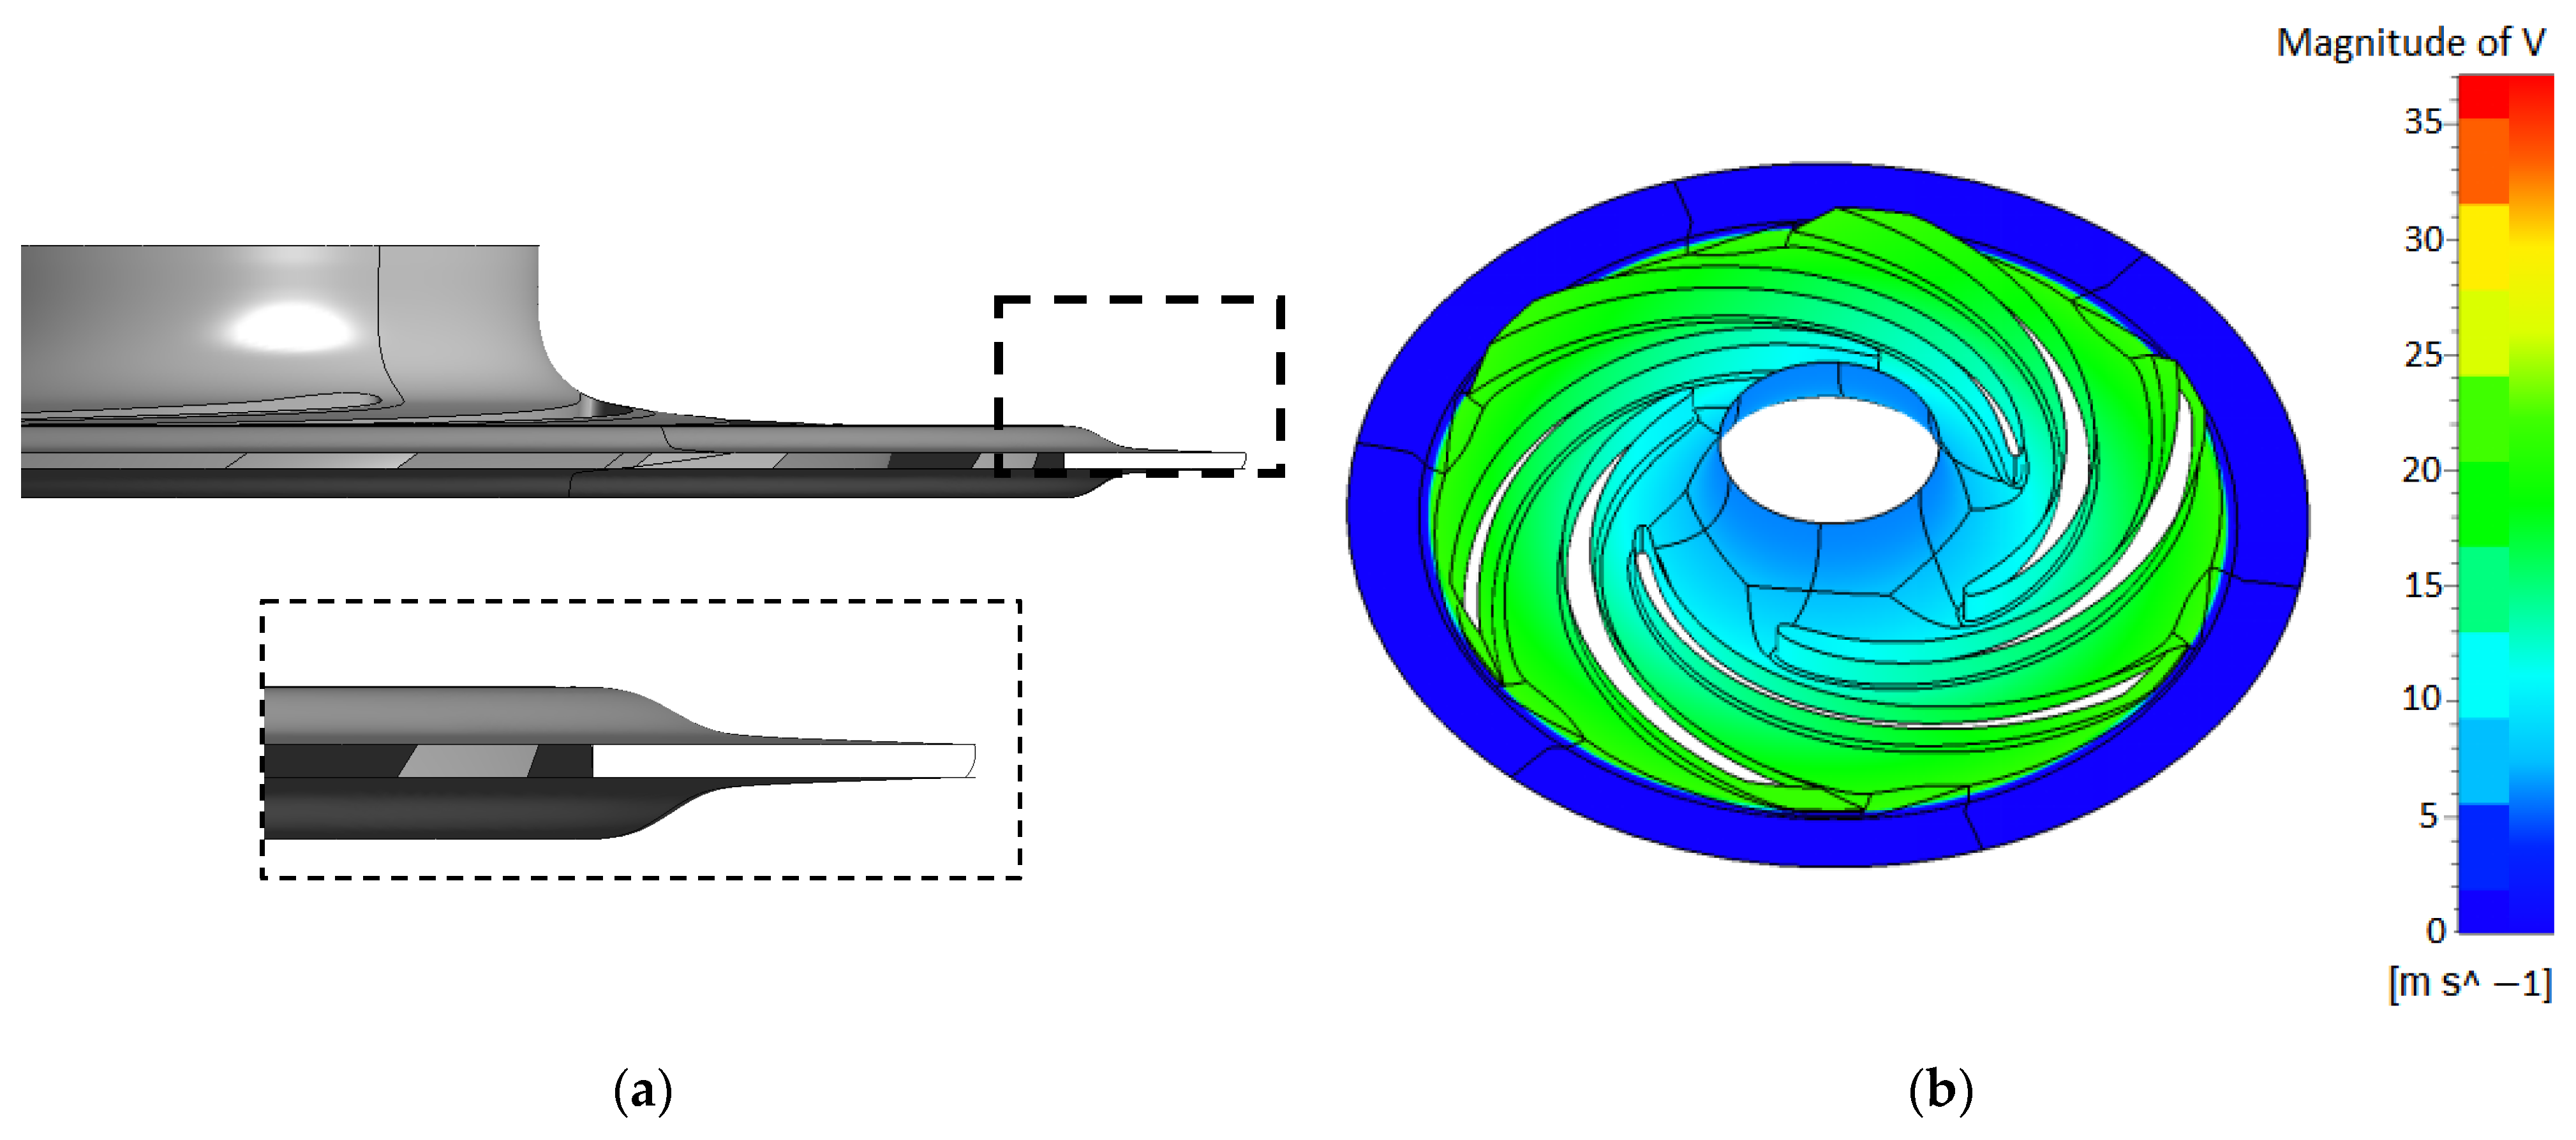
Figure 8.
The y+ distribution for the hub and impeller blade.
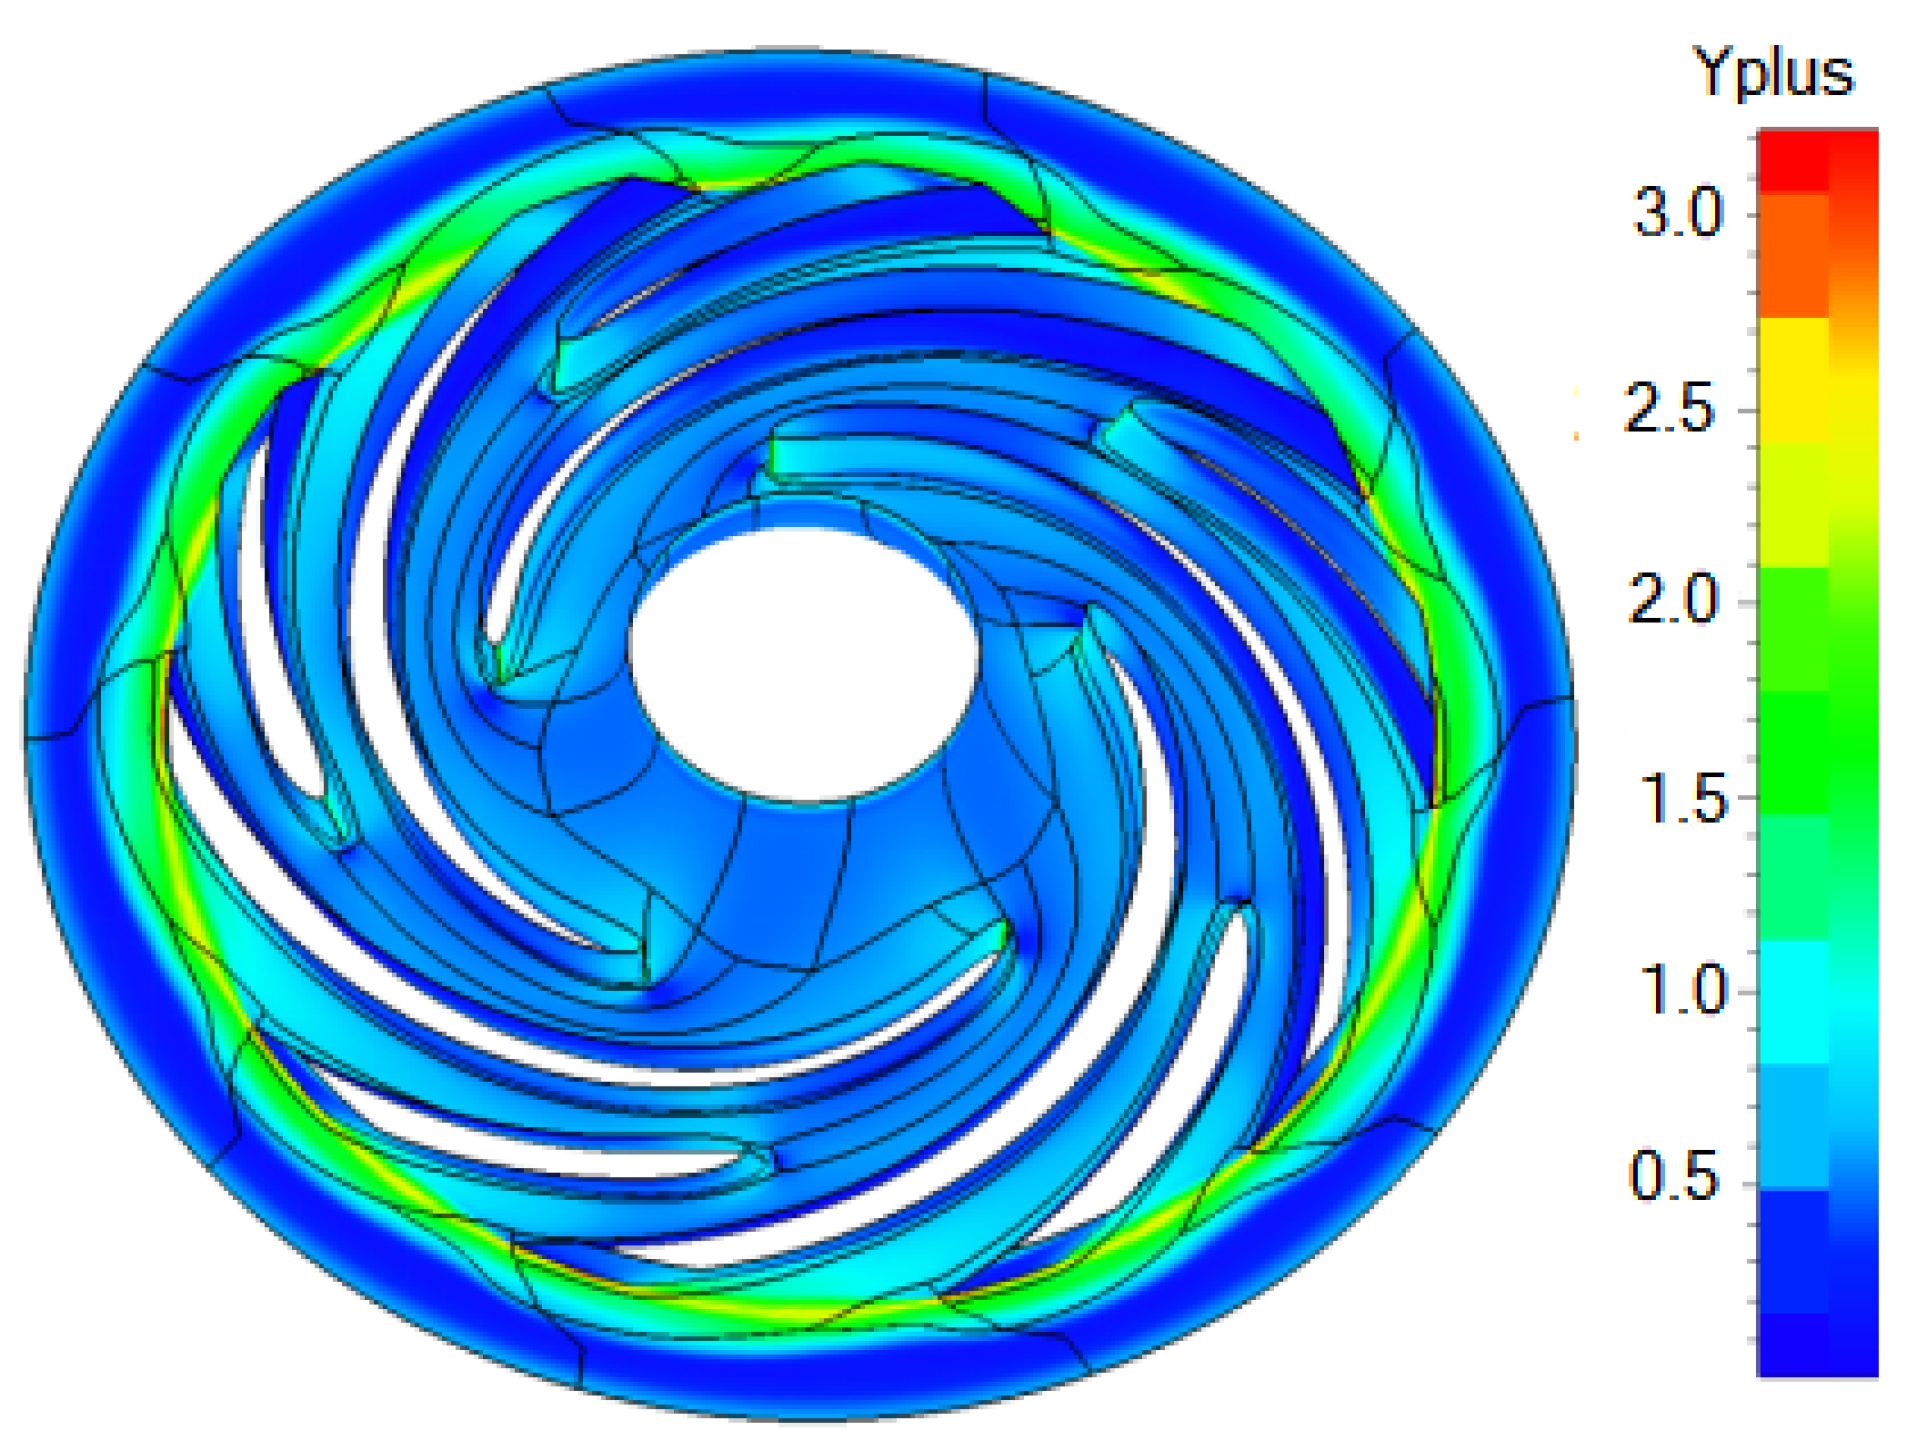
Figure 9.
Friction coefficient distribution on the impeller channel. (a) Spalart–Allmaras; (b) SST; (c) k–epsilon standard.
Figure 9.
Friction coefficient distribution on the impeller channel. (a) Spalart–Allmaras; (b) SST; (c) k–epsilon standard.
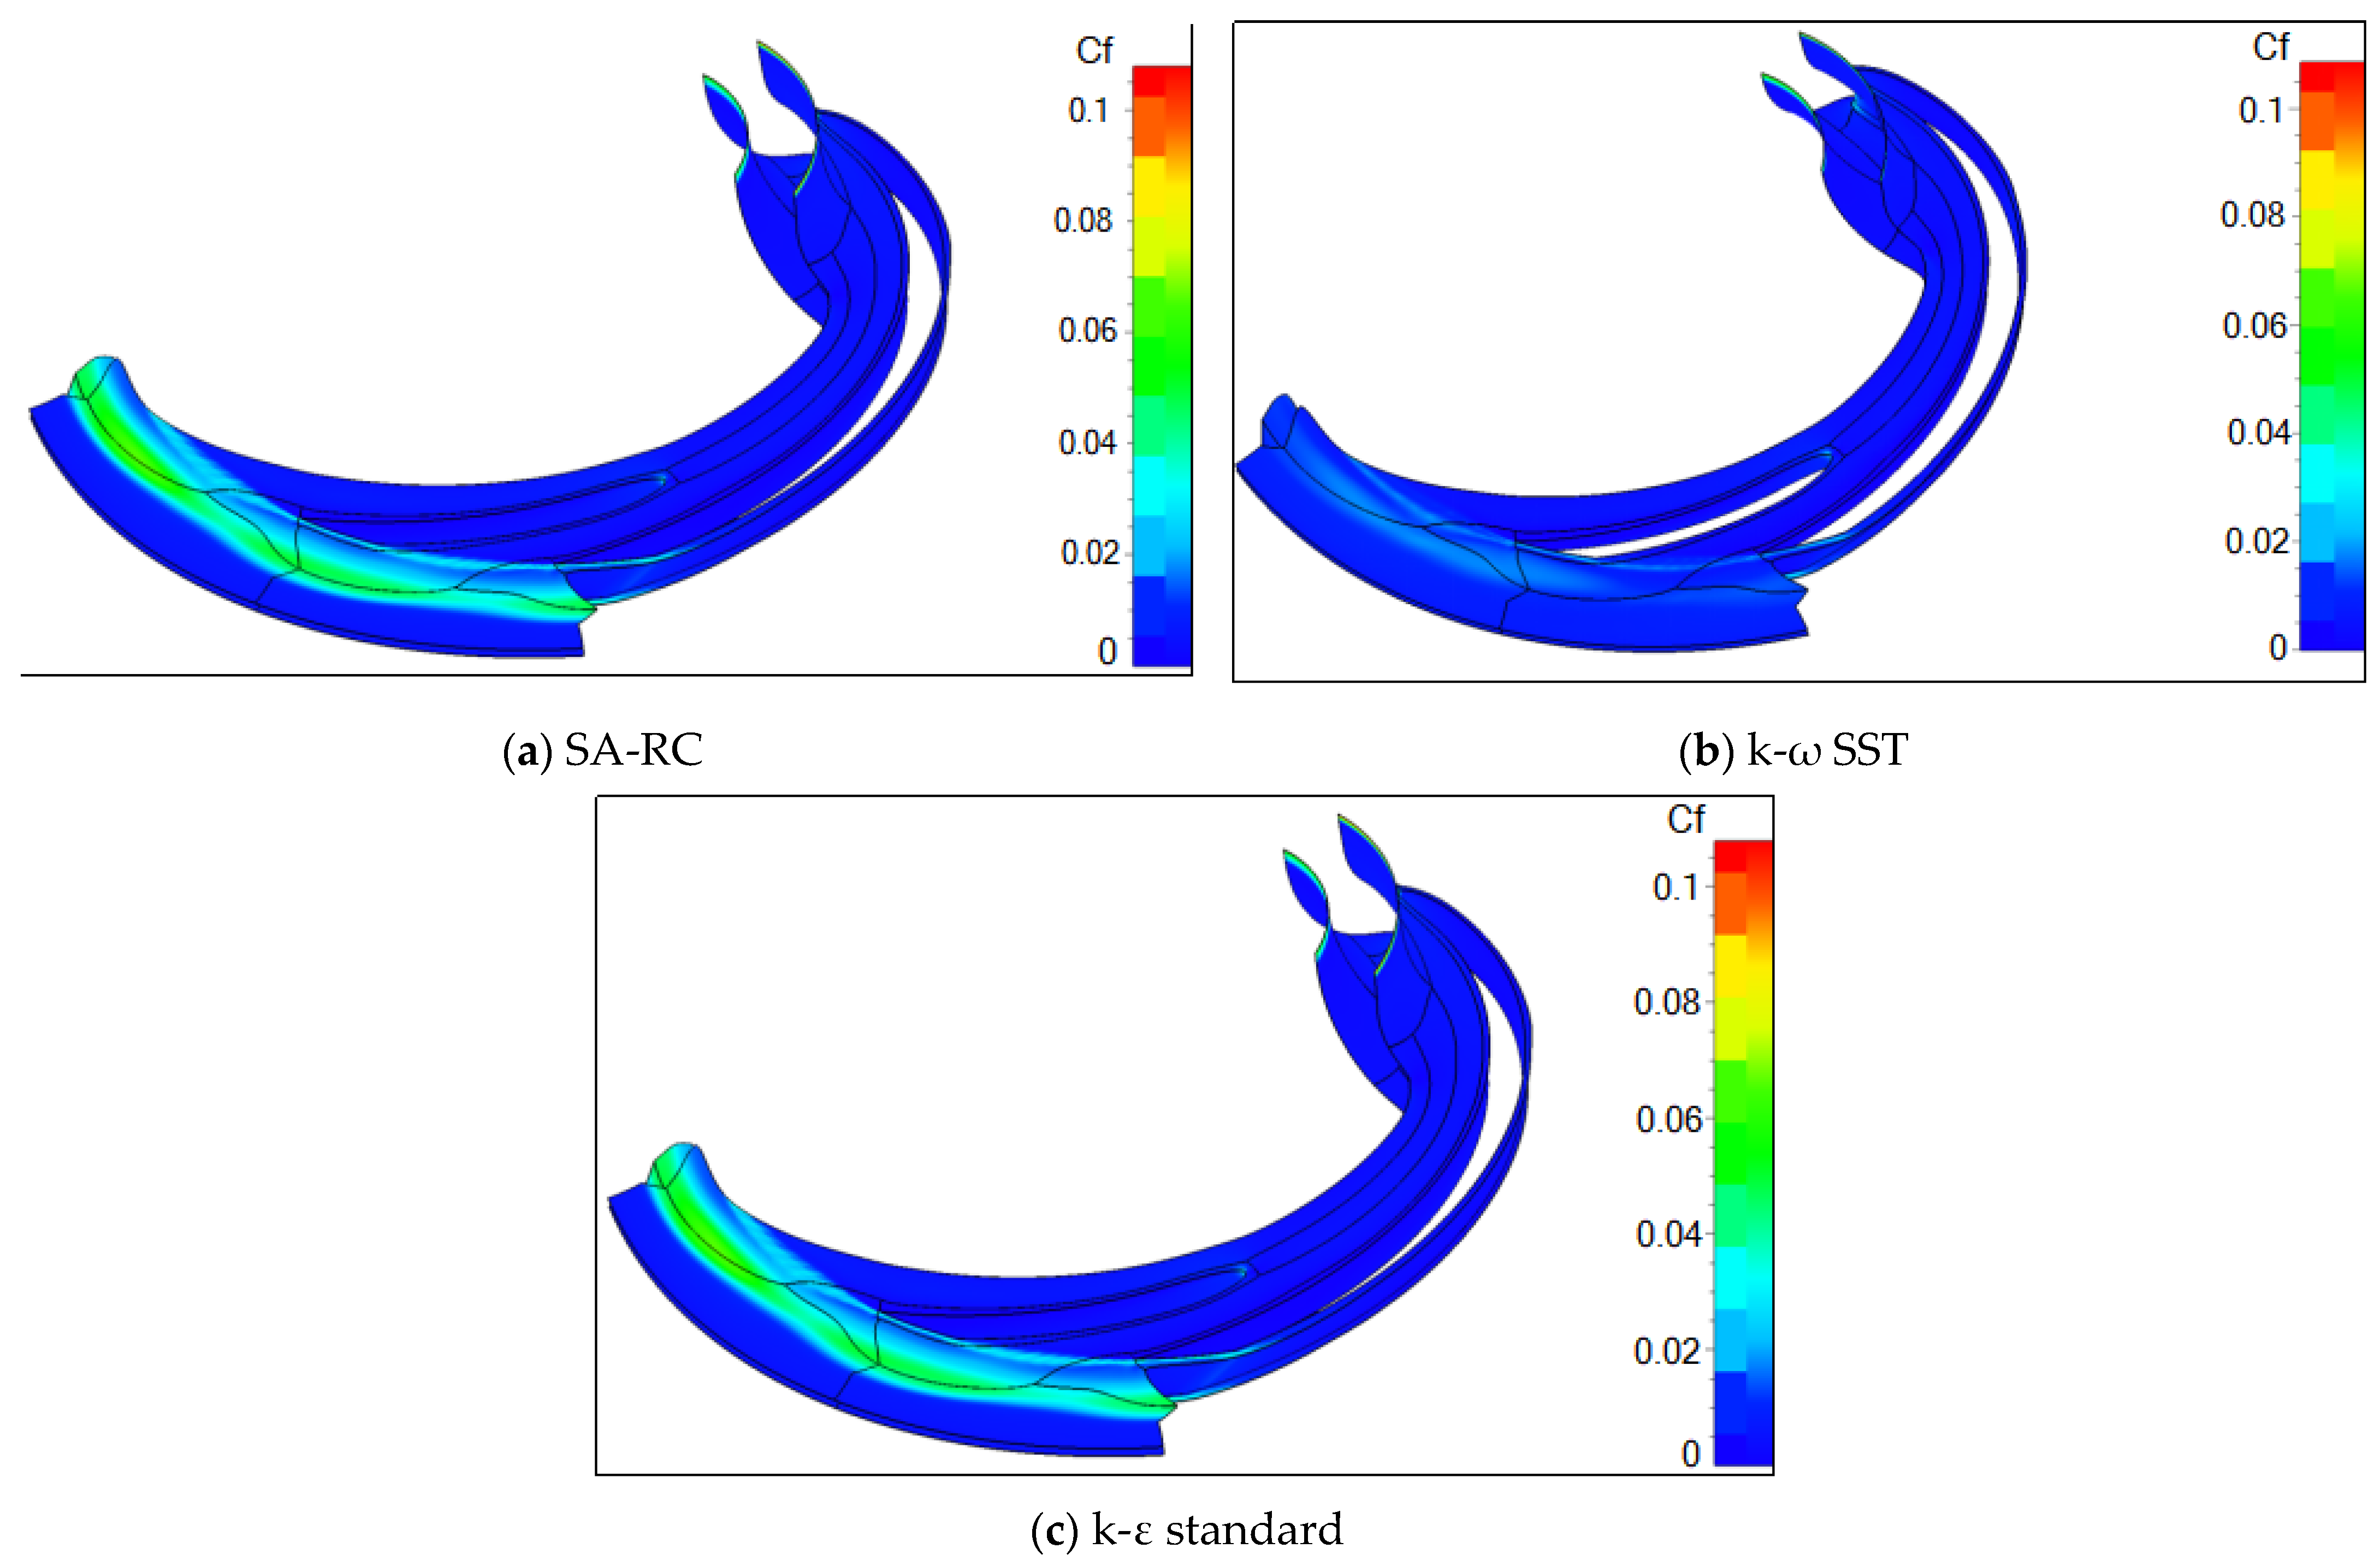
Figure 10.
Impeller performances, evaluated for different turbulence models, in terms of (a) outflow angle and (b) velocity magnitude.
Figure 10.
Impeller performances, evaluated for different turbulence models, in terms of (a) outflow angle and (b) velocity magnitude.
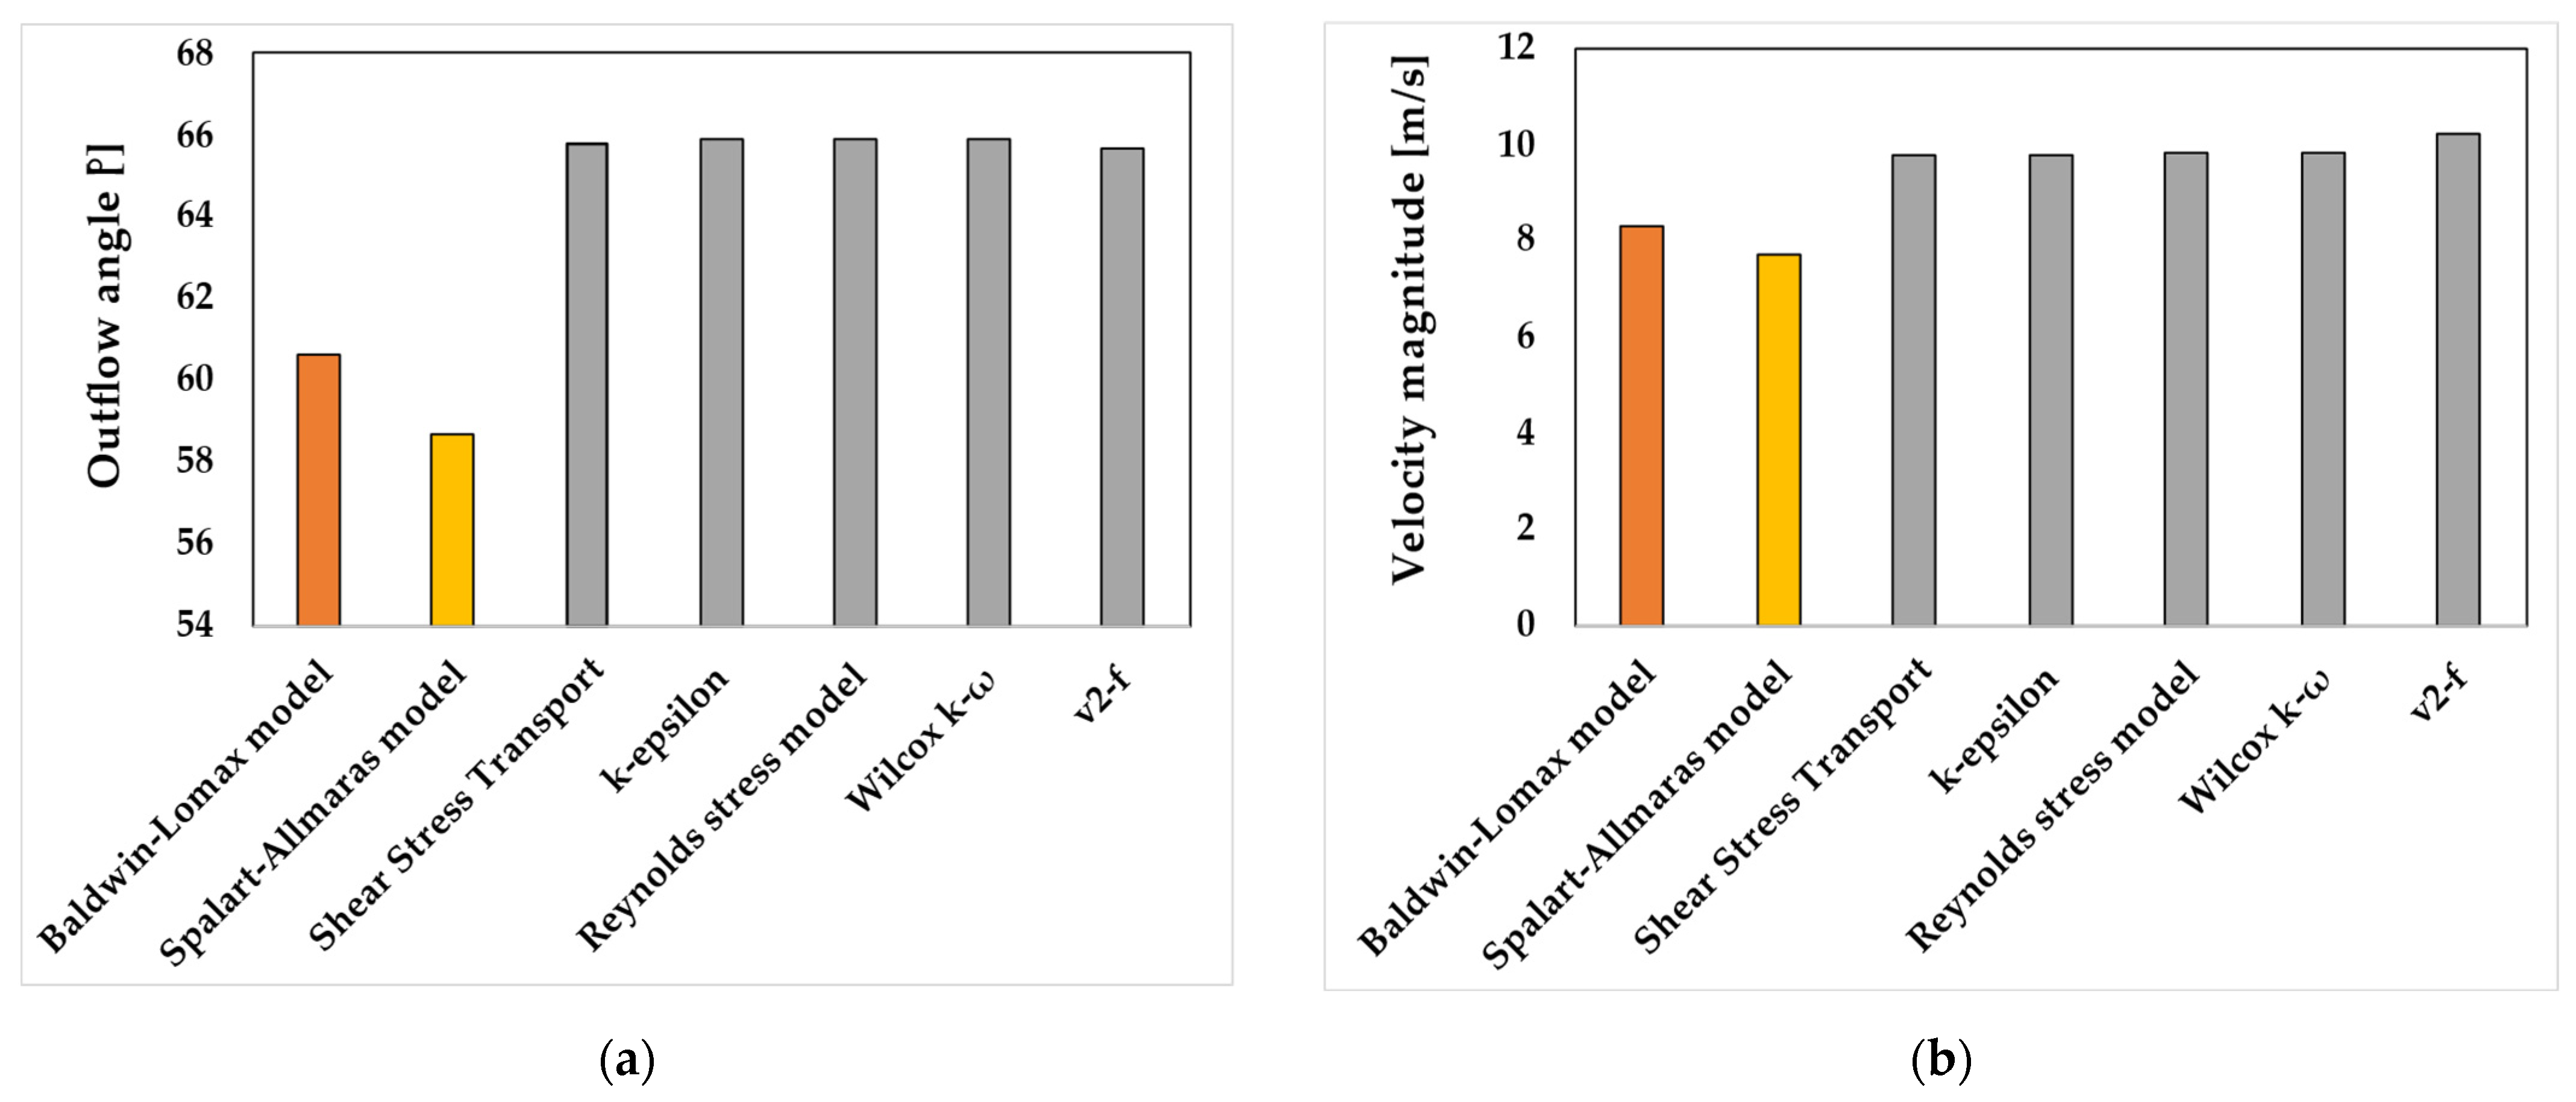
Figure 11.
Impeller performances evaluated for different turbulence models in terms of (a) outflow angle and (b) velocity magnitude.
Figure 11.
Impeller performances evaluated for different turbulence models in terms of (a) outflow angle and (b) velocity magnitude.
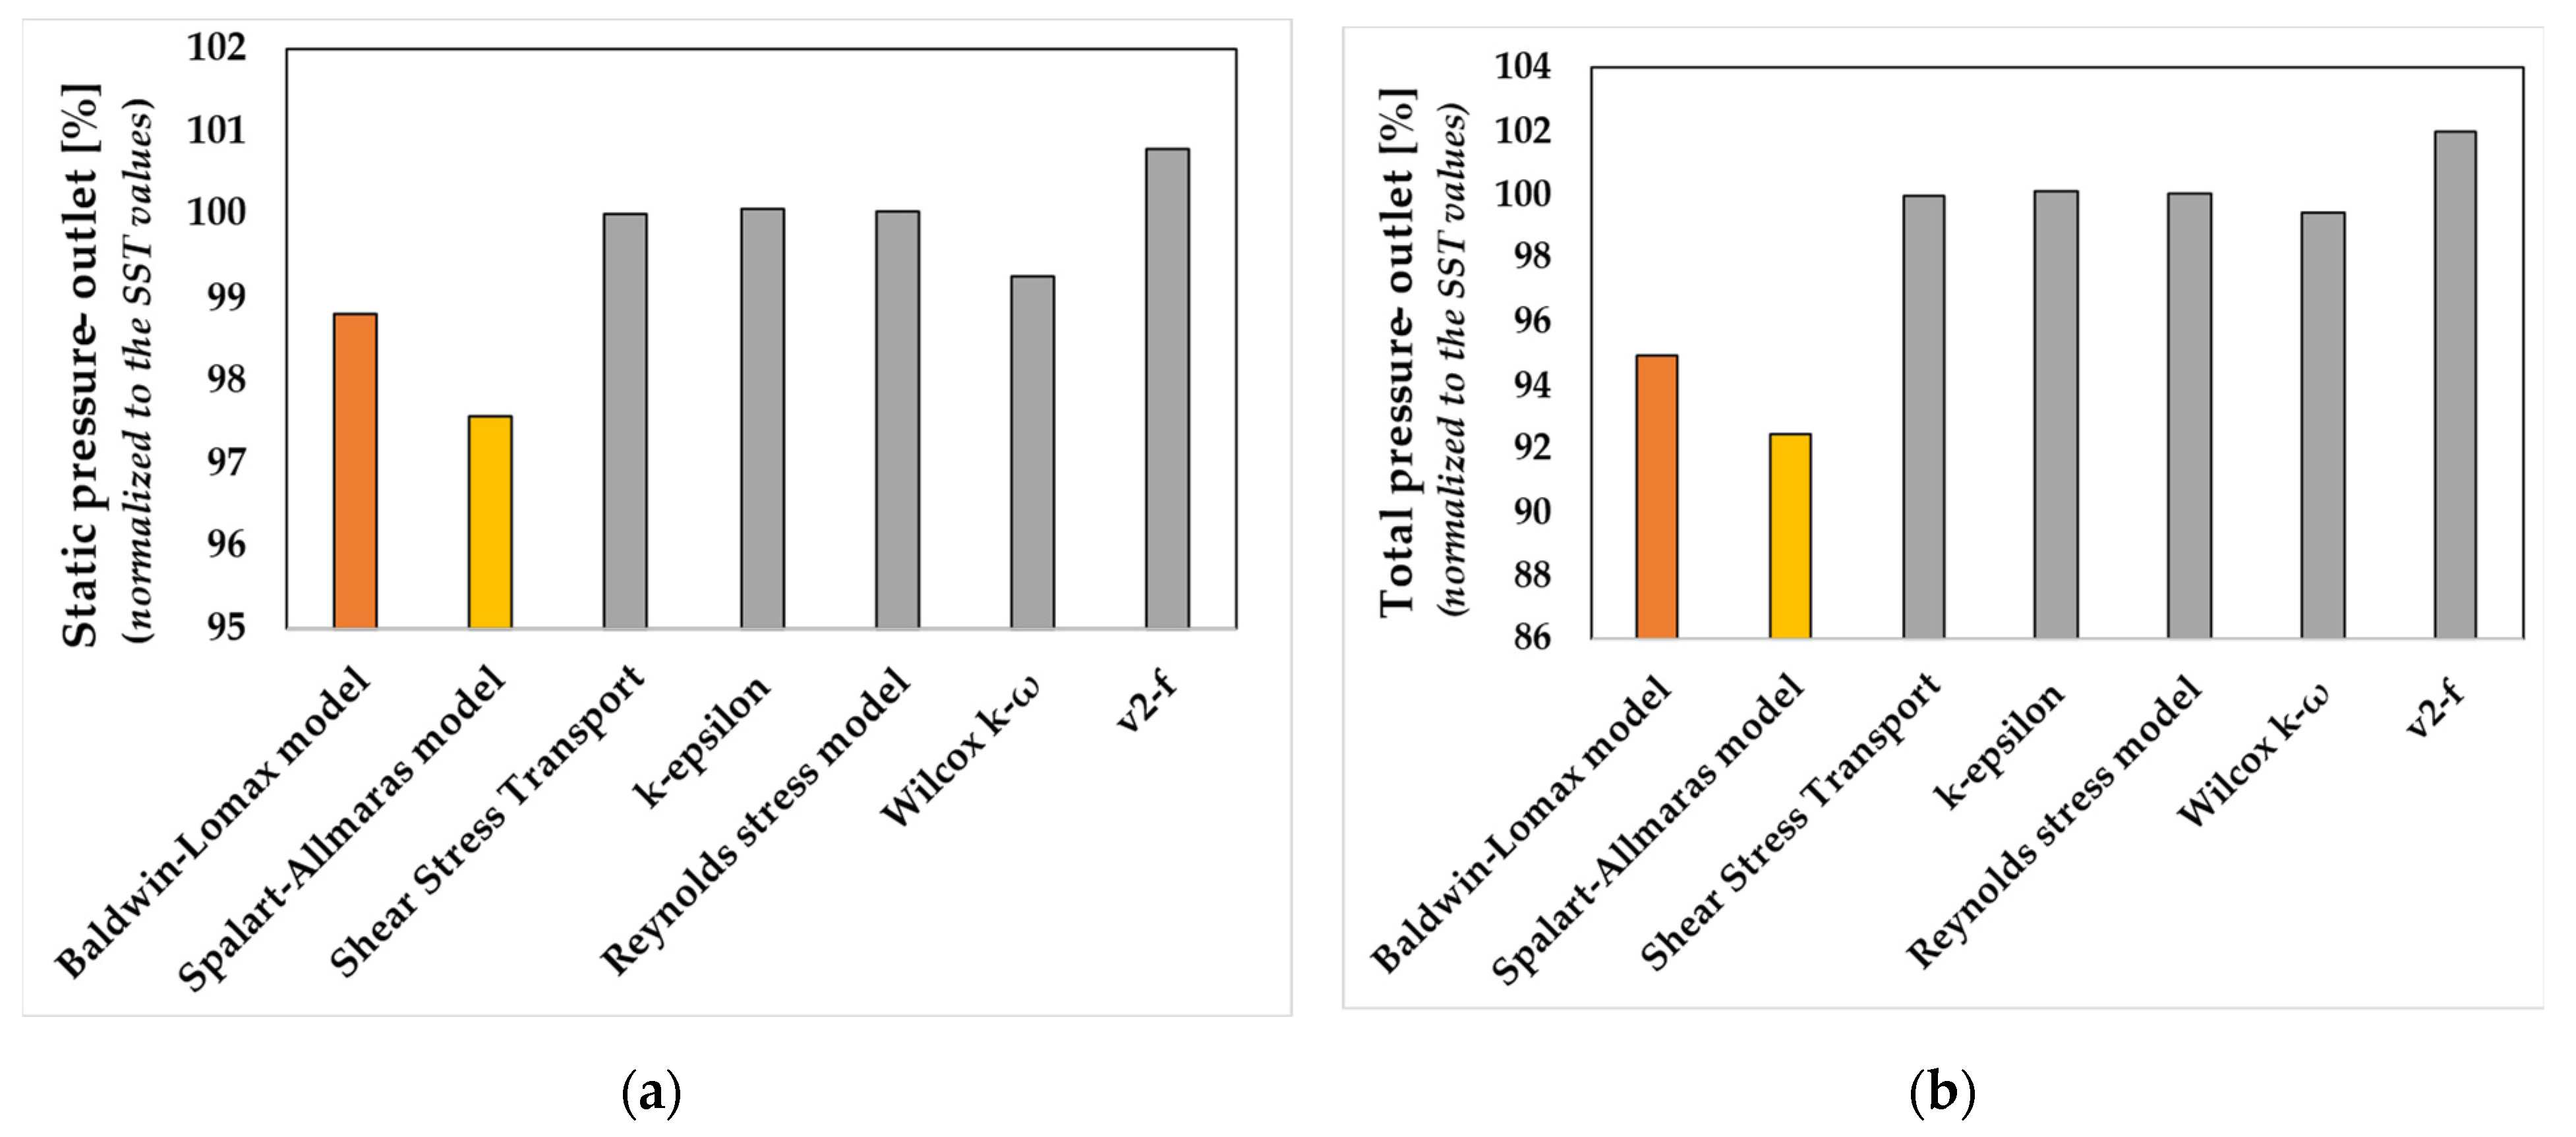
Figure 12.
Impeller performances evaluated for different turbulence models in terms of (a) torque and (b) efficiency.
Figure 12.
Impeller performances evaluated for different turbulence models in terms of (a) torque and (b) efficiency.

Figure 13.
Illustrated detailing of the optimization procedure.
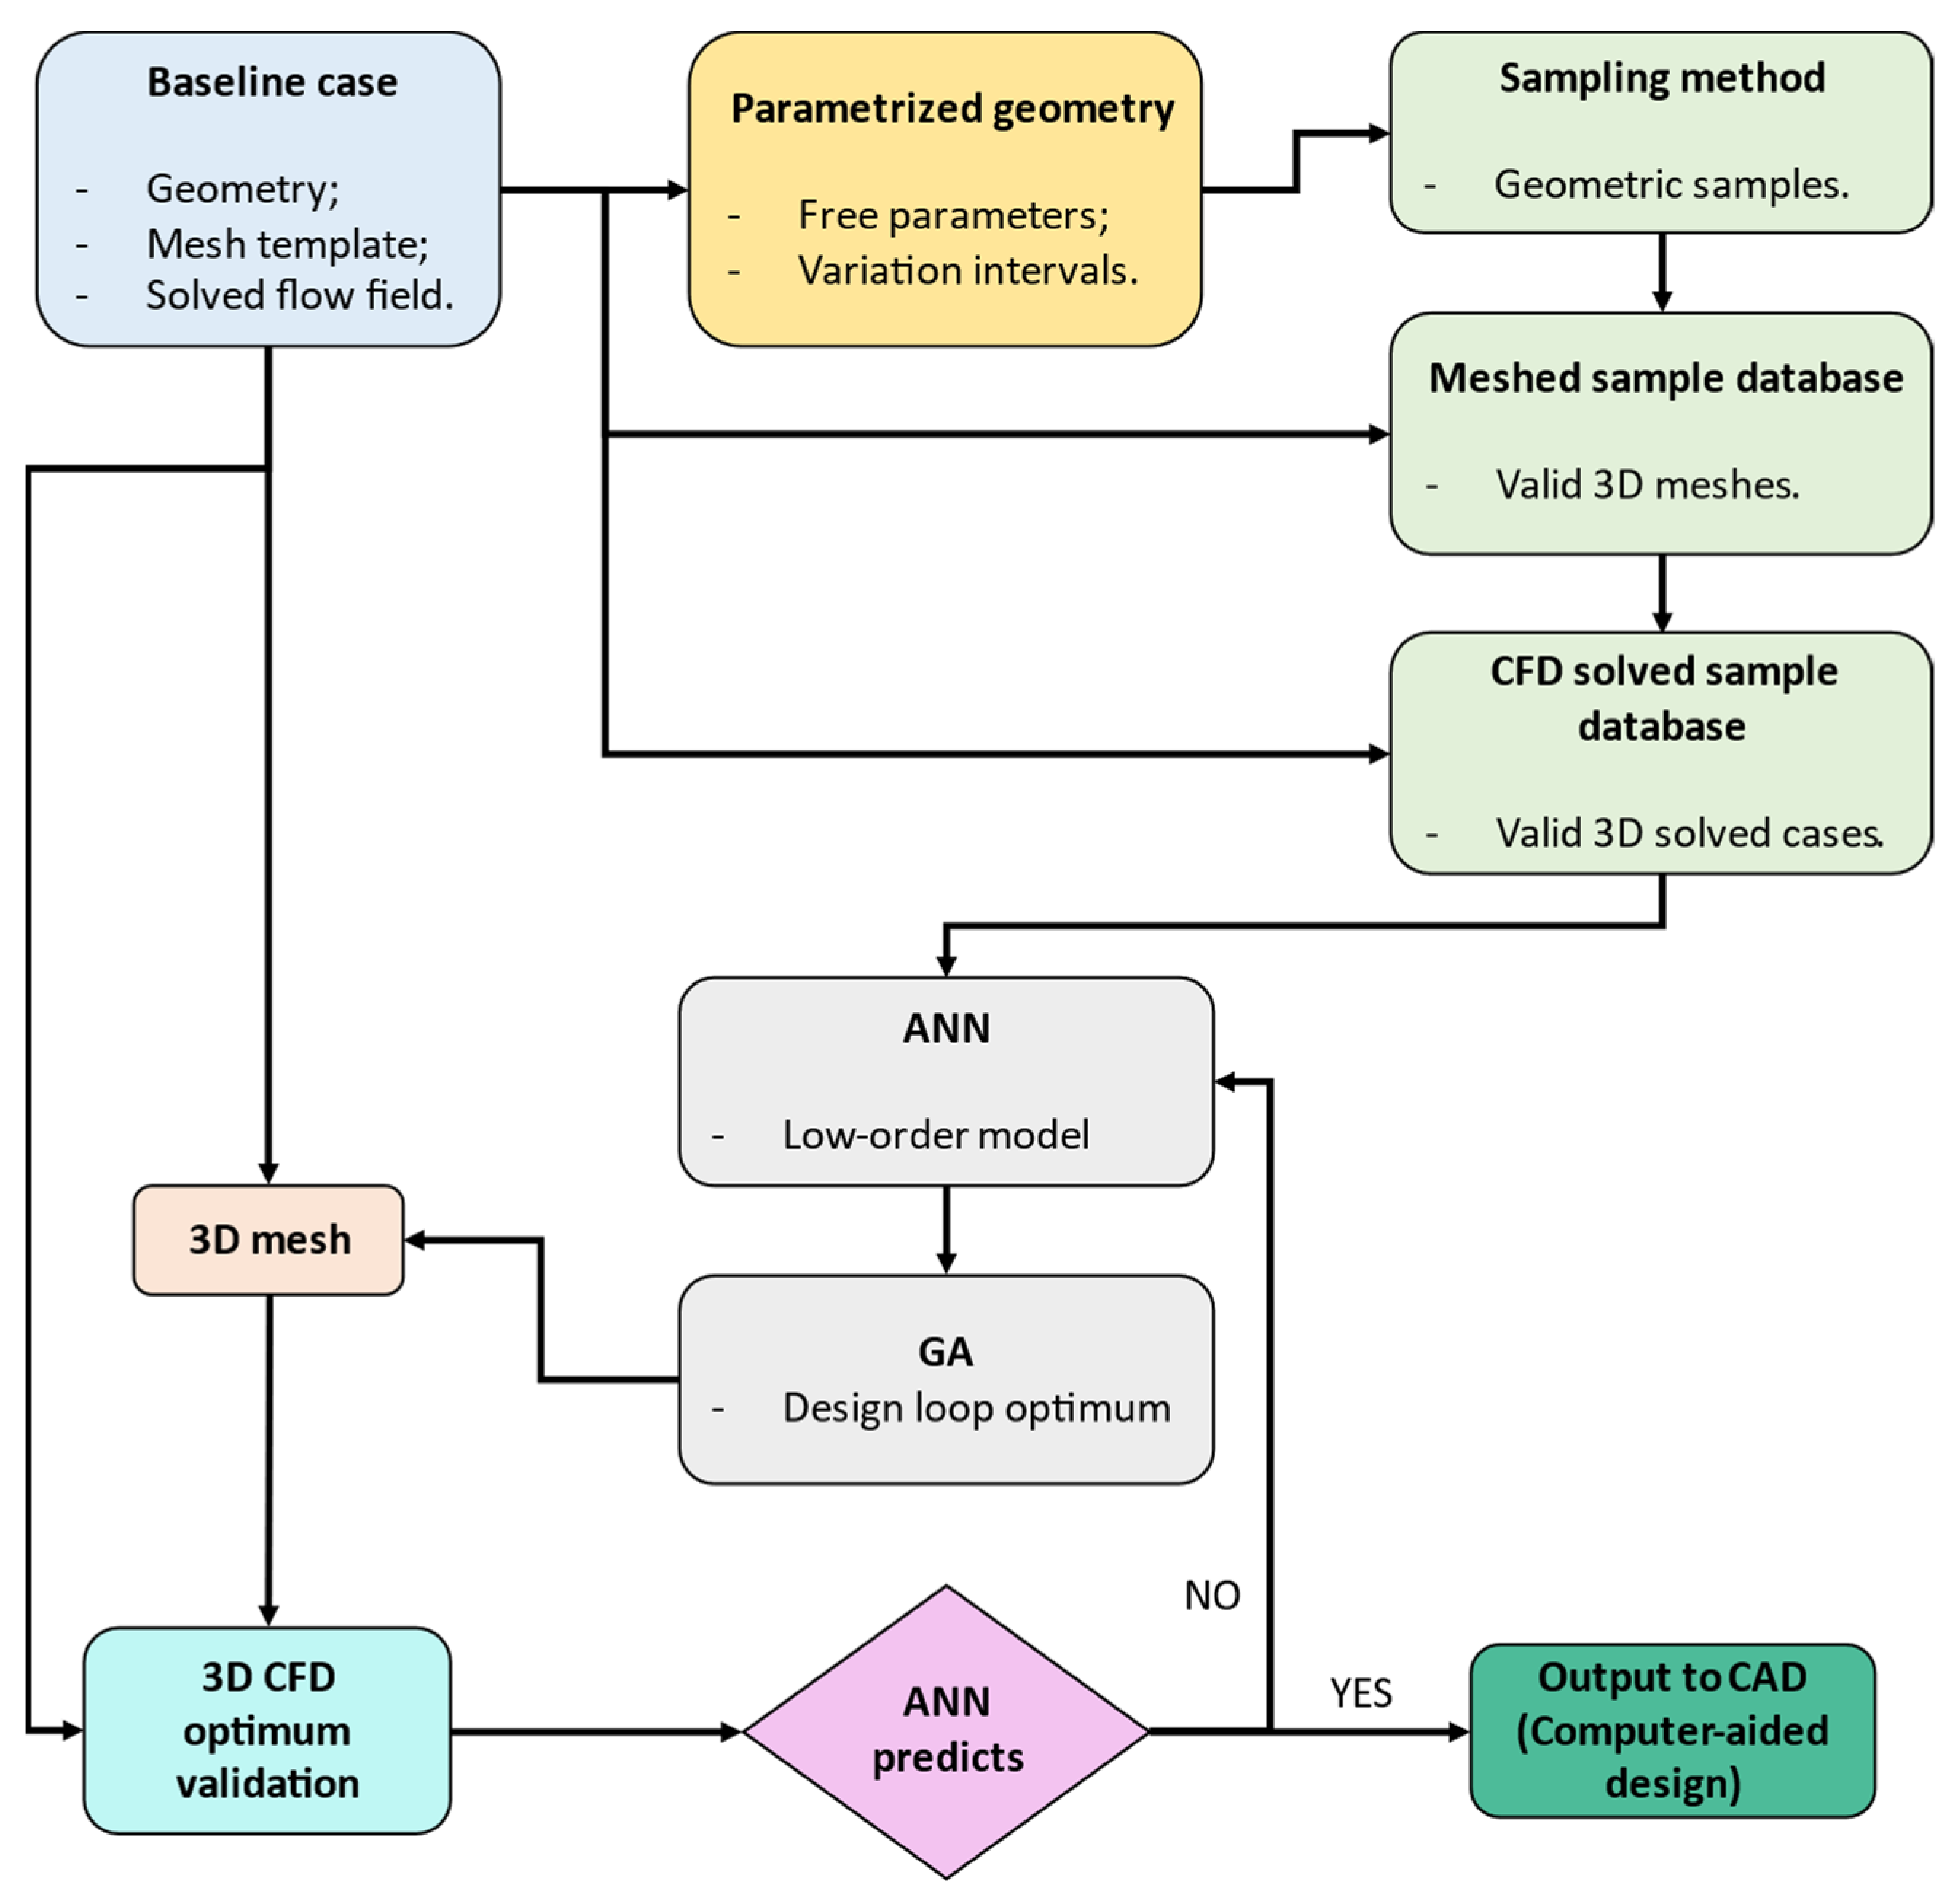
Figure 14.
Blade-fitting process—parametrized geometry step.
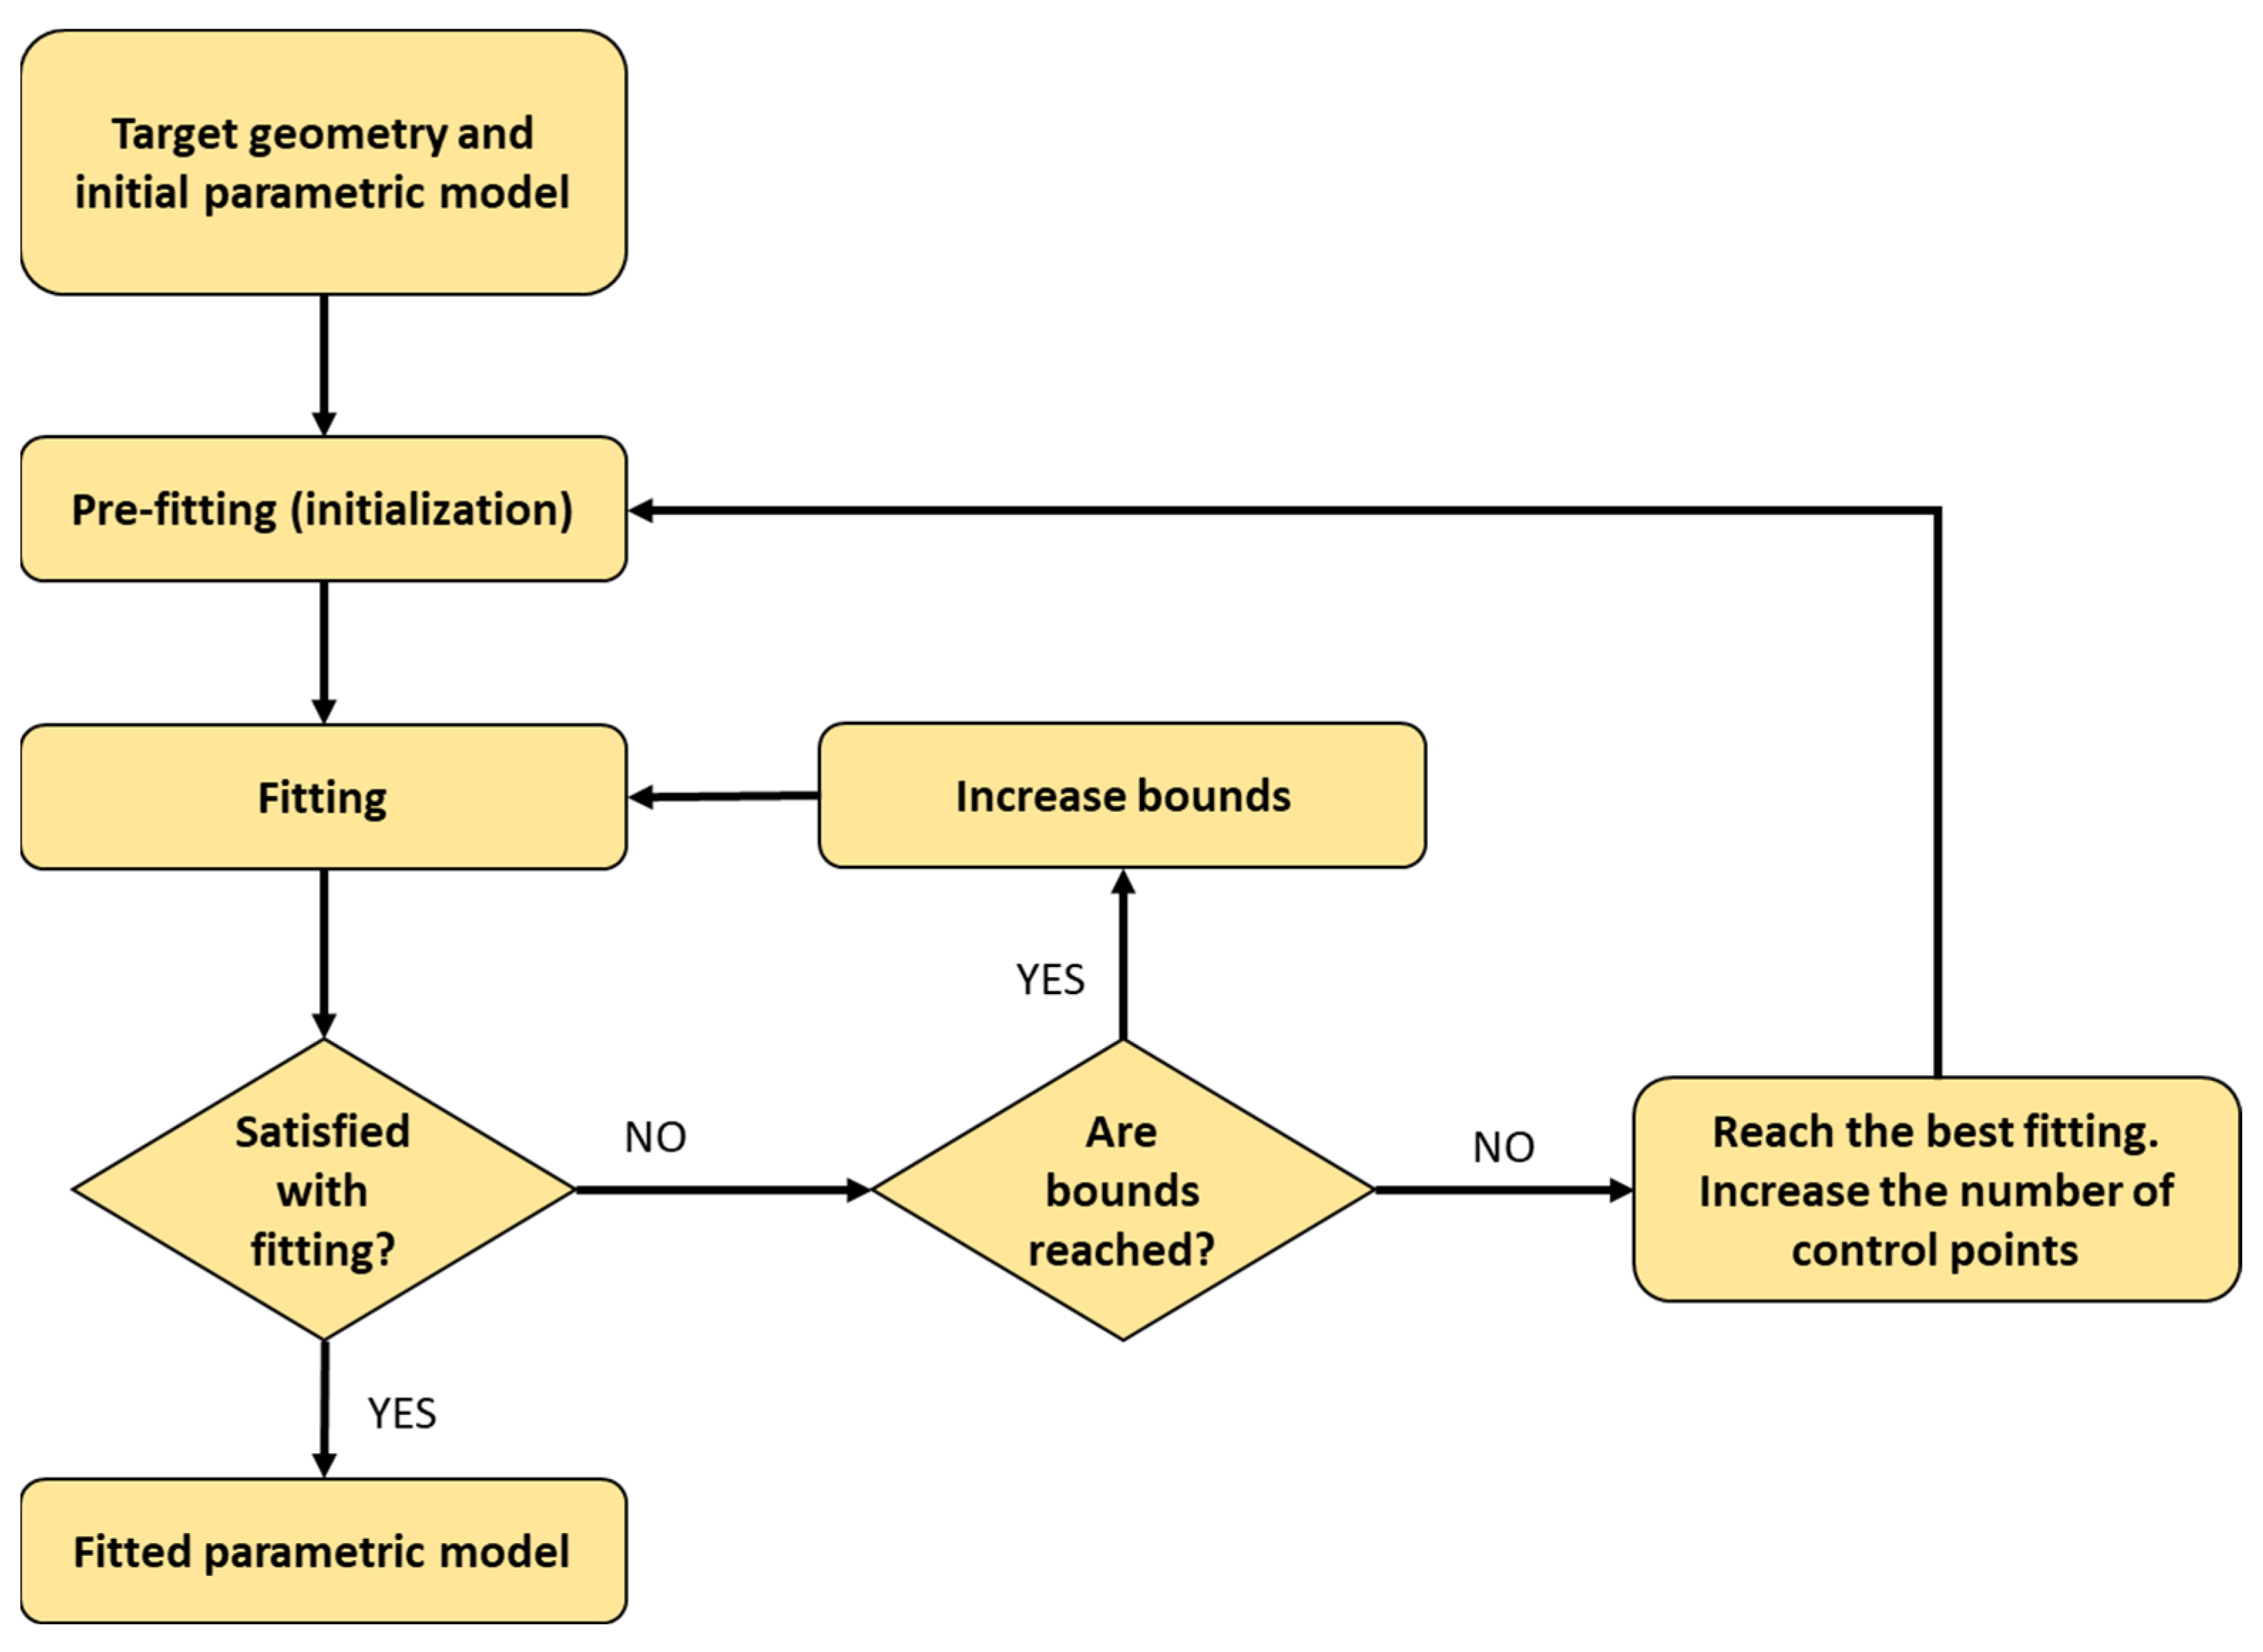
Figure 15.
CFD results of the main cases studied. (a) Case I—bulbous trailing edge; (b) Case II—impeller with three splitters; (c) Case III—impeller with two splitters with a bulbous trailing edge; (d) Case IV—constant thickness with the splitter off-center; (e) Case V—profile NACA thickness distribution optimization; (f) Case VI—impeller optimized with ANN.
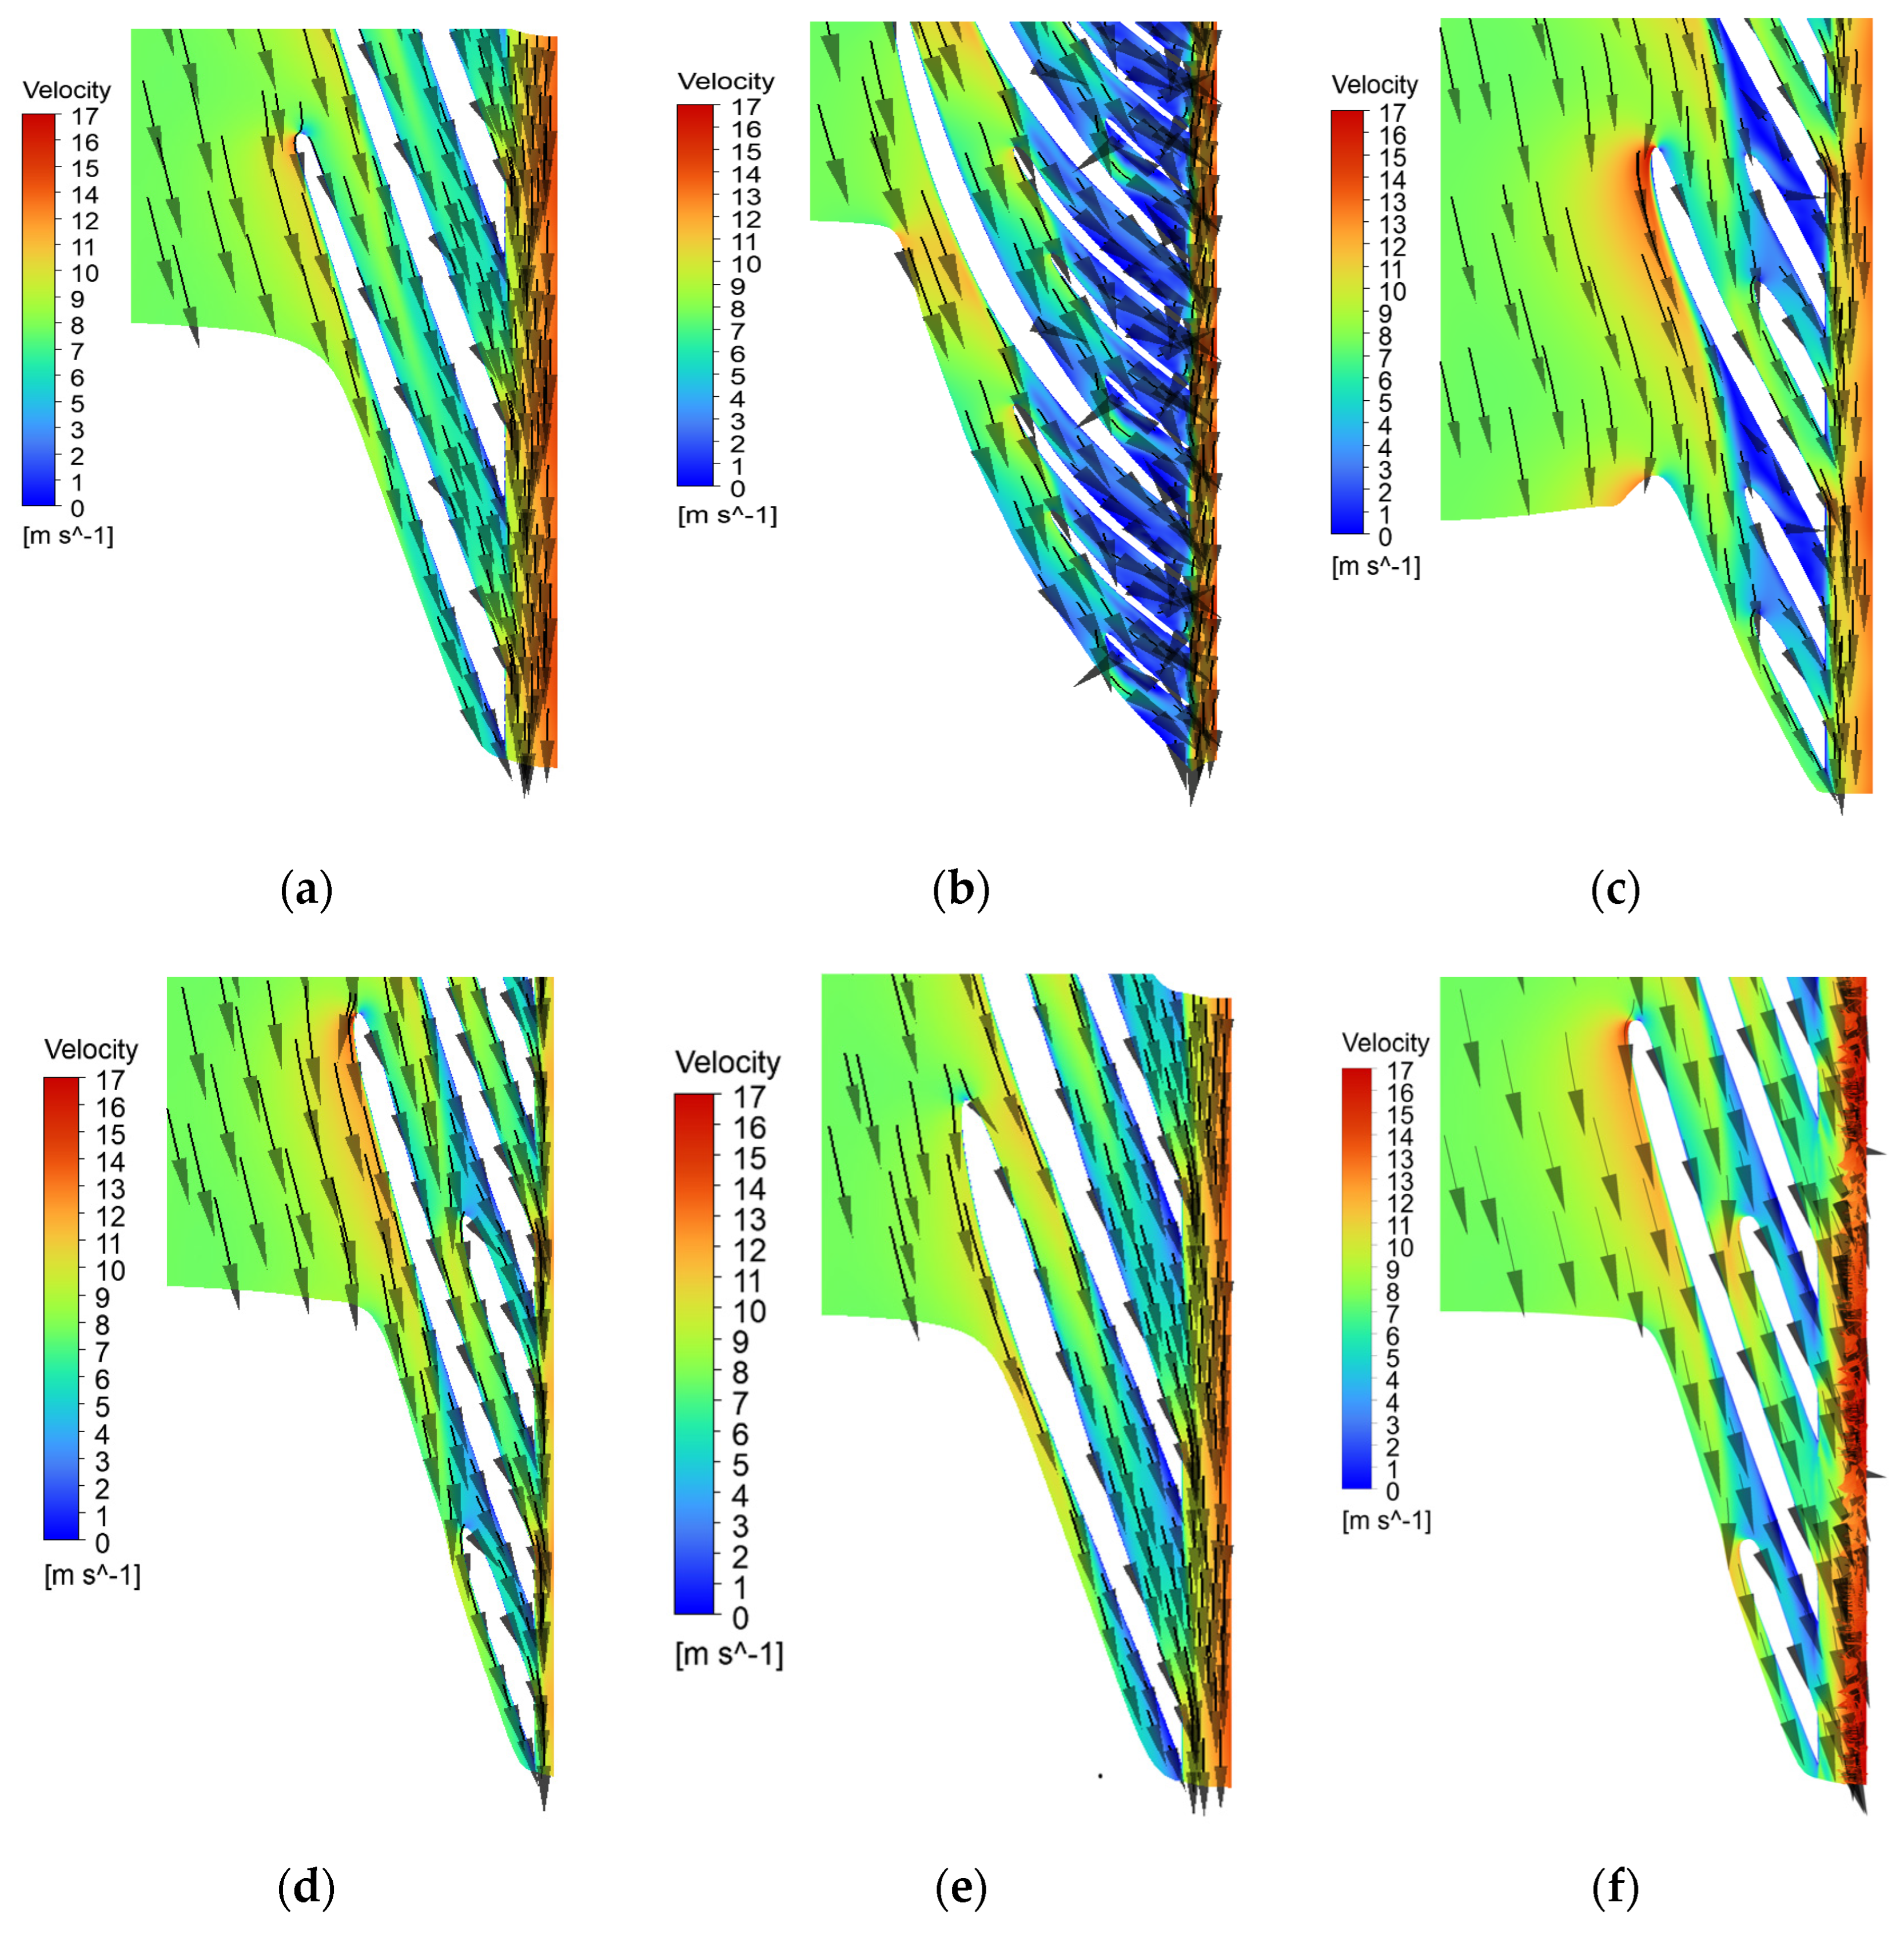
Figure 16.
Total pressure distribution. (a) Impeller with constant thickness and splitter off-center; (b) impeller with profile NACA thickness distribution optimization; (c) impeller optimized with ANN.
Figure 16.
Total pressure distribution. (a) Impeller with constant thickness and splitter off-center; (b) impeller with profile NACA thickness distribution optimization; (c) impeller optimized with ANN.

Figure 17.
Relative velocity distribution. (a) Impeller with constant thickness and splitter off-center; (b) impeller with profile NACA thickness distribution optimization; (c) impeller optimized with ANN.
Figure 17.
Relative velocity distribution. (a) Impeller with constant thickness and splitter off-center; (b) impeller with profile NACA thickness distribution optimization; (c) impeller optimized with ANN.
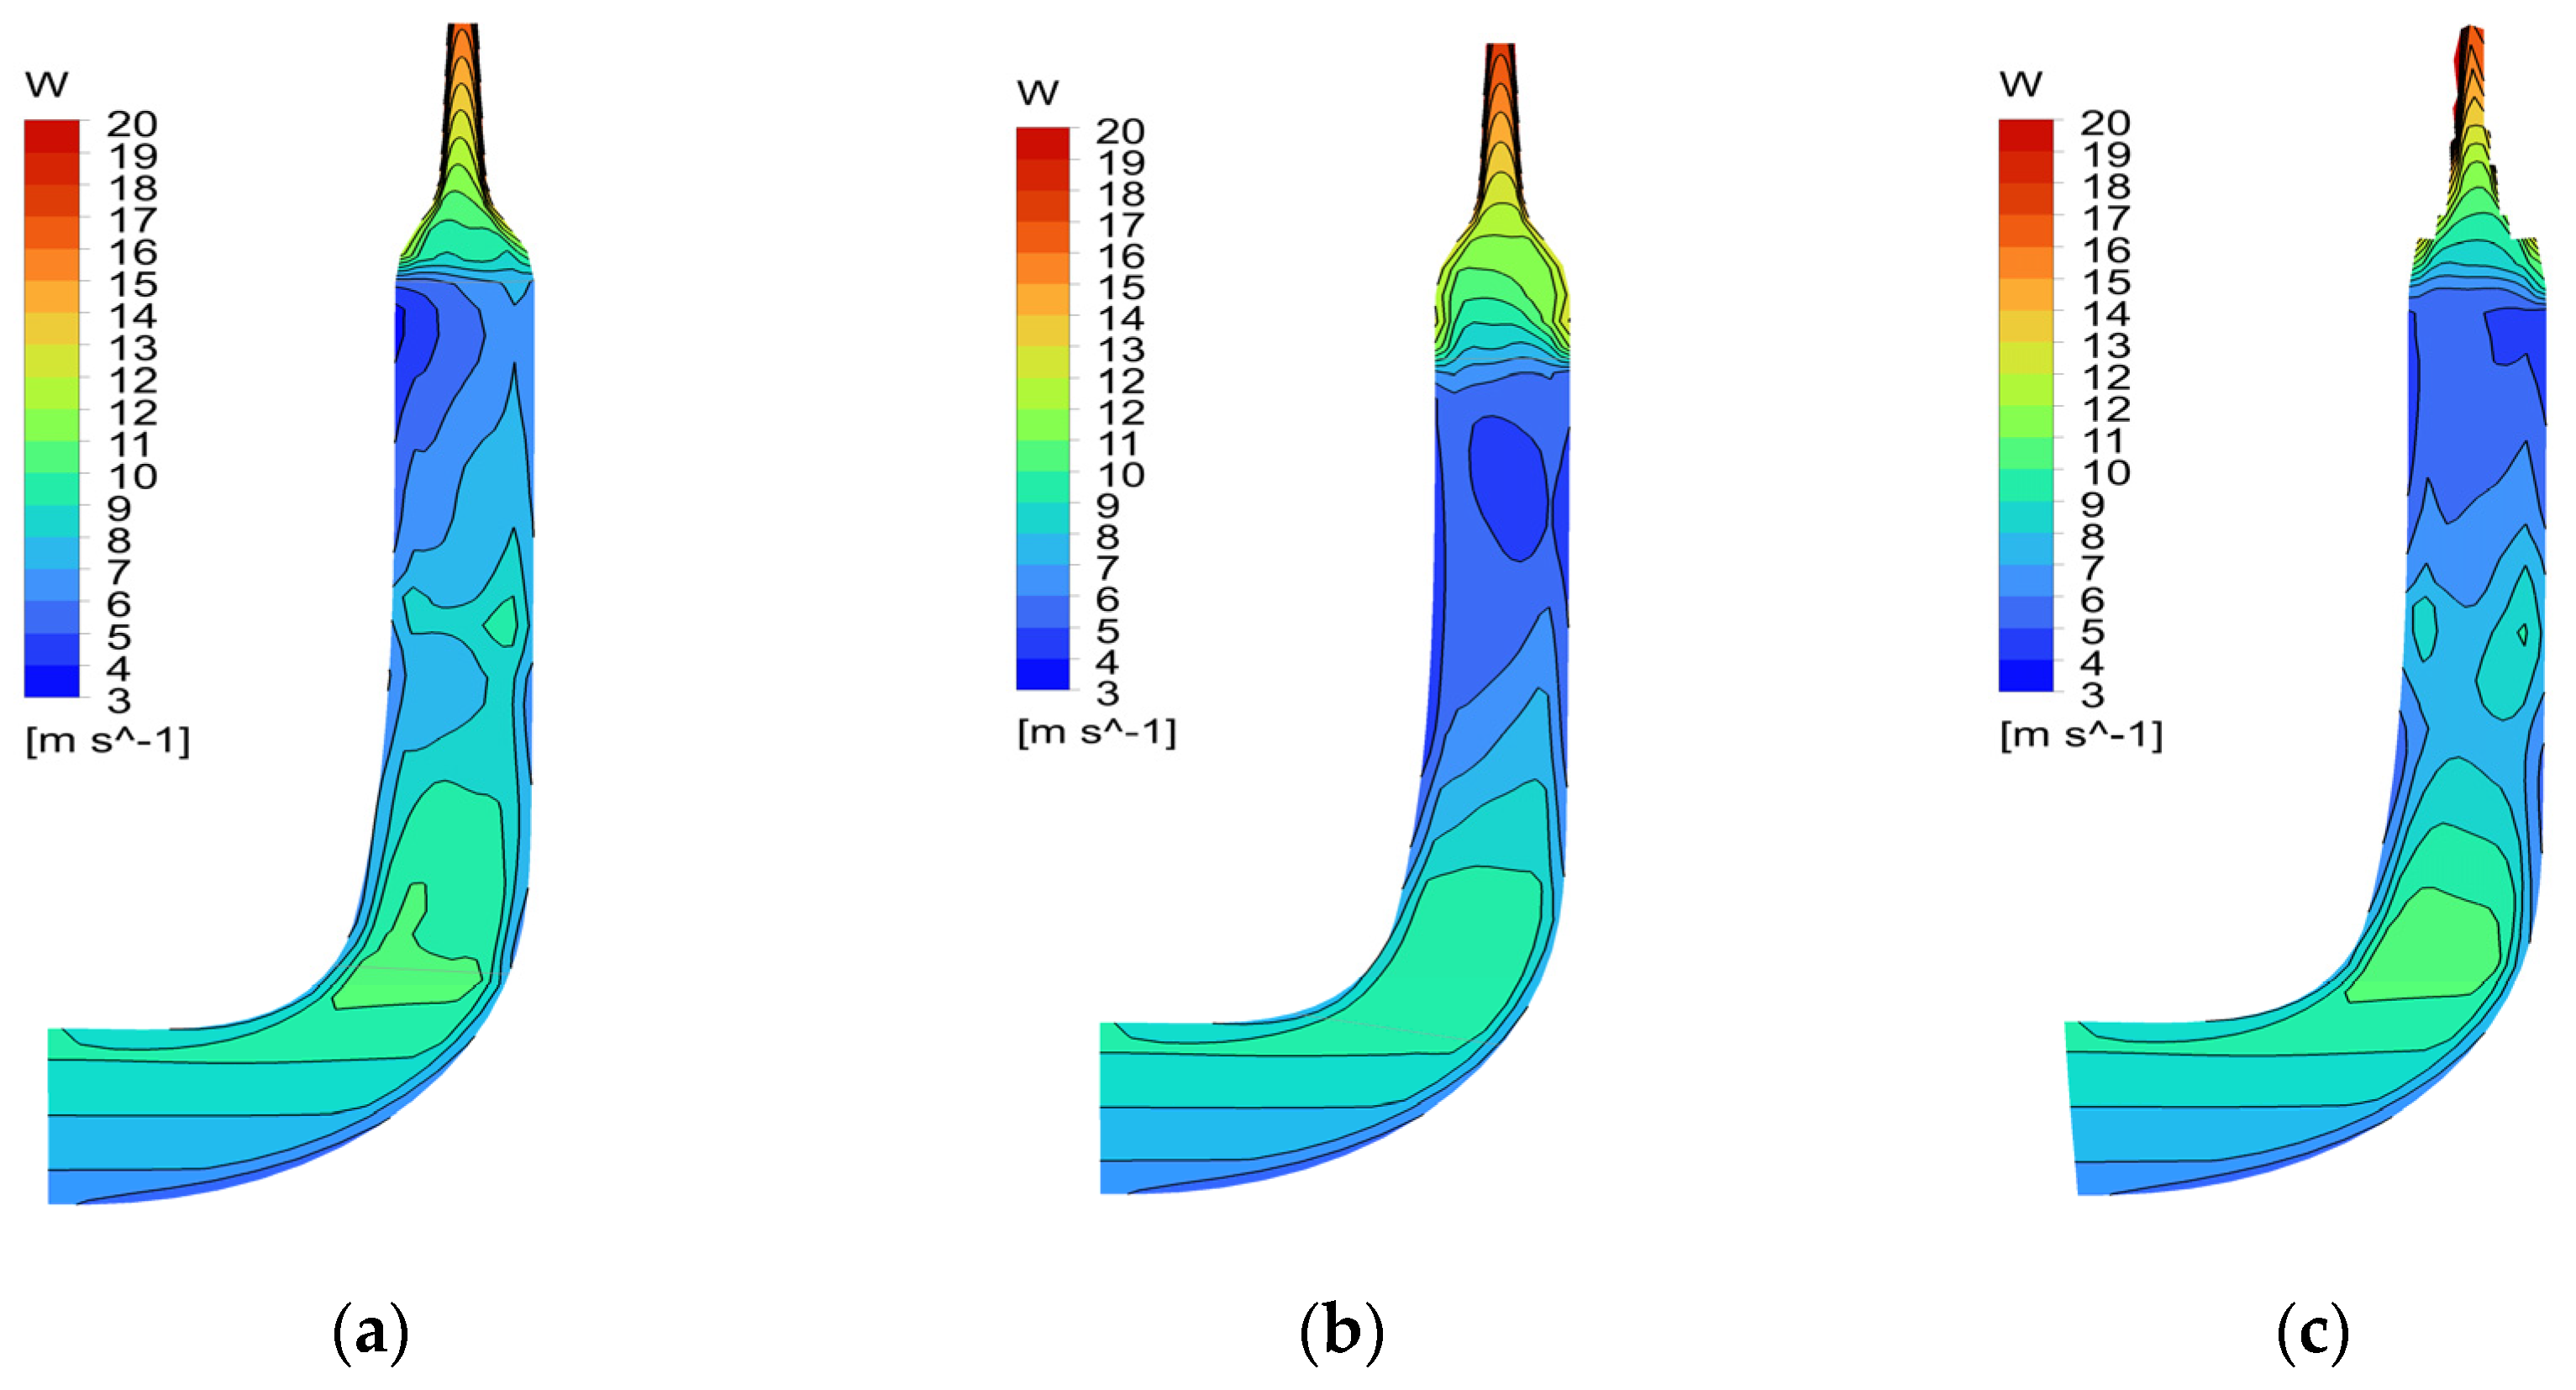
Figure 18.
Pressure ratio increase, relative to the required pressure, calculated at the impeller trailing edge.
Figure 18.
Pressure ratio increase, relative to the required pressure, calculated at the impeller trailing edge.
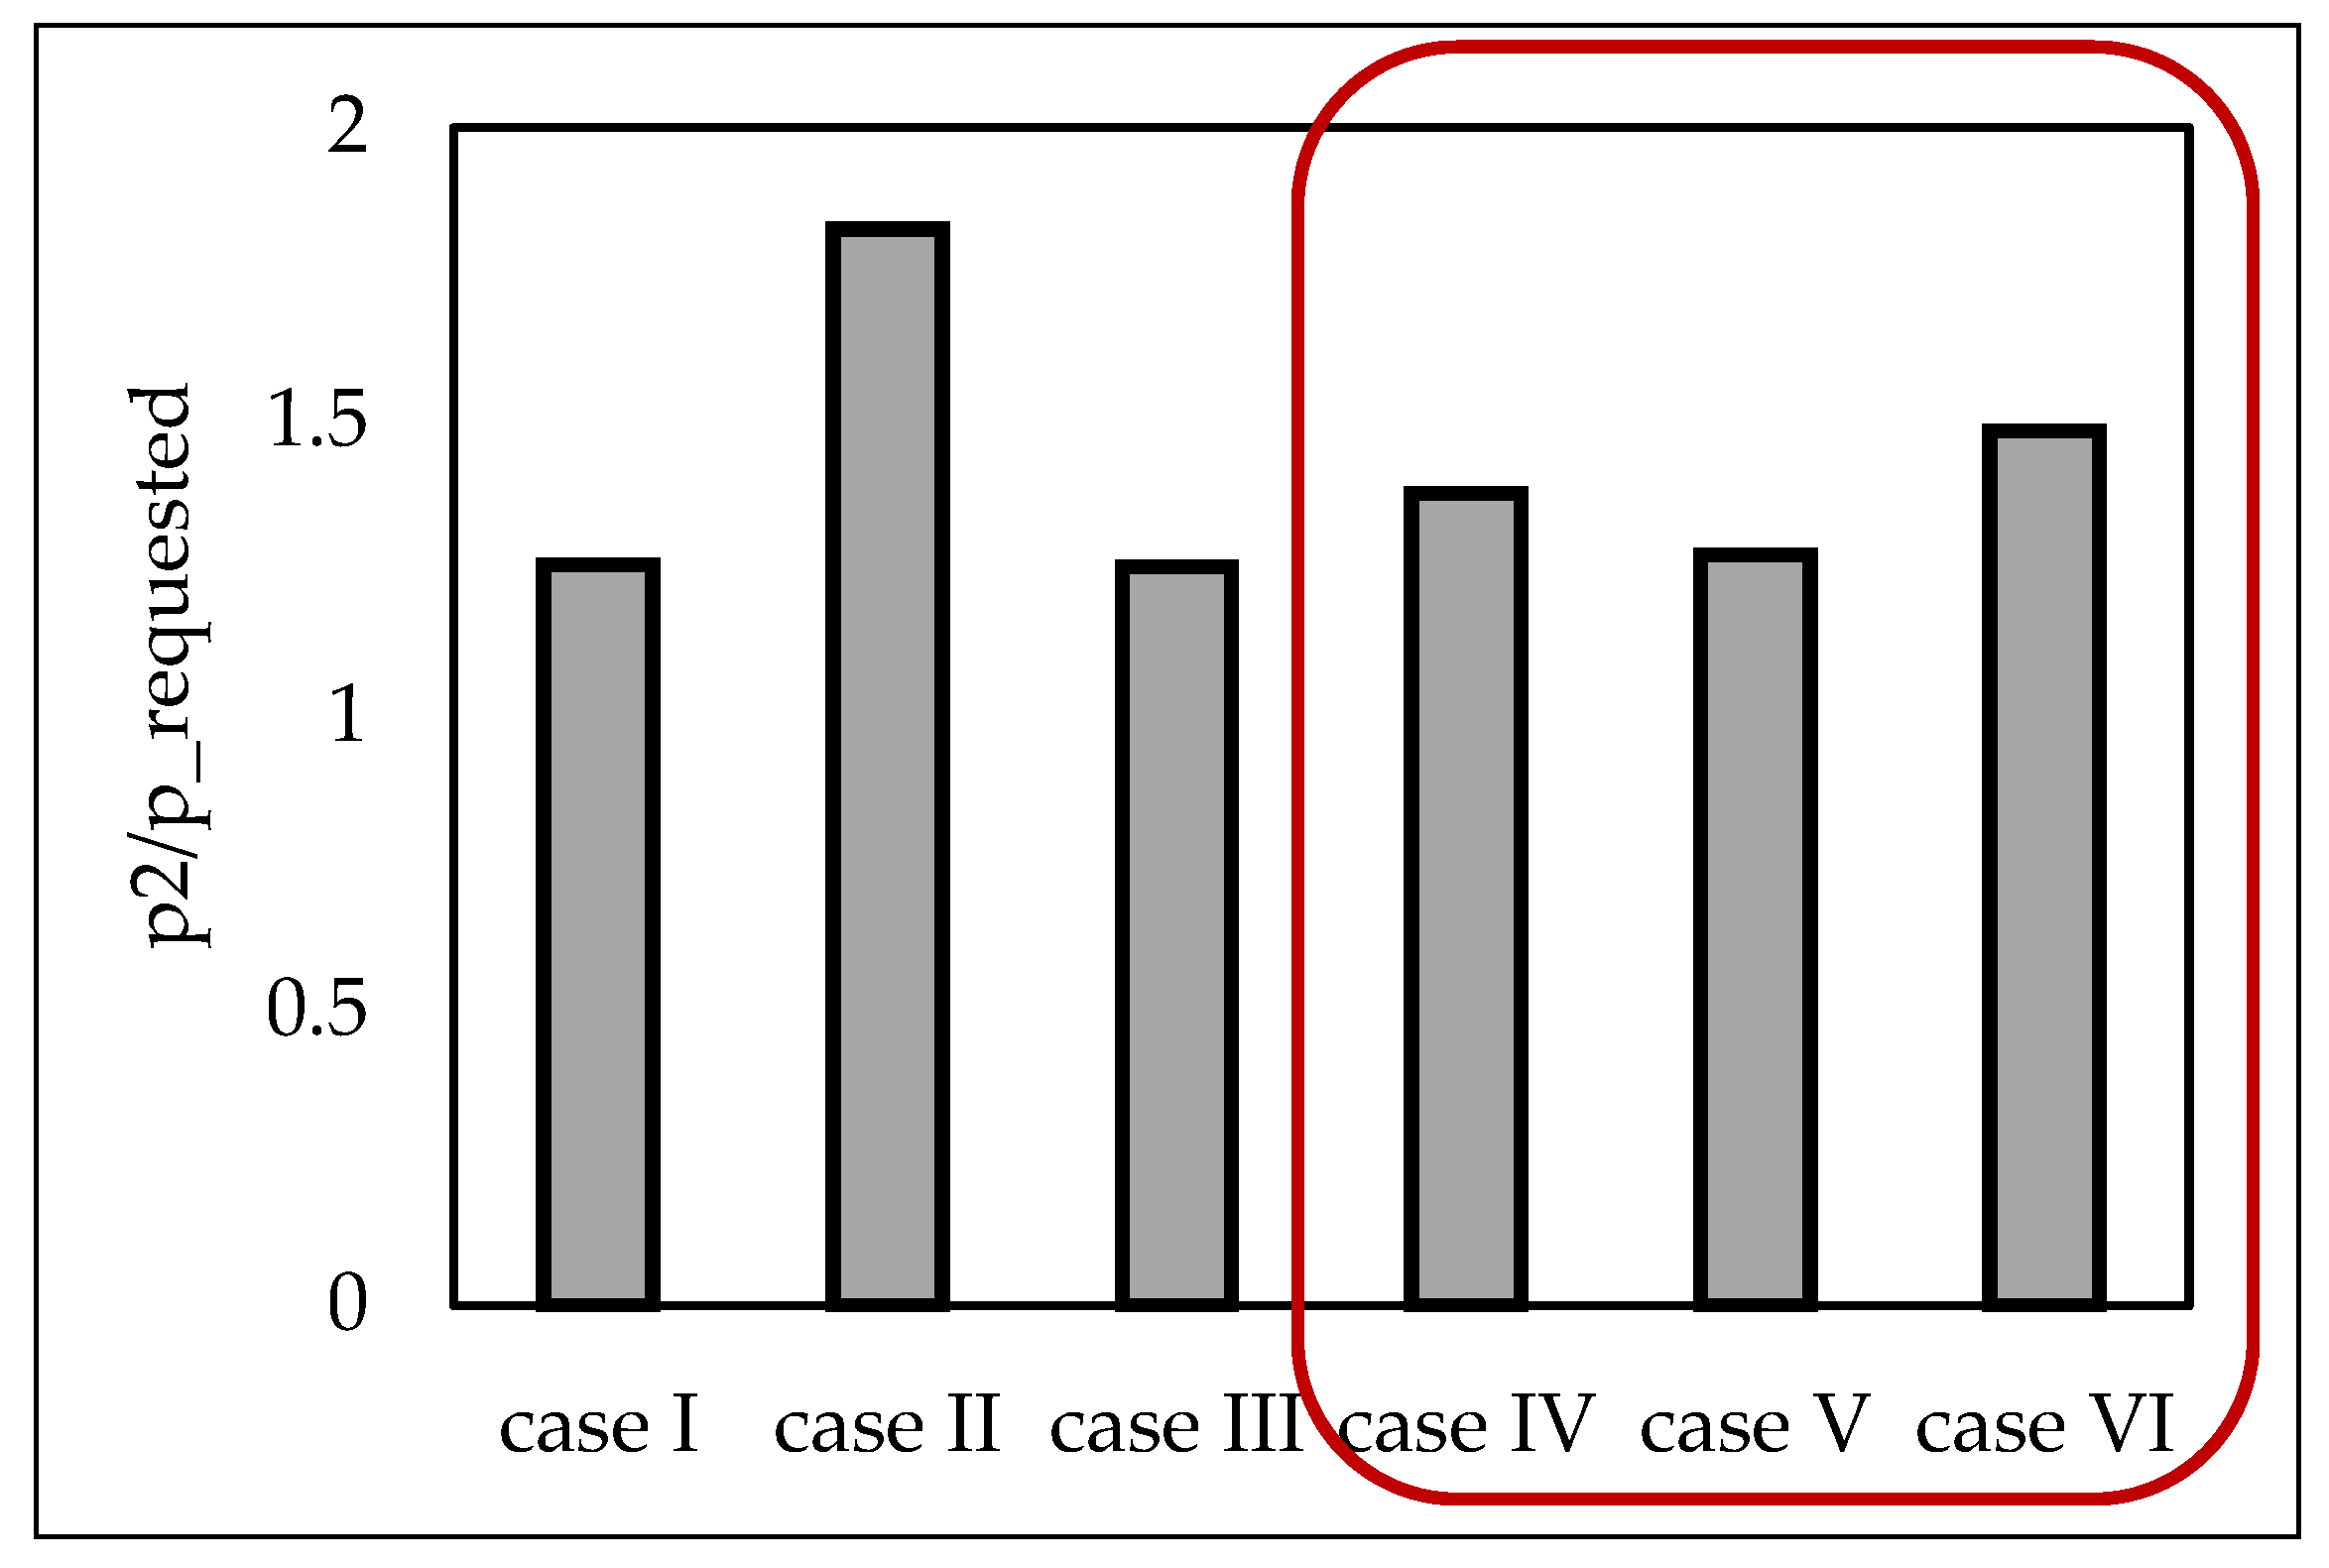
Figure 19.
Impeller efficiency, calculated at the impeller trailing edge.

Figure 20.
Isentropic efficiency, case IV (baseline) and case VI (optimized case).
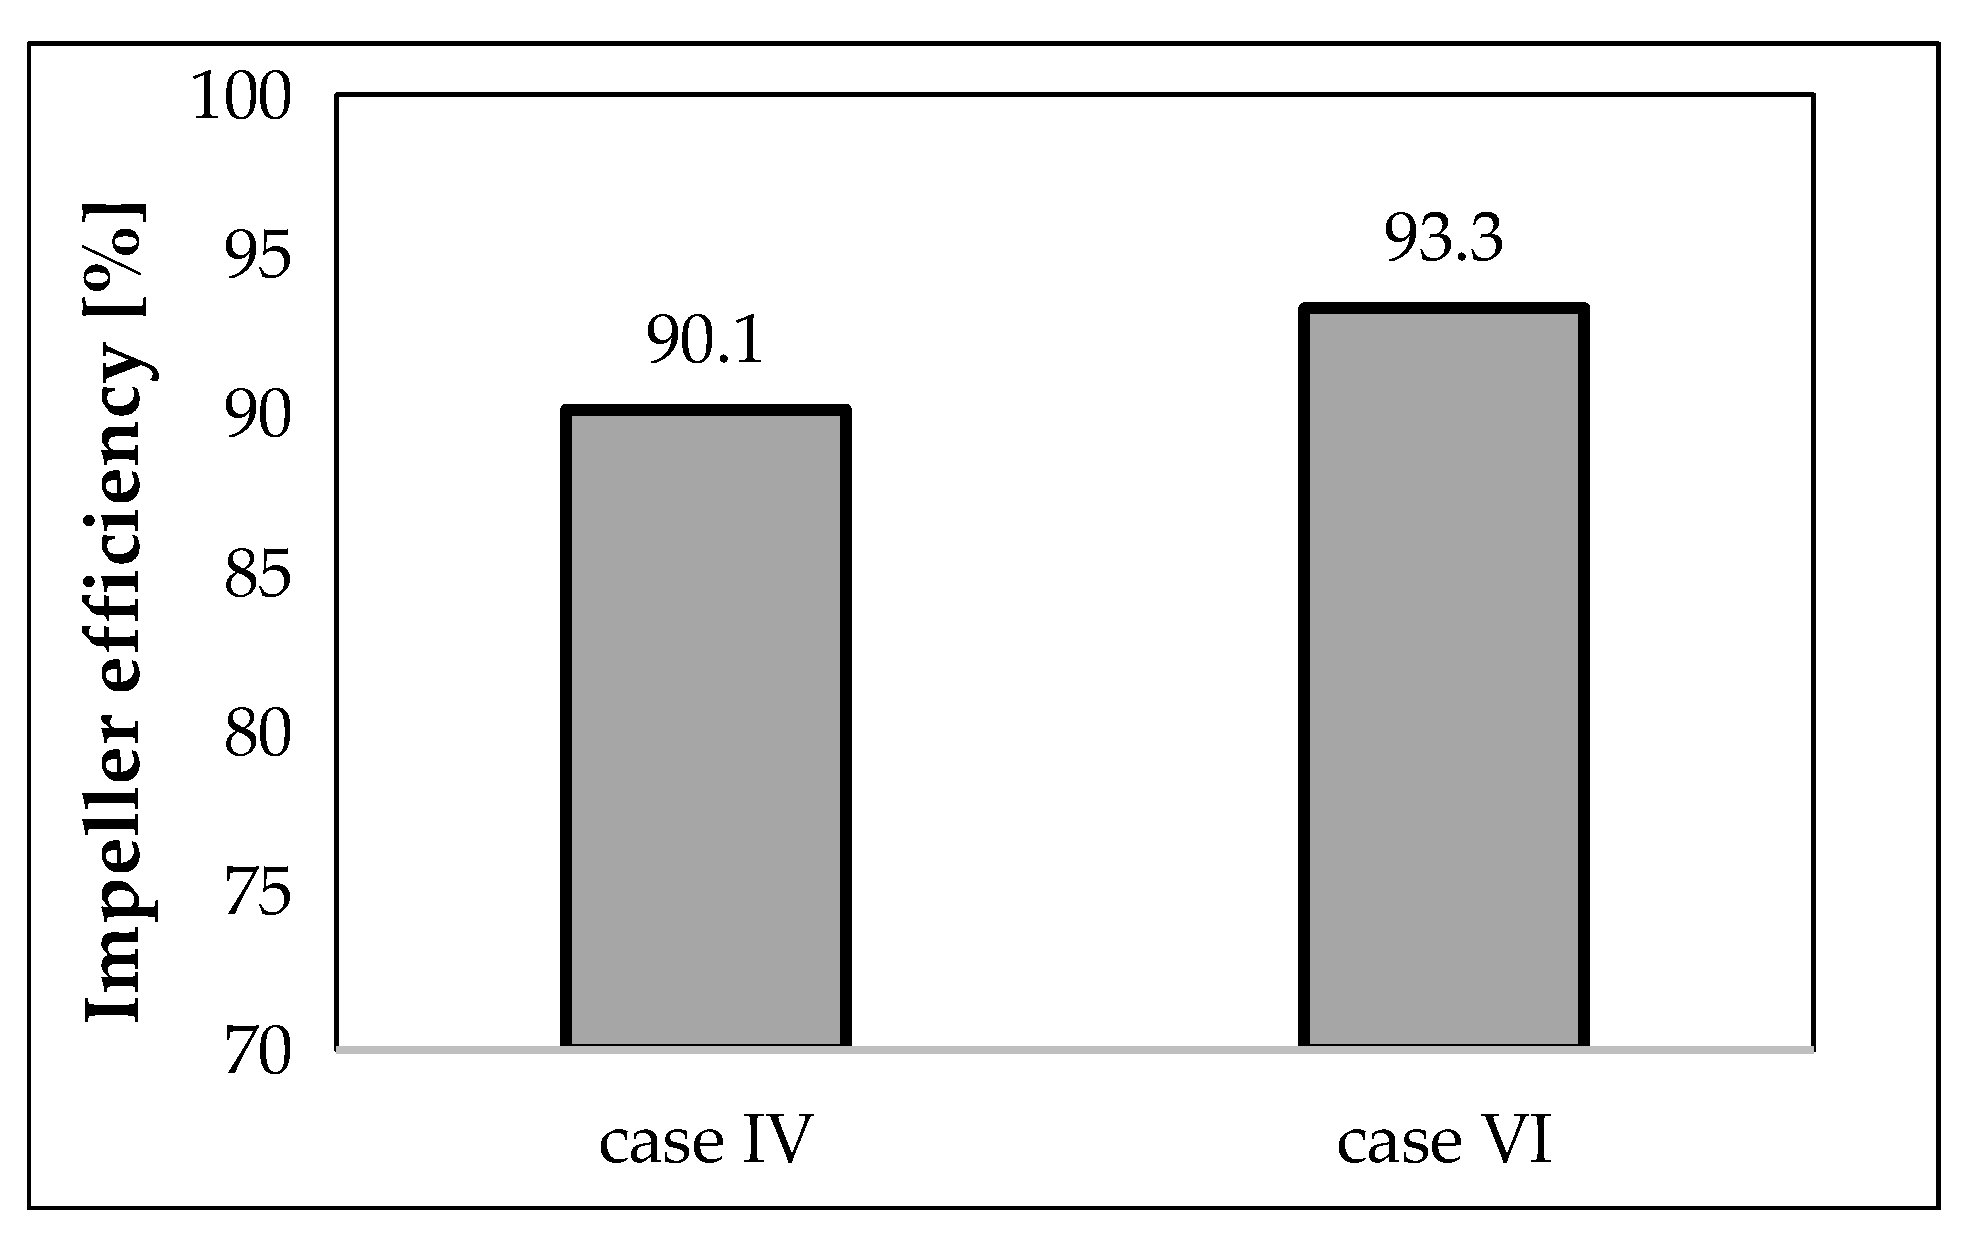
Figure 21.
Impeller geometry. Case IV (gray blades) and VI (red blades) overlapped.

Table 1.
Hardline and softline specifications.
| Hardline | |
|---|---|
| Domain | Value |
| Pump temperature domain | Operational: −20 °C–50 °C |
| Non-operational: −30 °C–60 °C | |
| Flow rate domain | 500–1000 kg/h at 22 ± 2 °C |
| Inlet pressure | between 1.5 and 3.0 [bara 1] without any impeller cavitation |
| Fluid | 3M Novec HFE (hydrofluoroether) 7200 [33] |
| Minimum wall thickness for the printing process | 0.4 mm |
| Softline | |
| Efficiency; torque | |
| Absolute/relative/tangential velocity magnitude outlet | |
| Absolute/relative velocity averaged outlet | |
1 bar absolute.
Table 2.
Overall geometrical parameters for the baseline impeller (case IV).
| Variable | Value | |
|---|---|---|
| Impeller | D1,h [mm] | 10 |
| D1,sh [mm] | 15 | |
| b1 [mm] | 2.5 | |
| D2 [mm] | 36 | |
| b2 [mm] | 1.5 | |
| β1,h [°] | 14 | |
| β1,sh [°] | 14 | |
| β2,h [°] | 20 | |
| β2,sh [°] | 20 | |
| Stagger angle (main blade) [°] | 72.1 | |
| Stagger angle (splitter) [°] | 70.2 | |
| Blade thickness—L.E. [mm] | 1 | |
| Blade thickness—T.E. [mm] | 3.5 | |
| Z (main + splitter) | 6 + 6 | |
| Vaneless diffuser | D3 [mm] | 38.94 |
| b3 [mm] | 0.5 |
Table 3.
Pearson coefficient of each free parameter vs. flow parameter (Latin hypercube).
| Free Parameters | S1_CAMBER_A1 | S1_CAMBER_A2 | S1_CAMBER_A3 | S2_CAMBER_A1 | S2_CAMBER_A2 | S2_CAMBER_A3 |
|---|---|---|---|---|---|---|
| EFF_TOTAL | −0.1932 | −0.1068 | 0.2729 | 0.0214 | −0.1585 | 0.262 |
| EFF_STATIC | −0.2243 | −0.1495 | 0.3201 | 0.0649 | −0.2002 | 0.3314 |
| MASS_FLOW | 0.1348 | −0.0829 | −0.2946 | 0.1108 | 0.1064 | 0.005 |
| TORQUE | 0.3657 | −0.1589 | −0.3198 | 0.0693 | −0.2015 | −0.0793 |
| PRES_LOSS | −0.1238 | 0.1522 | −0.0198 | −0.0234 | 0.2878 | −0.0868 |
| STA_PRES_RISE | 0.1923 | −0.192 | −0.0509 | 0.0582 | −0.3185 | 0.081 |
| TOT_PRES_RISE | 0.1397 | −0.1642 | −0.0125 | 0.0356 | −0.2813 | 0.0891 |
| P_MIN | 0.4076 | −0.1311 | −0.0942 | 0.3074 | −0.093 | 0.0389 |
| P_MIN_SS | 0.4076 | −0.1311 | −0.0942 | 0.3074 | −0.093 | 0.0389 |
| P_MIN_SS_SPLITTER | 0.4076 | −0.131 | −0.0942 | 0.3074 | −0.093 | 0.0389 |
| STATIC_PRESSURE _AVERAGED_OUTLET | 0.1919 | −0.1916 | −0.0496 | 0.0578 | −0.3189 | 0.0808 |
| ABS_TOT_PRESSURE _AVERAGED_OUTLET | 0.1397 | −0.1642 | −0.0126 | 0.0356 | −0.2814 | 0.0892 |
| REL_TOT_PRESSURE _AVERAGED _OUTLET | 0.2865 | −0.1976 | −0.1552 | 0.1134 | −0.3034 | 0.0235 |
| B2B_ABS_FLOW_ANGLE _AVERAGED_OUTLET | −0.0291 | 0.0866 | −0.0525 | 0.0005 | 0.1693 | −0.0775 |
| VR_AVERAGED _OUTLET | −0.0629 | −0.1364 | 0.0639 | −0.1774 | −0.0019 | 0.0879 |
| VT_AVERAGED _OUTLET | −0.0244 | 0.0866 | −0.0515 | 0.0105 | 0.163 | −0.0818 |
| VZ_AVERAGED _OUTLET | 0.1625 | 0.1831 | 0.0061 | −0.0385 | −0.2669 | −0.0879 |
| V_MAG_AVERAGED _OUTLET | 0.0237 | −0.0871 | 0.0516 | −0.01299 | −0.1612 | 0.0817 |
| SWIRL_AVERAGED _OUTLET | −0.0246 | 0.0865 | −0.0515 | 0.0104 | 0.1631 | −0.0819 |
| WT_AVERAGED _OUTLET | −0.0244 | 0.0868 | −0.0516 | 0.0105 | 0.1629 | −0.0817 |
| W_MAG_AVERAGED _OUTLET | −0.0247 | 0.0859 | −0.0515 | 0.0091 | 0.1635 | −0.0815 |
Table 4.
Pearson coefficient of each free parameter vs. flow parameter (optimal D).
| Free Parameters | S1_CAMBER_A1 | S1_CAMBER_A2 | S1_CAMBER_A3 | S2_CAMBER_A1 | S2_CAMBER_A2 | S2_CAMBER_A3 |
|---|---|---|---|---|---|---|
| C_EFF_TOTAL | 0.003 | 0.0896 | 0.4399 | −0.0517 | −0.3016 | 0.0896 |
| C_EFF_STATIC | −0.0315 | 0.0873 | 0.438 | −0.0482 | −0.3052 | 0.0873 |
| MASS_FLOW | 0.2301 | 0.0548 | 0.3924 | −0.0954 | −0.2477 | 0.0548 |
| TORQUE | 0.0969 | −0.3723 | −0.2776 | −0.2143 | 0.1135 | −0.3723 |
| C_PRES_LOSS | −0.1199 | 0.4188 | 0.0751 | 0.3059 | 0.0473 | 0.4188 |
| STA_PRES_RISE | 0.0995 | −0.4213 | −0.0765 | −0.3046 | −0.0495 | −0.4213 |
| TOT_PRES_RISE | 0.1221 | −0.4183 | −0.0691 | −0.3074 | −0.0513 | −0.4183 |
| P_MIN | 0.0075 | 0.3155 | −0.2144 | 0.2898 | 0.2496 | 0.3155 |
| P_MIN_SS | 0.0075 | 0.3155 | −0.2144 | 0.2898 | 0.2496 | 0.3155 |
| P_MIN_SS _SPLITTER | 0.0075 | 0.3155 | −0.2144 | 0.2898 | 0.2496 | 0.3155 |
| STATIC _PRESSURE AVERAGED _OUTLET | 0.0994 | −0.4213 | −0.0767 | −0.3046 | −0.0494 | −0.4213 |
| ABS_TOT _PRESSURE _AVERAGED _OUTLET | 0.1222 | −0.4183 | −0.069 | −0.3075 | −0.0515 | −0.4183 |
| REL_TOT_PRESSURE _AVERAGED OUTLET | 0.0435 | −0.4236 | −0.0691 | −0.3008 | −0.0627 | −0.4236 |
| B2B_ABS_FLOW _ANGLE _AVERAGED _OUTLET | −0.1822 | 0.406 | 0.0901 | 0.3008 | 0.0247 | 0.406 |
| VR_AVERAGED _OUTLET | 0.1126 | 0.0802 | 0.4306 | −0.071 | −0.2837 | 0.0802 |
| VT_AVERAGED _OUTLET | −0.1882 | 0.4041 | 0.0672 | 0.3064 | 0.0406 | 0.4041 |
| VZ_AVERAGED _OUTLET | −0.0802 | −0.2767 | −0.3754 | −0.0934 | 0.1912 | −0.2767 |
| V_MAG_AVERAGED _OUTLET | 0.1878 | −0.404 | −0.0613 | −0.3078 | −0.0449 | −0.404 |
| SWIRL_AVERAGED _OUTLET | −0.1878 | 0.4042 | 0.0678 | 0.3062 | 0.0402 | 0.4042 |
| WT_AVERAGED _OUTLET | −0.1875 | 0.4044 | 0.0691 | 0.3059 | 0.0393 | 0.4044 |
| W_MAG_AVERAGED _OUTLET | −0.185 | 0.4051 | 0.0716 | 0.3055 | 0.0379 | 0.4051 |
Disclaimer/Publisher’s Note: The statements, opinions and data contained in all publications are solely those of the individual author(s) and contributor(s) and not of MDPI and/or the editor(s). MDPI and/or the editor(s) disclaim responsibility for any injury to people or property resulting from any ideas, methods, instructions or products referred to in the content. |
© 2024 by the authors. Licensee MDPI, Basel, Switzerland. This article is an open access article distributed under the terms and conditions of the Creative Commons Attribution (CC BY) license (https://creativecommons.org/licenses/by/4.0/).
Share and Cite
MDPI and ACS Style
Drăgan, V.; Dumitrescu, O.; Dobromirescu, C.; Popa, I.F. Satellite Thermal Management Pump Impeller Design and Optimization. Inventions 2024, 9, 54. https://doi.org/10.3390/inventions9030054
AMA Style
Drăgan V, Dumitrescu O, Dobromirescu C, Popa IF. Satellite Thermal Management Pump Impeller Design and Optimization. Inventions. 2024; 9(3):54. https://doi.org/10.3390/inventions9030054
Chicago/Turabian StyleDrăgan, Valeriu, Oana Dumitrescu, Cristian Dobromirescu, and Ionuț Florian Popa. 2024. "Satellite Thermal Management Pump Impeller Design and Optimization" Inventions 9, no. 3: 54. https://doi.org/10.3390/inventions9030054