1. Introduction
With the advances in smart-grid technologies and the integration of distributed energy resources (DERs), the electric distribution system has been changing rapidly [
1,
2,
3,
4,
5]. These infrastructural changes pose multiple challenges for electric distribution service providers. The inherent variability of renewable generation and the vulnerability of traditional power systems to the demand and load stochasticity, can potentially result in poor service reliability and quality [
6,
7,
8,
9]. Energy storage (ES) systems have been identified as a potential solution to maintain strict power quality and reliability standards, by both utilities and researchers [
10,
11,
12]. Including ES technology in distribution plans can enable utilities, system operators, and end users to increase power reliability and reduce the cost of electricity [
12,
13,
14]. Additionally, ES systems aid distribution grid flexibility, as they can help integrate variable generation resources such as wind and solar [
15,
16,
17,
18]. Given various applications of ES systems, a distribution system planning framework is called for that incorporates the potential impacts and benefits of ES deployments.
Several studies have assessed the values of integrating ES systems into the distribution circuits. To reduce the impacts of renewable energy resources, ES has been used for multiple grid support applications, such as load management, voltage regulation, and frequency support [
15,
16,
17,
18]. References [
18,
19,
20] describe the benefit of ES in providing a photovoltaic (PV) smoothing service by reducing the PV generation variability. ES can also be employed to provide peak load shaving [
21] and to support the grid during outages [
22]. According to [
18,
21,
23], ES is efficient at providing voltage regulation in distribution circuits with a high penetration of PV. The application of ES in providing frequency regulation is presented in [
18,
24,
25]. So far, however, these technical studies have not quantified the benefits of ES deployment in simultaneously providing multiple grid benefits. With the ongoing efforts to make ES systems cost-competitive [
26] and an increasing number of successful ES demonstration studies [
27], a systematic approach to evaluate the grid impacts and benefits of ES systems is called for. Grid integration tools should be able to identify suitable ES applications, sizes, and deployment locations, by using domain-specific knowledge.
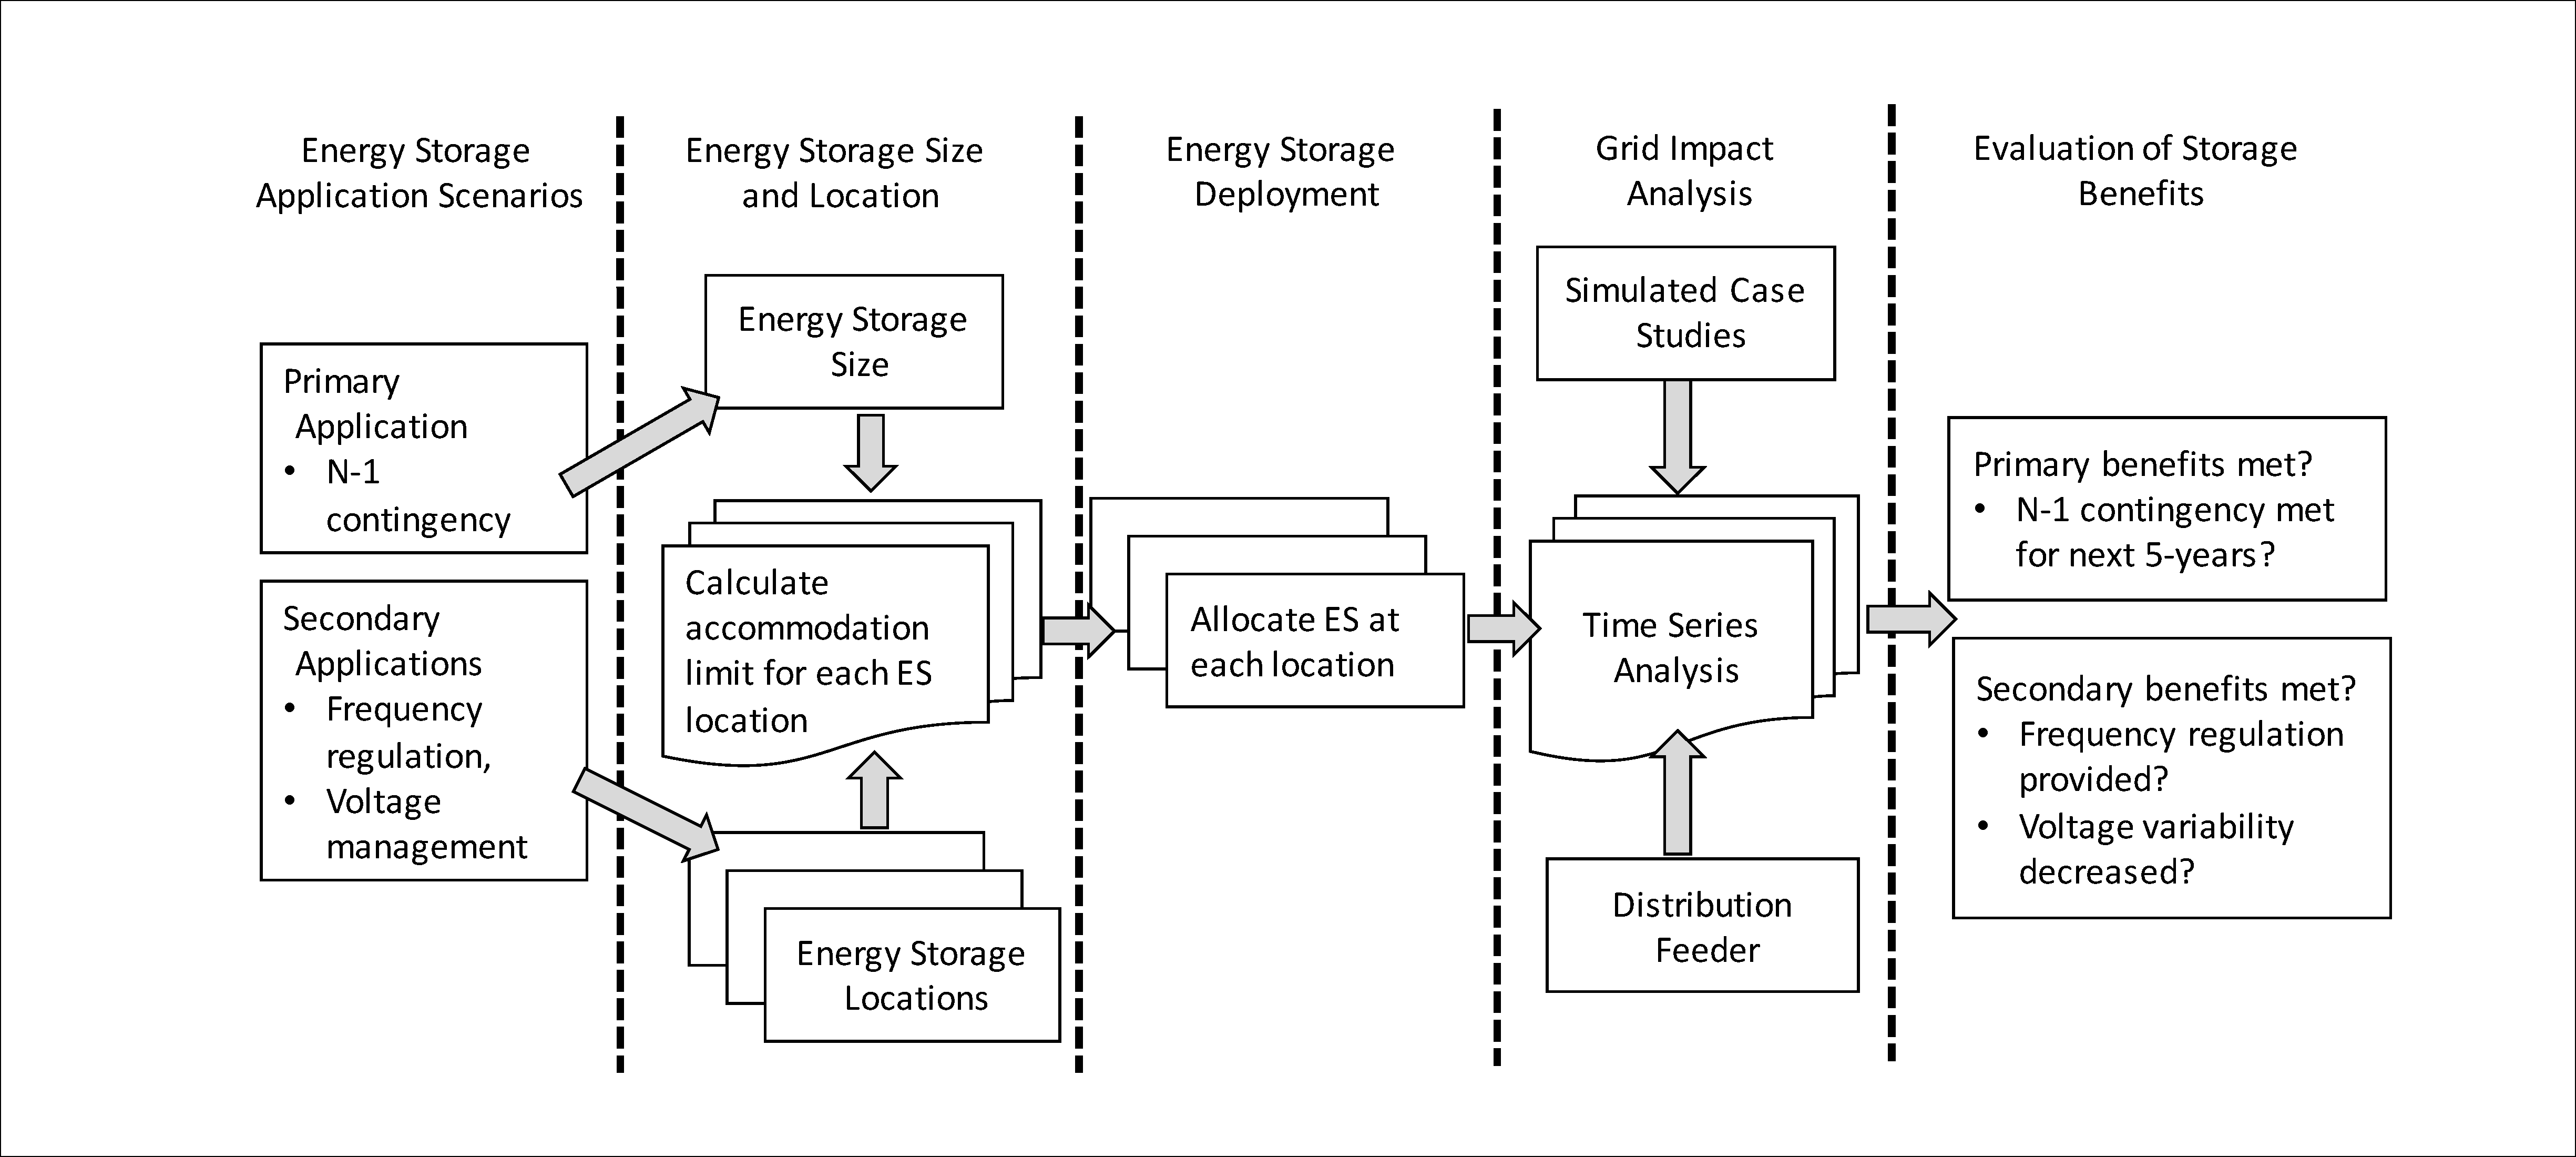
The objective of this study is to develop a systematic approach for integrating an ES system into a given distribution grid. This paper presents an approach to deploy an ES system, to provide multiple grid benefits, also termed stacked-benefits, for the feeder. The optimal ES size and locations are obtained based on the stacked-benefit application scenario and distribution system grid impact analysis. This paper also shows that ES can simultaneously provide multiple benefits for the distribution feeder. For this study, the ES system is expected to provide the following stacked benefits: (1) primary application—N-1 contingency requirements; and (2) secondary applications—voltage management and frequency support applications. Note that, although the proposed framework is applicable to any ES technology capable of providing active and reactive power support, the presented framework mostly focusses on battery ES systems.
1.1. Distribution-Level Energy Storage Deployment
A brief review of use cases for distribution-level ES deployment is presented in this section. Broadly, ES systems can be deployed to provide system-level benefits and customer-level benefits. When deployed for system-level benefits, ES systems are programmed to provide operational benefits to utility companies in the form of grid services. When deployed for customer-level benefits, ES systems are programmed to meet specific service quality and reliability requirements for the individual customers.
1.1.1. System-Level Benefits
Defer Distribution System Upgrades—With an increase in the yearly peak load demand, the substation and distribution lines may require expensive upgrades. If the cost-benefits analysis allows, an ES system may be deployed to decrease the peak load demand and defer any immediate distribution system upgrades.
Support DER Integration—As stated previously, integrating a large percentage of DERs can result in multiple grid issues requiring grid upgrades. ES has been shown to be beneficial in mitigating the impacts of DERs by supporting applications such as load shifting to mitigate off-peak generation, voltage management to mitigate overvoltage concerns, and voltage control to mitigate DER variability.
Support Energy Arbitrage/Electricity Price Shift—ES can help distribution utilities in decreasing the yearly cost of the electricity by participating in the electricity market. ES can be programmed to charge and discharge as the electricity rates fluctuate, thus decreasing yearly electricity costs.
Provide Ancillary Services—ES can be programmed to provide ancillary services for frequency regulation based on the feeder’s open access transmission tariff.
1.1.2. Customer-Level Benefits
Voltage Management—Traditionally, voltage management is pursued using load-tap changers and capacitor banks. For a feeder with high DER penetrations, the voltage management will require new methods using faster voltage control devices. In such cases, ES inverters can provide voltage regulation services to mitigate overvoltage and voltage variation concerns.
Provide Reliability Benefits—When deployed for providing reliability benefits, ES will discharge to support the connected loads during an outage, thus decreasing both the Customer Average Interruption Frequency Index (CAIFI) and the Customer Average Interruption Duration Index (CAIDI).
Demand Charge Management—The demand charge is a billing mechanism used to recover the cost of providing a transmission and distribution service to commercial customers. The demand charge for a month is calculated based on the largest peak demand recorded over the month. ES systems are deployed to decrease the monthly peak load demand and decrease the total customer demand charge.
1.2. Objectives and Assumptions
The objective of this paper is to present a systematic approach for planning the deployment of ES units for a distribution system. For the deployment to be economical, ES should be integrated to provide multiple grid benefits, also known as stacked benefits. Depending upon the feeder, the planner first needs to identify the primary or secondary benefits of ES deployment. The primary application is the one that is either most critical or will generate the most revenue for the distribution system. The secondary applications correspond to the additional grid benefits that ES can provide, in addition to the primary application. Multiple secondary benefits of ES should be identified, depending upon the feeder and the use case. Next, a systematic approach should be developed to evaluate the efficacy of ES deployment in providing multiple/stacked grid services.
In this paper, we present a step-by-step approach for ES integration analysis, starting with the assessment of ES requirements for the grid, the method used to calculate the ES system size, the identification of optimal ES locations while accounting for the grid impacts of ES deployment, and finally, the verification of ES benefits through simulation. We identify three important aspects of ES deployment: (1) ES deployment should be economical; (2) ES deployment should not result in any operational concern for the grid; and (3) ES must provide the intended grid benefits. In this regard, we demonstrate a stacked application case for ES deployment. The ES is sized for the primary application scenario. To ensure that ES deployment does not cause additional operational concerns, the largest allowable limits of the ES capacity for each potential ES location are determined. Next, a grid impact analysis is completed to verify and demonstrate that an ES can provide the intended grid benefits.
In this study, the ES system is sized and deployed for the following stacked benefit application scenario: (1) Primary application—provide N-1 contingency for the substation transformer; and (2) Secondary applications—frequency regulation and voltage management services. The distribution circuit selected for this analysis is adapted from EPRI’s 34.5-kV test circuit [
26]. We also include the data and modeling requirement to enable the proposed ES integration analysis framework (see
Section 2). The proposed framework for ES integration analysis is detailed in
Section 3, followed by the verification method and results in
Section 4. Finally, conclusions are presented
Section 5.
1.3. Contributions
This paper provides a systematic approach for evaluating the grid impacts and benefits of ES deployment for a multiple/stacked application scenario. The ES system is planned to simultaneously provide multiple grid benefits. A primary grid benefit, potentially the most critical application, is identified. The ES is programmed to provide secondary benefits, when not required for the primary application. We develop a control method to program the ES system for voltage management and frequency regulation support. Voltage management is achieved using Volt-VAR control, while frequency regulation is provided by charging and discharging the ES, based on the frequency control signal. We also present an approach to size the ES, based on the primary benefit i.e., N-1 contingency requirement using a percentile analysis. Next, optimal locations for ES systems are identified, while including their impacts on the feeder. Finally, using simulations, we demonstrate the proposed approach for the selected feeder.
The purpose of this paper is to provide a methodology that can essentially help include ES into the distribution planning framework. In this regard, the proposed approach is generic and applicable to a different set of primary and secondary application cases. We also provide details on the data and model requirements for the proposed study. Therefore, the proposed framework can be easily used by utility providers to assess the applicability of ES deployment for their feeder.
3. Proposed Analysis Framework
In this paper, we present a planning approach for the stacked benefits application of an ES simultaneously providing: N-1 contingency, voltage management, and frequency regulation services. The primary application for the ES is providing N-1 contingency support. Therefore, when the feeder requires contingency support, 100% of the ES is deployed to mitigate the substation transformer overloading. When contingency support is not required, ES is committed to providing secondary benefits, i.e., voltage support and frequency regulation. The energy storage commitment for both voltage management and frequency regulation support is assumed to be 50%.
3.1. Define/Identify Application Scenario
In this section, the details of both primary and secondary application cases are presented, along with an ES control scheme used to provide the stacked grid benefits.
3.1.1. Primary Application Scenario—N-1 Contingency
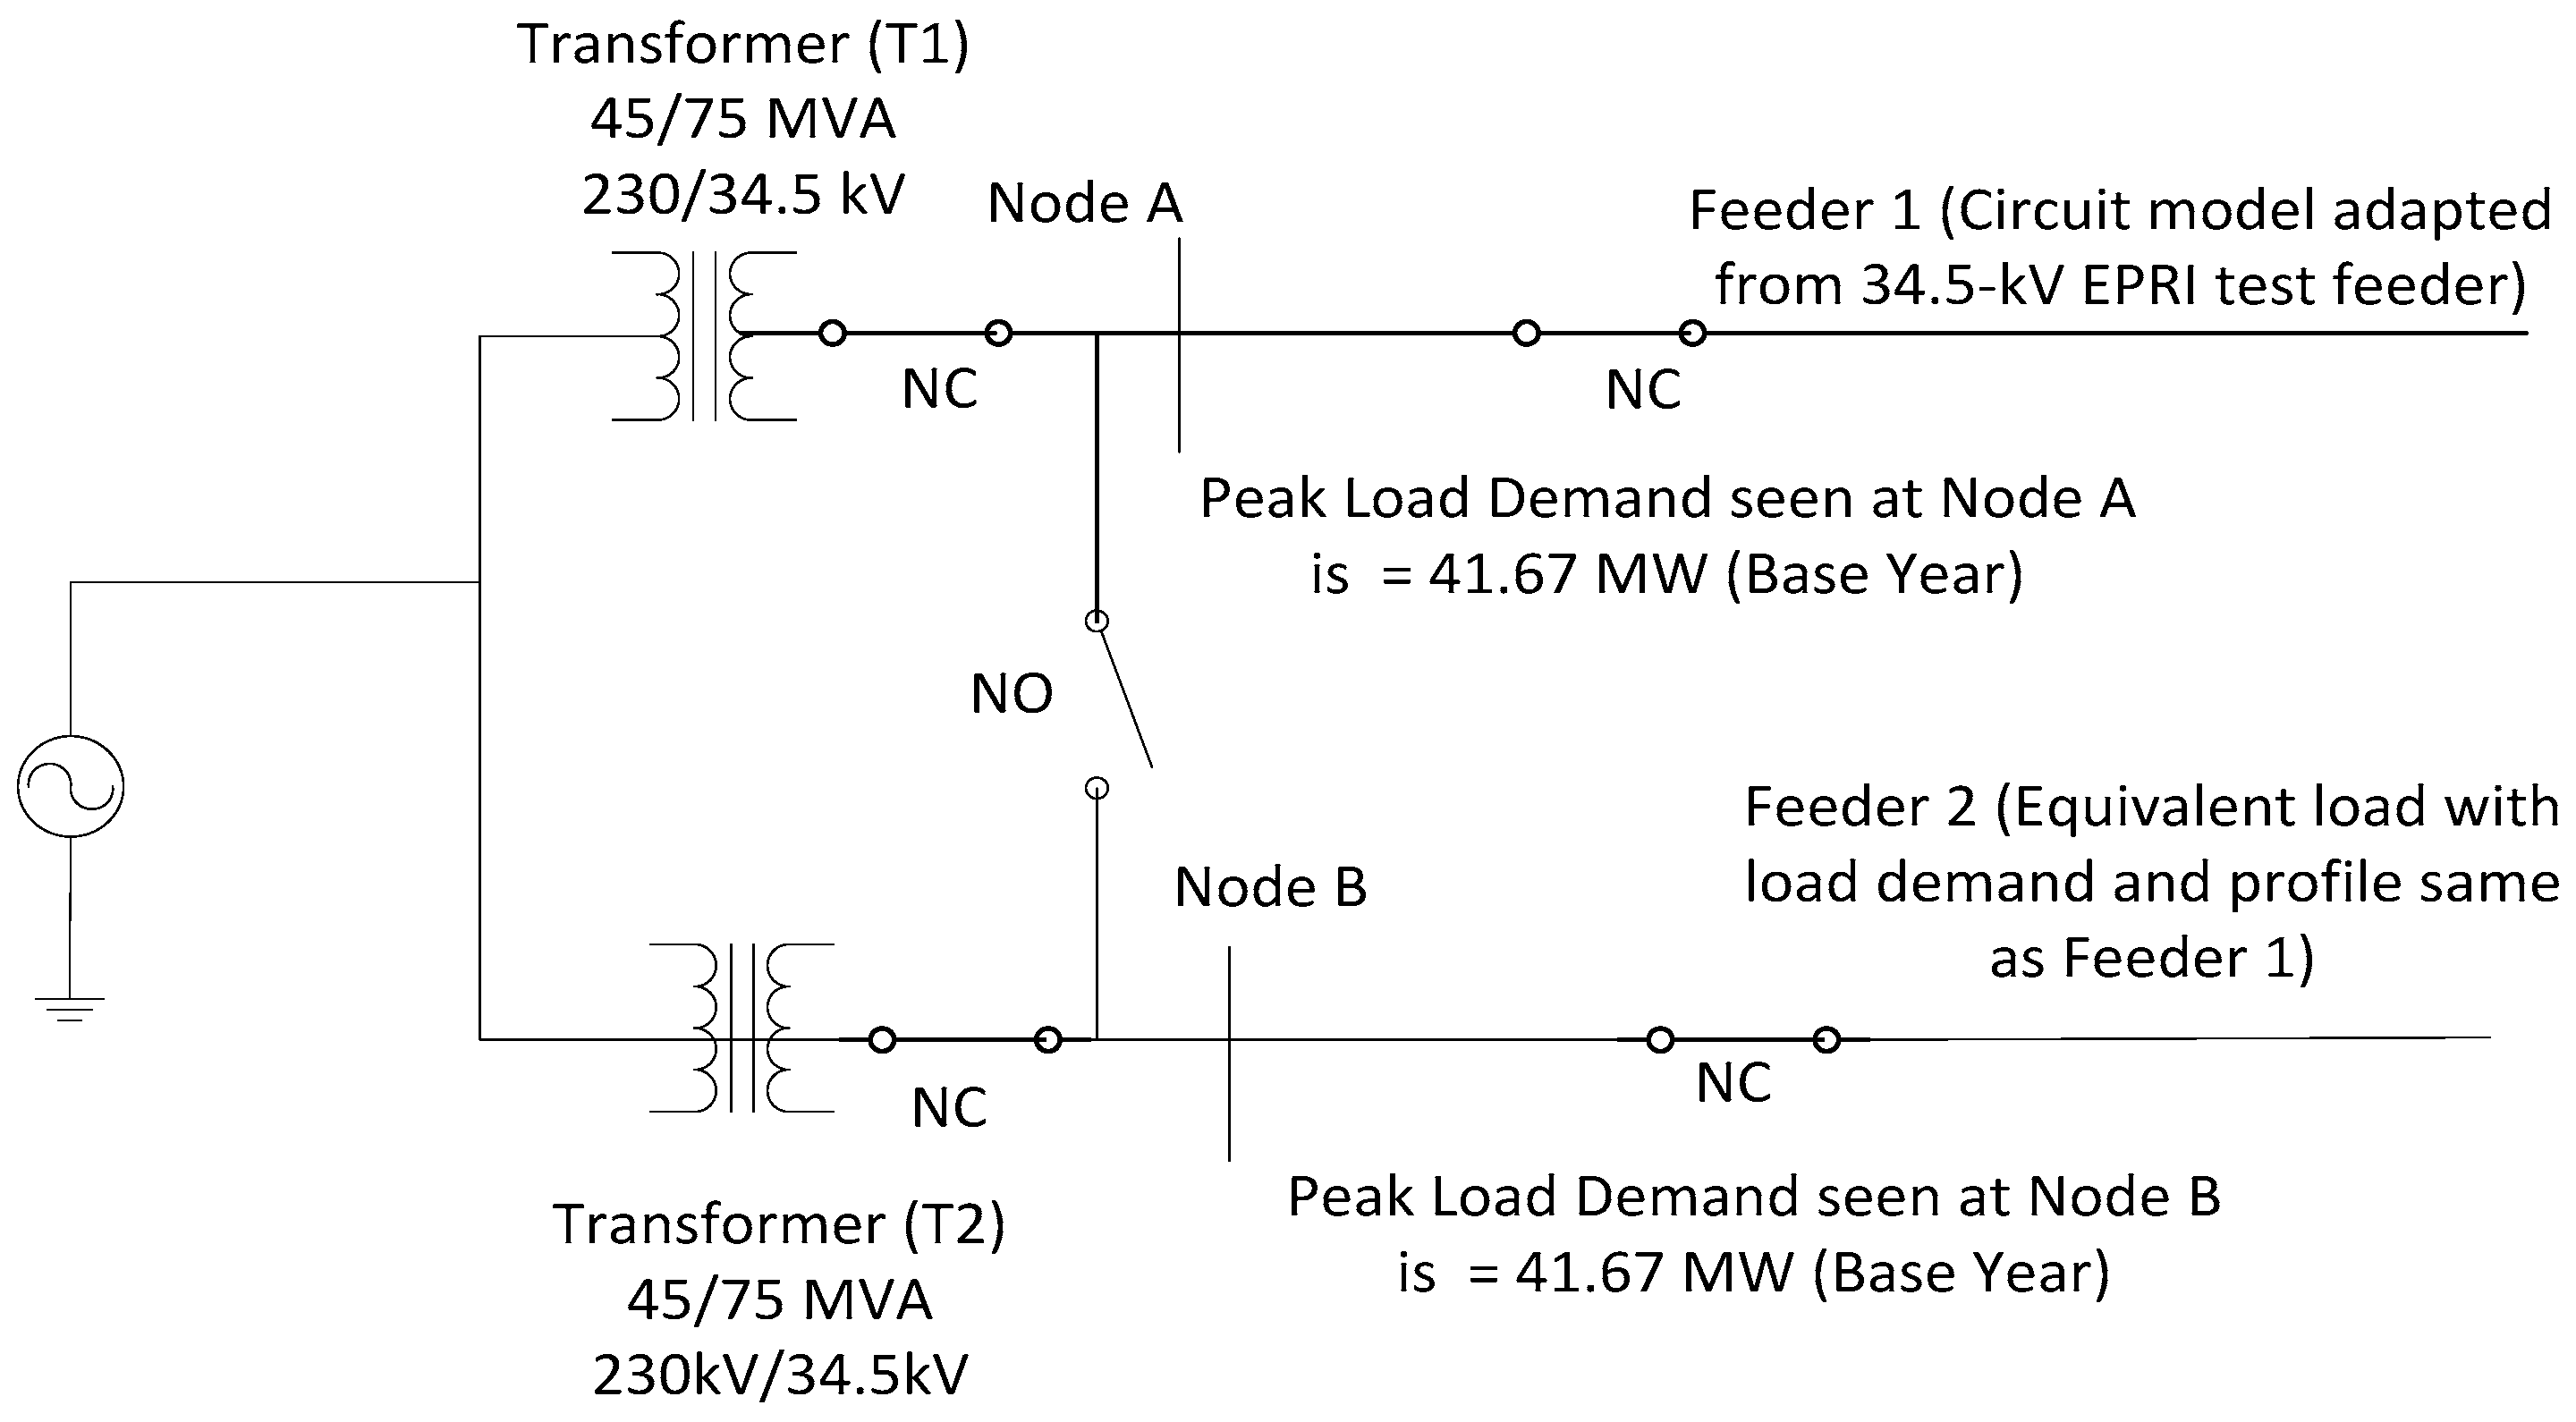
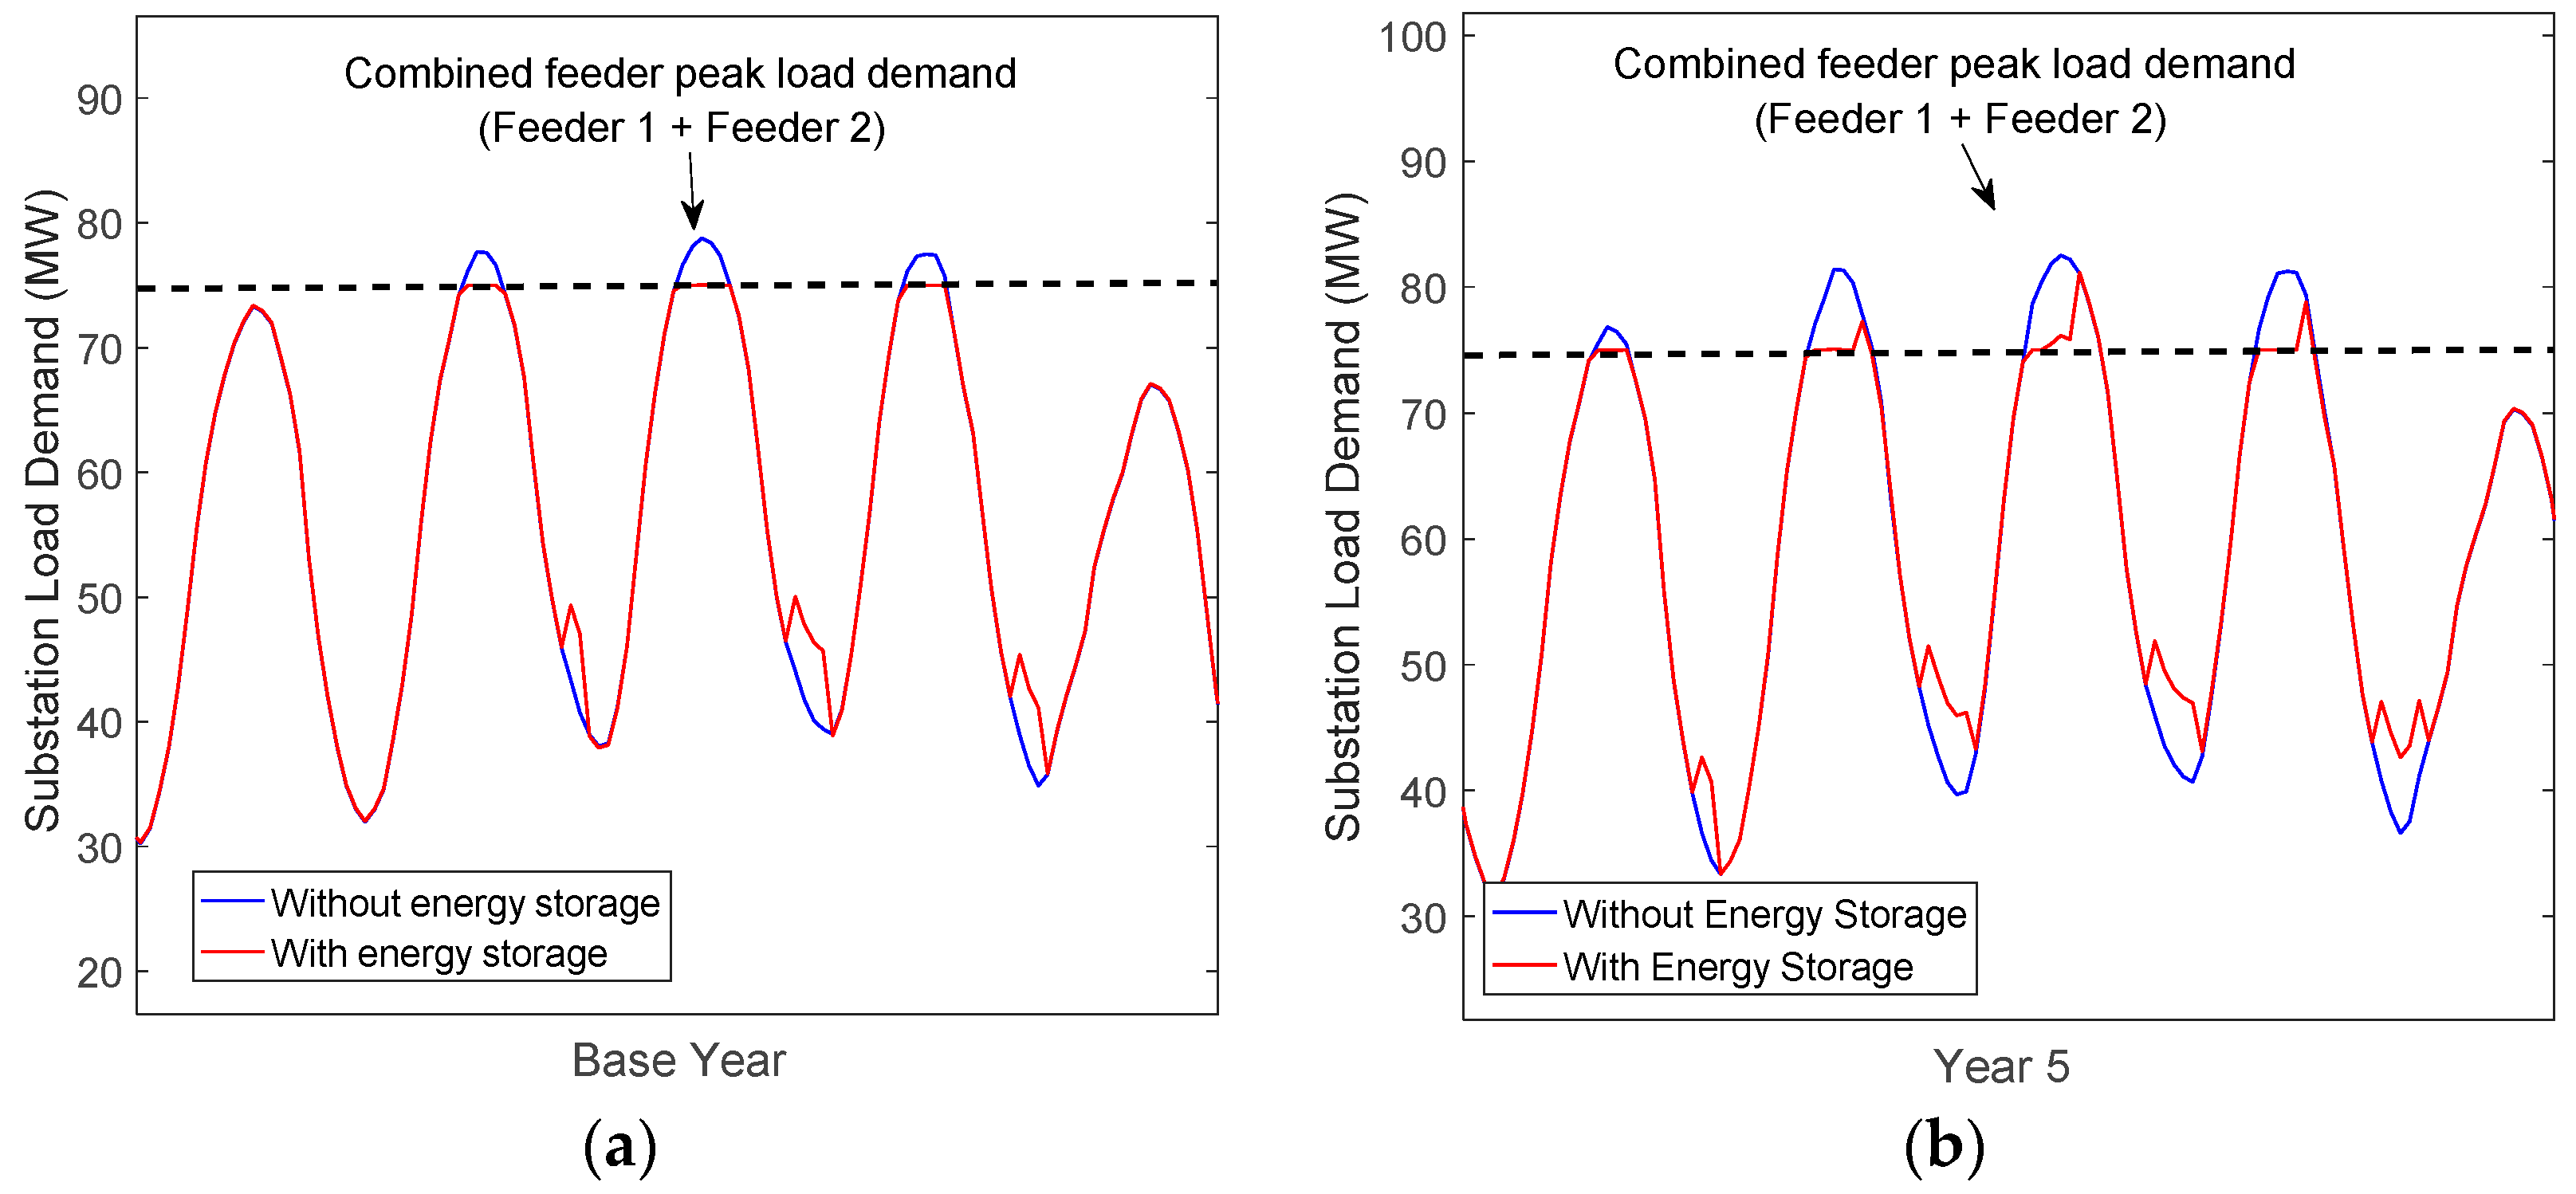
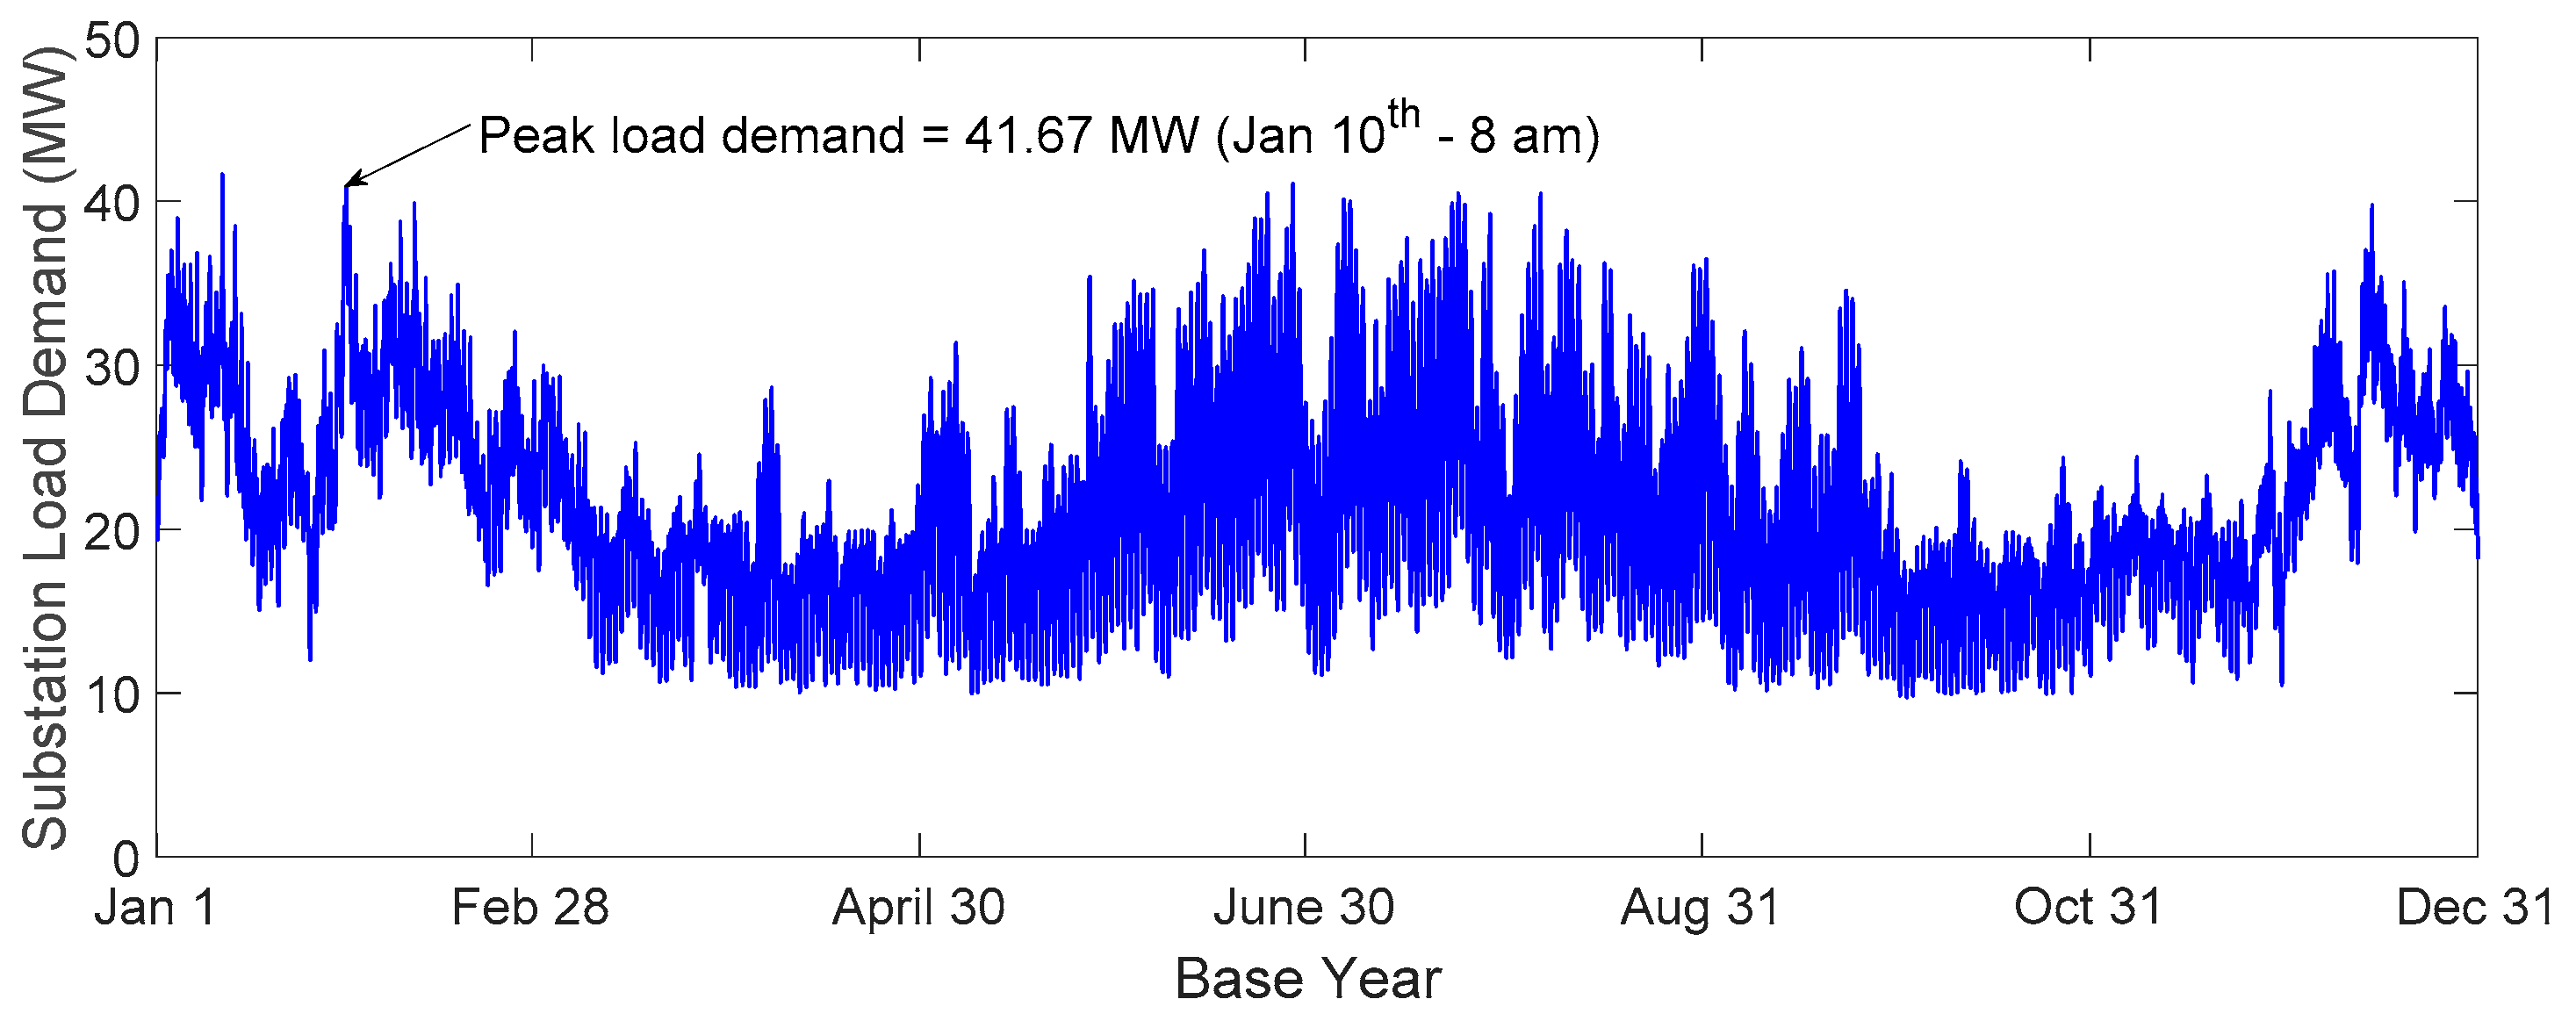
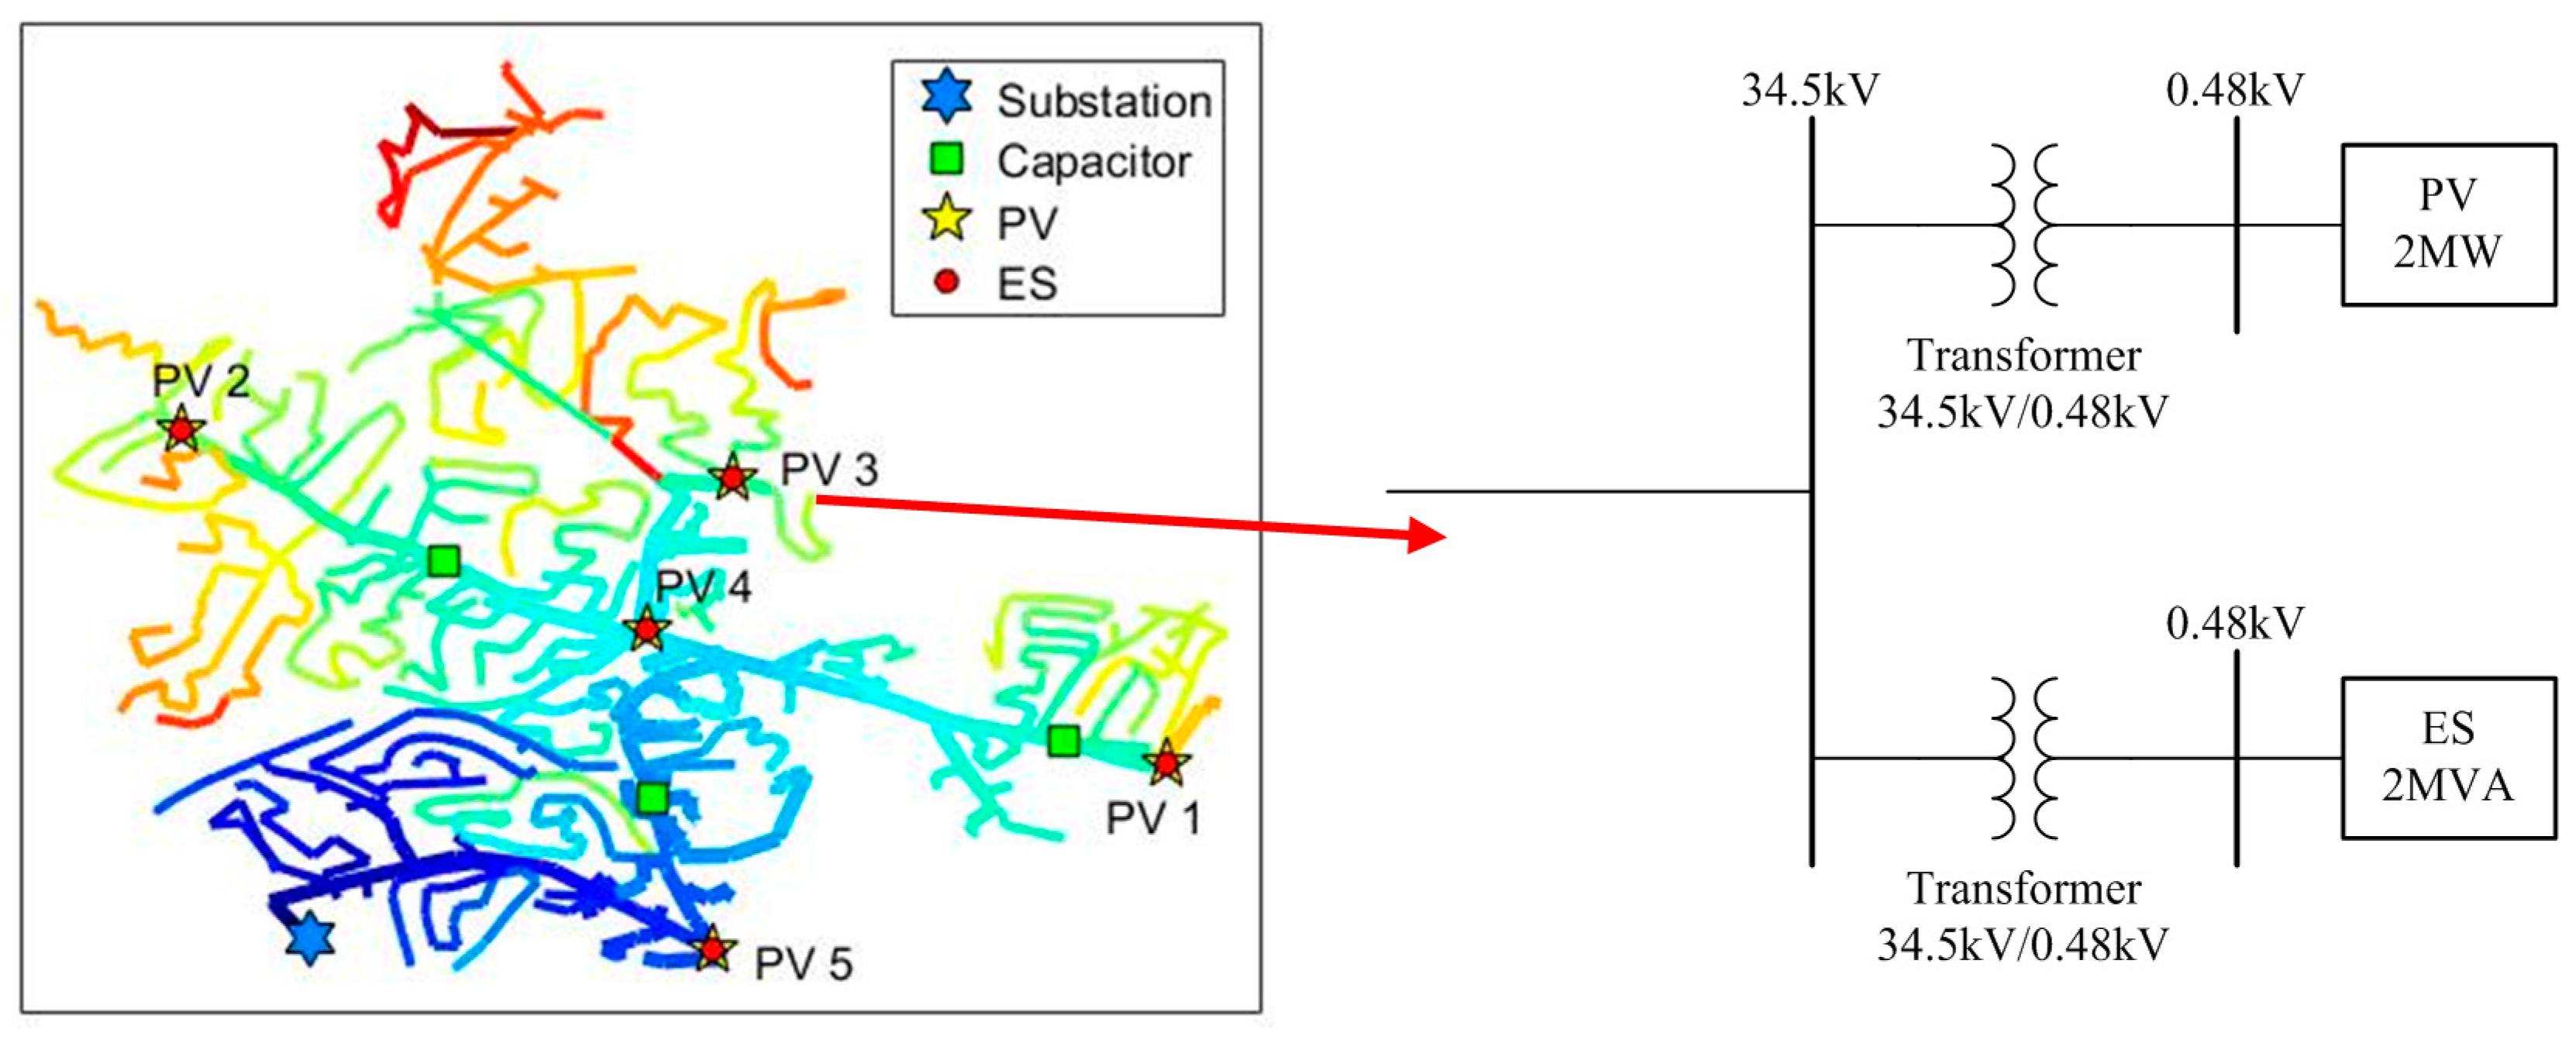
The ES system is primarily deployed to provide the N-1 contingency requirement for the substation transformer. The one-line diagram for the distribution circuit under analysis is shown in
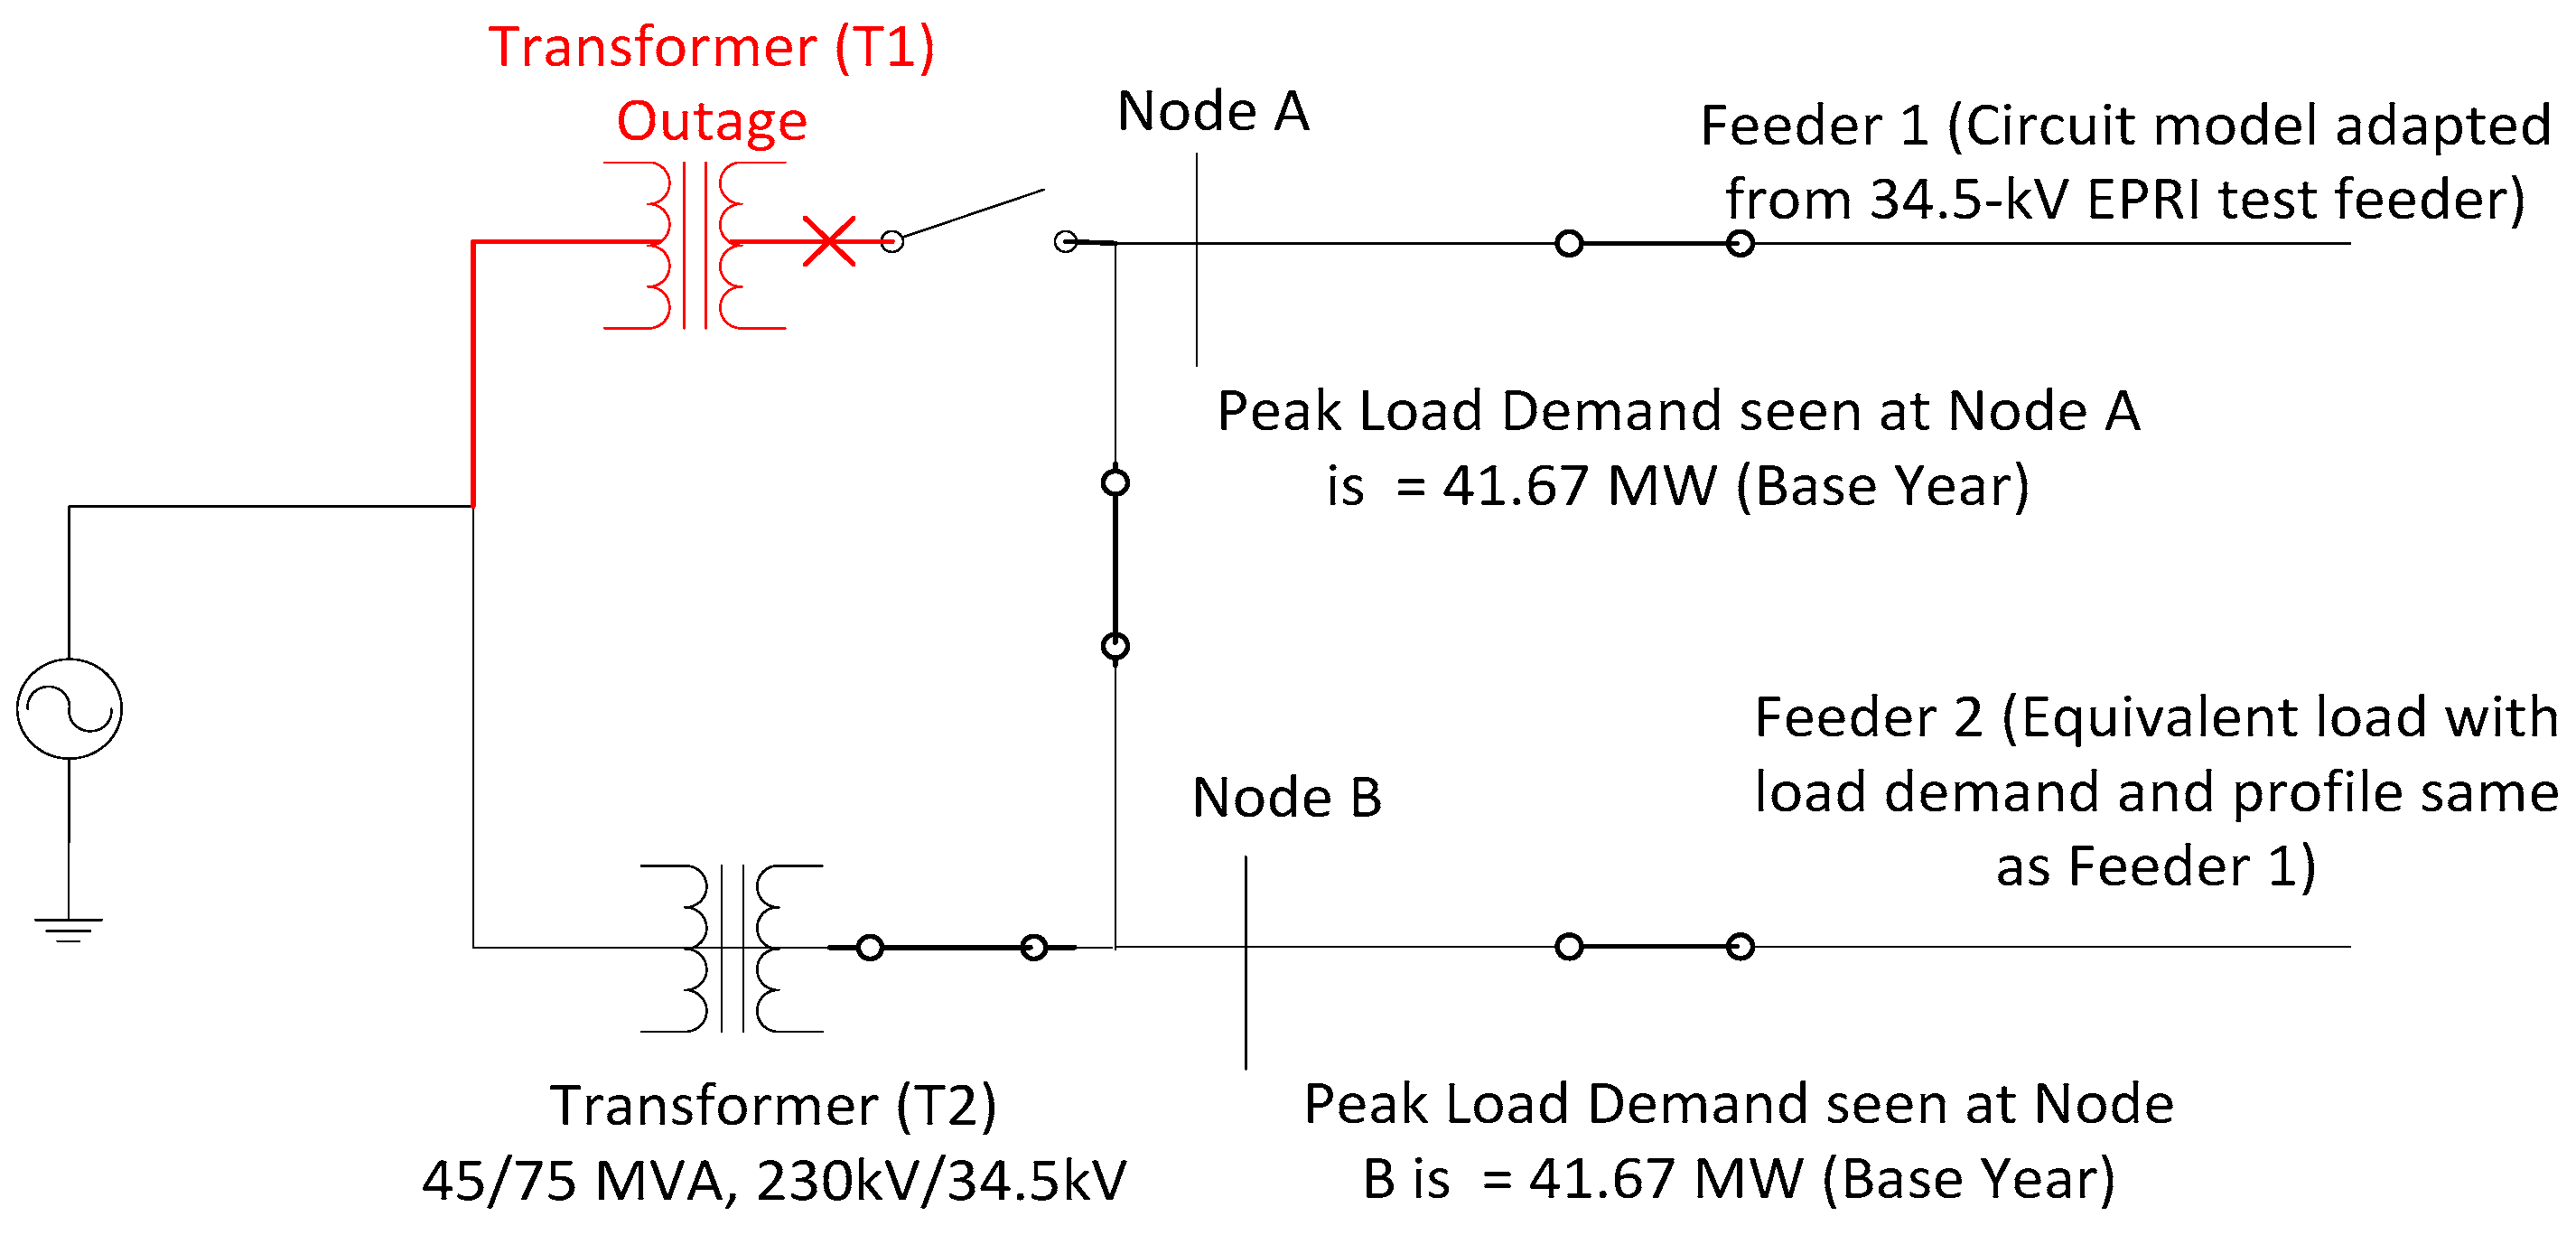
Figure 2. Two identical transformers with a nominal rating of 45 MVA and an emergency rating of 75 MVA are connected to the substation. Each transformer serves a distribution feeder with a peak load demand of 41.67 MW, measured during the base year (Year 1). It is assumed that, under normal conditions, both transformers are in service. The N-1 contingency condition is simulated by applying a fault at the secondary of the transformer T1. In this case, the other transformer, T2, is required to serve both feeders (see
Figure 5). Based on the peak load demands of both feeders, the worst-case demand of transformer T2 during the base year is 83.34 MW. The N-1 contingency requirement is not satisfied for the base year, as the worst-case load demand exceeds the transformer’s emergency rating.
The following assumptions are made for ES deployment to provide N-1 contingency support:
The ES is planned for five years, since the N-1 contingency requirement is not met.
The yearly load profile at a 1-h resolution is available for the base year. A 1% load growth per year is assumed to project the yearly load demand for the future years.
The ES system size is determined based on a percentile analysis on the five-year load demand data, including available measurements for the base year and projected measurements for the future years.
3.1.2. Secondary Application Scenarios—Voltage Management and Frequency Regulation
As mentioned before, the ES in this study is deployed to provide the following secondary benefits: (1) voltage management; and (2) frequency regulation or ancillary services by participating in the ISO market. An ES participates in ancillary service/frequency regulation by generating or absorbing real power based on the frequency regulation signal [
31]. Voltage management is achieved using Volt-VAR control of the smart inverter connected to the ES system. Since the feeder contains PV systems, the ES is deployed to mitigate voltage variations resulting from PV variability. Note that the feeder voltages will also fluctuate due to the participation of the ES system in providing ancillary services. Thus, ES needs to mitigate the voltage variation due to both PV variability and the ES charge/discharge frequency regulation schedule. The ES system is committed to providing 50% to voltage support and another 50% to the frequency regulation service.
Voltage Management
For the voltage management service, the control objective is to mitigate the voltage variations due to both PV variability and the ES charge/discharge frequency regulation schedule. The feeder voltages can be regulated using real and reactive power control, although a reactive power control mode may incur an additional cost for the smart inverter. Additionally, this control method, unlike real power control, does not deteriorate the battery life-cycle. Also, when it is in reactive power control mode, ES is not generating or absorbing any real power, so it need not be oversized to meet multiple objectives.
In this paper, the reactive power control mode is implemented for voltage management. The inverter of ES is controlled to generate or absorb the reactive power, to mitigate the voltage variations due to both PV variability and the ES charge/discharge frequency regulation schedule. The reactive power supplied or consumed by the ES inverter is calculated from both the change in PV generation and the change in ES charge/discharge (1).
where, ∆
QES is the change in the reactive power supplied or absorbed by the ES inverter, ∆
PPV is the change in the PV generation power, ∆
PES is the change in the ES charge or discharge power in response to the frequency regulation schedule,
Rth is the real part of the short-circuit impedance at the ES location, and
Xth is the imaginary part of the short-circuit impedance at the ES location. Note that
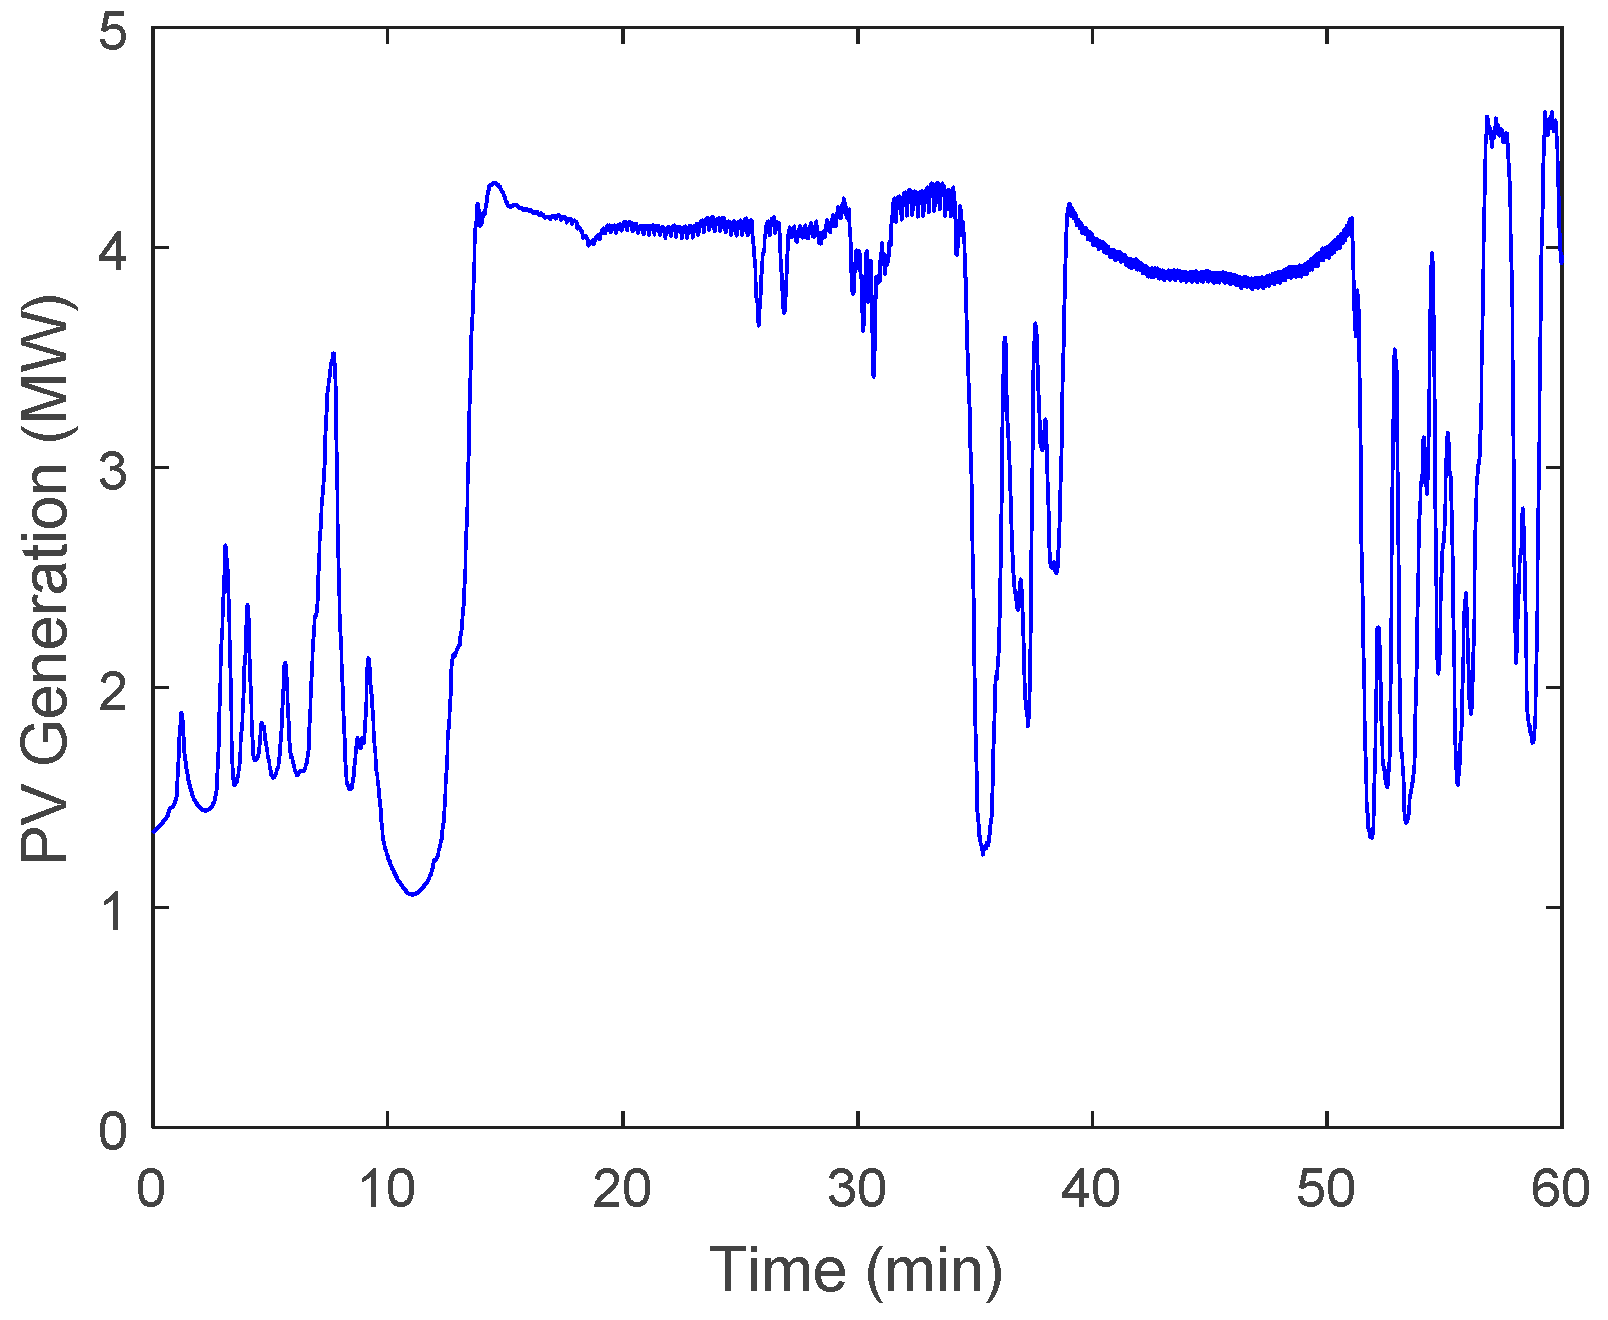
∆PPV and
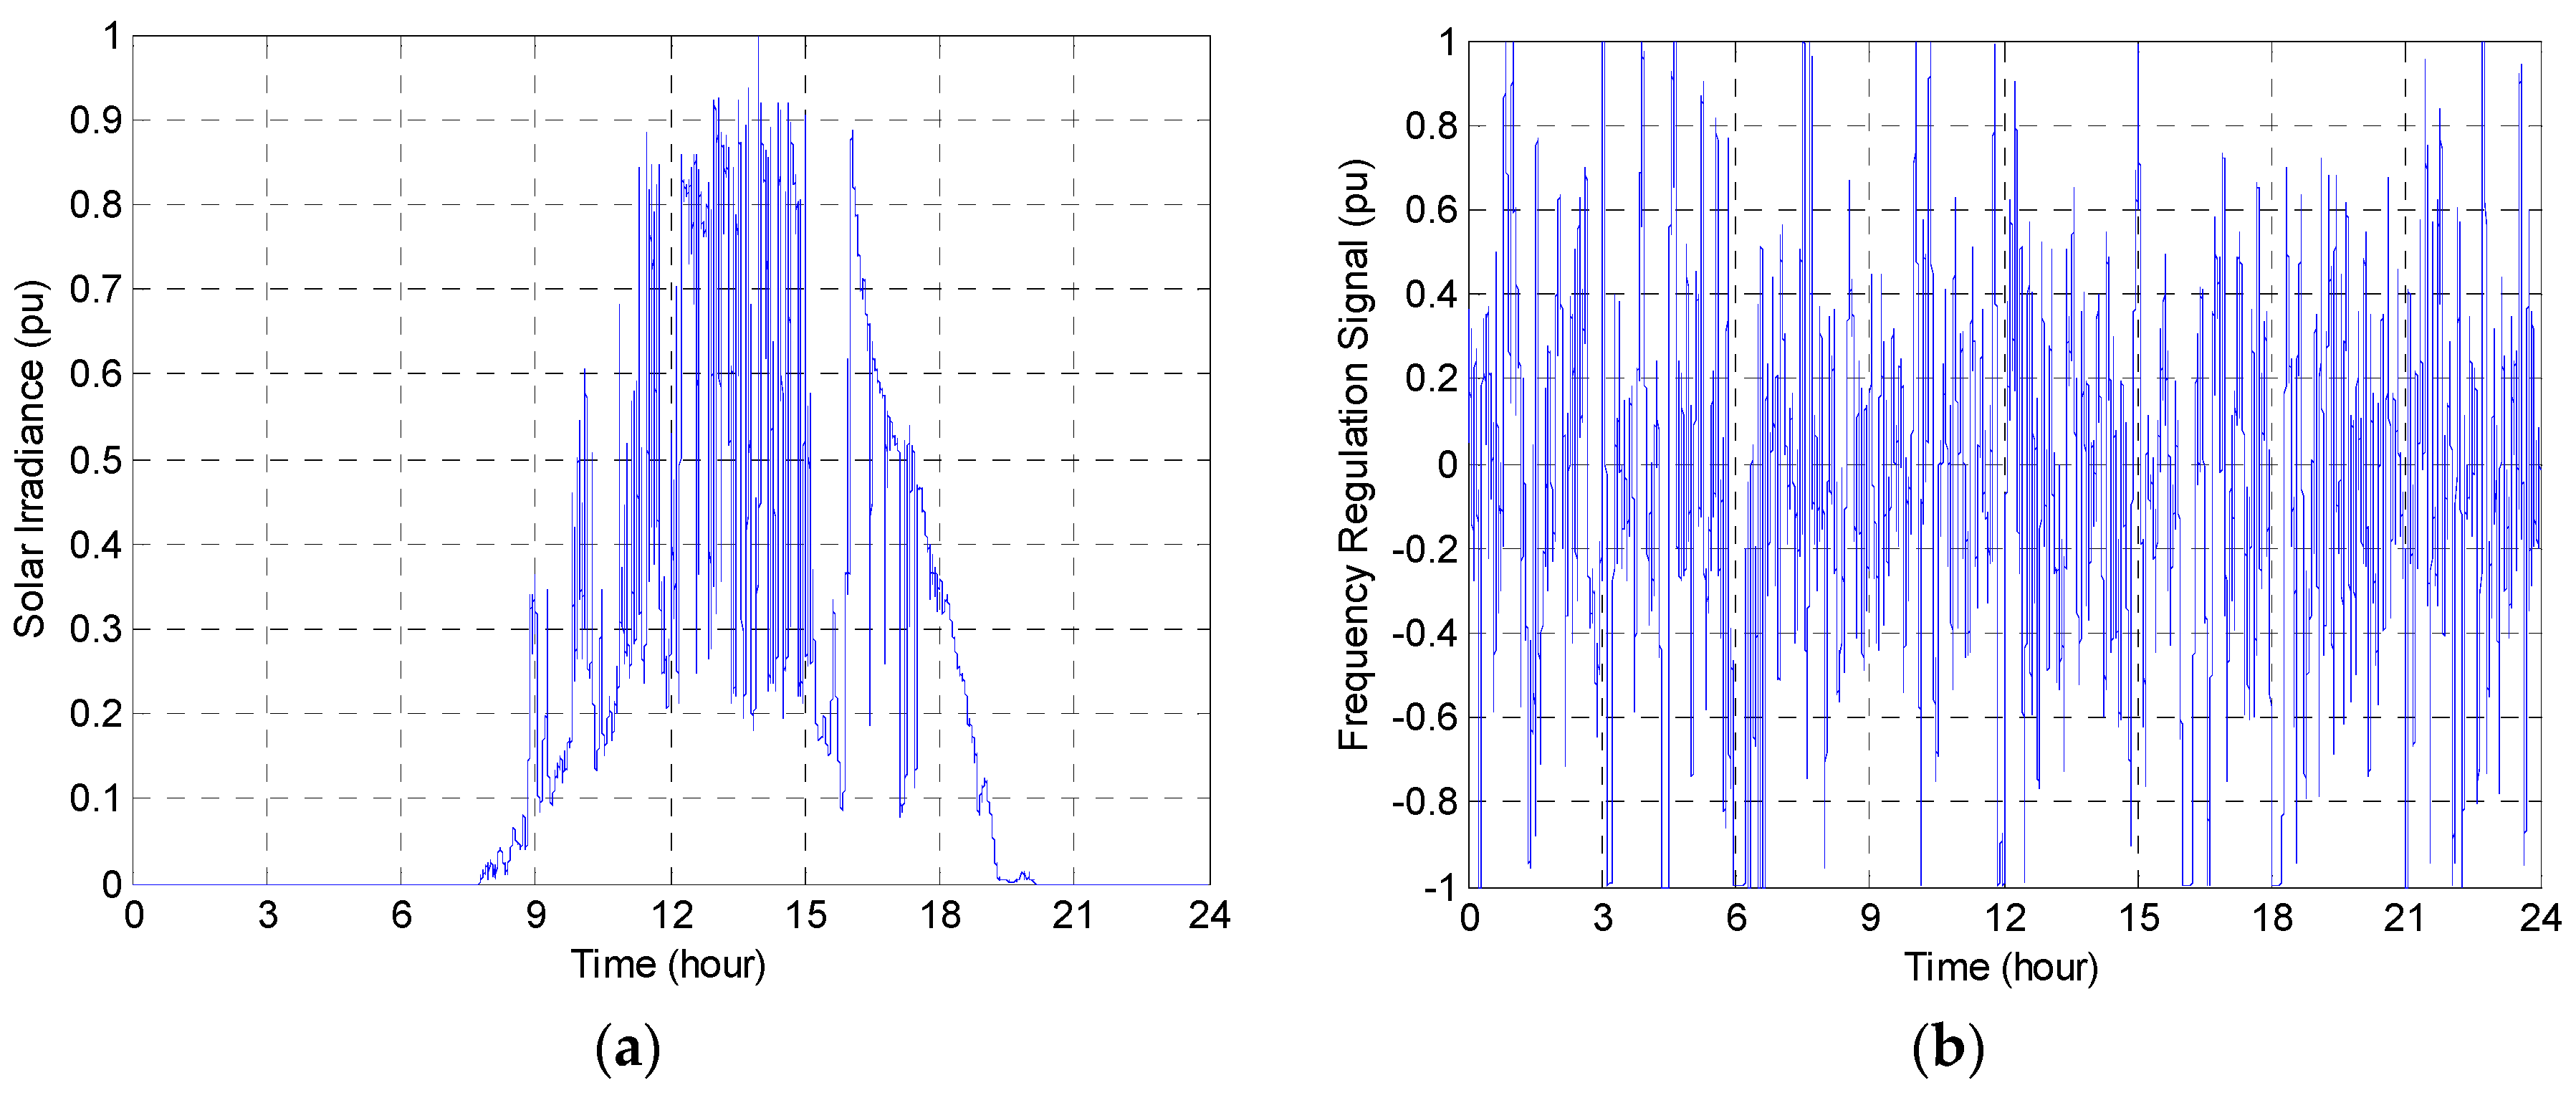
∆PES are measured as the difference between the present PV and ES real power, and the 15- and 30-min moving average PV and ES real power, respectively. The PV generation follows the solar irradiance profile curve recorded on a high variability day with a one-second resolution, shown in
Figure 6a.
Frequency Regulation
For the frequency regulation service, the control objective is to consume or produce real power to participate in ancillary service/frequency regulation in an ISO market. In this paper, ES is programmed to charge or discharge, according to the frequency regulation signal provided by [
32]. There are two regulation signals calculated from the area control error signal (ACE): RegA and RegD. Both RegA and RegD signals are in per-unit with 2-s resolution.
RegA Signal: This signal is generated by passing the ACE signal through a low pass filter. The RegA signal is used for traditional regulating resources.
RegD Signal: This signal is generated by passing the ACE signal through a high pass filter. The RegD signal is used for dynamic or fast response resources.
This paper uses a 2-s resolution RegD frequency regulation signal generated for one day, as shown in
Figure 6b [
32]. For the frequency regulation service, the positive value signal instructs the ES to discharge (acting as a generator), while the negative signal instructs the ES to charge (acting as a load). The signal (in per unit) is multiplied by the power rating of the ES and the commitment level (50%), to obtain the ES charge and discharge schedule (in MW). Note that the ES schedule is also of a 2-sec resolution. The ES charge and discharge schedule fluctuates over the simulation period. This fluctuation results in variations in feeder voltages.
3.2. Energy Storage Deployment Methodology
The proposed ES deployment method is detailed in this section. First, the energy storage size is determined based on the N-1 contingency criteria. It is assumed that ES is deployed to provide N-1 contingency benefits for five years. A statistical analysis is completed for the present and projected load demand data. A 1% load growth is assumed. Based on the statistical analysis, the typical substation load demand and overload duration are obtained, which are used to calculate the ES size. Next, the best locations for deploying ES along the feeder are determined. Note that a few grid applications, for example, voltage management and reliability services, are sensitive to the ES deployment locations, while others, including frequency regulation and peak-load shaving, are not. Therefore, in this paper, ES systems are collocated with PV systems for feeder voltage management, to mitigate the impacts of a variable PV generation profile. Since ES deployment should not result in any additional integrational challenges, the ES accommodation limit is calculated at each PV location. Based on the accommodation limit, ES is sized for each location. Finally, a grid impact analysis is simulated to verify and demonstrate that ES is successfully able to provide the intended grid benefits.
3.2.1. Calculate Energy Storage Size
ES needs to be sized for the power subsystem (MW) and energy subsystem (MWh) ratings. The power subsystem rating defines the largest capacity that ES can supply. The energy subsystem rating defines the total energy that an ES can provide without recharging. ES is sized to meet the N-1 contingency requirement for a duration of five years, including the base year, for the selected distribution system. The N-1 contingency requirement is satisfied if the transformer can supply both feeders without recording any overloading in an emergency situation i.e., when the other transformer is out-of-service. Given the uncertainty in the load demand, sizing ES for the worst case peak load demand recorded over five years is not advisable. In this study, the ES size is determined using a statistical analysis on five-year substation load demand data under an N-1 contingency scenario. The statistically representative peak load demand and energy supplied above the transformer’s rating are obtained using a percentile analysis on the base and projected year load demand data. The energy storage is sized for the typical peak load (MW) and the typical energy supplied above the transformer’s emergency rating (MWh).
Percentile Analysis on Load Data
The yearly load demand is available for the base year at an hourly interval. The base year load demand is projected for the next four years, assuming a load growth of 1% per year. This results in a total of 43,800 data points, with 8760 each year. A percentile analysis is completed for the obtained data set.
Figure 7 shows the percentile plot for the five-year load demand data. Here, the load demand corresponding to the x percentile, say
Px, means that
x% of hourly load demands will fall below
Px. By this definition, 98% of the load demand, recorded and projected over five-years, will fall below the 98-percentile load demand value.
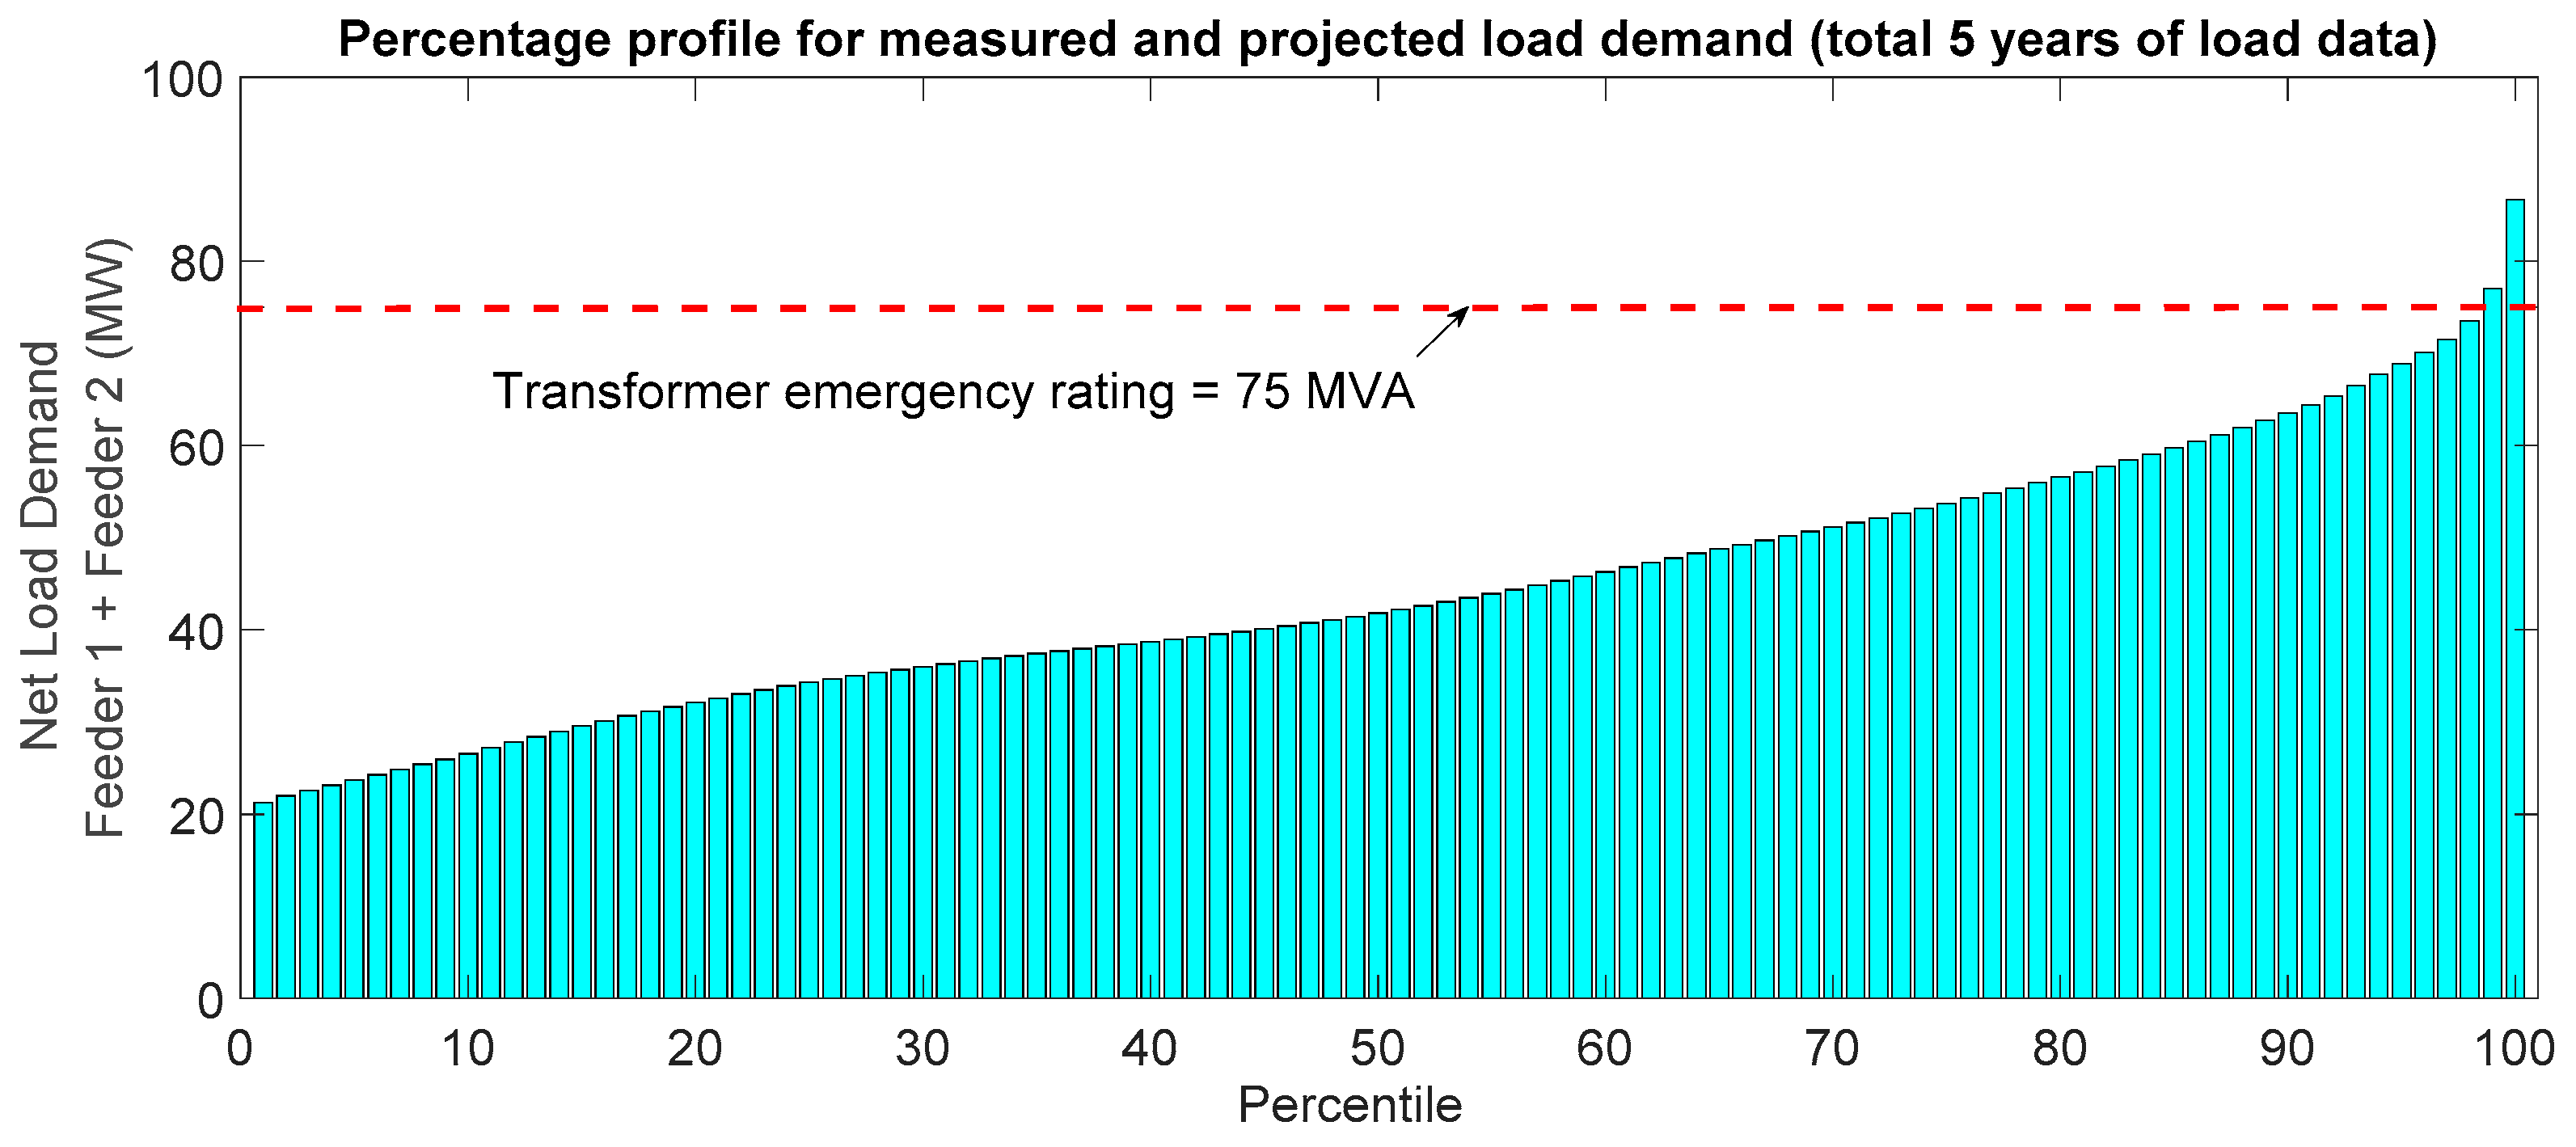
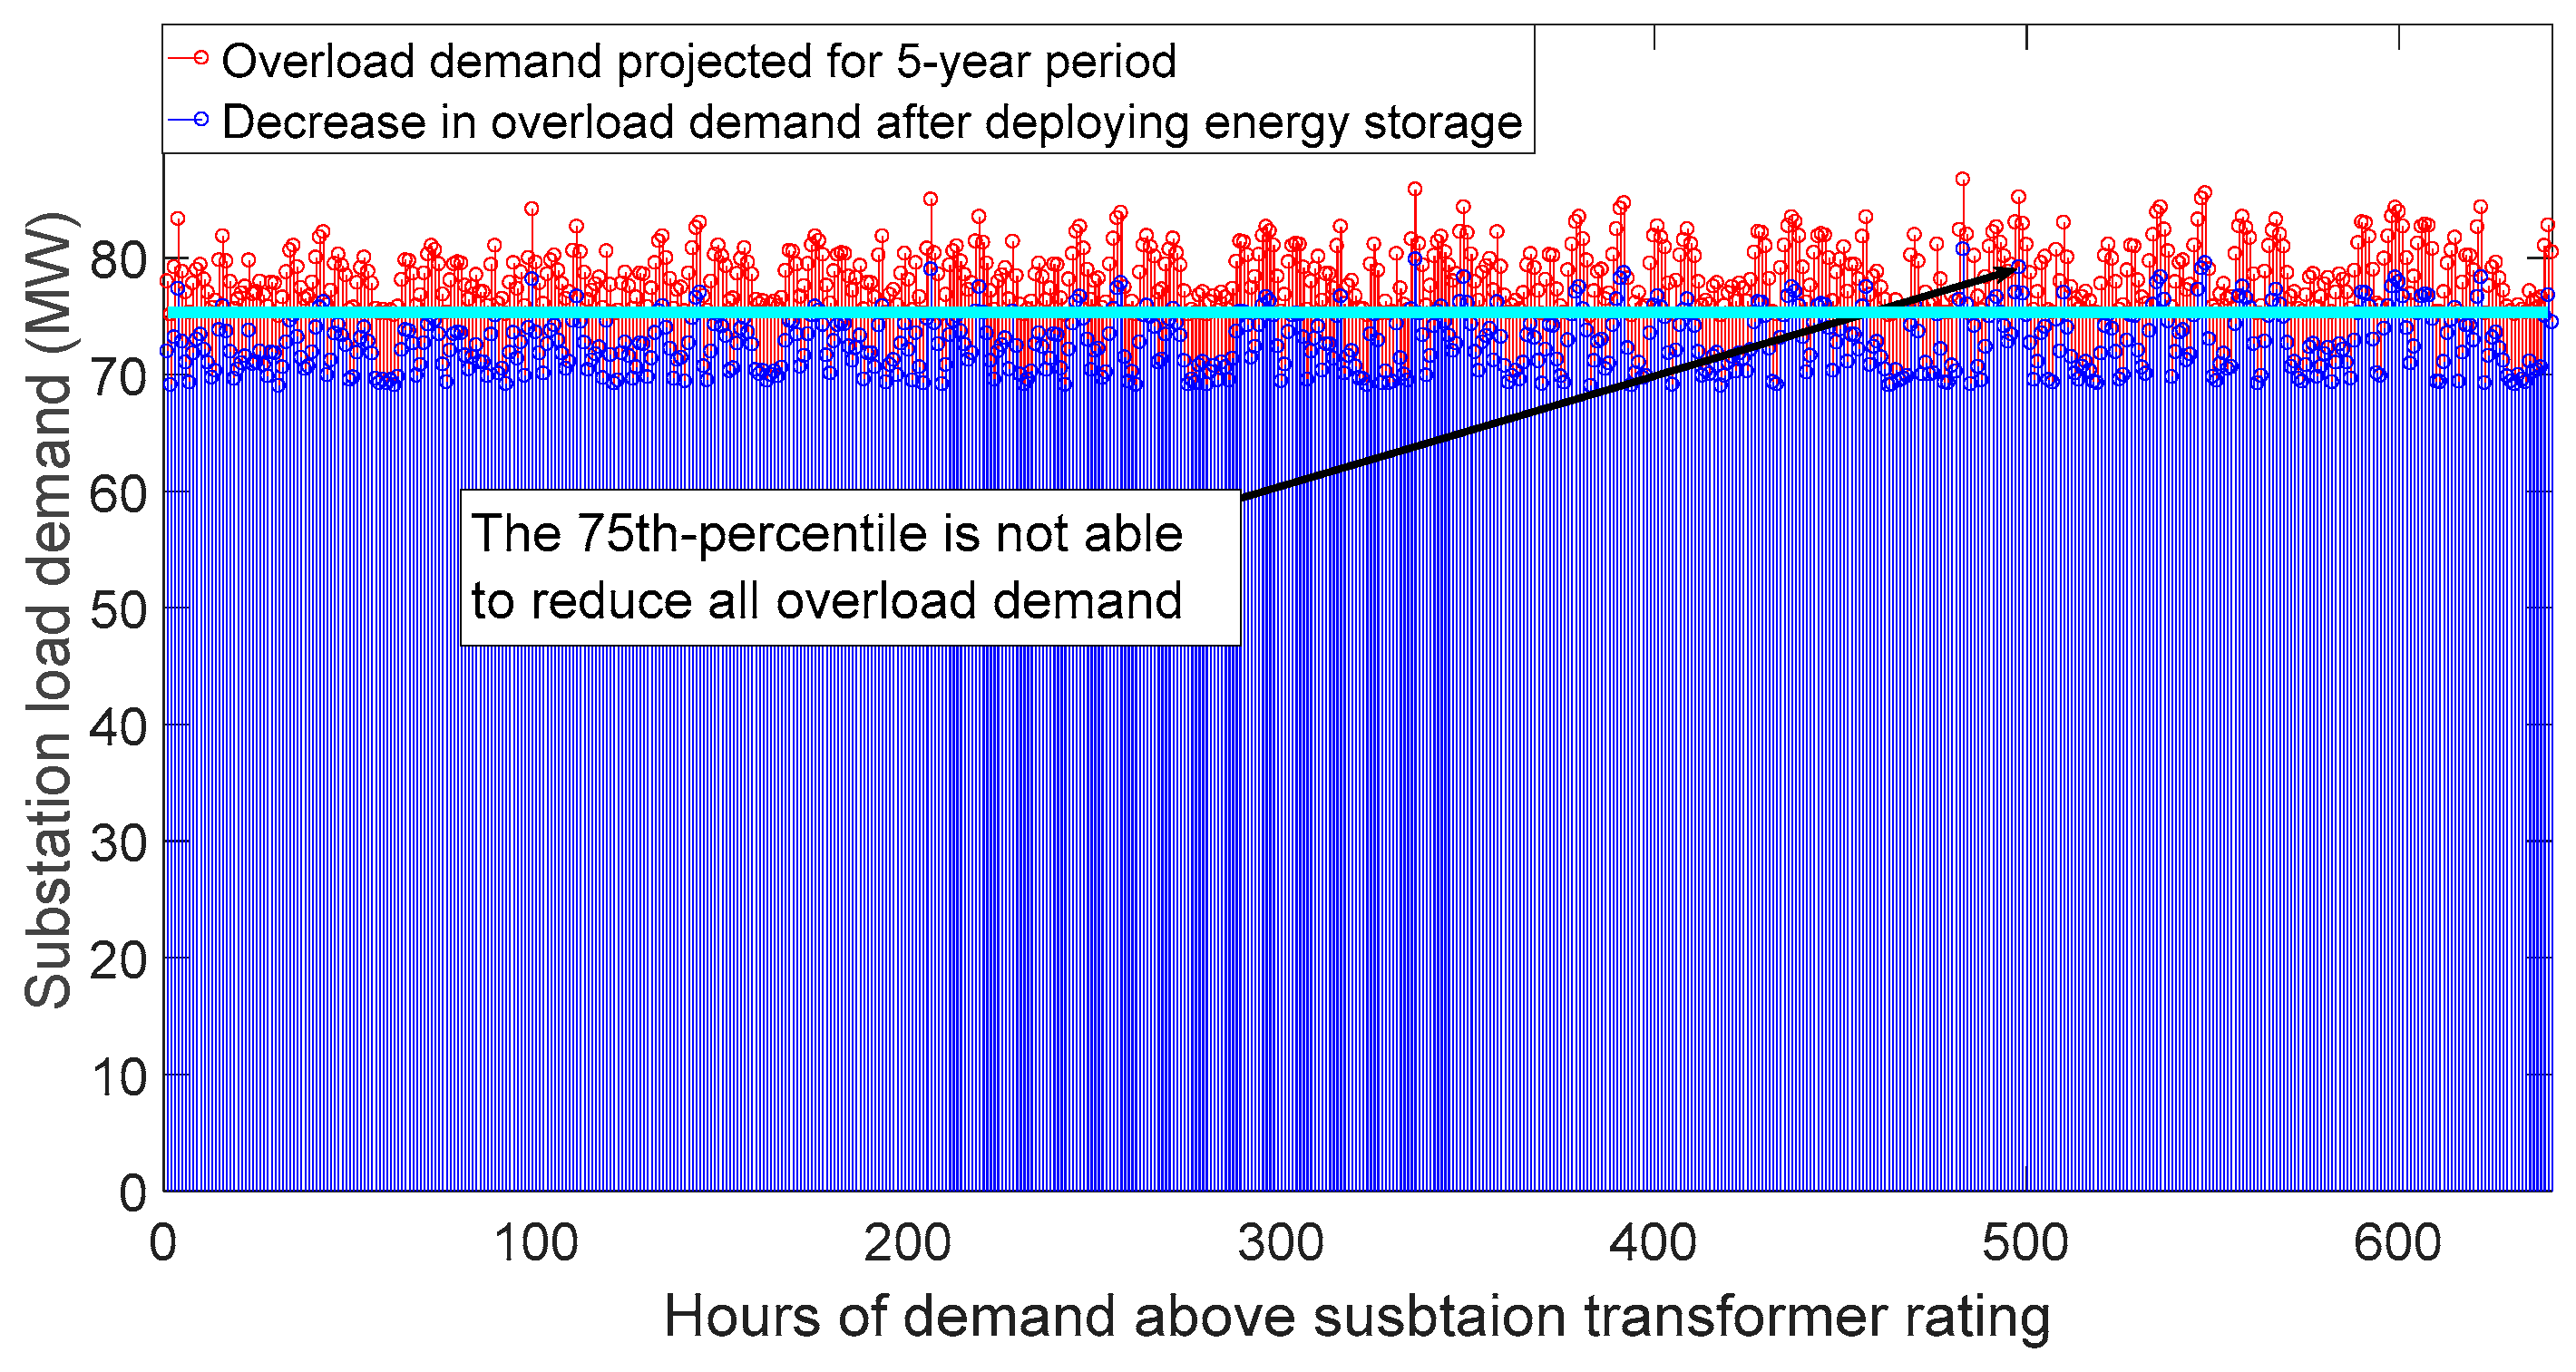
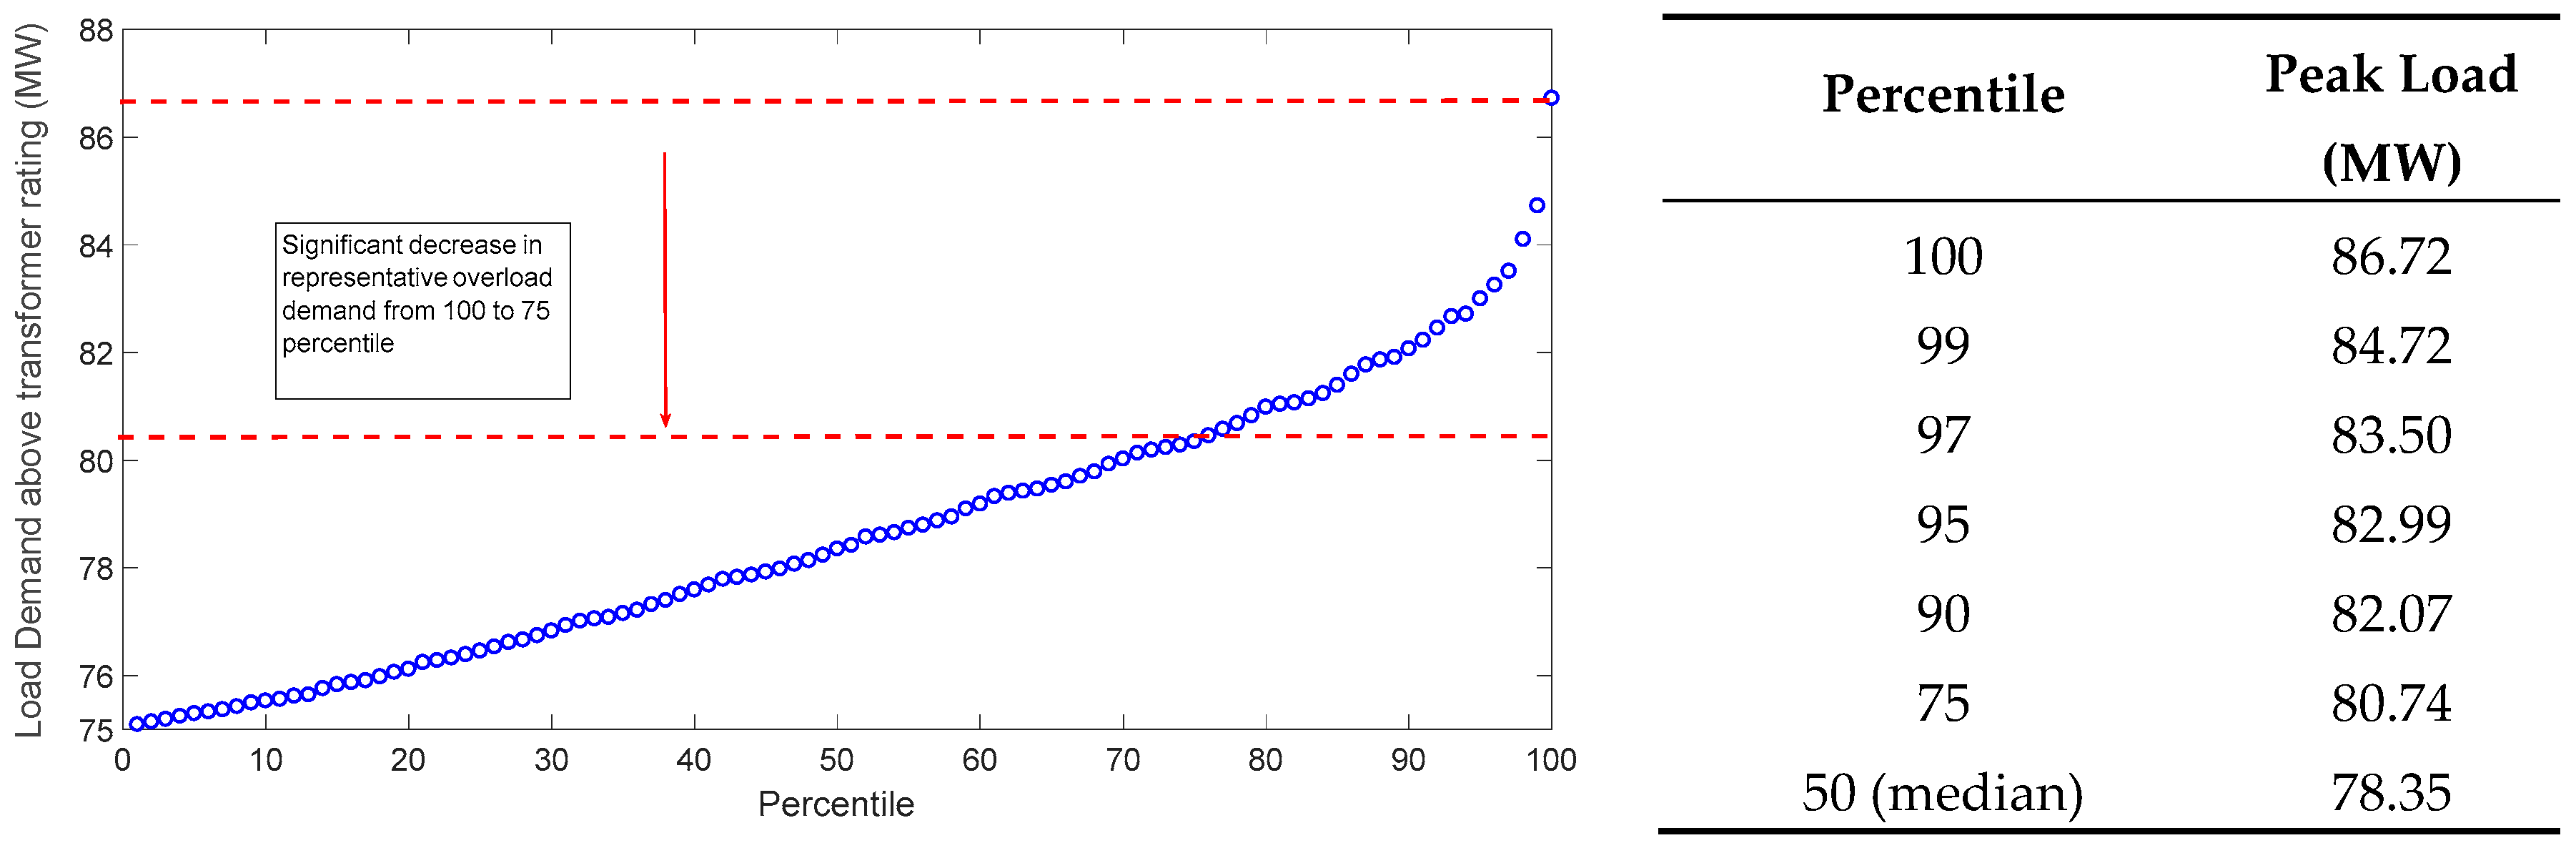
Since ES needs to be sized for the cases of substation overloading, a percentile analysis is only completed for those hours when the load demand is greater than the substation transformer rating (see
Figure 8). In
Figure 8, the load demand (
) corresponding to the
-percentile denotes that, if a transformer overloading is recorded, it will be less than
, with a
probability. Therefore, the load demand corresponding to the 95th-percentile (
MW) indicates that the transformer overloading recorded (in five years) will be less than 82.99 MW, with a 0.95 probability. Note that the representative peak load demand decreases significantly in the 75th-percentile, to 80.74 MW.
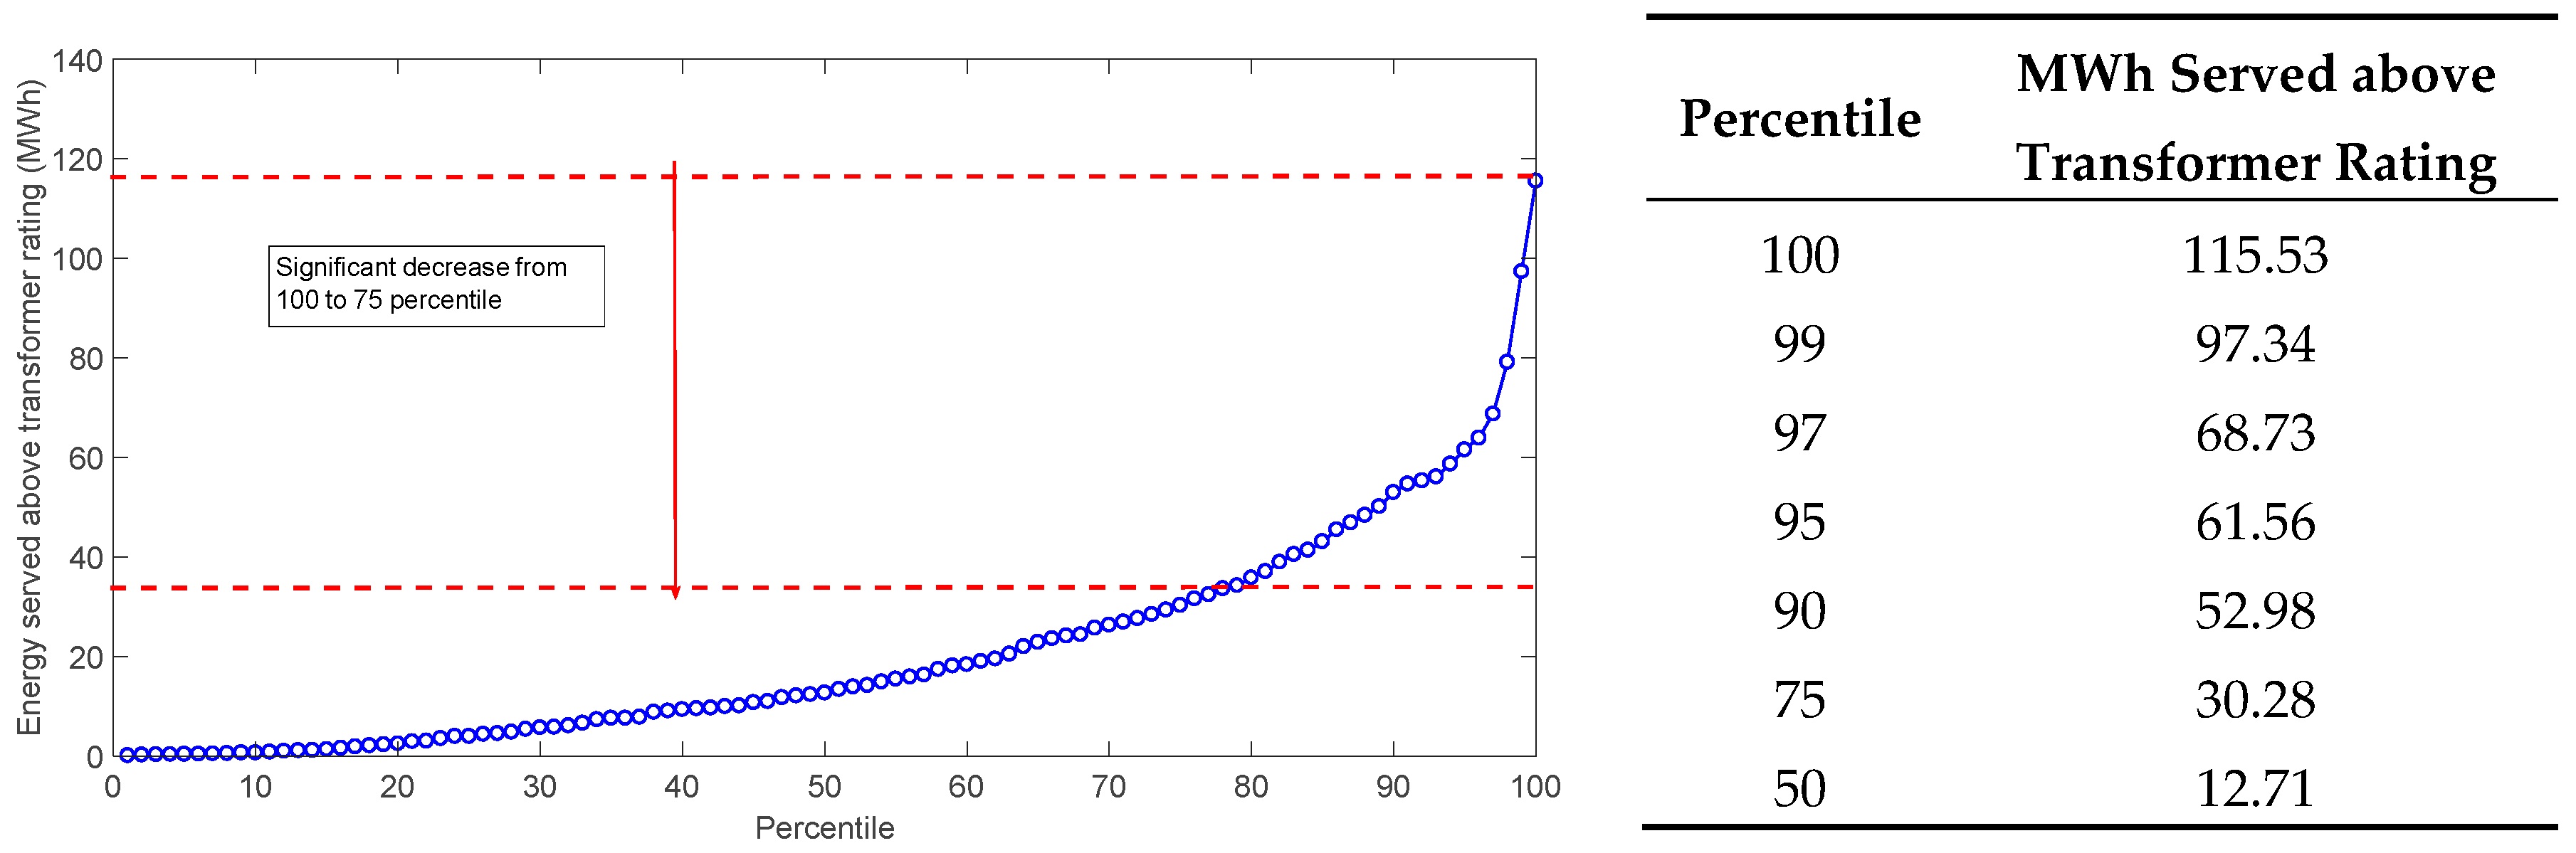
A similar analysis is conducted for the MWh served above the transformer’s emergency rating (75 MVA) over the span of five years. The percentile plot and representative percentile MWh above the transformer rating are shown in
Figure 9. The 75th-percentile value for the MWh served above the transformer rating implies that, under N-1 contingency, the transformer will be serving an overload energy less than or equal to 30.28 MWh, with a probability of 0.75 in the five-year planning period.
Energy Storage Size
The ES size for both the MW and MWh ratings are determined based on the results obtained from the percentile analysis of the five-year load demand data. For the worst-case scenario and to avoid any capacity violation, the ES rating should be at least equal to the maximum load demand and maximum energy supplied above the substation transformer rating in the five-year planning period i.e., the 100th percentile value. Instead of the worst-case rating, however, a representative rating is selected, based on the statistical analysis of the load demand profile.
The required MW capacity for ES is determined by subtracting the substation transformer emergency rating (75 MVA) from the percentile overload demand. The ES MW capacity obtained to meet a few percentile overloading conditions are shown in
Table 2. Similarly, the MWh rating for ES is obtained using the percentile analysis results on MWh supplied above the transformer rating. The MWh ratings for ES, corresponding to several percentiles, are shown in
Table 2. The ES capacity (both MW and MWh) decreases significantly from the 100th-percentile to the 75th-percentile. When sizing ES for the 75th-percentile value, under the worst-case scenario, there is a 0.25 probability that the ES will be unable to mitigate a transformer overload. The 0.25 probability of not meeting the contingency requirement occurs when the transformer overloading occurs with a probability of 1. To realistically estimate the risk for the five-year planning horizon, the probability of observing a transformer overload should be included in the risk calculation (
Table 2). For the given circuit, in five years, an overloading under an N-1 contingency scenario was recorded for a total of 641 h. Thus, the probability of overloading under an N-1 contingency scenario is equal to 0.0146. If the ES is sized for the 75th-percentiles peak load, the N-1 contingency for the transformer will not be met with a probability
, assuming that a failure in T1 is a certain event. The risk will further decrease when including the actual probability of observing a failure of the substation transformer.
In this study, the 75th-percetile value is selected for sizing the energy storage unit. Based on the analysis, the total ES system deployed in the feeder has a capacity of 6 MW/30 MWh. Note that a risk-averse deployment may select the ES size based on a 95th- or 97th-percentile calculation. However, the corresponding ES size may not be viable for deployment, given the exorbitant cost.
3.2.2. Identify Energy Storage Location
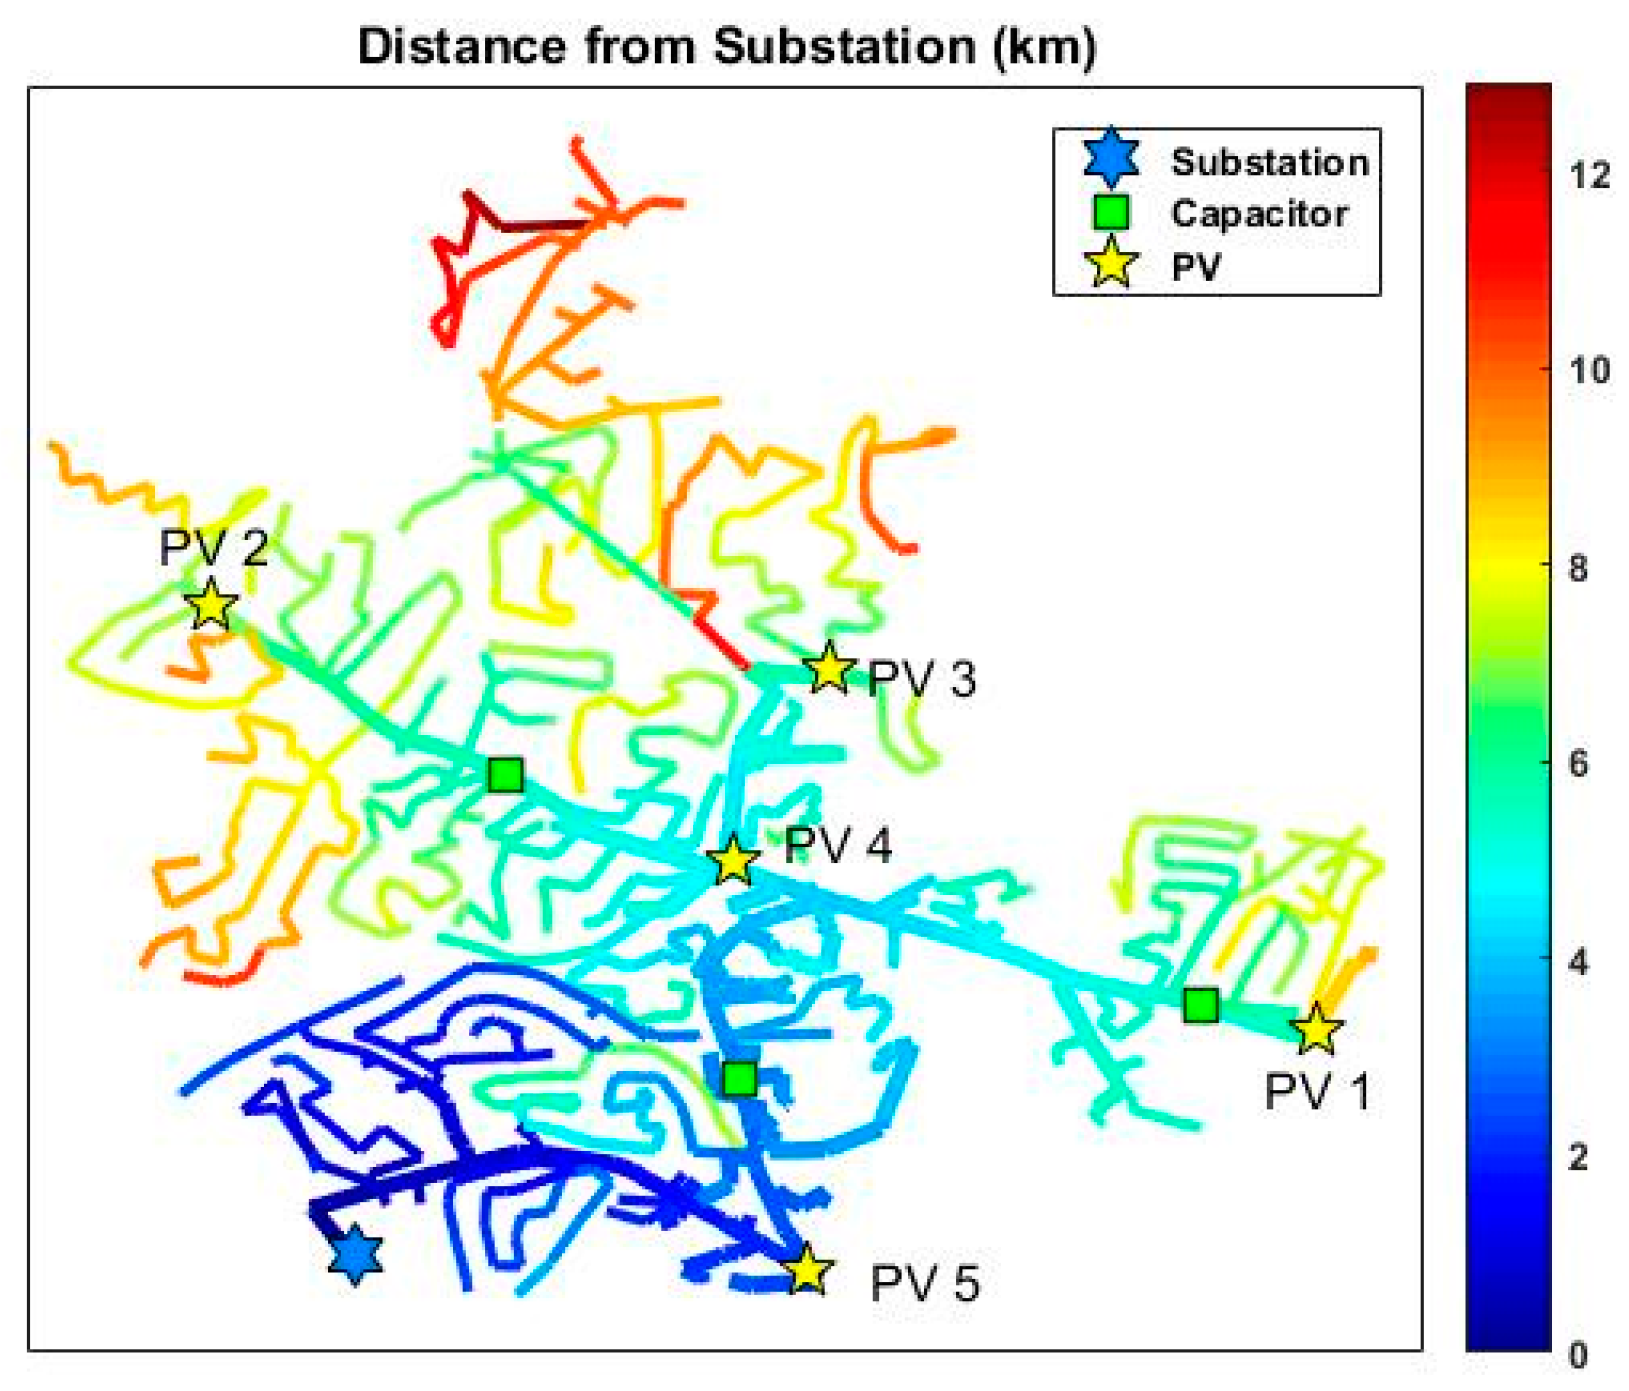
For N-1 contingency support, the ES system can be located anywhere, along either of the distribution feeders. Similarly, for frequency regulation application, ES can be deployed anywhere along the feeder and dispatched using the communication network in response to the frequency signal. However, the ES location is important for voltage management application. In order to mitigate the voltage variations due to PV variability, ES must be located close to the PV systems. Therefore, in this paper, ES is integrated and co-located at the 480-V level with each PV system. The ES circuit is supplied by a 1.2 MVA 34.5/0.48 kV service transformer. The topology of the secondary distribution circuit at the ES location is shown in
Figure 10. The total ES capacity based on N-1 contingency analysis is 6 MW/30 MWh. This capacity is distributed at the following five PV locations. Since all of the PV systems are of the same capacity, we should ideally deploy a 1.2 MW/6 MWh ES system at each location. However, before deploying ES at each PV location, the largest capacity that can be integrated at the selected locations need to be calculated. This is called the ES accommodation capacity of the feeder for the given location.
3.2.3. Calculate Energy Storage Accommodation Limit
ES may affect the normal operating conditions of the test feeder. Therefore, the largest ES capacity that can be installed at the selected location must be determined before integrating ES into the feeder. In this paper, the obtained ES capacity is referred to as the ES accommodation capacity. Since one of the stacked-benefits of ES is to provide a voltage management service, the voltage of the selected feeder must be kept within the acceptable limit, i.e., between 0.95 and 1.05 pu [
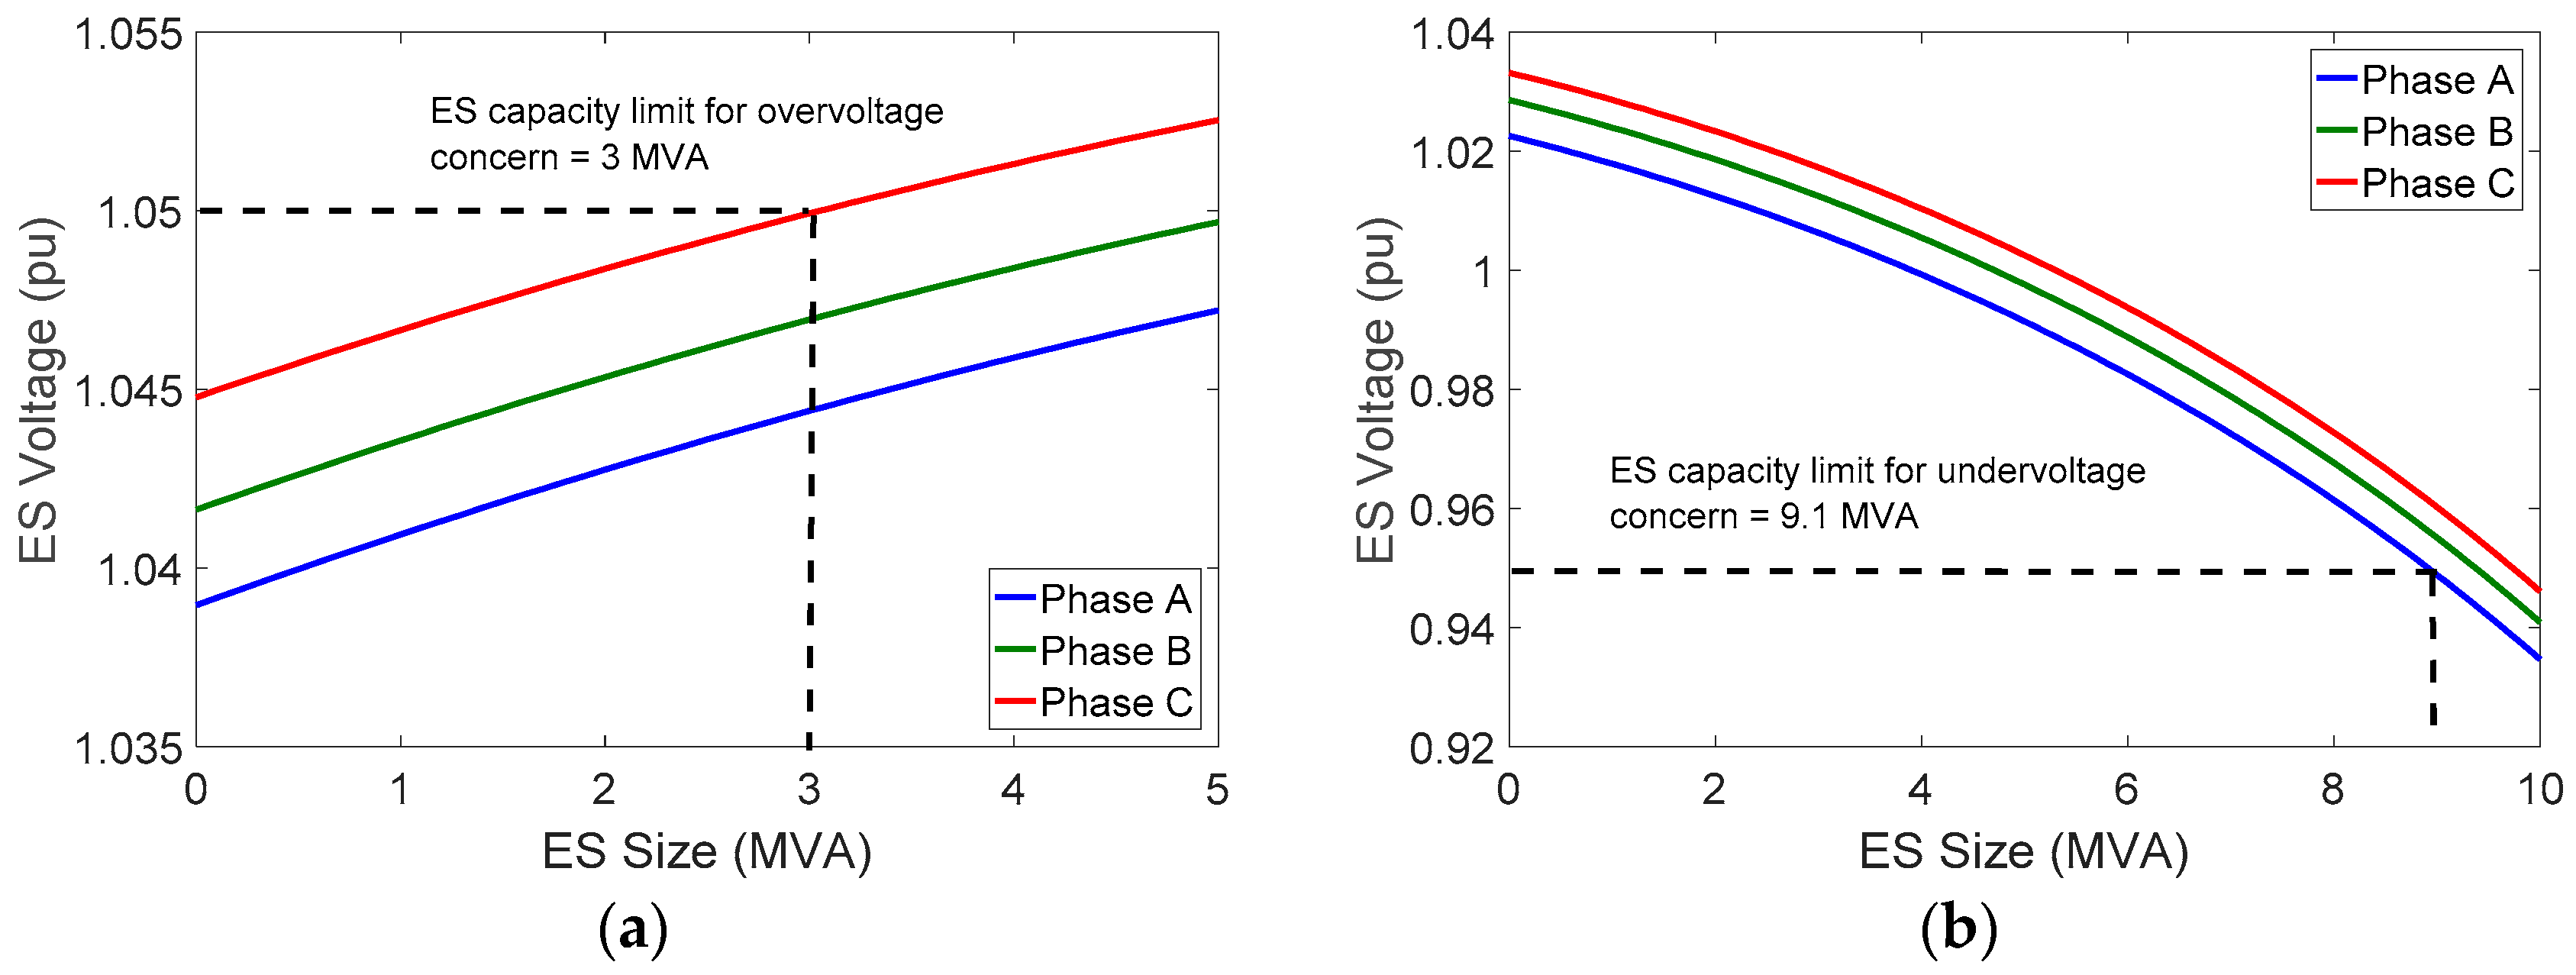
33]. Hence, the size of the ES must be less than the largest ES capacity that can be installed without resulting in a steady-state voltage limit violation, overvoltage (
V > 1.05 pu), or undervoltage (
V < 0.95 pu), at the bus connected to the ES system (480-V level). In order to obtain the ES capacity limit, this paper determines the largest ES size resulting in an overvoltage (ES capacity limit for the overvoltage condition) and the largest ES size resulting in an undervoltage (ES capacity limit for the undervoltage condition), using a simulation approach performed in OpenDSS.
For the overvoltage case, the analysis aims at determining the largest generation without causing the overvoltage at the selected ES location. The simulation conditions assumed for the analysis are detailed as follows. The test feeder is assumed to be operating at the minimum load condition, thus resulting in a high voltage condition. The ES is set to discharge at its full rated output (acting as a generator) with a unity power factor, thus, causing the voltage to rise. The ES power rating is increased from 0 to 5 MVA, at an increment of 1 kVA. Since the ES is discharging, all of the PVs in the circuit are assumed to be not generating. The phase voltages at the ES location (480-V level) are recorded for each ES capacity (0–5 MVA). The ES accommodation capacity of the circuit at the selected ES location for the overvoltage is equal to the minimum ES rating, resulting in a phase voltage greater than 1.05.
A similar simulation approach is used to determine the largest ES capacity, resulting in an undervoltage violation (V < 0.95 pu). The obtained ES capacity is referred to as the ES accommodation capacity for undervoltage limit violation. The simulation conditions and methodology are detailed as follows. For the worst-case scenario, the selected distribution circuit is assumed to be operating at the peak load condition and the ES is programmed to charge. The ES power rating is increased from 0 to 10 MVA, with an increment of 1 kVA. Since the ES is assumed to be charging, all of the PVs are assumed to be generating at their rated power with a unity power factor. The phase voltages at the ES location are recorded for each ES capacity (0–10 MVA). The ES capacity limit for the undervoltage condition is equal to the minimum ES rating, resulting in a phase voltage less than 0.95 pu at each ES location.
The phase voltages corresponding to the ES capacity for one of PV bus locations are shown in
Figure 11. Based on the results, the overvoltage violation (V > 1.05 pu) is recorded when adding 3 MVA of ES, while the undervoltage violation (V < 0.95 pu) is recorded when adding 9.1 MVA of ES. Thus, the ES accommodation capacity for the overvoltage condition is 3 MVA, and is 9.1 MVA for the undervoltage condition. Since the integration of ES must not cause either overvoltage or undervoltage limit violations in the circuit, the overall ES capacity limit of this circuit at the selected ES location is equal to 3 MVA (the lesser value). The same analysis is repeated for each PV location, and the ES accommodation capacities are obtained (please see
Table 3). Based on the analysis, an ES system with a capacity of 1.2 MW/6 MWh can be deployed at each PV location, amounting to a total capacity of 6 MW/30 MWh.
3.2.4. Grid Impact Analysis
The final task is to conduct a grid impact analysis to demonstrate that an ES application can provide the required stacked-benefits. First, the application of ES for meeting the N-1 contingency requirements is demonstrated. Since the ES size is selected based on the 75th percentile value of the overload demand and energy, the deployed ES will not be able to eliminate each possible case of overloading over the course of five years. However, we should expect a decrease in the overload demand and overloading duration after deploying the ES system. Next, the application of ES in meeting secondary grid benefits i.e., voltage management and frequency regulation, are discussed.
5. Conclusions
This paper presents a planning framework for integrating energy storage systems into the distribution system. The objective is to deploy the ES system for providing stacked-benefits for the grid. We present a systematic approach, starting by identifying the ES application scenario for the feeder and then presenting an ES deployment framework. For the given feeder, depending upon the load demand data and current and future service requirements, primary and secondary applications for ES deployment are identified. For the selected feeder, ES is primarily deployed to provide the N-1 contingency requirement for the feeder. For the stacked-benefit application, the ES system is deployed to provide voltage management and frequency regulation services. The presented ES deployment framework is based on the following four steps: (1) calculate ES system size based on primary application scenario; (2) determine optimal ES locations based on both primary and secondary application scenarios; (3) calculate the ES accommodation capacity at each potential ES location (4) deploy the ES system and develop a methodology for grid impact analysis to validate if the intended benefits are provided by the ES systems.
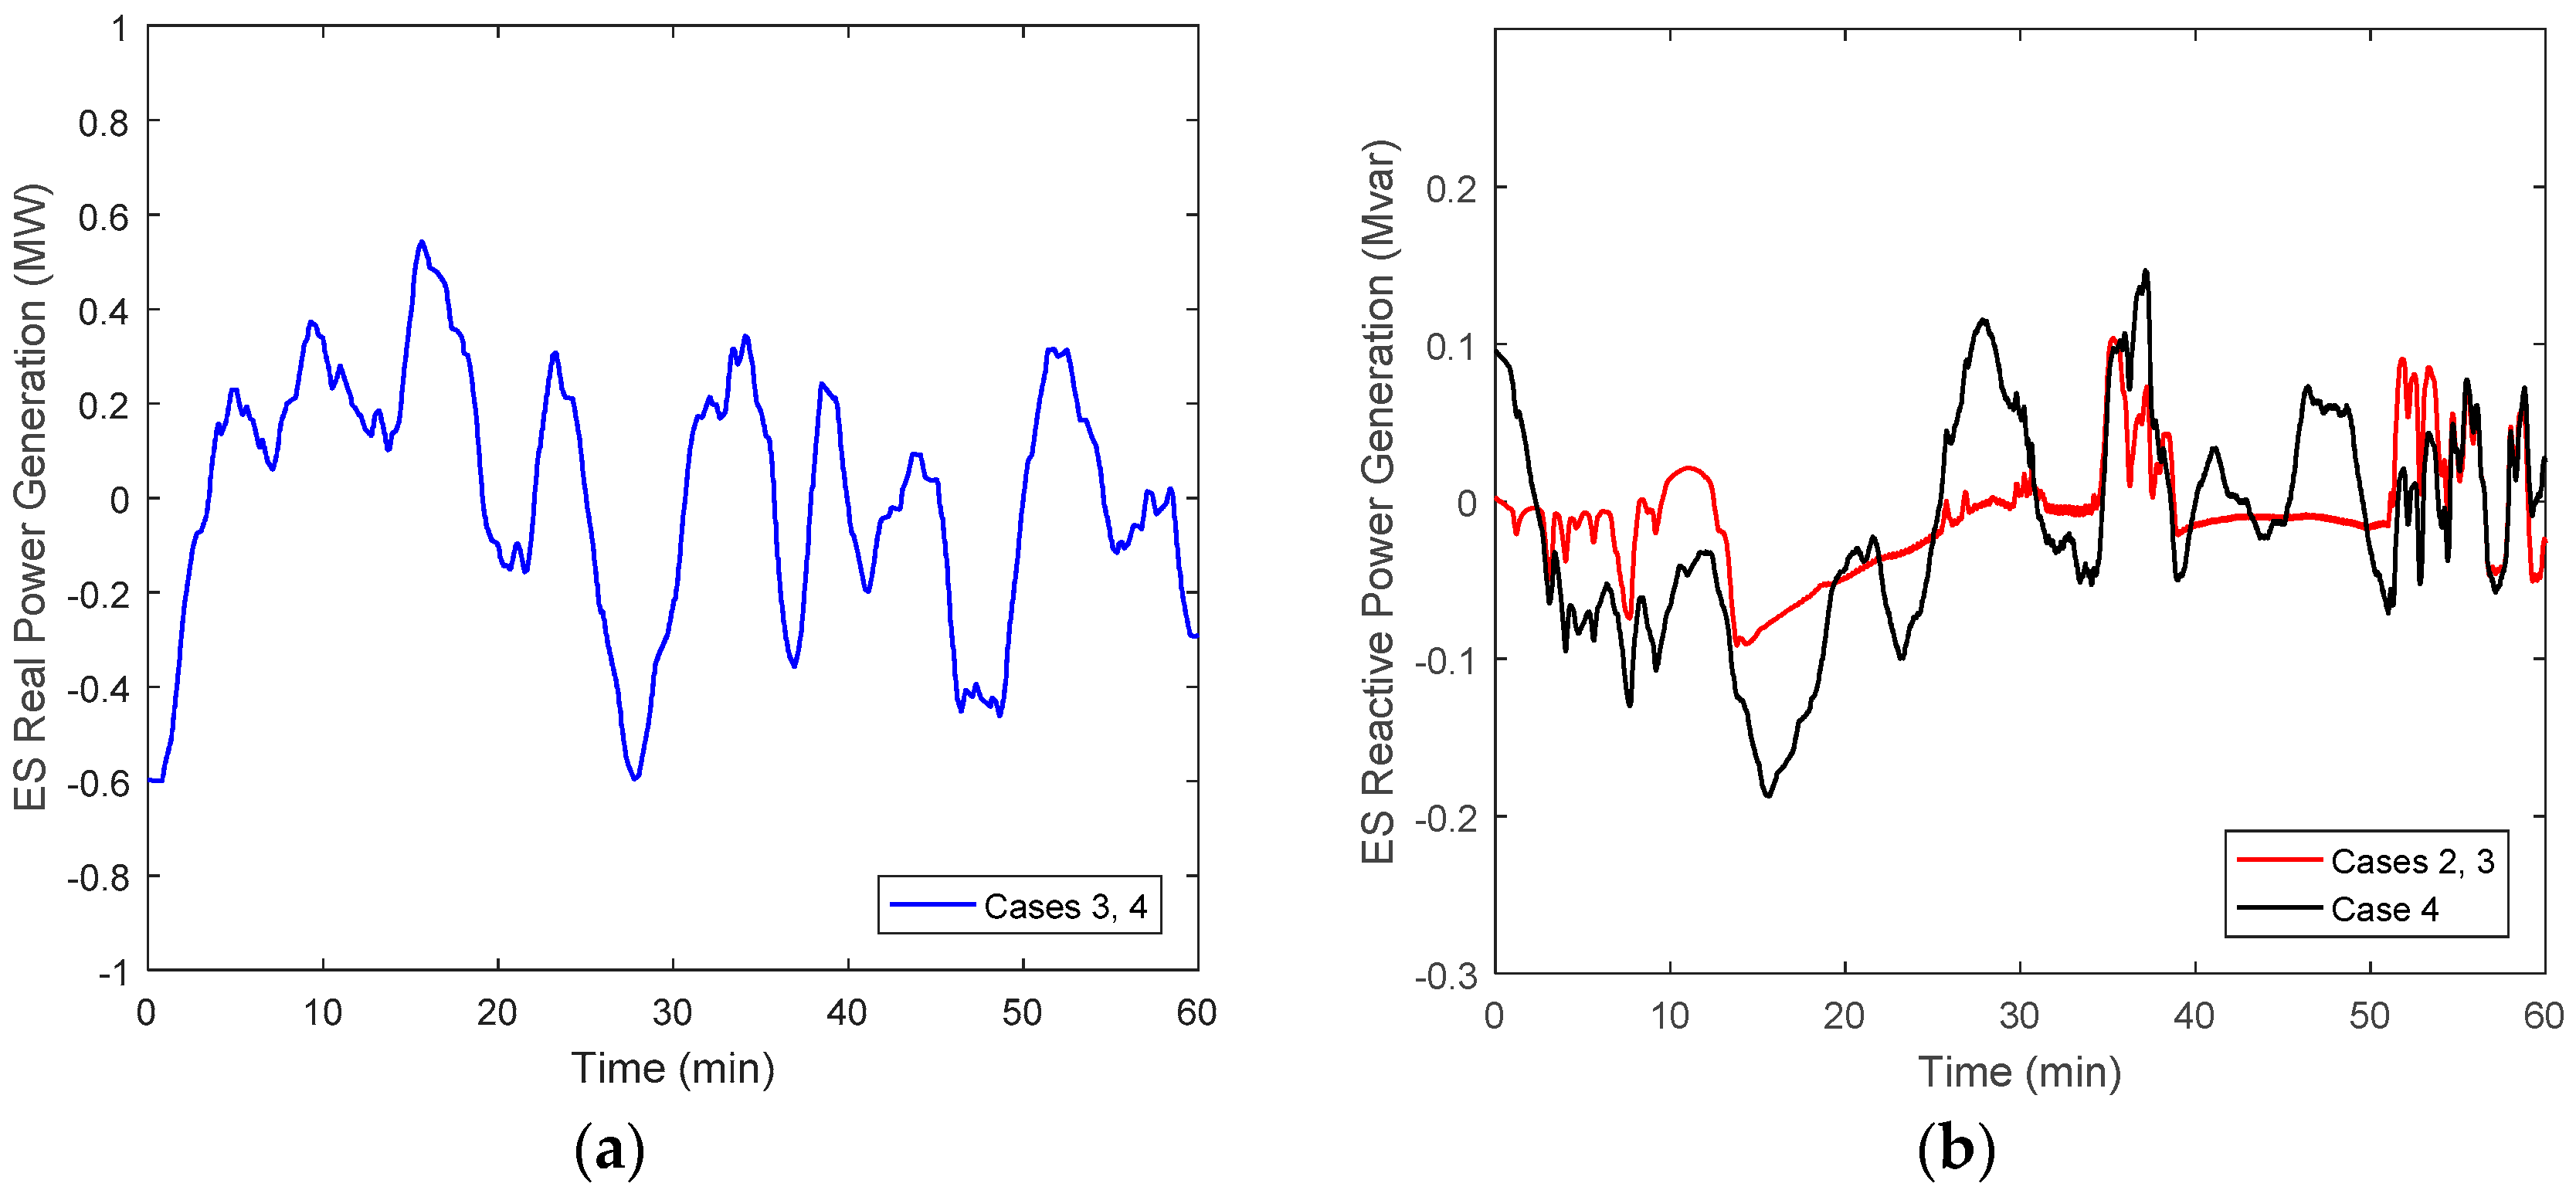
Furthermore, the paper also develops power control methods and demonstrates the stacked-benefit applications of deploying ES in simultaneously providing multiple services. For primary applications, 100% of the ES capacity would be deployed to provide the N-1 contingency requirement i.e., when one of the substation transformers is at fault, and the net load demand exceeds the other transformer’s emergency rating. However, when the circuit is in a normal operating condition, 100% of the ES capacity would be used to provide other secondary services, such as voltage management and frequency regulation. In providing frequency regulation services, ES employs a real power control mode. In this control mode, ES charges and discharges in accordance with the frequency regulation schedule. The simulation results show that while ES can successfully provide frequency regulation by charging and discharging, the frequency regulation signal may suddenly ramp up or down, thus resulting in voltage variations. Therefore, along with the variability of PV generation, ES should also be employed to provide voltage management for voltage variations due to the frequency regulation schedule. In this paper, we develop ES control in order to provide reactive power support for the decreasing voltage variability resulting from sudden ramps in PV generation and in the frequency regulation schedule. The simulation results validate that ES systems are able to successfully mitigate the voltage variation concerns due to both the variability of PV generation and the frequency regulation schedule.
The proposed ES deployment framework is generic and can be easily adapted for other feeders, with a different set of primary and secondary application scenarios. The paper also outlines the characteristics of the modeling framework with the required dataset, thus presenting an important guideline for ES integration analysis. Finally, by demonstrating the application of ES in providing stacked grid benefits, this paper provides a successful use case for ES deployment in smart distribution systems.
It should be noted that rapid charging and discharging of the battery may deteriorate its overall lifetime. In this framework, to provide frequency regulation services, ES is generating/absorbing active power by rapidly charging/discharging every 2 s. Usually, battery technologies are rated for several deep charge or discharge cycles, after which deterioration is expected. Fortunately, when participating in frequency regulation, the energy storage does not undergo deep charge or discharge every 2 s. Instead, a few cycles of deep charge or discharge are observed over an entire day (
Figure 15). Therefore, the framework may be feasible for existing battery systems if the benefit of providing frequency regulation offsets the cost of battery deterioration. However, an actual analysis on lifetime deterioration will depend upon the depth of charge/discharge in each cycle and the type of battery technology. In this paper, we do not model the battery lifetime deterioration due to charging/discharging—a potential topic for future research.


