
Effects of Flow Turbulence on the Entire Development Process of Drifting Fish Eggs
by
Yuchong Wei
1, 
Aixing Ma
1,2,3,*,
Ya Deng
1,2,3,
Minxiong Cao
1,2,3,
Ying Hu
1,2,3,
Zhaoyi Cheng
1 and
Lijun Zhu
1 1
Nanjing Hydraulic Research Institute, Nanjing 210029, China
2
The National Key Laboratory of Water Disaster Prevention, Nanjing 210029, China
3
Key Laboratory of Port, Waterway & Sedimentation Engineering Ministry of Communications, People Republic of China, Nanjing 210029, China
*
Author to whom correspondence should be addressed.
Fishes 2024, 9(3), 88; https://doi.org/10.3390/fishes9030088
Submission received: 2 January 2024
/
Revised: 22 February 2024
/
Accepted: 24 February 2024
/
Published: 27 February 2024
Abstract
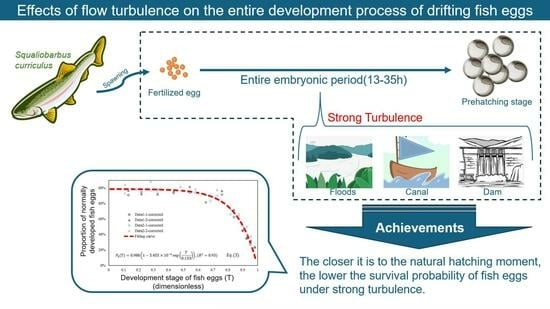
:Excessive flow turbulence poses a threat to the development of drifting fish eggs, leading to mortality or developmental malformations and ultimately depleting early fish resources. Currently, there is a scarcity of quantitative studies investigating the effects of flow turbulence on the entire process of drifting fish egg development, from fertilized egg division to hatching. In this paper, the effects of different flow turbulence conditions (FTCs), including turbulent kinetic energy and shear stress, and action times on different stages of fish egg development were quantitatively explored using a transverse-oscillating-grids turbulence tank. Empirical formulas were established to predict the proportion of normal fish egg development under different FTCs within a selected range. The research findings provide a quantitative basis for protecting early fish resources, mitigating the biological invasion of specific fish, constructing fish-breeding facilities, and ensuring safe transfer and transportation.
Key Contribution: This study quantitatively investigates the effects of different flow turbulence conditions (FTCs) and action times on different stages of fish egg development and establishes empirical formulas to predict the proportion of normal fish egg development under different FTCs within a selected range.
1. Introduction
With the transformation of natural rivers due to inland navigation construction and water conservancy projects, the flow conditions in rivers are becoming increasingly intricate, and the impact on the ecological environment of rivers is becoming more severe. The effects of various wading structures (such as hubs, fishways, spur dikes, etc.), ship waves, and ship propellers can significantly alter flow turbulence and shear stress [1,2,3,4,5]. Fish are at the top of the food chain in river ecosystems and are usually used in evaluation indexes to assess the quality of a river’s ecological environment [6,7]. Taking fish as an example, flow turbulence or shear stress will have a certain effect on the whole life cycle of fish (embryonic stage, larval stage, adult stage, etc.) [8,9]. This study focused on the effects of water turbulence on the whole development process of drifting fish eggs (i.e., the entire embryonic period, including the stages from the division of fertilized eggs to hatching).
Drifting fish eggs need to drift in water for tens to hundreds of hours [10]. During this period, fish eggs have no ability to swim independently and instead drift about tens to hundreds of kilometers in the water [11,12,13]. The impact of flow velocity on fish eggs is significantly less than that of flow turbulence, which greatly affects drifting fish eggs, leading to increased mortality rates and significantly impeding recruitment [14,15,16,17].
The appropriate range of flow turbulence can promote the occurrence of fish spawning activities, maintain the development of fish eggs’ suspension drift, and avoid fish eggs sinking to the bottom, as sinking may lead to impact, burial, or exposure to low temperatures and oxygen depletion, resulting in mortality [18,19,20,21,22,23]. However, if the turbulence is too large, the strong turbulent kinetic energy and shear stress may cause damage to the normal development of fish eggs, resulting in the malformation or death of the fish eggs. For example, fish early life stages can be seriously harmed when passing through structures such as turbines, spillways, or fishways [24,25,26,27] due to mechanical collision, a high-turbulence and -shear-stress environment, and gas supersaturation [25,28].
Morgan et al. [9] explored the effects of strong flow shear stress, which may be generated in inland shipping traffic (by propellers, ship waves, etc.), on fish eggs and larvae. They simulated the shear stress in water flow by employing a rotatable bucket and obtained the regression equation of the death percentage of fish eggs and larvae under continuous shear stress. Maynord et al. [29] meticulously scrutinized the experiments conducted by Morgan et al., considering that the experimental parameters faithfully mirrored the shear stress encountered along the hull. Specifically, for a typical vessel velocity of 2.9 m/s and a representative shear stress of 8.7 N/m2 within the Upper Mississippi River–Illinois Waterway System, their observations revealed that the average mortality rate of fish eggs and larvae stands at 9%. Killgore et al. [7] evaluated the mortality of eggs, larvae, or juveniles of five fish species using a scale model of a towboat propeller in a circulating water channel. The results showed that newly hatched larvae (length < 10 mm) were more susceptible to water shear stress than eggs and juveniles. At a high stress level (474.3 N/m2), 30% of white sturgeon eggs (in the early yolk sac stage) and 86% of lake sturgeon larvae died. Compared with the impact of propeller blades, high shear stress may be the main cause of death. Prada et al. [23] used a racetrack flume to explore the optimal survival conditions of grass carp eggs. It was suggested that the combined effects of higher levels of turbulence and shear stress, as well as the wear and tear caused by interaction with fast-moving sediment particles in the suspension, significantly increase mortality. Prada et al. [30] used an oscillating-grid stirred turbulence tank to create a turbulent environment with the maximum turbulent kinetic energy kmax = 2.7 m2/s2 (or shear stress τxz > 30 N/m2) to explore the effect of pure turbulence on the survival of water-hardened grass carp eggs. Experiments showed that the survival rate was close to 90% when kmax < 2 m2/s2 in the turbulence tank. When kmax = 2.7 m2/s2, the survival rate decreased to about 70%.
Studying the effect of flow turbulence on the development of drifting fish eggs is of great significance for protecting fish resources, transforming and utilizing natural rivers, and restricting the biological invasion of specific fish. Despite its importance, there are few studies on the mechanism of flow turbulence on fish eggs, with most research focusing on adult fish [31,32]. This may be due to the small size of fish eggs, which makes them difficult to obtain, count, and measure.
Studies have shown that flow turbulence and shear force can cause fish eggs to become deformed or die, but it takes several hours for the eggs to hatch from fertilization and go through several developmental stages, including cleavage, blastocyst, gastrula, neurula, organ formation, and hatching [10]. The ability of fish eggs to resist turbulence may vary at different stages, and this variation can accumulate and magnify over the drifting time scale of tens to hundreds of hours for fish eggs, resulting in significant predictive biases [33,34].
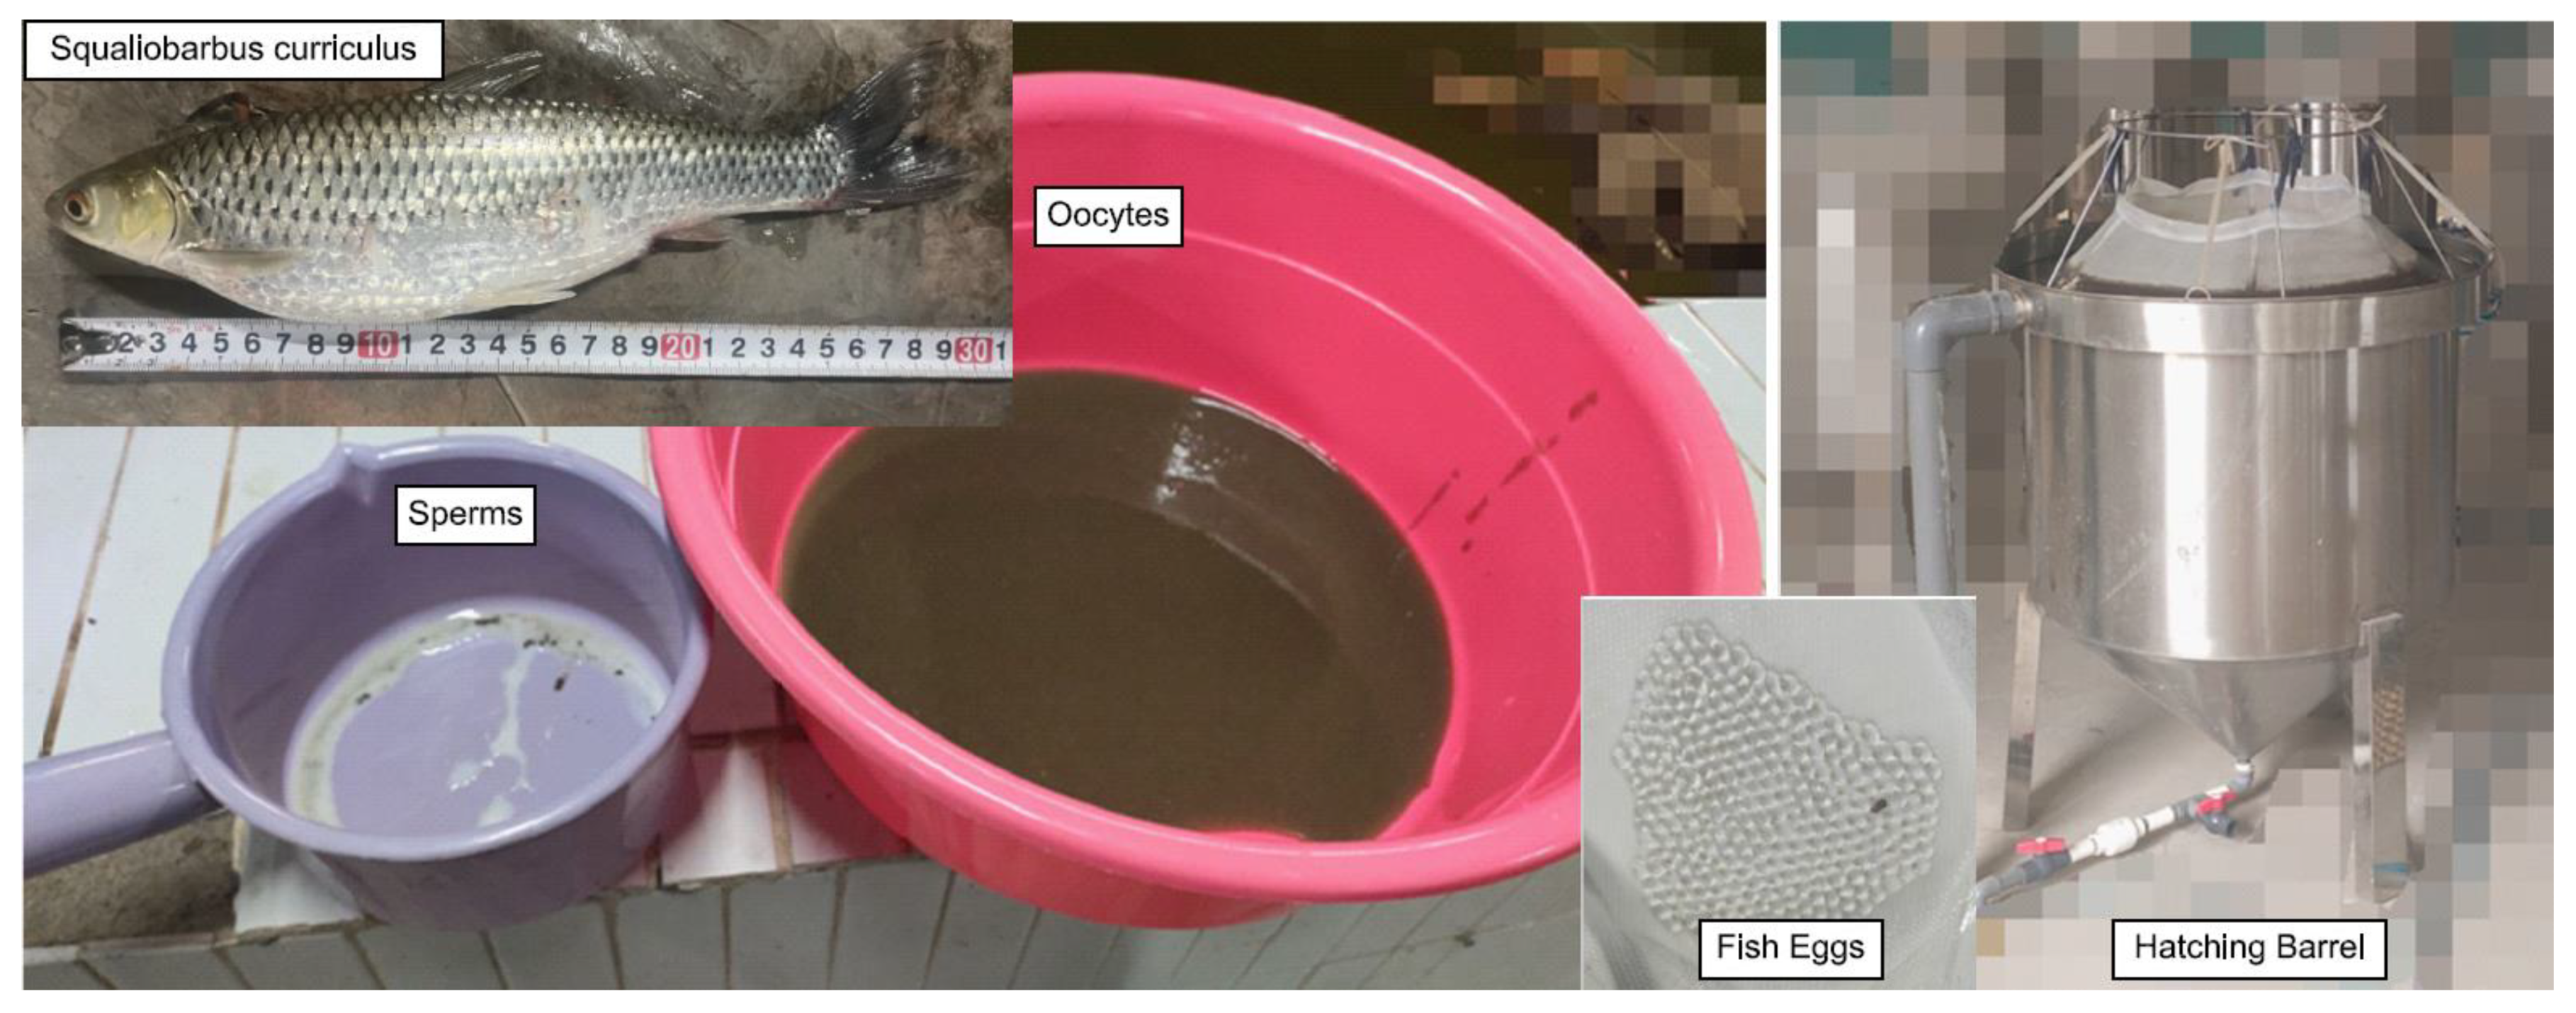
The focus of this paper is on the eggs of Squaliobarbus curriculus (S. curriculus), a drifting-egg fish prevalent in the Yangtze River Basin and its southern rivers. Belonging to Cypriniformes, Cyprinidae, and Leuciscinae, it shares characteristics with species like black carp and grass carp. S. curriculus exhibits a silvery-white body with a slightly dark-gray back and a distinctive red spot on the upper edge of the eye, resembling the shape of grass carp (Figure 4). Known for its robust disease resistance, adaptability, rapid growth, ease of domestication, and valuable commercial attributes such as tender meat and rich nutrition, S. curriculus holds significant promise for development and promotion. Consequently, utilizing the eggs of S. curriculus as the experimental subject carries substantial practical significance. The breeding season for S. curriculus varies across different water systems, typically occurring from April to September, with a peak period from June to July. The optimal water temperature for artificial reproduction ranges from 22 °C to 28 °C. Fertilized eggs are characterized by a light-green or yellowish-green color, spherical shape, and small diameter of about 0.9 to 1.2 mm. The proportion of eggs is slightly larger than water. Upon water absorption, the fertilized egg’s membrane expands rapidly, becoming transparent and elastic, with an outer diameter ranging from 3.2 to 5.1 mm (varied due to fish size). While sharing similarities with the eggs of the four major Chinese carps, S. curriculus eggs have a slightly smaller diameter. These eggs exhibit dynamic behavior, suspending in running water, sinking, and drifting in still water. In the temperature range of 22 to 32 °C, the hatching time for eggs ranges from 13 to 35 h, with a negative correlation to water temperature—higher temperatures result in shorter hatching times [35].
In this study, we explored the mechanism of the flow turbulence effect on the entire embryonic period of fish eggs (using S. curriculus as an example) by shortening the time interval of the experimental groups to 0.5–2 h. Through repeated indoor experiments, we established empirical formulas for predicting the proportion of normally developed fish eggs under different flow turbulence within a selected range.
Although previous studies have analyzed the effects of turbulence on fish eggs, larvae, and juveniles, the changes in the development of fish eggs were not fully studied. Prada et al. [34] divided fish eggs into pre-water-hardened (first 5 h) and water-hardened (last 30 h), but this division may not be detailed enough. Our study provides a more comprehensive analysis of the effect of flow turbulence on fish eggs.
2. Materials and Methods
2.1. Experimental Equipments
The experimental setup comprises a transverse-oscillating-grids turbulence tank, an acoustic Doppler velocimetry (ADV) system, and a net cage (refer to Figure 1 and Table 1).
The transverse-oscillating-grids turbulence tank is employed to quantitatively generate the flow turbulence conditions (FTCs) necessary for the experiment. It consists of a water tank, two oscillating grids, two 1100 W horizontal motors, two frequency converters, and ADV guide rails. The water tank is constructed from organic glass, and the grids are made of aluminum alloy with a porosity of 0.56 (the ratio of the grid opening area to the total area). The vibration centers of the two grids are situated 10 cm away from the side wall of the tank. The motors are positioned on both sides of the water tank and are connected to the grids within the tank via a transmission device, driving the grids to reciprocate with a stroke of S = 10 cm. Two inverters provide quantitative control for stepless speed changes in the motors. The ADV rack is employed to position the ADV system, allowing it to move freely in three directions within the water tank.
The ADV system is utilized for calibrating the FTCs in the tank. It employs single-point measurement with a frequency of 25 Hz, a measurement range of up to 4 m/s, and an accuracy of ±0.5% of the measurement range. The ADV system is mounted on the preset ADV guide rails on the upper part of the tank, with the instantaneous velocity point measured 5 cm in front of the probe.
The net cage is employed to restrict the drift range of the eggs, preventing mechanical collisions caused by the grids and facilitating the collection of statistics. The net cage dimensions are 10 cm × 7 cm × 10 cm (length × width × height). The frame is made of plastic, and the mesh consists of nylon hexagonal mesh with a diameter of 2 mm. The opening of the mesh cage is positioned upward utilizing a toggle latch switch.
2.2. Calibration of the Tank Flow Turbulence
ADV is used to calibrate the FTCs of the tank. In this paper, flow turbulence is characterized by turbulent kinetic energy (k) and shear stress (τ). The formula for k is [36]
where is the RMS of the fluctuating velocity (i.e., turbulence intensity), is the fluctuating velocity in three directions, is the instantaneous velocity measured by ADV, is the average velocity, and is the total number of measured samples.
Shear stress is the apparent stress associated with turbulent momentum transport. The formula is
where is the density of water (996.782 kg/m3 at 26 °C), and and denote the fluctuating velocity in different directions. Since we pay more attention to the effect of large shear stress on fish eggs, τ takes the maximum value in .
The top of the tank is covered to prevent water overflow. Generally speaking, an oscillating-grids turbulence tank is often filled with water without leaving the free surface, i.e., the upper-cover type. This can ensure that the turbulence generated inside the tank is approximately uniform in a selected range [37]. However, the flow turbulence is small (k < 0.0055 m2/s2, τ < 0.7 N/m2), which is far from the FTCs in a natural river [38,39,40,41,42,43,44]. Therefore, in this experiment, a space of 5 cm above the free surface of the water body in the vibrating-grid water tank was reserved for the free oscillation of the water flow, increasing the turbulence intensity inside the tank and better simulating the turbulence characteristics of the water flow in a natural river (Figure 2).
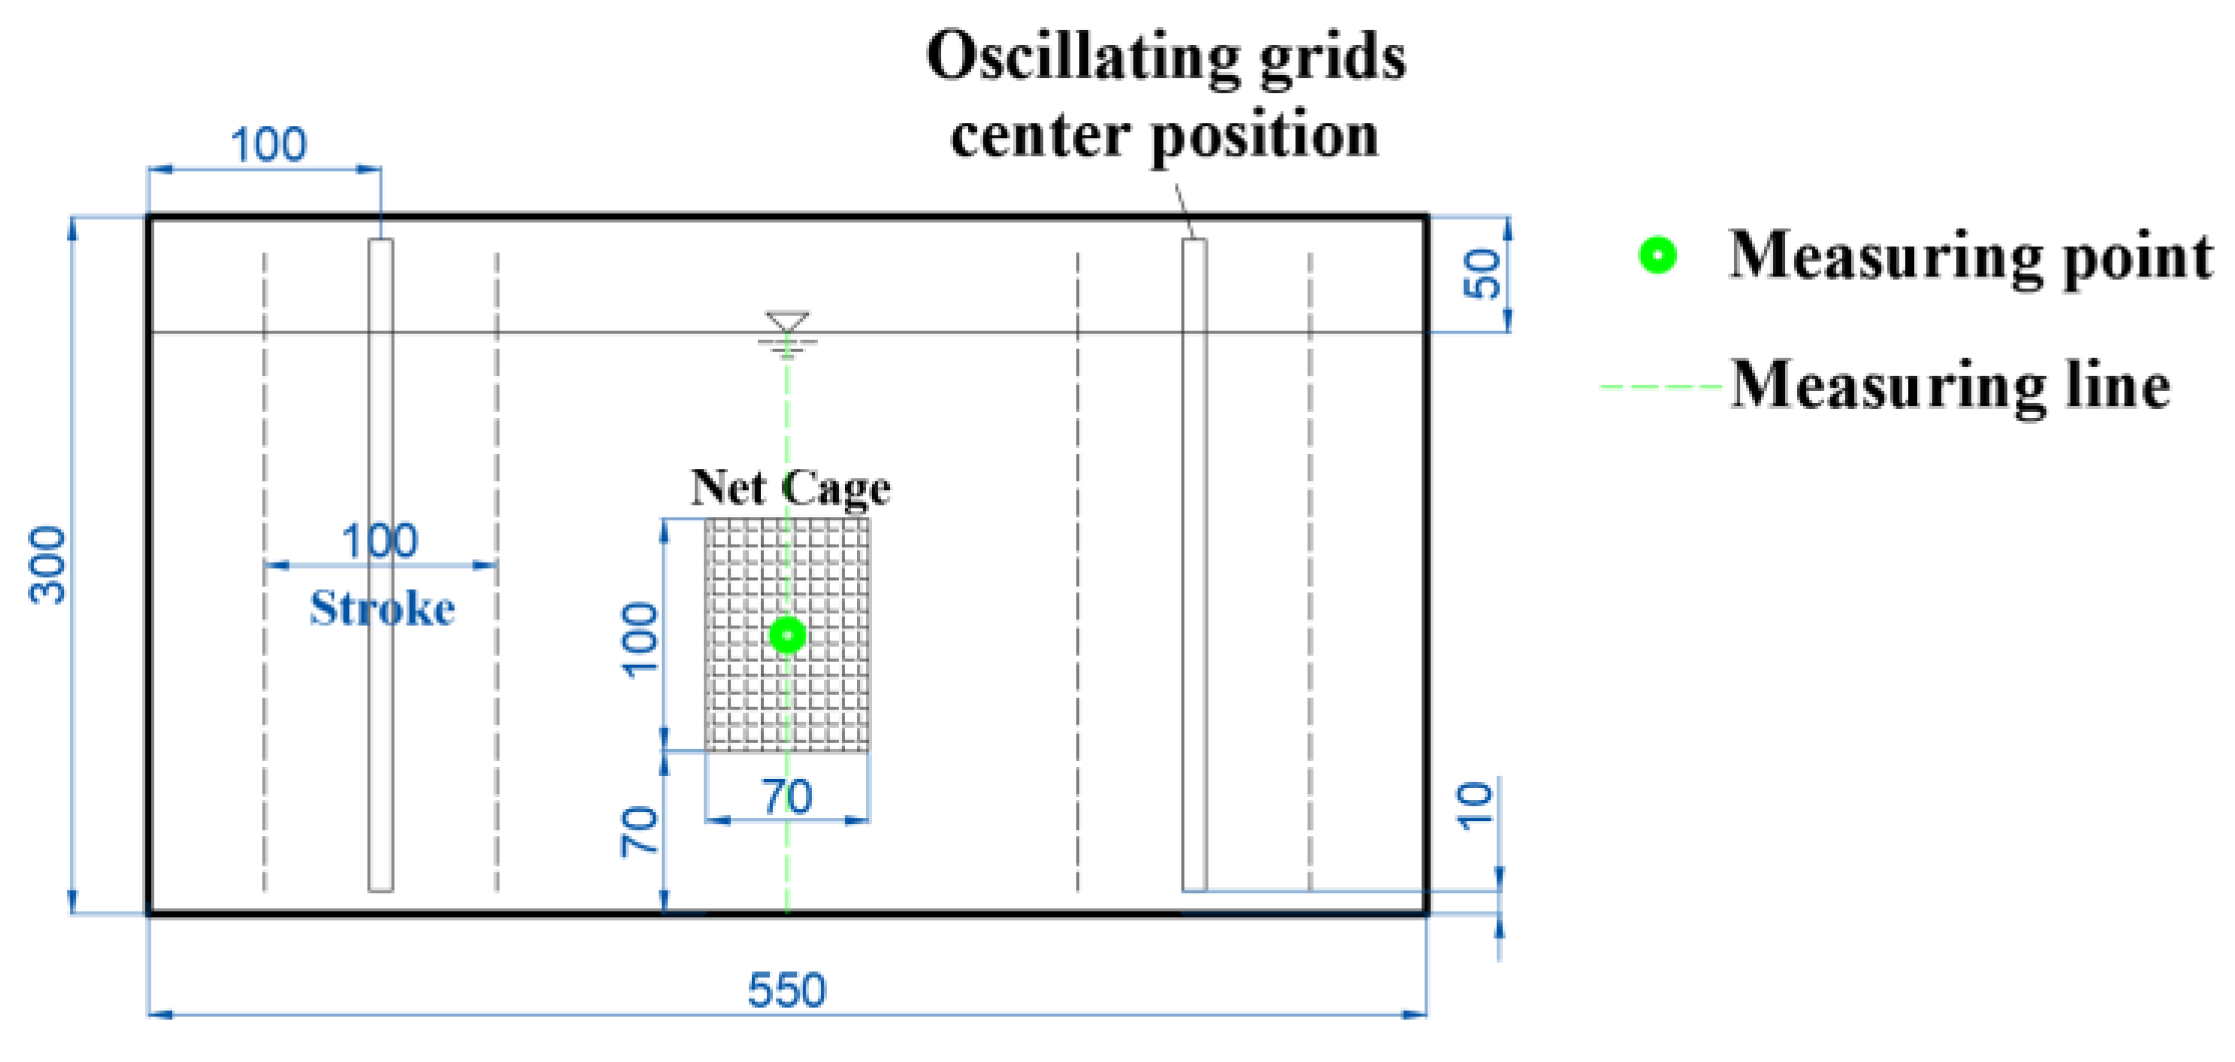
To investigate the vertical turbulent distribution within the tank, a vertical measuring line was positioned at the planar center of the tank, and measurements were conducted using the ADV system. Along the measuring line, points were sampled at 2 cm intervals within the range of 5–23 cm above the tank bottom, totaling 10 points (see Figure 2). Three different operational conditions were examined, corresponding to grid vibration frequencies (abbreviated as f) of 2, 4, and 6 Hz, with the measurement outcomes depicted in Figure 3a. It is evident that turbulence is relatively uniform near the middle of the tank. Consequently, the position for the net cage was chosen at a depth of 7–17 cm above the tank bottom.
Once the net cage position was determined, an additional measuring point was established at the center of the net cage (Figure 2) to observe the impact of the net cage on turbulence and calibrate the turbulent environment within the net cage. The measurement results are illustrated in Figure 3b. Following the placement of the cage in the tank, turbulence at the central point of the cage exhibited a slight reduction compared to the condition without the cage, meeting the experimental requirements. Postcalibration, the average turbulence within the net cage fell within the range of k (0–0.5 m2/s2) and τ (0–60 N/m2), with f = 0–6 Hz and a stroke of S = 10 cm. This essentially covers the majority of natural rivers, excluding special conditions such as those involving turbines, thrusters, and spillways. The turbulent environment in the vibrating-grid water tank exhibits a symmetrical distribution from left to right, with a smaller magnitude in the middle and larger magnitudes on both sides [37]. Considering the narrow width of the cage, the variation of turbulence in the horizontal direction is negligible; thus, it is approximately assumed that the turbulence at the measurement point represents the average turbulence inside the cage. Although the exact positions of fish eggs within the cage are unclear, given the influence of turbulence, it can be anticipated that fish eggs are randomly distributed within the cage. Therefore, it is presumed that the turbulent environment experienced by fish eggs in the experiment corresponds to the aforementioned calibrated average turbulence values.
2.3. Experimental Protocol
The experimentation took place at the Yangzhong Base of the Jiangsu Provincial Freshwater Fisheries Research Institute. Two experiments were conducted on 31 August and 2 September 2022, respectively. In each experiment, two male and two female fish were carefully selected to ensure a higher fertilization rate. The fertilization outcomes of the two experiments are detailed in Table 2. For a visual representation, Figure 4 illustrates the sperms and oocytes obtained, using the first experiment as an example. The fish eggs resulting from artificial insemination were carefully transferred to a hatching barrel to facilitate continuous hatching, and they were retrieved as needed throughout the course of the experiment. The experimental water used was sourced from a treated Yangtze River water diversion.
In this study, the eggs of Squaliobarbus curriculus (S. curriculus) were obtained by artificial insemination, and the whole process did not cause damage to S. curriculus itself. After obtaining the eggs, we put the S. curriculus back into the pond and made every effort to minimize the pain. Therefore, according to the Chinese Association for the Laboratory Animal Sciences and the Institutional Animal Care and Use Committee (IACUC) protocols, this study is exempt from the requirement for ethics approval.
The impact of the same FTC on fish eggs can vary across different developmental stages. In this study, the developmental time postfertilization served as a single variable. At distinct time intervals leading up to hatching, a measured quantity of fish eggs (approximately 30 mL as measured by a cylinder) was extracted from the hatching barrel and placed into the net cage. The FTC k = 0.157 m2/s2, τ = 19.93 N/m2 generated by f = 5 Hz and the stroke S = 10 cm was selected as the typical FTC, and the action time (TA for short) was 1 min. The described procedure constitutes one typical group, which was repeated twice.
Studies have indicated that newly hatched larvae have weaker resistance to turbulence compared to fish eggs. The globular structure of the egg and the flexible outer chorionic membrane may to some extent protect the embryo from rotation, deformation, and shear stress. Under the impact of turbulent forces, the egg membranes of certain fish eggs may rupture prematurely, releasing vulnerable and incompletely developed larvae, resulting in their mortality or developmental abnormalities [7,9,34]. Herein, no distinction is made between mortality and developmental abnormalities; any fish egg that prematurely sheds its membrane is uniformly considered incapable of normal development. Following membrane rupture, their volume becomes negligible. Therefore, this study utilizes volume changes to estimate such damage. The ratio of fish eggs volume without shedding membranes to the total fish eggs volume can be considered as the proportion of eggs that can develop normally.
The volume of fish eggs before (V1) and after (V2) the turbulent flow effects was precisely measured using a measuring cylinder. The percentage of fish eggs volume without shedding membranes is expressed as the ratio of V2 to V1 (P(experiment), Equation (1)).
Beyond the impact of flow turbulence, the standard experimental procedure itself may contribute to premature shedding of egg membranes. To account for this, the corrected data utilized the ratio of experimental results from the typical group to those from a blank control group. This corrected percentage of fish eggs volume without shedding membranes under the typical FTC is denoted as P0 (Equation (2)).
where is the percentage of fish eggs volume without shedding membranes; is the percentage of fish eggs volume without shedding membranes in the blank control group; and is the corrected percentage of fish eggs volume without shedding membranes under the typical FTC.
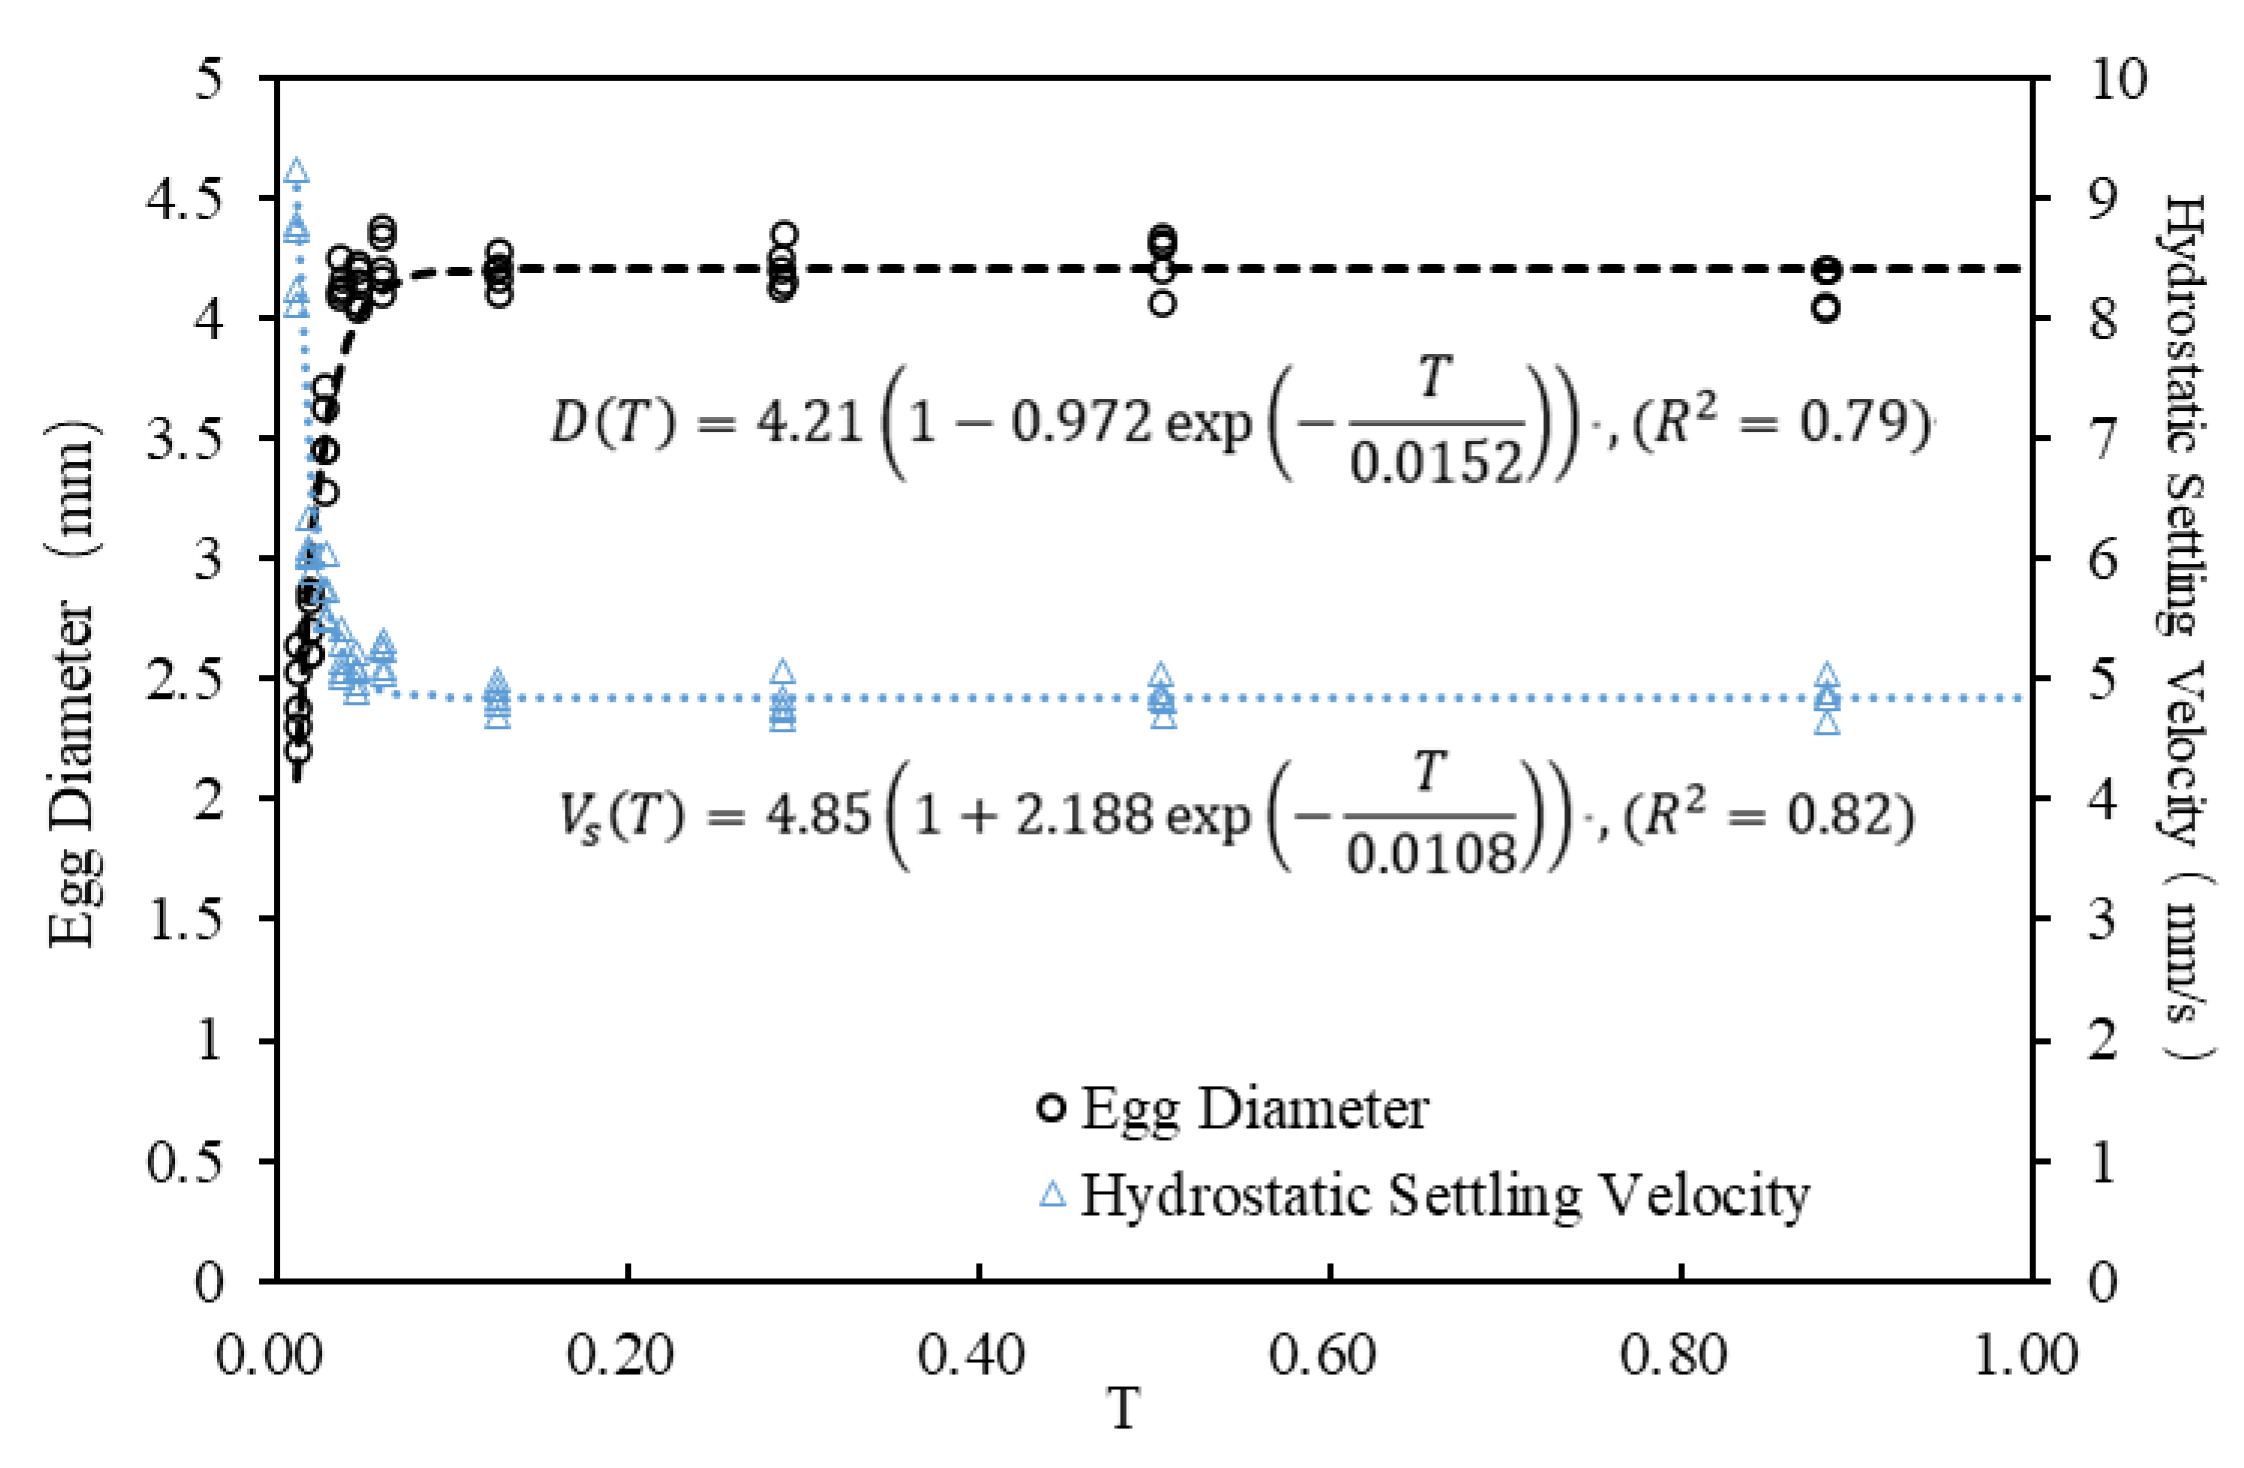
During the initial hour, the eggs of S. curriculus experienced swelling with the experimental water temperature maintained at 26–27 °C. Subsequently, the swelling gradually stabilized. Ultimately, the egg diameter reached a stable state at 4.2 ± 0.4 mm, and the hydrostatic settling velocity remained constant at 4.85 ± 0.5 mm/s. The corresponding egg density, determined through formula conversion, stabilized at 997.79 ± 0.4 kg/m3 [45]. Given the substantial variations in the size and density of fish eggs (expressed in hydrostatic settling velocity) during this period (as depicted in Figure 5), manually counting them based on volume measurement proved challenging. Moreover, this time window was relatively short, constituting only about 5.6% of the entire embryonic period. Consequently, the experiment was not conducted during this initial phase. Recognizing that the chorion undergoes increased susceptibility to hatching enzymes and embryo movements as fish eggs approach hatching, resulting in a gradual weakening of membrane strength [33,46], the influence of flow turbulence is anticipated to intensify. Therefore, the experimental time interval was strategically set between 0.5–2 h, with an increased experimental frequency as fish eggs approached hatching.
Different FTCs and TA may exert distinct effects on fish eggs at the same developmental stage. The initial time, when P0 ≈ 75%, marks the point at which the influence of the typical FTC (k = 0.157 m2/s2, τ = 19.93 N/m2) gradually becomes apparent, as indicated in the results in Section 3.1. Subsequently, two standard groups were conducted at intervals of 1–2 h, resulting in a total of three groups.
Each standard group’s experimental conditions for different FTCs involved f of 4, 5, and 6 Hz (k = 0.0056, 0.1567, 0.4190 m2/s2; τ = 0.44, 19.93, 59.82 N/m2), with a TA of 1 min. For each group focusing on different TA, the conditions included 1 min, 3 min, and 5 min, with a constant f of 5 Hz.
According to the experimental design outlined above, the proportion of the fish eggs volume without shedding membranes can be obtained under any FTC and TA, denoted by the variable P. The computation method for P is identical to that of P0 (Equation (2)).
There are a total of 7 experimental conditions, categorized into three main groups: the blank group (condition 0), the typical group (condition 1), and the standard group (conditions 2–6) (see Table 3).
3. Results
3.1. Effects of Typical FTC on Fish Eggs at Various Developmental Stages
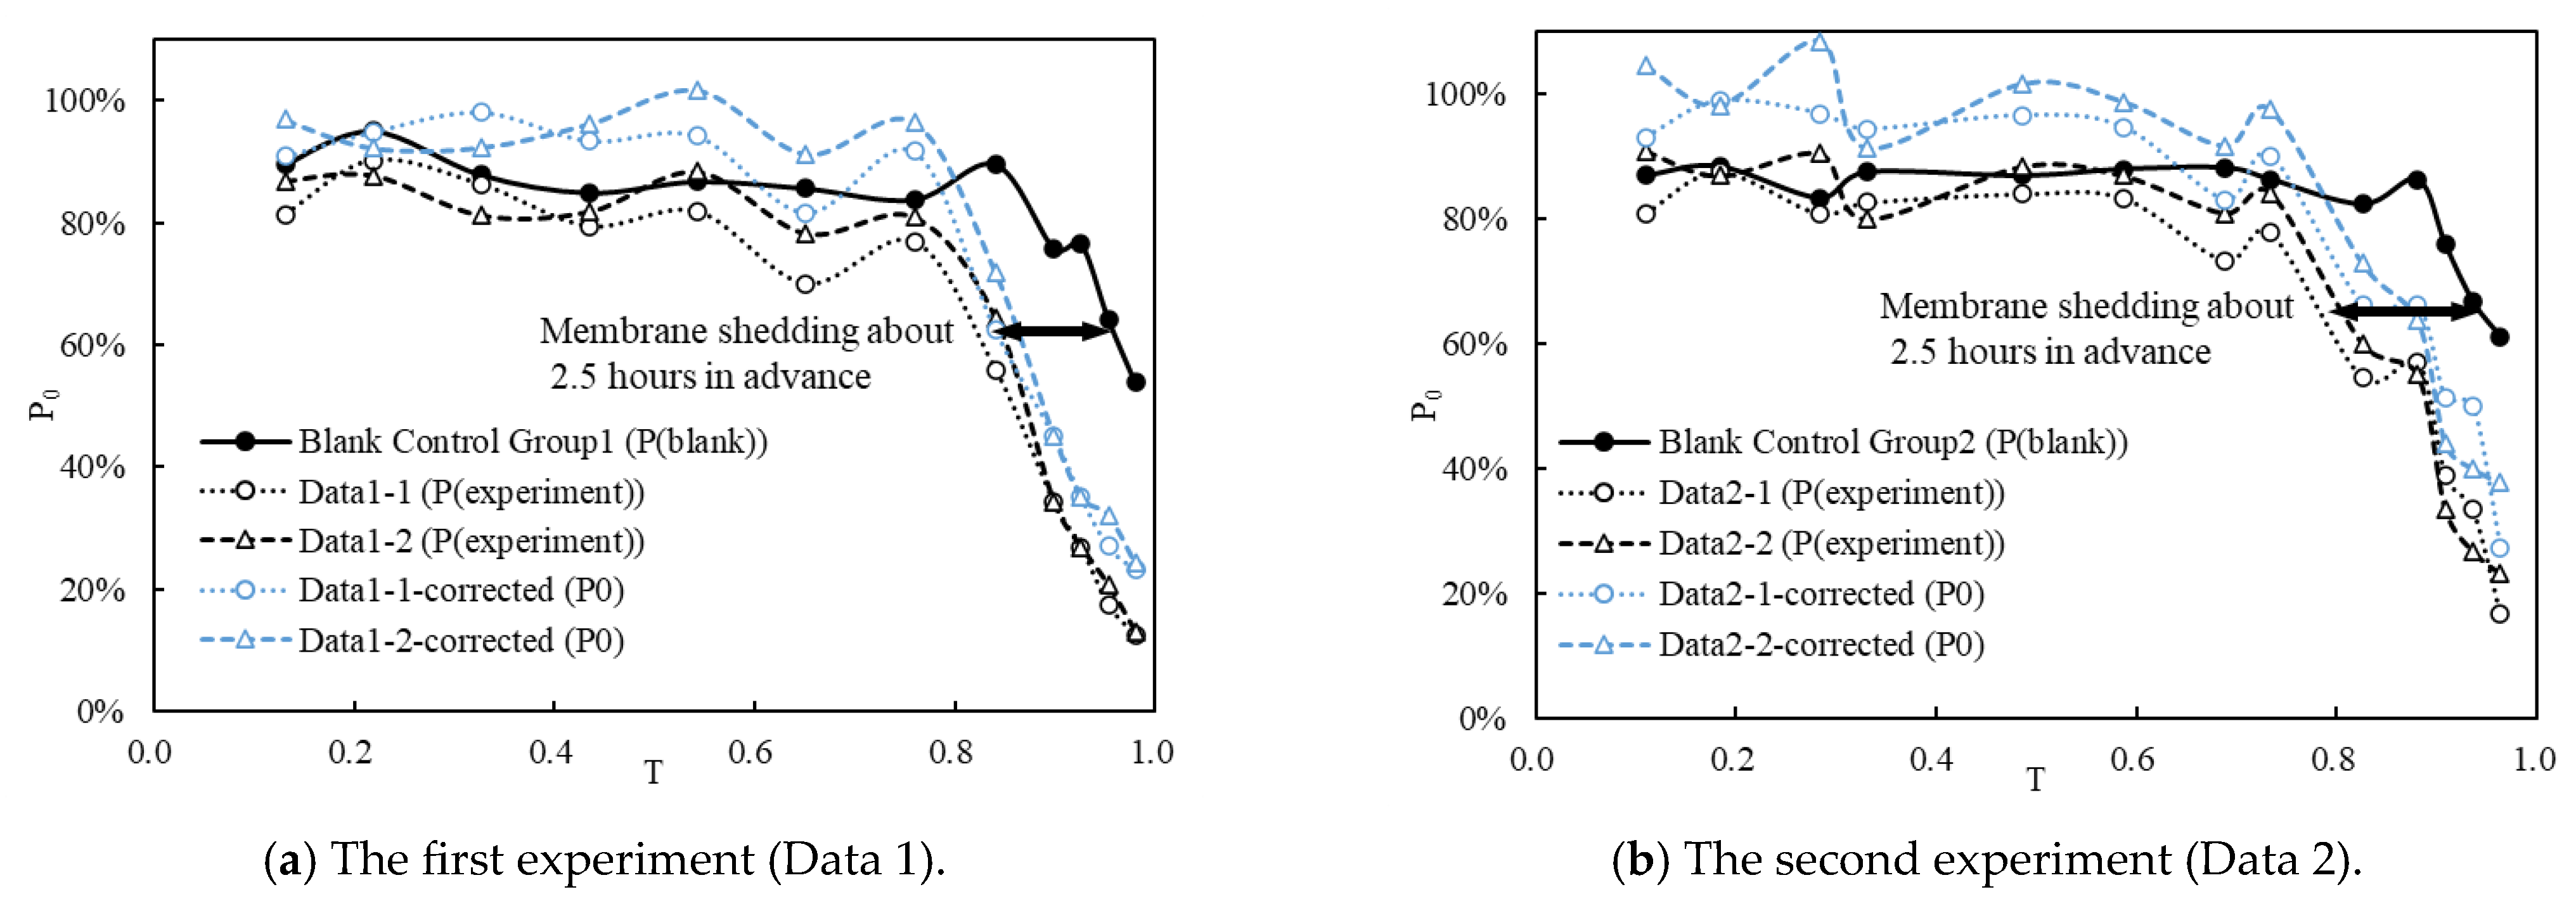
Figure 6 illustrates the variation in P(blank), P(experiment), and P0 over the development time of fish eggs. It is evident that the two experiments exhibit a consistent pattern.
The corrected data (blue line, P0) in the graph depict the impact of the typical FTC on S. curriculus eggs. Notably, the typical FTC minimally affects the early stages of egg development (T < 0.5), indicating a robust resistance of eggs to water turbulence during this period. However, from the middle of egg development, P0 gradually decreases. As the natural hatching time approaches, fish eggs become more susceptible to damage from flow turbulence, leading to premature shedding of membranes.
The blank control groups (black solid line) reflect the overall damage incurred by the entire experimental operation on fish eggs. Comparison with the two experimental datasets (black dotted line) reveals a phase difference of approximately 2.5 h (black line) in the late stage of fish egg development. This disparity underscores the detrimental impact of flow turbulence on fish eggs. Specifically, under the influence of the typical FTC, fish eggs exhibit membrane shedding approximately 2.5 h (0.14 times T) earlier than expected.
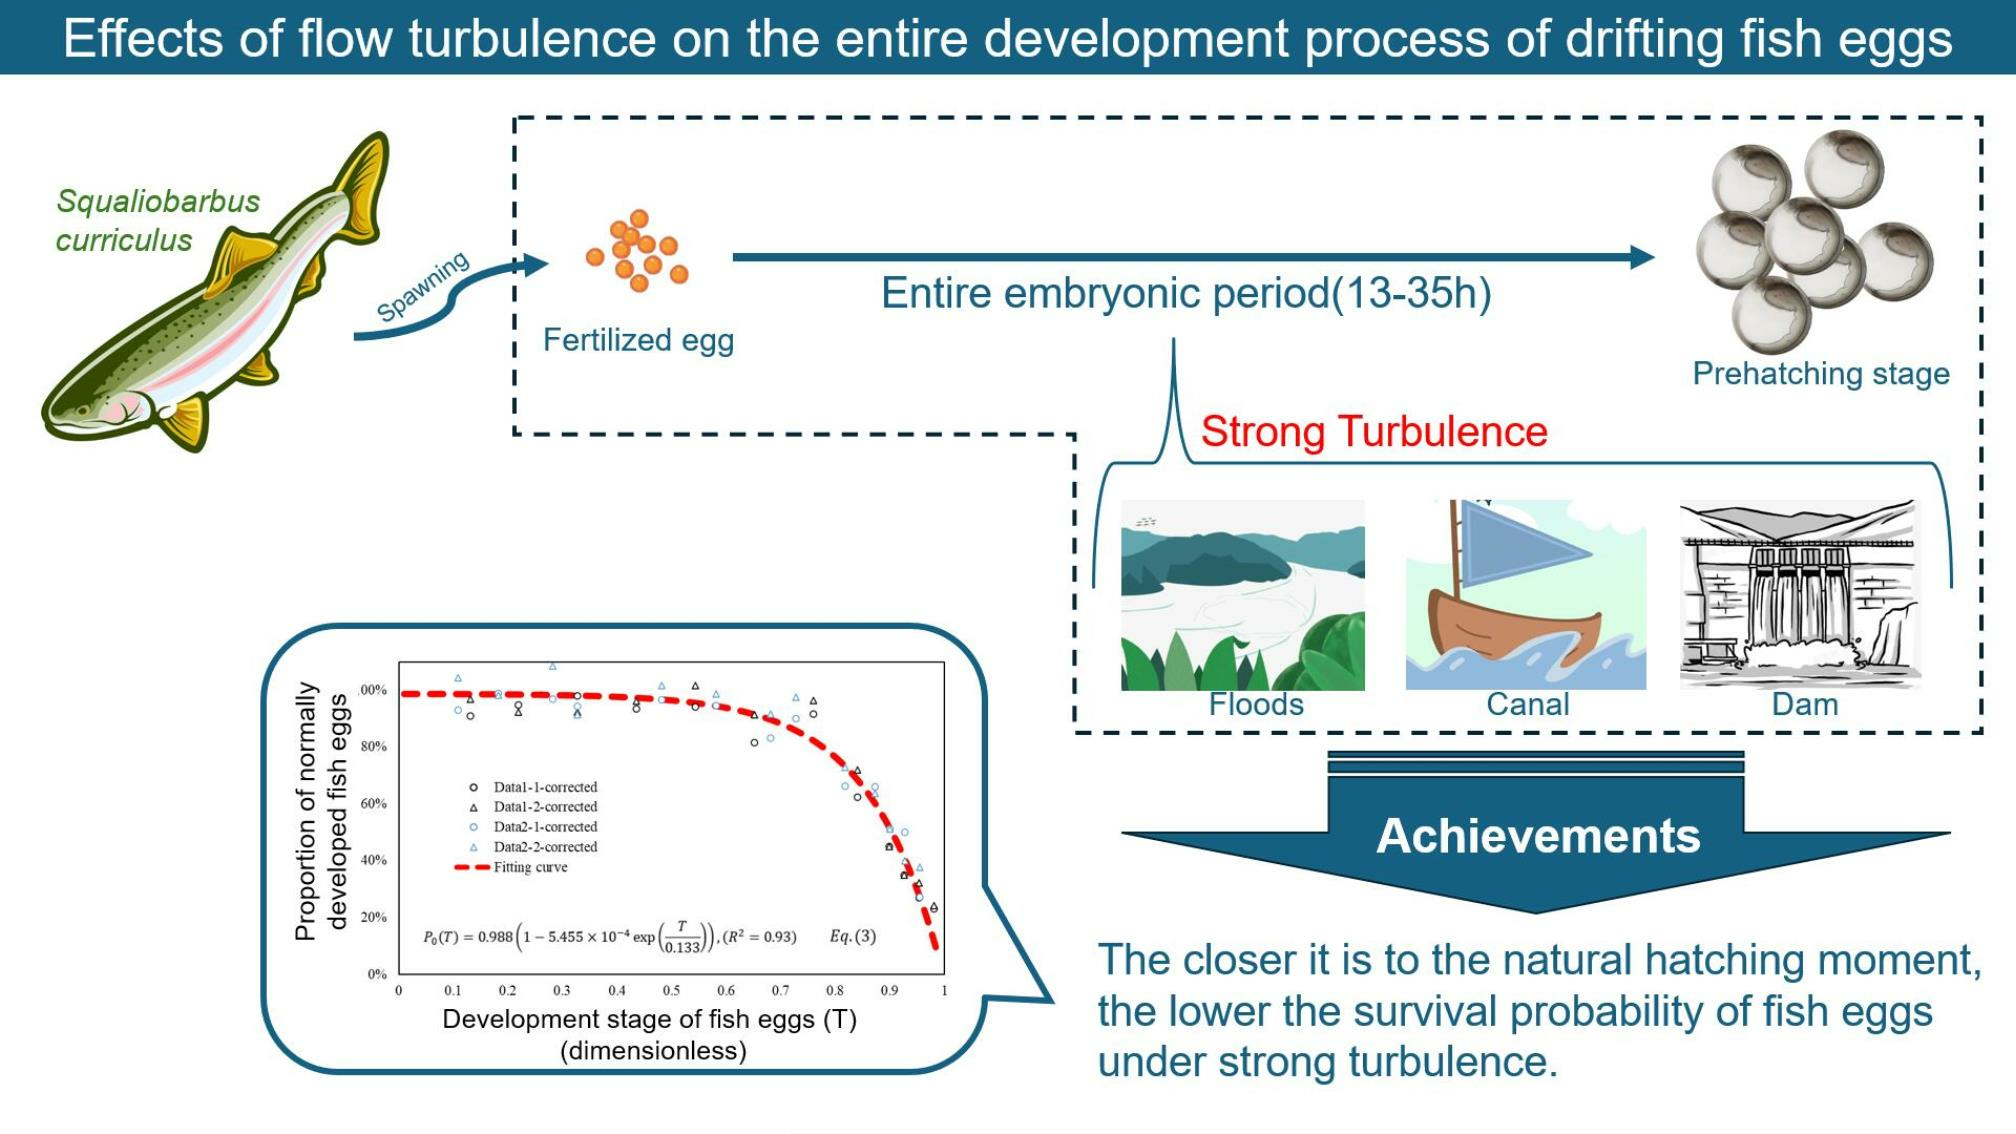
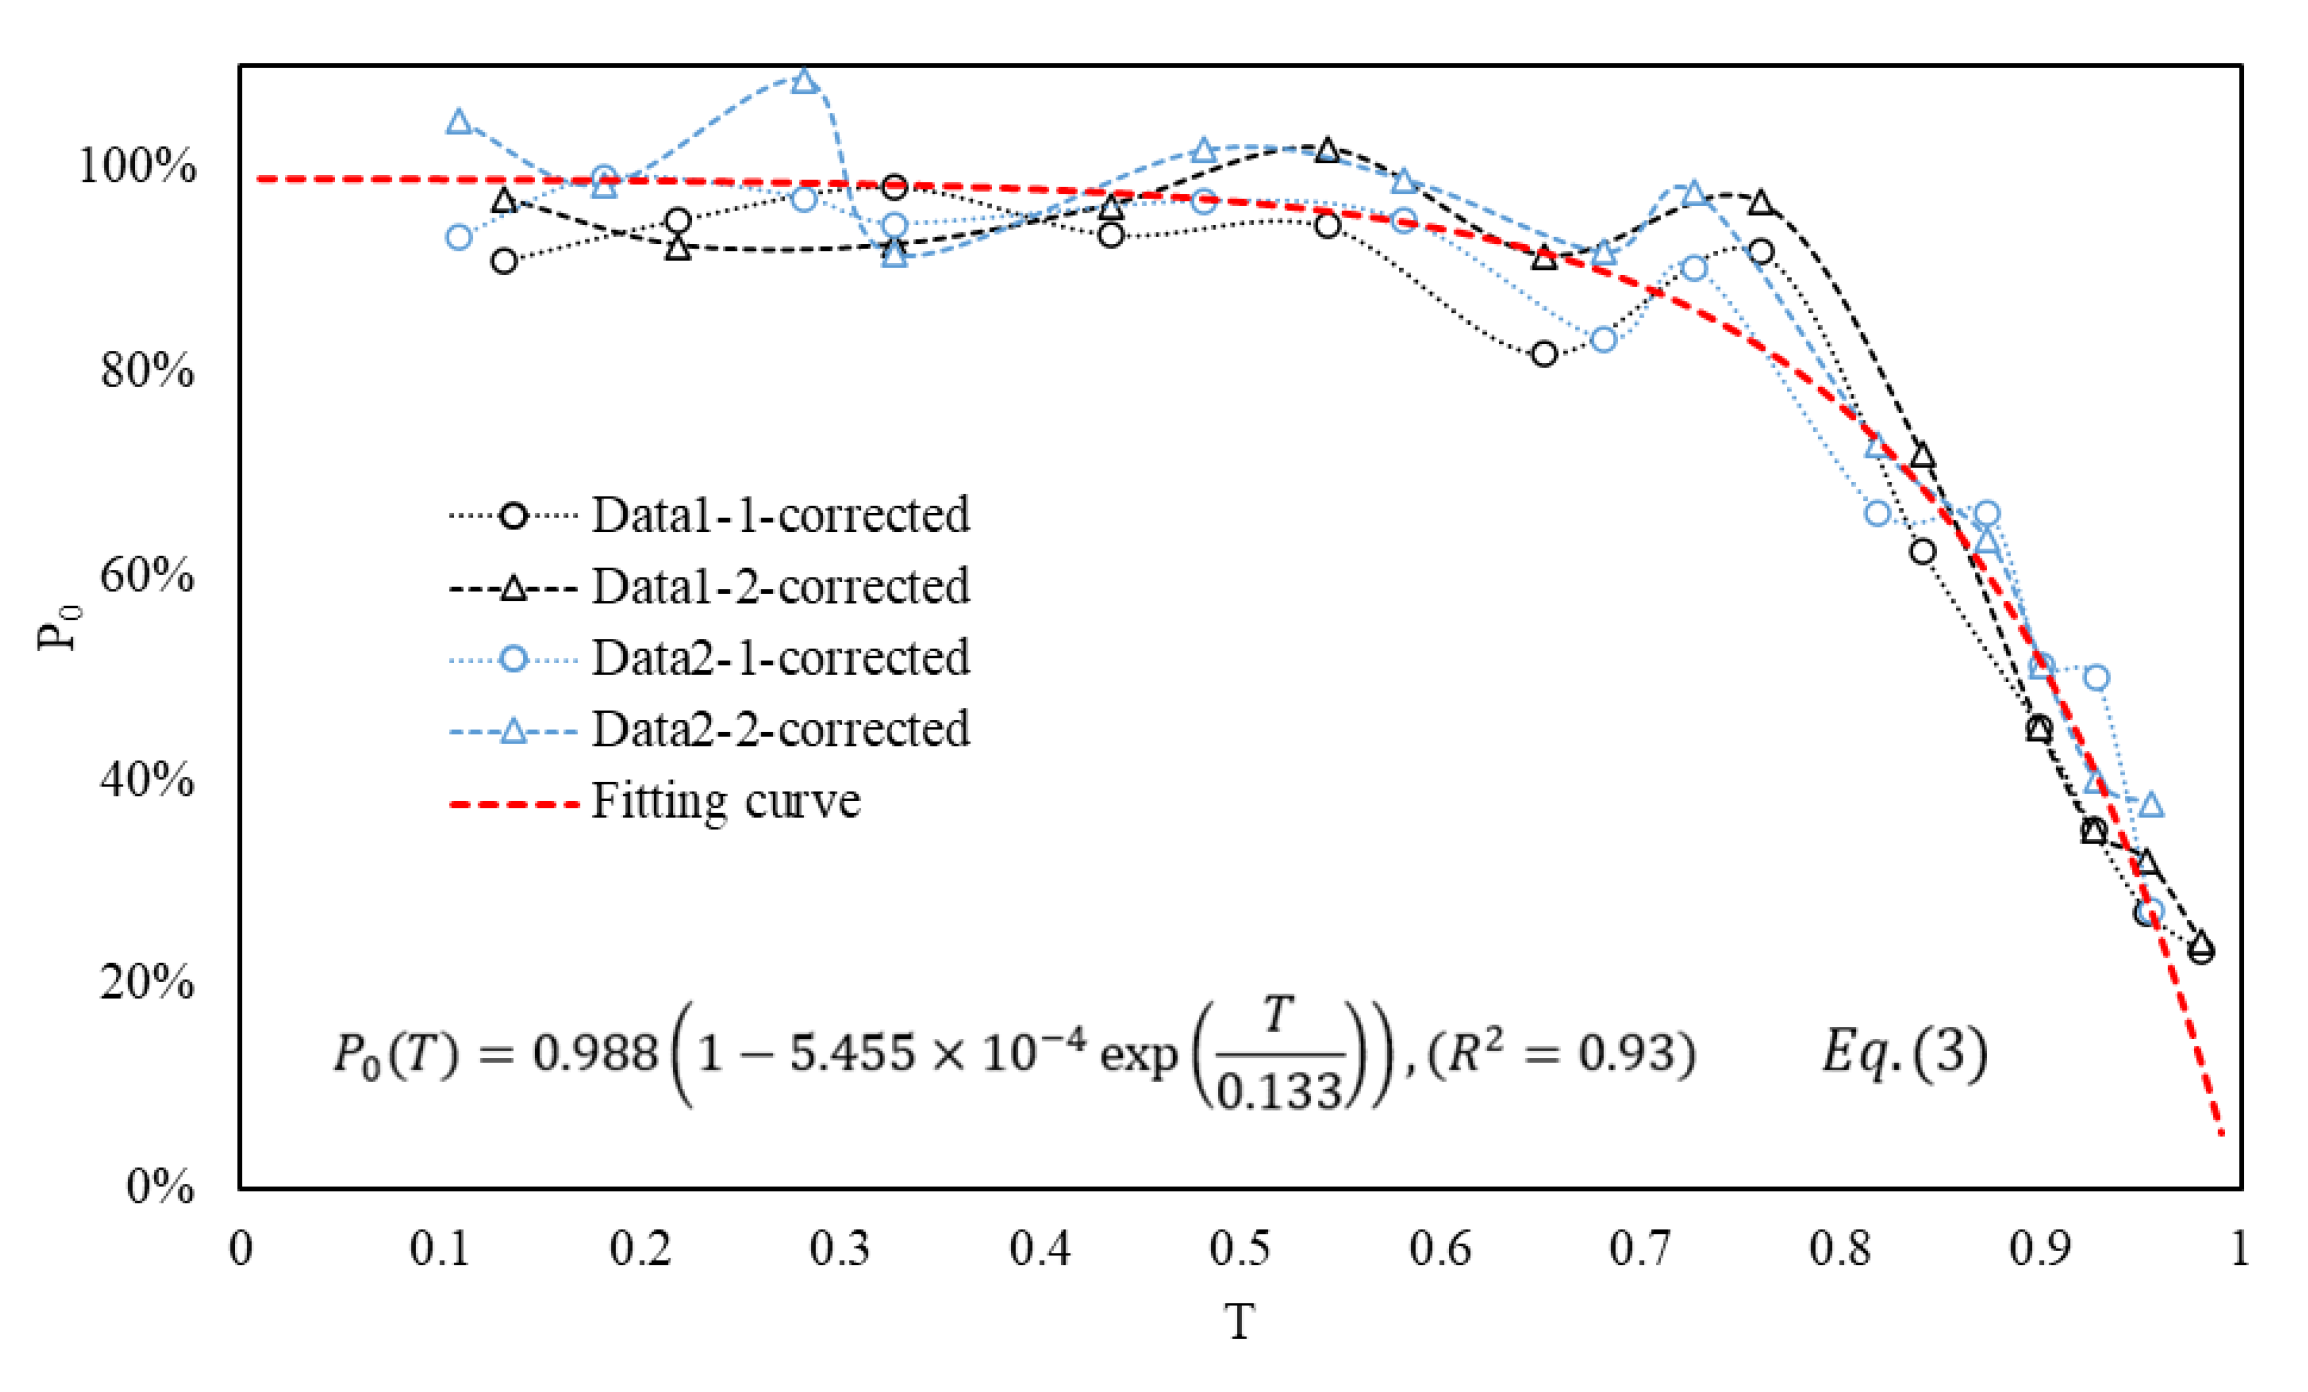
Figure 7 consolidates the P0 from Figure 6, presenting a total of four lines. The empirical formula, represented as Equation (3) and depicted by the red dotted line in the figure, captures the trend. Notably, during the early and middle stages of fish egg development, the influence of flow turbulence on fish eggs is minimal. However, as the egg development progresses into the middle and late stages, the impact of the typical FTC on fish eggs becomes more pronounced over time.
3.2. Effects of FTCs and TA on Fish Eggs
Figure 8 illustrates the impact of various flow turbulence conditions (FTCs), taking k as an example, and a similar pattern is observed for the τ. In Figure 8a, during the middle and late stages of egg development, there is a noticeable decrease in P with increasing flow turbulence. This suggests that higher flow turbulence leads to greater damage to fish eggs, resulting in a higher proportion of eggs shedding membranes prematurely. However, it is worth noting that at different stages of T, the slope of the curve varies slightly, with a larger T corresponding to a steeper slope. This indicates that the closer the fish eggs are to their natural hatching time, the more pronounced the impact of increased turbulence on fish eggs. A similar trend is observed in Figure 8b.
3.3. Establishment of Empirical Formulas
Equation (3) in Section 3.1 serves as the empirical formula depicting the variation of P0 (the corrected percentage of fish eggs volume without shedding membranes under the typical FTC) with T (the development stage of fish eggs) under the influence of the typical FTC. For predicting P (the corrected percentage of fish eggs volume without shedding membranes under any FTCs) within a selected range, a combined consideration of the experimental findings from both Section 3.1 and Section 3.2 is essential.
The fundamental approach involves deriving P0 (Section 3.1 results) initially, based on Equation (3), representing the P0 at a specific developmental stage of fish eggs. Subsequently, considering the response pattern of P to different FTCs and TA at the same egg development stage (Section 3.2 results), P is deduced from P0.
Drawing inspiration from classical mechanics [47], let turbulent kinetic energy action (Ak) = k × TA, and shear stress action (Aτ) = τ × TA. The results from Section 3.2 under various FTCs and TA conditions are amalgamated in Figure 9, illustrating the variation of P with Ak (a) and Aτ (b) under diverse working conditions.
In both figures, the blue, green, and yellow colors signify the corresponding relationship between P and action at different developmental stages (0 < T ≤ 0.65, 0.65 < T ≤ 0.80, 0.80 < T ≤ 1). The larger the T, the steeper the slope across the entire region, signifying a heightened impact of different actions on fish eggs as they approach their natural hatching time.
The developmental process and period of S. curriculus eggs align with those of the four major Chinese carps. The final developmental stage before hatching is the heartbeat stage, typically occurring at (0.85–0.9) T. At this point, the heart begins to pulse weakly, gradually strengthening, marking the culmination before hatching. The incubation process, from the initiation of incubation to complete incubation, generally spans between 1 to 3 h, with the heartbeat period accounting for about 0.05 to 0.1 times T [48] (in this paper, the incubation process is approximately 1.5 h).
Assuming that fish eggs breaking membranes in the range of 0 < T ≤ 0.9 may lead to death or deformities, focus is directed towards the developmental stages associated with adverse outcomes. According to Equation (3), when T = 0.9, P = P0 ≈ 0.5 (P0 is represented by the vertical red dotted line in Figure 9). Therefore, the lower boundary of the yellow area in Figure 9 is a straight line with the same slope as the yellow dotted line, where P0 = 0.5. Below this yellow lower boundary (P0 < 0.5), it is considered that the fish eggs’ development stage is at T > 0.9, and they can develop safely even if membranes break prematurely. Conversely, above this boundary, it is considered that the development stage is at T ≤ 0.9, where eggs with shedding membranes may face mortality or malformations (refer to Figure 7 in Section 3.1).
In summary, the empirical formulas shown in Equations (4) and (5) can be derived by fitting the straight line in Equation (3) and the corresponding figure as follows:
where P is the function of P0 (T) and Ak or Aτ. Because the formulas have taken into account the range of egg death or developmental deformity (0 < T ≤ 0.9), P can also be understood as the proportion of normally developed fish eggs under different FTCs. The range of Ak is (0.33, 50), and the range of Aτ is (26, 6500). Different developmental stages T correspond to different formulas to calculate P. P0 (T) is obtained by Equation (3).
Because the action is accumulated over time, it is impossible to think that the cumulative action of flow turbulence in the whole period has an impact on the current fish eggs. Considering that the maximum duration of turbulence continuous action is set to be 5 min in the experiment, it is assumed that whether the fish eggs break membranes in advance is only related to the action within the past 5 min.
Different water temperatures have a great influence on the development and hatching time of fish eggs. Here, it is assumed that the time required for each developmental stage of fish eggs at different water temperatures is proportionally increased or decreased. That is, at different water temperatures, T represents the same stage of fish egg development (the same fish). The abscissas in Equations (3)–(5) were dimensionless-processed for the developmental stages of S. curriculus eggs. Therefore, these equations can be applied to the prediction of different water temperatures.
4. Discussion
4.1. Comparison with Existing Achievements
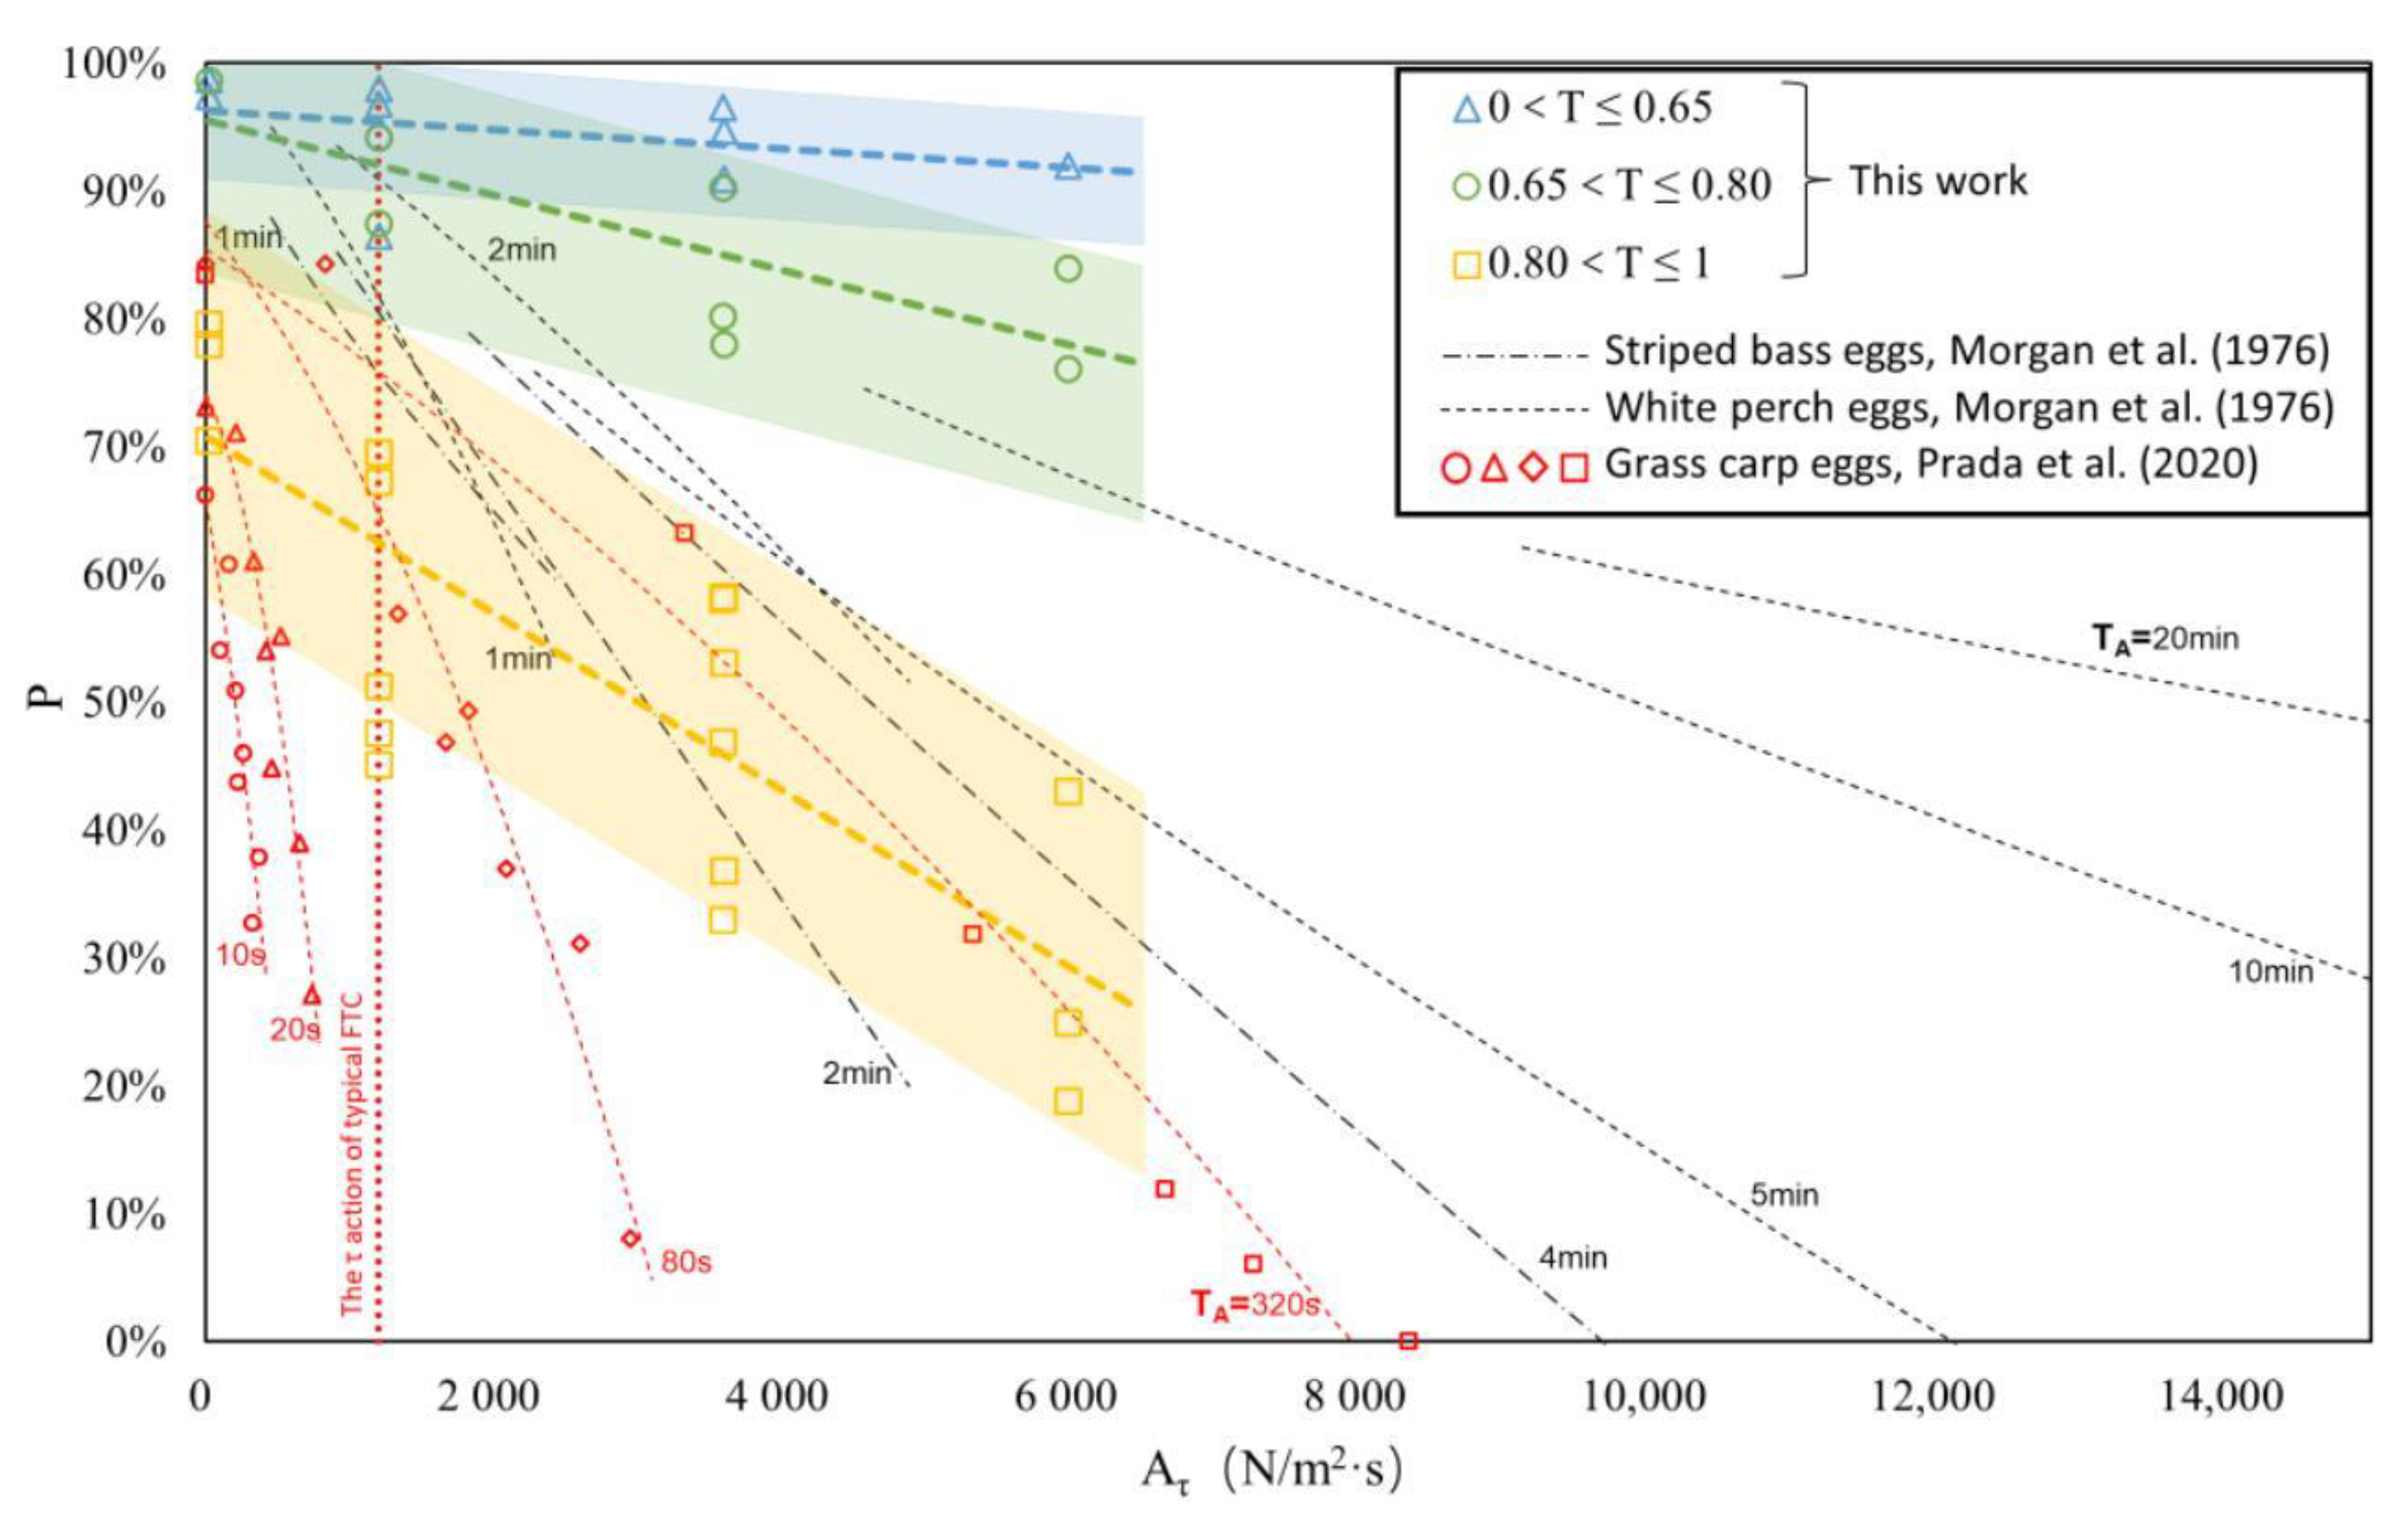
In Figure 10, based on Figure 9b, the experimental results of Morgan et al. and Prada et al. are plotted in the form of shear stress. The display range of abscissa in the figure is larger than that in Figure 9b to adapt to the research results of others. The range of lines or regions in the figure represents the range of experimental conditions.
From Figure 10, it can be observed that the experimental results of Morgan et al. (black dotted line) closely align with the empirical relationship obtained in this study (colored region in the figure). There exists a negative correlation between P and Aτ, with similar slopes. Their experimental conditions range was larger, and the maximum shear stress was nearly 50,000 N/m2·s (the abscissa is only shown to 15,000 N/m2·s). This was mainly due to its maximum action time TA of 20 min.
The experimental results of Prada et al. are relatively lower-positioned in the figure. It reflects that the survival rate of fish eggs will decrease rapidly under small shear stress. This may be related to their TA. When the TA is 10 s or 20 s, the slope of the data point is larger. When the TA is 80 s or 320 s, the slope gradually decreases. If other effects (such as fish egg development period or experimental operation mode) are excluded, this phenomenon may reflect another law: when the fish egg is just affected by the turbulence, it will exhibit a marginal effect decreasing law in TA. The effect of flow turbulence on fish eggs is not linear with the increase in TA, and its increase may gradually decrease. This law can also be seen in the experimental results of Morgan et al. Since this work focuses on the influence of flow turbulence on the development stage of fish eggs, further discussion will not be pursued here.
Table 4 lists the corresponding experimental conditions of the above results. Except for white perch eggs (which are sticky eggs), other eggs are drifting eggs, and the related egg traits are similar to those of S. curriculus eggs. From the black dotted line in the figure, white perch eggs (sticky eggs) seem to be more resistant to water turbulence than striped bass eggs. Morgan et al. do not mention the development period of the fish eggs used in their experiments, so their experimental results can only be used as an approximate reference. The experimental results obtained by fish eggs at different developmental stages may be quite different. Prada et al. divided the fish eggs into pre-water-hardened and water-hardened eggs, and the data of water-hardened eggs are shown in the figure. From the experimental results in Section 3.1, such a stage division method is not detailed enough.
The type of fish egg, the development period of the fish egg, the experimental water temperature, and the experimental condition may cause the difference results. When making a comparison, we should compare and discuss in many aspects.
4.2. Internal Mechanism of Fish Egg Hatching
Understanding the internal mechanism of fish egg hatching is helpful to better explain the above experimental achievements. The natural hatching process of fish eggs is most often described as the result of the digestion of egg membranes by hatching enzymes and the mechanical destruction of embryo movement, which can be understood as a combination of biochemistry and behavior [51].
The hatching enzyme is released by the hatching gland cell, which can digest the egg membrane to promote the hatching of the fish egg. The hatching gland cell usually appears in the early embryo at the end of the gastrula stage [52,53,54,55]. The timing of its appearance is usually closely related to the onset of eye pigmentation, heartbeat, and blood circulation (about 0.6–0.7 T) [56,57,58]. When studying the time of eel hatching enzyme gene expression, Hiroi et al. found that hatching enzyme gene transcripts could be detected for the first time in embryos 20 h after fertilization (about 0.45 T stage), and then they gradually spread to the yolk sac [55].
Suga et al. [33] measured the toughness of Medaka eggs from 64 cell stages to hatching. The study showed that the eggs’ toughness gradually decreased in the middle of the embryonic period (about 0.5 T stage). At this time, a large number of secretory cells of hatching enzyme could be detected. The total toughness decreased by about 48% on the eve of incubation, and the eggs rapidly and completely lost toughness in the last 20 min before incubation. The whole process was related to the decrease in colloid osmotic pressure and the digestion of hatching enzyme due to the decreased yolk sac volume. In the middle and late stages of the embryo (0.5–1 T stage), the thinning of the chorion could be observed. This was closely related to the digestion of hatching enzyme. After the muscle effect period of the embryo (about 0.65 T stage), the movement of the embryo began to produce mechanical damage to the egg membrane and finally broke the membrane.
In summary, the digestion of egg membrane by hatching enzyme (about 0.6 T), the movement of the embryo (about 0.65 T), and the decrease in colloid osmotic pressure (about 0.5 T) caused by the decrease in yolk sac volume (about 0.5 T) led to the decrease in strength and toughness of the egg membrane in the middle and late embryonic stage. This also explains why the proportion of undamaged fish eggs gradually decreases in the middle and late stages of the embryonic period under the same FTC.
5. Conclusions
Many studies have demonstrated that excessive flow turbulence or shear stress can affect the entire development cycle of fish. This study focused on the impact of flow turbulence on fish eggs and explored the variation of the effects of different flow turbulence conditions (FTCs) on the entire process of S. curriculus eggs from fertilization to hatching. The main findings are as follows:
(1) Under the same turbulent flow conditions, as fish eggs approach natural hatching time, their resistance to flow turbulence weakens, resulting in a larger proportion of eggs experiencing early membrane damage. Fish eggs that undergo premature membrane rupture are considered unable to develop normally.
(2) Under various FTCs and action time (TA) conditions (k = 0.0056, 0.1567, 0.4190 m2/s2; τ = 0.44, 19.93, 59.82 N/m2; continuous action for 1 min, 3 min, or 5 min constant), the larger the FTC and the longer the TA, the higher the percentage of fish eggs unable to develop normally.
(3) According to the above results, the empirical formulas between the proportion of normal development of fish eggs and the action of k and τ under different FTCs in a selected range (0.33 < Ak < 50, 26 < Aτ < 6500) were established. The rationality of the empirical formulas was discussed from the aspects of the internal mechanism of fish egg hatching, the assumption of the formulas, and the scope of application, which indicates that the results are credible.
In the future, the above empirical relations hold important guiding significance in protecting fish resources or limiting the invasion of specific fish organisms, guiding the construction of artificial breeding facilities, or ensuring a safe transfer and transportation process. These empirical formulas can also be combined with the fish egg drift models (FluEgg [12,59] or SDrift [60], etc.) to predict the probability of death or deformity of S. curriculus eggs in a river section affected by flow turbulence. This can help identify high-risk areas of natural drift development of fish eggs and provide a basis for the design and layout of ecological wading projects. Additionally, this research method can be applied to other types of fish eggs.
Author Contributions
Conceptualization, Y.W., A.M., Y.D. and M.C.; methodology, Y.W., A.M., Y.D. and Z.C.; validation, Y.W. and Z.C.; formal analysis, Y.W.; investigation, Y.W. and Y.D.; resources, Y.W. and Y.D.; data curation, Y.W.; writing—original draft preparation, Y.W.; writing—review and editing, Y.W., A.M., Y.D., M.C., Y.H. and L.Z.; supervision, A.M. and M.C.; project administration, Y.W. and A.M.; funding acquisition, A.M., Y.D., M.C. and Y.H. All authors have read and agreed to the published version of the manuscript.
Funding
This research was funded by the National Key R&D Program of China (Grant No. 2021YFC3200403, No. 2021YFC3200401, No. 2023YFB2604700), Water conservancy youth talent development funding project (Grant No. Qs222014), and Sichuan Science and Technology Program (Grant No. 2022YFS0467).
Institutional Review Board Statement
Not applicable.
Informed Consent Statement
Not applicable.
Data Availability Statement
The data presented in this study are available on request from the corresponding author.
Acknowledgments
We express our sincere gratitude to the Yangzhong Base of Jiangsu Provincial Freshwater Fisheries Research Institute for providing us with the experimental site, materials, and technical support essential to the success of our research. Additionally, we would like to extend our heartfelt appreciation to Wenliang Wu, Ming Feng, Houliang Lu, Jie Li, and other individuals who generously assisted us during the experiment and writing process.
Conflicts of Interest
The authors declare no conflicts of interest.
References
- Coutant, C.C.; Whitney, R.R. Fish Behavior in Relation to Passage through Hydropower Turbines: A Review. Trans. Am. Fish. Soc. 2000, 129, 351–380. [Google Scholar] [CrossRef]
- Odeh, M.; Noreika, J.F.; Haro, A. Evaluation of the Effects of Turbulence on the Behavior of Migratory Fish, Final Report 2002; Bonneville Power Administration (BPA): Portland, OR, USA, 2002. [Google Scholar]
- Duan, J.G. Mean Flow and Turbulence around a Laboratory Spur Dike. J. Hydraul. Eng. 2009, 135, 803–811. [Google Scholar] [CrossRef]
- Quaranta, E.; Katopodis, C.; Revelli, R.; Comoglio, C. Turbulent flow field comparison and related suitability for fish passage of a standard and a simplified low-gradient vertical slot fishway. River Res. Appl. 2017, 33, 1295–1305. [Google Scholar] [CrossRef]
- Deng, Y.; Cao, M.; Ma, A.; Hu, Y.; Chang, L. Mechanism study on the impacts of hydraulic alteration on fish habitat induced by spur dikes in a tidal reach. Ecol. Eng. 2019, 134, 78–92. [Google Scholar] [CrossRef]
- Ye, F.; Zhang, J. Fish Ecology; Guangdong Higher Education Press: Guangzhou, China, 2002. [Google Scholar]
- Killgore, K.J.; Maynord, S.T.; Chan, M.D.; Morgan, R.P. Evaluation of Propeller-Induced Mortality on Early Life Stages of Selected Fish Species. N. Am. J. Fish. Manag. 2001, 21, 947–955. [Google Scholar] [CrossRef]
- Čada, G.F. The Development of Advanced Hydroelectric Turbines to Improve Fish Passage Survival. Fisheries 2001, 26, 14–23. [Google Scholar] [CrossRef]
- Morgan, R.P.; Ulanowicz, R.E.; Rasin, V.J.; Noe, L.A.; Gray, G.B. Effects of Shear on Eggs and Larvae of Striped Bass, Morone saxatilis, and White Perch, M. americana. Trans. Am. Fish. Soc. 1976, 105, 149–154. [Google Scholar] [CrossRef]
- Zeng, Z.; Guo, B.; Li, X.; Fu, X.; Chen, Y.; Wu, H.; Zhang, L.; Chen, J.; Ding, S. A simple and smart AND-gate DNA nanoprobe for correlated enzymes tracking and cell-selective imaging. Biosens. Bioelectron. 2022, 217, 114724. [Google Scholar] [CrossRef]
- Fedorenko, A.; Fraiser, F. Review of Grass Carp Biology. Fisheries and Marine Service Technical Rep No.786; Fisheries and Marine Serice: Vancouver, BC, Canada, 1978. [Google Scholar]
- Garcia, T.; Murphy, E.A.; Jackson, P.R.; Garcia, M.H. Application of the FluEgg model to predict transport of Asian carp eggs in the Saint Joseph River (Great Lakes tributary). J. Great Lakes Res. 2015, 41, 374–386. [Google Scholar] [CrossRef]
- Embke, H.S.; Kocovsky, P.M.; Garcia, T.; Mayer, C.M.; Qian, S.S. Modeling framework to estimate spawning and hatching locations of pelagically spawned eggs. Can. J. Fish. Aquat. Sci. 2019, 76, 597–607. [Google Scholar] [CrossRef]
- Jennings, D.P. Bighead Carp (Hypophthalmichthys nobilis): Biological Synopsis; Fish and Wildlife Service, US Department of the Interior: Washington, DC, USA, 1988; Volume 88, No. 29. [Google Scholar]
- Chapman, D.C. Early Development of Four Cyprinids Native to the Yangtze River, China. USGS Prof. Pap. 2006, 239, 1–51. [Google Scholar] [CrossRef]
- Yi, Y.; Wang, Z.; Yang, Z. Impact of the Gezhouba and Three Gorges Dams on habitat suitability of carps in the Yangtze River. J. Hydrol. 2010, 387, 283–291. [Google Scholar] [CrossRef]
- Deng, Y. Mechanism Study on the Impacts of Flow on Fish Living Environment around Spur Dikes in a Tidal Reach. Ph.D. Thesis, Hohai University, Nanjing, China, 2020. [Google Scholar]
- Albrecht, A.B. Some observations on factors associated with survival of striped bass eggs and larvae. Calif. Fish Game 1964, 50, 100–113. [Google Scholar]
- Conover, G.; Simmonds, R.; Whalen, M. Management and Control Plan for Bighead, Black, Grass, and Silver Carps in the United States; Asian Carp Working Group, Aquatic Nuisance Species Task Force: Washington, DC, USA, 2007; p. 223. [Google Scholar]
- Murphy, E.A.; Jackson, P.R. Hydraulic and water-quality data collection for the investigation of Great Lakes tributaries for Asian carp spawning and egg-transport suitability. In U.S. Geological Survey Scientific Investigations Report 2013–5106; U.S. Geological Survey: Sunrise Valley Drive Reston, VA, USA, 2013; p. 30. [Google Scholar] [CrossRef]
- George, A.E.; Chapman, D.C. Embryonic and larval development and early behavior in grass carp, Ctenopharyngodon idella: Implications for recruitment in rivers. PLoS ONE 2015, 10, e0119023. [Google Scholar] [CrossRef]
- Liu, M.; Lin, J.; Peng, Q.; Yu, L.; Chen, D.; Liu, S.; Duan, X. Relationship between the Distribution of Broodstock and Vorticity of Spawning Grounds of Four Major Chinese Carps in the Middle Reaches of the Yangtze River during Ecological Operation of the Three Gorges Dam. Water 2018, 10, 1487. [Google Scholar] [CrossRef]
- Prada, A.F.; George, A.E.; Stahlschmidt, B.H.; Chapman, D.C.; Tinoco, R.O. Survival and drifting patterns of grass carp eggs and larvae in response to interactions with flow and sediment in a laboratory flume. PLoS ONE 2018, 13, e0208326. [Google Scholar] [CrossRef]
- Ruggles, C.P. A Review of the Downstream Migration of Atlantic Salmon; Govemment of Canada Fisheries and Oceans: Halifax, NS, Canada, 1980. [Google Scholar]
- Ruggles, C.P.; Murray, D.G. A Review of Fish Response to Spillways; Govemment of Canada Fisheries and Oceans: Halifax, NS, Canada, 1983. [Google Scholar]
- Čada, G.F.; Coutant, C.C.; Whitney, R.R. Development of Biological Criteria for the Design of Advanced Hydropower Turbines; EERE Publication and Product Library: Washington, DC, USA, 1997. [Google Scholar]
- Čada, G.; Carlson, T.; Ferguson, J.; Richmond, M.; Sale, M. Exploring the Role of Shear Stress and Severe Turbulence in Downstream Fish Passage. In Proceedings of the Waterpower Conference, Las Vegas, NV, USA, 6–9 July 1999; pp. 1–9. [Google Scholar] [CrossRef]
- Pracheil, B.M.; DeRolph, C.R.; Schramm, M.P.; Bevelhimer, M.S. A fish-eye view of riverine hydropower systems: The current understanding of the biological response to turbine passage. Rev. Fish Biol. Fish. 2016, 26, 153–167. [Google Scholar] [CrossRef]
- Maynord, S.T. Concentric Cylinder Experiments of Shear Mortality of Eggs and Larval Fish.Upper Mississippi River-Illinois Waterway, Environmental Report; U.S. Army Engineer Research and Development Center: Vicksburg, MS, USA, 2000. [Google Scholar]
- Prada, A.F.; George, A.E.; Stahlschmidt, B.H.; Jackson, P.R.; Chapman, D.C.; Tinoco, R.O. Influence of turbulence and in-stream structures on the transport and survival of grass carp eggs and larvae at various developmental stages. Aquat. Sci. 2019, 82, 16. [Google Scholar] [CrossRef]
- Hockley, F.A.; Wilson, C.A.; Brew, A.; Cable, J. Fish responses to flow velocity and turbulence in relation to size, sex and parasite load. J. R. Soc. Interface 2014, 11, 20130814. [Google Scholar] [CrossRef]
- Goettel, M.T.; Atkinson, J.F.; Bennett, S.J. Behavior of western blacknose dace in a turbulence modified flow field. Ecol. Eng. 2015, 74, 230–240. [Google Scholar] [CrossRef]
- Suga, N. Change of the Toughness of the Chorion of Fish Eggs. Embryologia 1963, 8, 63–74. [Google Scholar] [CrossRef]
- Prada Sepulveda, A.F. The Effect of Turbulence on Survival, Dispersal, and Swimming Behavior of Grass Carp Eggs and Larvae. Ph.D. Thesis, University of Illinois at Urbana-Champaign, Urbana, IL, USA, 2020. [Google Scholar]
- Song, X.; Xu, G. Research progress on reproductive biology of Squaliobarbus curriculus. Hebei Fish. 2007, 06, 6–8+49+53. [Google Scholar]
- Silva, A.T.; Katopodis, C.; Santos, J.M.; Ferreira, M.T.; Pinheiro, A.N. Cyprinid swimming behaviour in response to turbulent flow. Ecol. Eng. 2012, 44, 314–328. [Google Scholar] [CrossRef]
- Srdic, A.; Fernando, H.J.S.; Montenegro, L. Generation of nearly isotropic turbulence using two oscillating grids. Exp. Fluids 1996, 20, 395–397. [Google Scholar] [CrossRef]
- Hu, J. Hydraulic Characteristics of a New Permeable Spur Dike and Its Effect on Fish Behavior. Ph.D. Thesis, Chongqing Jiaotong University, Chongqing, China, 2021. [Google Scholar]
- Yang, S. River Dynamic Characteristics and Pattern Discriminant Method Influenced by Riparian Vegetation. Ph.D. Thesis, Tianjin University, Tianjin, China, 2019. [Google Scholar]
- Marriner, B.A.; Baki, A.B.M.; Zhu, D.Z.; Thiem, J.D.; Cooke, S.J.; Katopodis, C. Field and numerical assessment of turning pool hydraulics in a vertical slot fishway. Ecol. Eng. 2014, 63, 88–101. [Google Scholar] [CrossRef]
- Maeda, S.; Yoshida, K.; Kuroda, H. Turbulence and energetics of fish nest and pool structures in agricultural canal. Paddy Water Environ. 2018, 16, 493–505. [Google Scholar] [CrossRef]
- Zhou, Z.; Wang, J. Numerical Modeling of 3D Flow Field among a Compound Stilling Basin. Math. Probl. Eng. 2019, 2019, 1–17. [Google Scholar] [CrossRef]
- Lancaster, J.; Hildrew, A.G. Characterizing In-stream Flow Refugia. Can. J. Fish. Aquat. Sci. 1993, 50, 1663–1675. [Google Scholar] [CrossRef]
- Costa, J.E. Hydraulics and basin morphometry of the largest flash floods in the conterminous United States. J. Hydrol. 1987, 93, 313–338. [Google Scholar] [CrossRef]
- George, A.E.; Garcia, T.; Chapman, D.C. Comparison of Size, Terminal Fall Velocity, and Density of Bighead Carp, Silver Carp, and Grass Carp Eggs for Use in Drift Modeling. Trans. Am. Fish. Soc. 2017, 146, 834–843. [Google Scholar] [CrossRef]
- Yamagami, K. Mechanisms of Hatching in Fish: Secretion of Hatching Enzyme and Enzymatic Choriolysis. Am. Zool. 1981, 21, 459–471. [Google Scholar] [CrossRef]
- Torby, B.J.; Saunders, H. Advanced Dynamics For Engineers. J. Vib. Acoust. 1988, 110, 124–125. [Google Scholar] [CrossRef]
- Wen, X.; Feng, H.; Li, W.; Zhang, Y.; Zhang, R. Observation on early embryonic development of grass carp. Chin. J. Vet. Sci. 1991, 1, 90–171. [Google Scholar] [CrossRef]
- Hurley, N.M., Jr. Transport Simulation of Striped Bass Eggs in the Congaree, Wateree, and Santee Rivers, South Carolina. Water-Resources Investigations Report 91-4088; U.S. Geological Survey: Sunrise Valley Drive Reston, VA, USA, 1991. [Google Scholar]
- Mansueti, R.J. Eggs, Larvae, and Young of the White Perch, Roccus americanus, with Comments on Its Ecology in the Estuary. Chesap. Sci. 1964, 5, 3–45. [Google Scholar] [CrossRef]
- Fraysse, B.; Mons, R.; Garric, J. Development of a zebrafish 4-day embryo-larval bioassay to assess toxicity of chemicals. Ecotoxicol. Environ. Saf. 2006, 63, 253–267. [Google Scholar] [CrossRef]
- Helvik, J.V.; Oppen-Berntsen, D.O.; Flood, P.R.; Walther, B.T. Morphogenesis of the hatching gland of Atlantic halibut (Hippoglossus hippoglossus). Rouxs. Arch. Dev. Biol. 1991, 200, 180–187. [Google Scholar] [CrossRef]
- Melby, A.E.; Warga, R.M.; Kimmel, C.B. Specification of cell fates at the dorsal margin of the zebrafish gastrula. Development 1996, 122, 2225–2237. [Google Scholar] [CrossRef]
- Inohaya, K.; Yasumasu, S.; Yasumasu, I.; Iuchi, I.; Yamagami, K. Analysis of the origin and development of hatching gland cells by transplantation of the embryonic shield in the fish, Oryzias latipes. Dev. Growth Differ. 1999, 41, 557–566. [Google Scholar] [CrossRef]
- Hiroi, J.; Yasumasu, S.; Kawazu, K.; Kaneko, T. Hatching enzymes in the Japanese eel. Eel. Biol. 2003, 31, 445–456. [Google Scholar] [CrossRef]
- Rosenthal, H.; Iwai, T. Hatching glands in herring embryos. Mar. Ecol. Prog. Ser. 1979, 1, 123–127. [Google Scholar] [CrossRef]
- Rechulicz, J. Incubation temperature effects on the development of hatching gland cells in ide, Leuciscus idus [L.]. Electron. J. Pol. Agric. Univ. Ser. Fish. 2001, 4, 3. [Google Scholar]
- Ostaszewska, T. Hatching gland clls in embryos of pikeperch (Stizostedion lucioperca). Ann. Wars. Agric. Univ. Anim. Sci. 1989, 24, 3–5. [Google Scholar]
- Garcia, T.; Jackson, P.R.; Murphy, E.A.; Valocchi, A.J.; Garcia, M.H. Development of a Fluvial Egg Drift Simulator to evaluate the transport and dispersion of Asian carp eggs in rivers. Ecol. Model. 2013, 263, 211–222. [Google Scholar] [CrossRef]
- Li, G.; Wang, B.; Elliott, C.M.; Call, B.C.; Chapman, D.C.; Jacobson, R.B. A three-dimensional Lagrangian particle tracking model for predicting transport of eggs of rheophilic-spawning carps in turbulent rivers. Ecol. Model. 2022, 470, 110035. [Google Scholar] [CrossRef]
Figure 1.
The main experimental equipment diagram, including ADV system, net cage, and transverse-oscillating-grids turbulence tank (left), and its overall structure diagram (right). In the right structure diagram, 1 is the water tank, 2 is the grids, 3 is the 1100 W horizontal motor, 4 is the ADV frame, 5 is the grids bar, 6 is the grids hole, 7 is the transmission device, 8 is the cover plate, 9 is the F-shaped woodworking clamp, and 10 is the net cage.
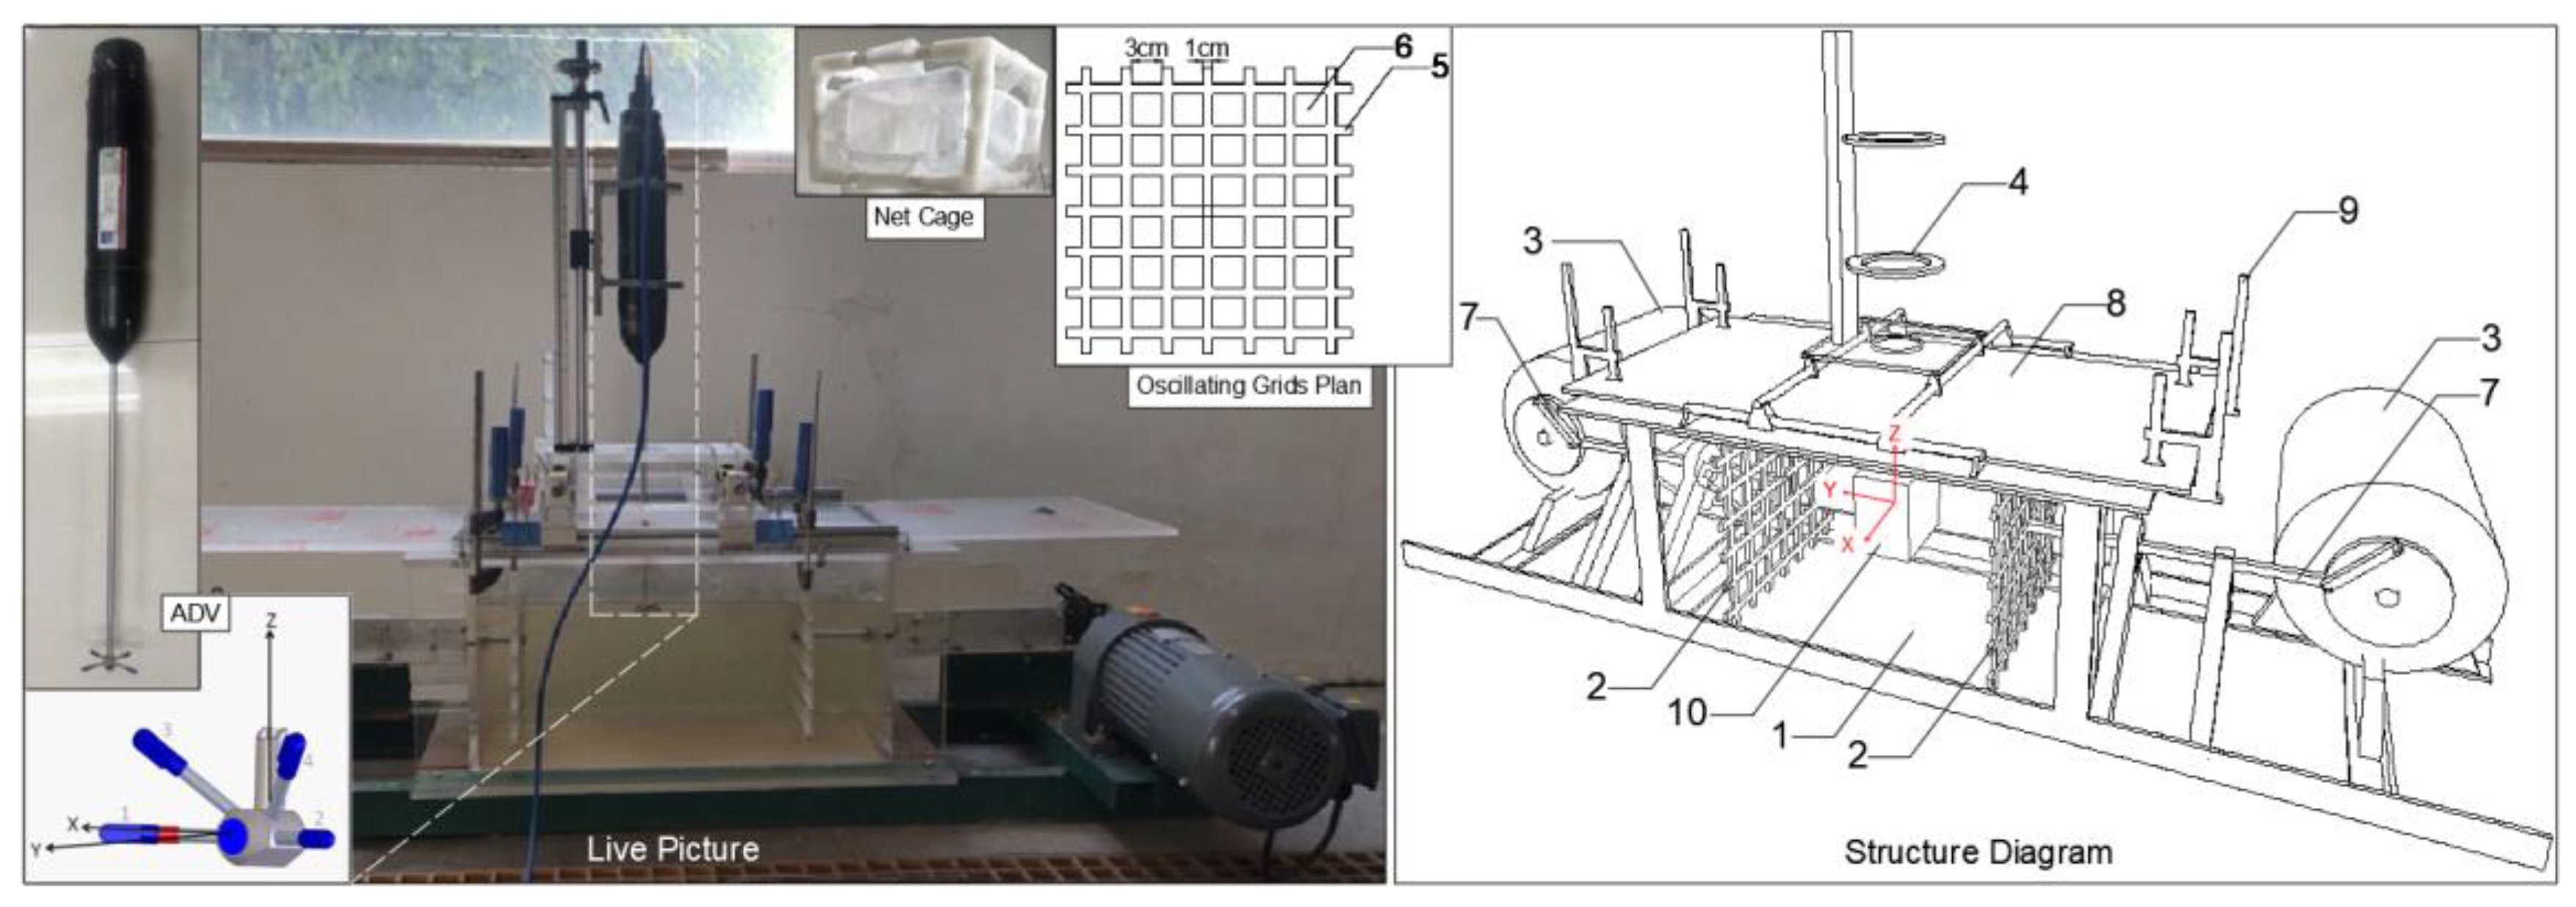
Figure 2.
The tank layout, front view (mm). The tank has dimensions of 550 mm in length and 300 mm in height. Within the tank, two oscillating grids are present. The vibration center is positioned 100 mm away from the side wall, and the stroke is 100 mm. The net cage is centrally located in the tank, with its bottom situated 70 mm above the tank’s bottom. The measuring point and line are depicted in green color.
Figure 3.
(a) Vertical distribution of k at various f without the cage (measuring line in Figure 2). (b) Comparison of k under different f without cage and with cage (measuring point in Figure 2). k is employed as an illustrative example to characterize the turbulent environment in the tank.
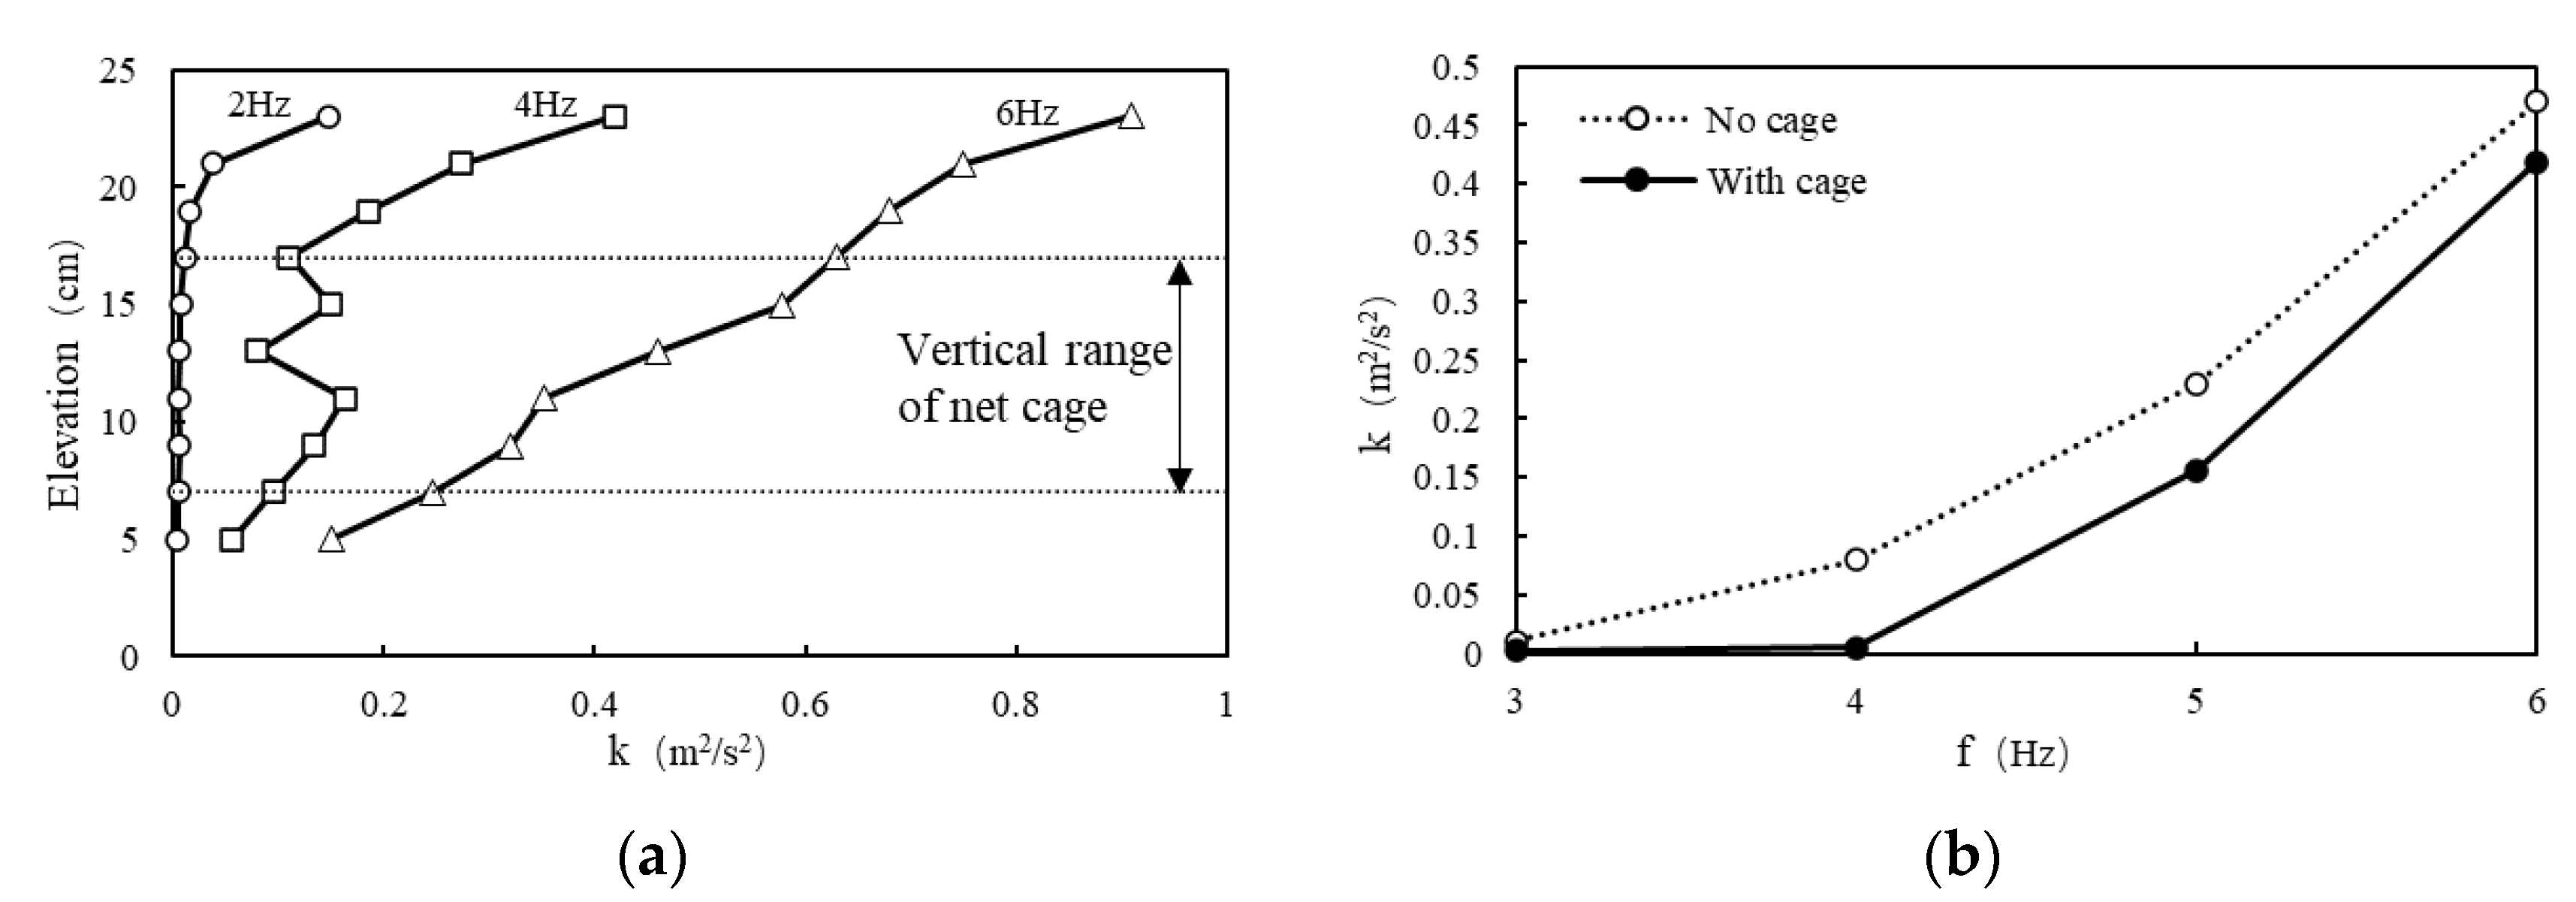
Figure 4.
Sperms, oocytes, fish eggs (taking the first experiment as an example), and hatching barrel of S. curriculus.
Figure 4.
Sperms, oocytes, fish eggs (taking the first experiment as an example), and hatching barrel of S. curriculus.

Figure 5.
The changes in egg diameter and hydrostatic settling velocity of S. curriculus during embryonic period (taking the first experiment as an example). The abscissa T represents the fish egg developmental stage, calculated as the ratio of time since fertilization to the total time for over 95% of eggs to hatch (dimensionless to account for temperature effects). T = 0 marks insemination, and T = 1 is the total hatching time. Measurements of egg diameter and settling velocity were taken randomly from five eggs each time. Initial hourly measurements (before 0.056 T) occurred every 10 min due to noticeable changes, followed by gradually increasing intervals as parameters stabilized.
Figure 6.
The variations in P(blank), P(experiment), and P0 with respect to T. The black horizontal arrow measures the time interval between the blank control group and the data of the two repeated typical groups at the same P0. Use Data 1 and Data 2 to distinguish between the results of the two experiments.
Figure 7.
The trend variations of P0 with respect to T and the corresponding Equation (3). The red dashed line represents the fitting curve of the four P0 datasets.
Figure 7.
The trend variations of P0 with respect to T and the corresponding Equation (3). The red dashed line represents the fitting curve of the four P0 datasets.
Figure 8.
The variation trends of P with respect to FTCs (a) and TA (b) at different stages of fish egg development (T).
Figure 8.
The variation trends of P with respect to FTCs (a) and TA (b) at different stages of fish egg development (T).
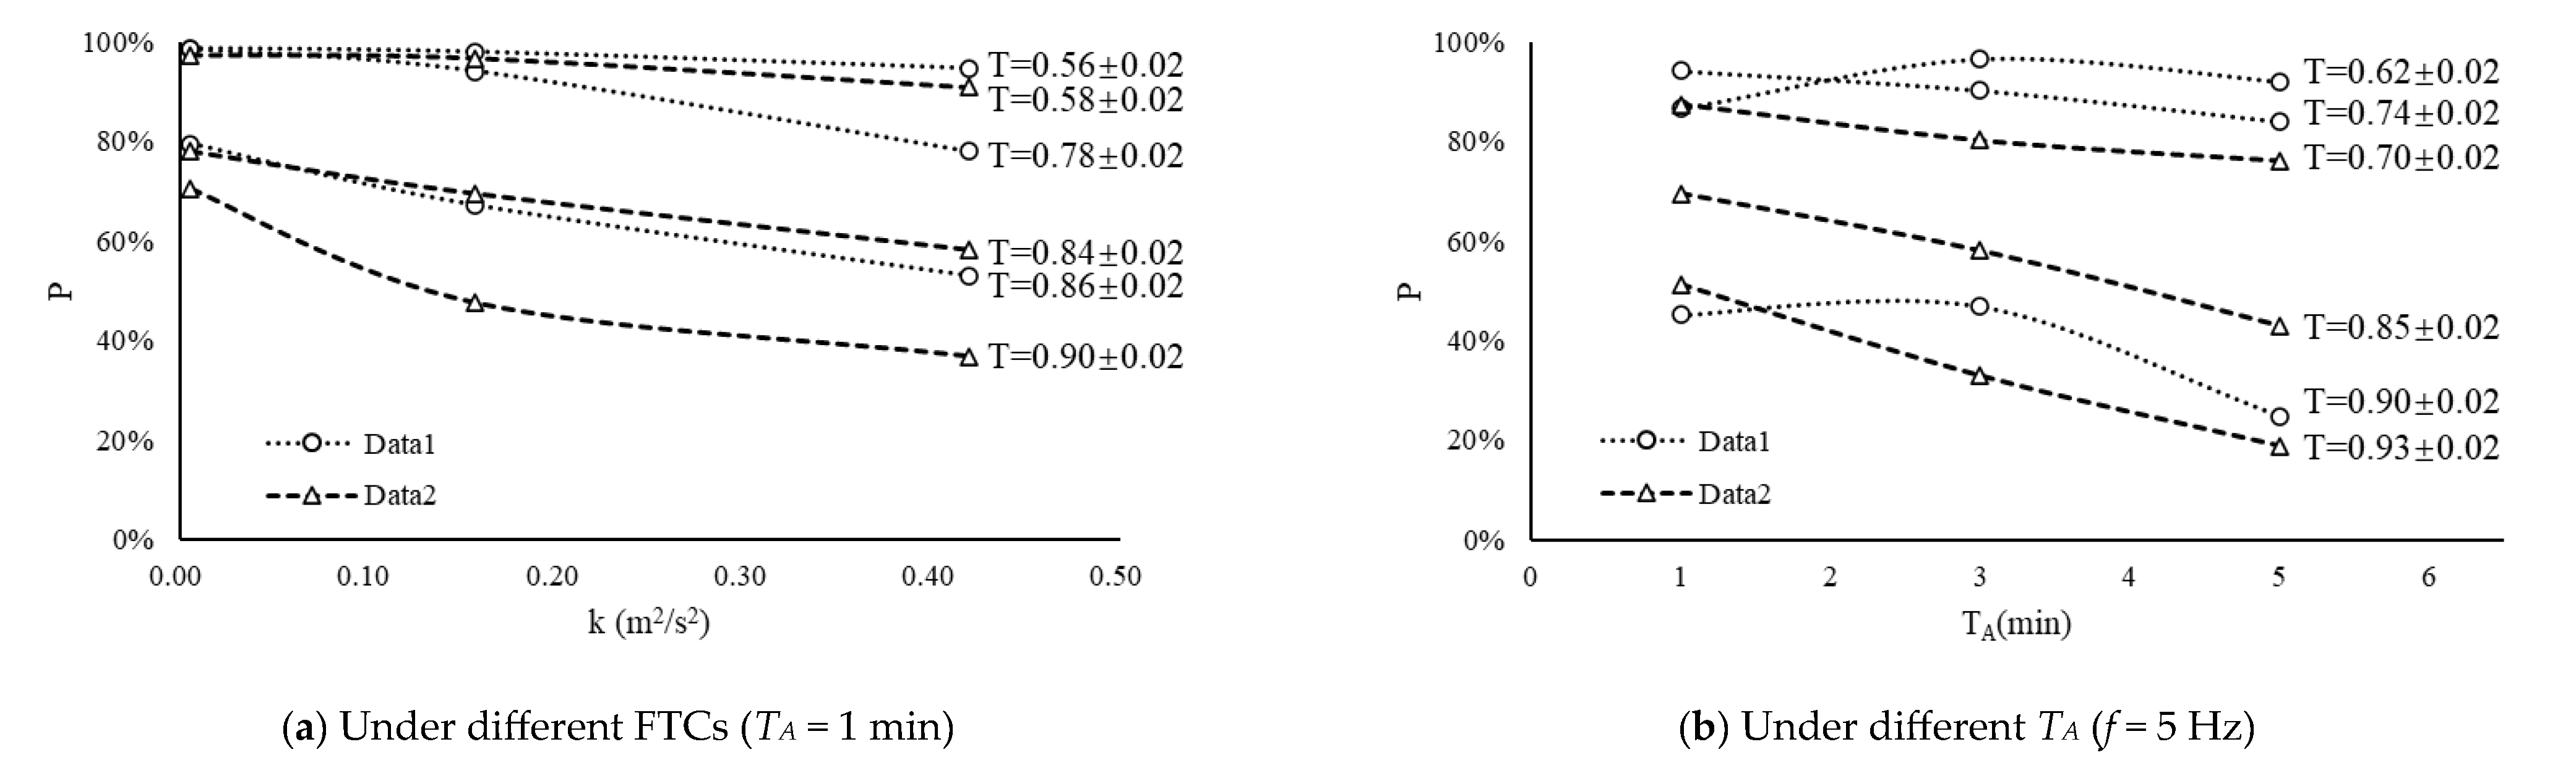
Figure 9.
P variation according to Ak (a) and Aτ (b). The red dotted line in the two figures is P0 under the action of the typical FTC. The blue triangle data points, green circular data points, and yellow square data points in the two figures were measured at the developmental stages of 0 < T ≤ 0.65, 0.65 < T ≤ 0.80 and 0.80 < T ≤ 1, respectively. Blue, green, and yellow dotted lines are the fitting lines of these data points. The blue, green, and yellow regions are the p values corresponding to any action at the above development stage. The upper and lower boundaries of the blue, green, and yellow regions are straight lines with the same slope as the dotted lines of the respective regions through P0 = 1, P0 = 0.9, through P0 = 0.9, P0 = 0.8, and through P0 = 0.8, P0 = 0.5, respectively.
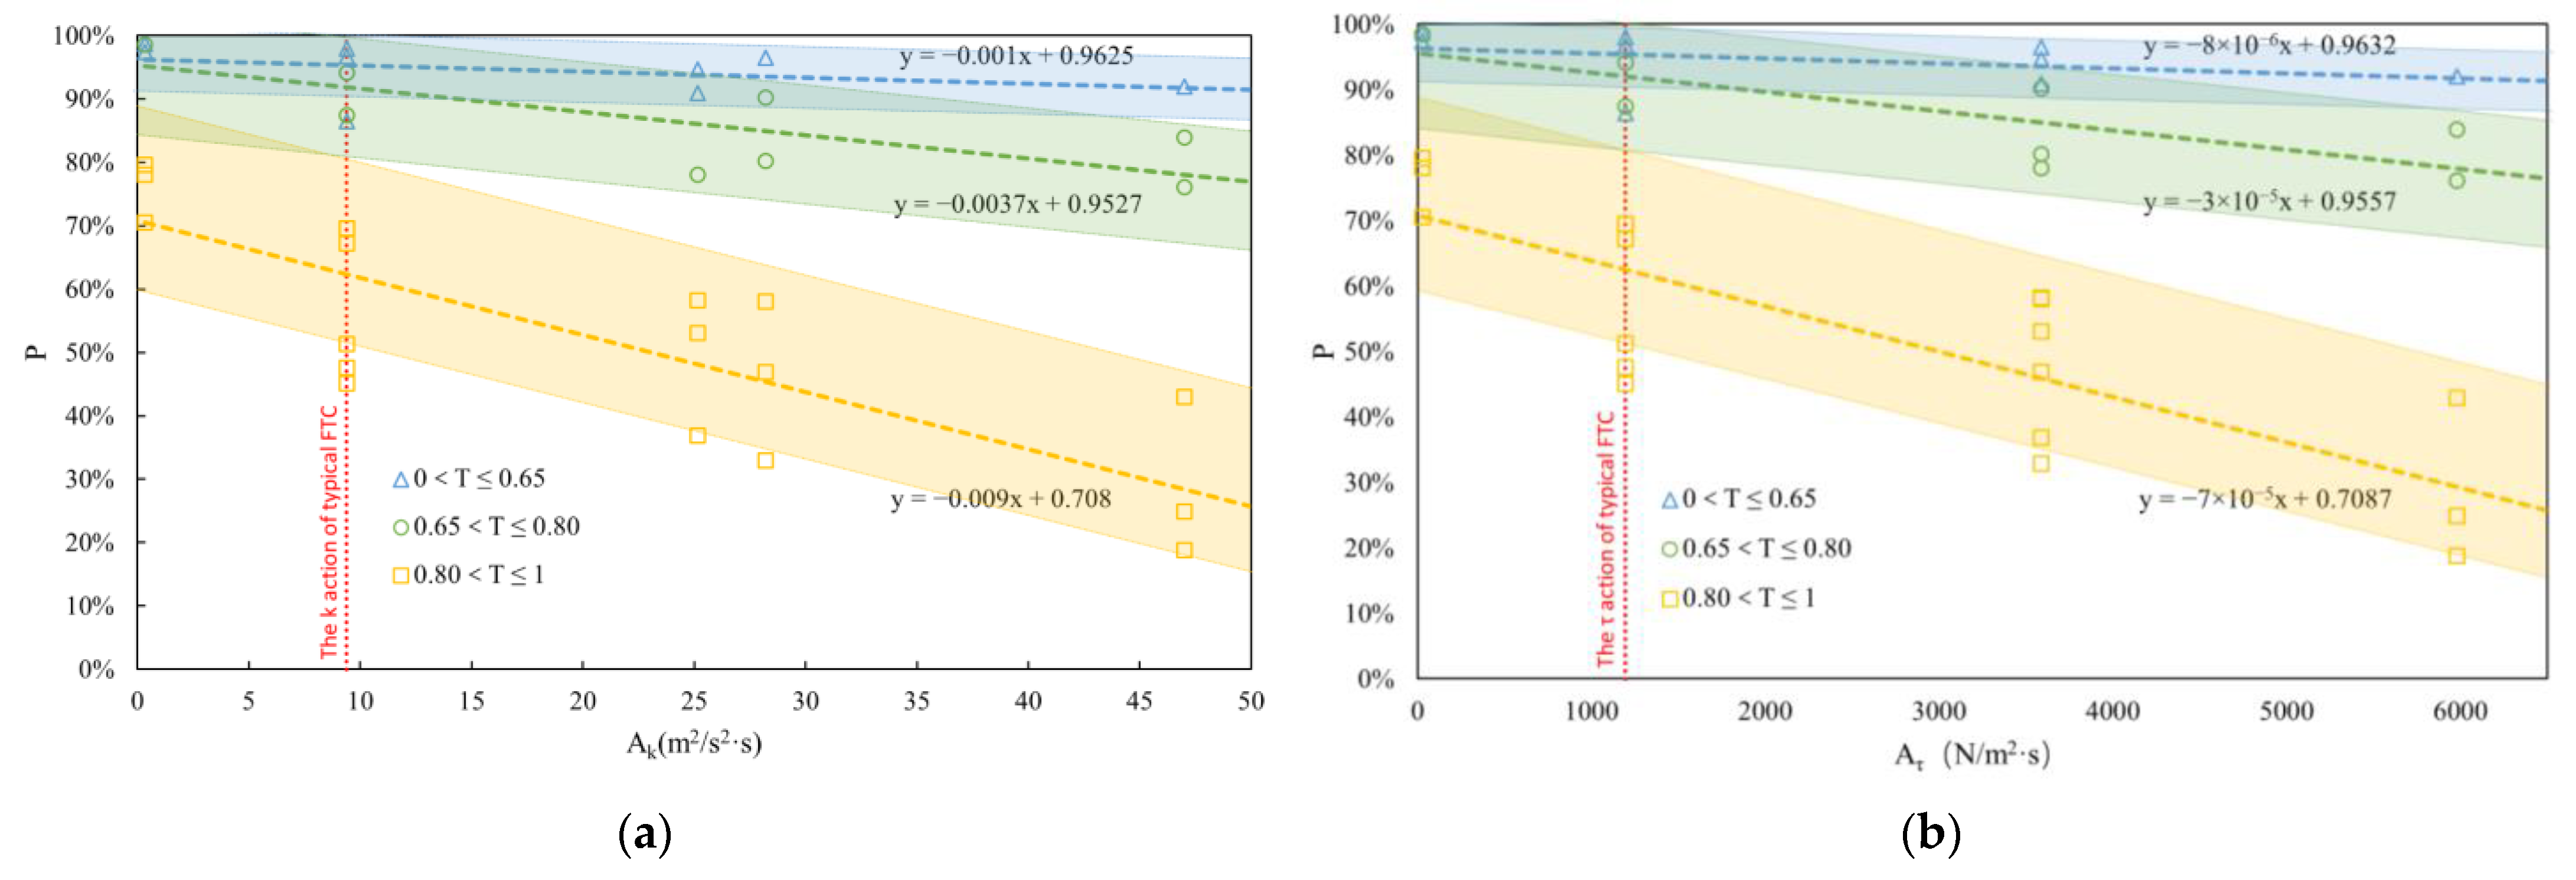
Figure 10.
The comparison between the results of this work and those of others. The blue, green, and yellow data points and blocks represent the achievements of this work, which were derived from the volume changes of S. curriculus eggs measured in graduated cylinders before and after experimentation to estimate the probability of normal development. The black dashed lines are the regression equation curves obtained by Morgan et al. using striped bass eggs and white perch eggs as experimental subjects (TA is represented by different curves ranged from 1 to 20 min). The red data points (including circles, triangles, diamonds, and squares, representing different TA of 10 s, 20 s, 80 s, and 320 s) were obtained by Prada et al. using Grass carp eggs as experimental subjects. The time of black and red in the figure is TA during the experiments (such as 10 s, 1 min, etc.) [9,34].

Table 1.
Summary of main experimental equipment.
| Experimental Equipment | Size (cm) (l × w × h) | Main Usage |
|---|---|---|
| Transverse-oscillating-grids turbulence tank | 55 × 30 × 30 | Used to quantitatively generate the FTCs (abbreviation of flow turbulence conditions) required for the experiment. |
| ADV system | / | Used to calibrate the FTCs in the tank. |
| Net cage | 10 × 7× 10 | Used to limit the drift range of the eggs, prevent the mechanical collision caused by the oscillating grids to the eggs, and facilitate the collection of statistics. |
Table 2.
Fertilization statistics of two experiments.
| Experiment | The First Experiment | The Second Experiment | ||||
|---|---|---|---|---|---|---|
| Insemination time | 31 August 2022 22:27 | 2 September 2022 21:00 | ||||
| Water temperature | 26 (±0.5) °C | 26.5 (±0.5) °C | ||||
| Parental attributes | Length cm | Width cm | Weight kg | Length cm | Width cm | Weight kg |
| Male fish 1 | 31 | 10 | 0.38 | 27 | 7 | 0.32 |
| Male fish 2 | 28 | 9 | 0.35 | 32 | 10 | 0.37 |
| Female fish 1 | 27 | 6 | 0.32 | 28 | 7 | 0.33 |
| Female fish 2 | 33 | 7 | 0.39 | 30 | 8 | 0.37 |
| Fertilization rate | >95% | >95% | ||||
| Hatching duration | 18.5 (±0.5) h | 18.2 (±0.5) h | ||||
Table 3.
Experimental conditions.
| Experimental Conditions | f (Hz) | TA (min) | Remark |
|---|---|---|---|
| 0 | 0 | 0 | The blank group: Stillwater environment. Used to eliminate the influence generated by the experimental procedure. |
| 1 | 5 | 1 | Typical group intervals: 0.5–2 h, increasing frequency nearing hatching, covering entire fish egg development. |
| 2 | 4 | 1 | 1. Standard group initiation at P0 ≈ 75%. 2. Standard group intervals: 1–2 h, repeated three times. |
| 3 | 5 | 1 | |
| 4 | 6 | 1 | |
| 5 | 5 | 3 | |
| 6 | 5 | 5 |
Table 4.
The comparison table of experimental conditions between others and this work.
| Reference | Experimental Equipment | Fish Egg Traits | Water Temp. (°C) | Experimental Conditions | |||||
|---|---|---|---|---|---|---|---|---|---|
| τ (N/m2) | TA | ||||||||
| Species | Property | Egg Diameter (mm) | Specific Gravity | Developmental Stage | |||||
| Morgan et al. (1976) [9] | Three-layer rotatable barrel | Striped bass 1 | Drifting eggs | 3.5 ± 0.5 | 1.00115 | Not mentioned | Not mentioned | 7.6–40.4 | 1–20 min |
| White perch | Sticky eggs | 0.9 ± 0.2 | High specific gravity | ||||||
| Prada et al. (2020) [34] | Oscillating-grid stirred turbulence tank | Grass carp | Drifting eggs | 4.5 ± 0.6 | 1.00210 | Water-hardened eggs | 23–24 | 0–40 | 10–320 s |
| This work | Transverse-oscillating-grid turbulence tank | S. curriculus | Drifting eggs | 4.2 ± 0.4 | 1.00101 | Entire embryonic period | 26–27 | 0.4–59.8 | 1–5 min |
Disclaimer/Publisher’s Note: The statements, opinions and data contained in all publications are solely those of the individual author(s) and contributor(s) and not of MDPI and/or the editor(s). MDPI and/or the editor(s) disclaim responsibility for any injury to people or property resulting from any ideas, methods, instructions or products referred to in the content. |
© 2024 by the authors. Licensee MDPI, Basel, Switzerland. This article is an open access article distributed under the terms and conditions of the Creative Commons Attribution (CC BY) license (https://creativecommons.org/licenses/by/4.0/).
Share and Cite
MDPI and ACS Style
Wei, Y.; Ma, A.; Deng, Y.; Cao, M.; Hu, Y.; Cheng, Z.; Zhu, L. Effects of Flow Turbulence on the Entire Development Process of Drifting Fish Eggs. Fishes 2024, 9, 88. https://doi.org/10.3390/fishes9030088
AMA Style
Wei Y, Ma A, Deng Y, Cao M, Hu Y, Cheng Z, Zhu L. Effects of Flow Turbulence on the Entire Development Process of Drifting Fish Eggs. Fishes. 2024; 9(3):88. https://doi.org/10.3390/fishes9030088
Chicago/Turabian StyleWei, Yuchong, Aixing Ma, Ya Deng, Minxiong Cao, Ying Hu, Zhaoyi Cheng, and Lijun Zhu. 2024. "Effects of Flow Turbulence on the Entire Development Process of Drifting Fish Eggs" Fishes 9, no. 3: 88. https://doi.org/10.3390/fishes9030088