
Population Genetic Differentiation of Walleye (Sander vitreus) across the Eastern Highlands of the United States


1
Department of Fish and Wildlife Conservation, Virginia Polytechnic Institute and State University, Blacksburg, VA 24061, USA
2
Virginia Department of Wildlife Resources, 1132 Thomas Jefferson Road, Forest, VA 24551, USA
3
Department of Vertebrate Zoology, National Museum of Natural History, Smithsonian Institution, Washington, DC 20017, USA
*
Author to whom correspondence should be addressed.
Fishes 2024, 9(1), 15; https://doi.org/10.3390/fishes9010015
Submission received: 1 November 2023
/
Revised: 21 December 2023
/
Accepted: 27 December 2023
/
Published: 29 December 2023
(This article belongs to the Special Issue Molecular Ecology and Genetic Diversity of Fish)
Abstract
:Walleye is an important sportfish across eastern North America, is commercially fished in the Laurentian Great Lakes region, and has been introduced outside its native range. Thirty-eight Walleye populations within six watersheds across the Eastern Highlands and other portions of the native range were screened at eight microsatellite DNA loci to better understand evolutionary history and to inform fishery management and conservation efforts. Population genetic variation showed divergent assemblages of populations, respectively, living in the Mobile Bay, Mississippi River, Eastern Highlands (Tennessee, New, and Ohio Rivers), and Great Lakes drainages today. All estimates of effective numbers of breeding individuals were under 25, and all populations within all watersheds had ~15–20% inter-individual relatedness, likely attributable to the effects of both natural demographic processes and stocking. The extent of Eastern Highlands Walleye includes both the Ohio and Tennessee River basins.
Keywords:
population genetics; fishery management; conservation; microsatellite DNA; Eastern HighlandsKey Contribution: Knowledge of regional population genetic structuring informs management agencies of this important fished species. Translocation of Walleye across population genetic boundaries should be avoided in order to conserve regionally important adaptations.
1. Introduction
Walleye, Sander vitreus (Mitchell 1818), is a valued sport and commercially harvested fish that is widely distributed across eastern North America. As with many widely distributed species, genetic differentiation has arisen over time among populations across the geographic range. Analysis of mitochondrial DNA variation across the range [1,2] showed regional differentiation among stocks descended from populations in three glacial refugia (northwest, east, and lower Mississippi drainage) that recolonized deglaciated North America and that are currently in secondary contact. Unique lineages have been identified in the Tombigbee and Mobile rivers of Alabama [3,4,5,6]. Multiple differentiated populations of Walleye inhabit Lake Erie and adjacent waters, as shown by microsatellite DNA markers [7,8,9]. Using microsatellite DNA markers, Stepien et al. [10,11] showed differentiation among populations of Walleye from watersheds across the Laurentian Great Lakes, Lake Winnipeg (MB, Canada), upper Mississippi River, Ohio River, and Mobile Bay drainage. Using SNP markers, Euclide et al. [12] showed differentiation among Walleye populations in the Great Lakes region.
Walleye in the southeastern part of the range are of particular interest because they may represent the direct descendants of a distinct glacial refugial population and are adapted to spawn in flowing waters [13]. Screening mitochondrial and nuclear DNA markers, Billington and Sloss [14] and White et al. [15] showed the apparent persistence of what came to be termed Eastern Highlands walleye in the upper Cumberland River drainage (Kentucky), within the tributary Rockcastle River (Kentucky), and the Kanawha River (West Virginia) in the Ohio River drainage. Observation of distinct mitochondrial haplotypes or microsatellite alleles in Walleye collected from the upper Ohio River [16] and the upper New River [17] suggested the presence of remnant native populations. Native walleye from the Cumberland River share a common ancestor with Walleye from other Eastern Highland Rivers but are more distantly related to populations from the Mobile River basin and the Great Lakes [15]. Although these studies applied highly variable genetic markers and a full range of analytic techniques, the coverage of sampling in the Eastern Highlands region was modest, limiting the ability to apply findings to Walleye management in a broad regional context.
A population is a group of individuals of a species occurring in a single area that shares a common gene pool and is significantly divergent from other groups. Knowledge of population genetic structure informs the management of Walleye for sport and commercial fisheries [18], for which conserving genetic diversity and local adaptation are priority issues [19]. Determining the population genetic structure of Walleye within the Eastern Highlands region of North America will increase knowledge of the natural history of the species, as this assemblage of population groups may represent the direct descendants of a distinct glacial refuge population and would inform fishery management strategies within the region. Baseline knowledge of which populations are genetically distinct can be applied to better define stocking and fishery management practices. The goal of this study was to characterize the population genetic differentiation of Walleye across the eastern United States, focusing on the Eastern Highlands, to provide a novel addition to what is currently known about variation across its range. After amassing a collection of Walleye that also included Missouri, Great Lakes, and other Eastern Highlands populations and screening highly polymorphic microsatellite DNA markers, we tested the following hypotheses: H0: There is no genetic structuring among walleye populations in the eastern United States; HA1: There is genetic structuring among walleye populations in the eastern United States that follows major watershed structure; and HA2: There is genetic structuring among Walleye populations that is driven by other processes. The results reported here support the hypothesis that population genetic structuring follows watershed structure.
2. Materials and Methods
2.1. Sampling
Walleye were sampled from 38 sites in six major watersheds by the Virginia Department of Wildlife Resources (VDWR), other fishery management agencies, or scientific collaborators (Table 1, Figure 1). Samples from Virginia, Kentucky, and North Carolina were collected explicitly for purposes of this study; other samples representing outgroups for comparison with Eastern Highlands walleye populations, some sampled years previously, were provided by colleagues. Noting that some of these samples may contain representatives of more than one population, due to natural processes as in the Great Lakes, or due to stocking as in the New River, Virginia, we refer to samples collected at the respective sites as population samples. All work was in accordance with collection permits issued by the Virginia Department of Wildlife Resources and Protocol 16-188FIW, approved by the Virginia Tech Institutional Animal Care and Use Committee on 1 November 2016. Fish were measured for total length, weighed, and sexed. Pectoral fin clips were taken non-lethally, dried in labeled scale envelopes, and frozen at −20 ℃. DNA was isolated from fin clips using the DNEasy Blood and Tissue Kit (Qiagen, Germantown, MD, USA).
2.2. Microsatellite Markers
Primer pairs for 19 microsatellite loci were amplified using published primer-pair sets [20,21,22,23] (Table S1). After preliminary screenings using these loci, we observed twelve polymorphic loci that amplified consistently. PCR reactions were performed in a T-100 thermal cycler (Bio-Rad Laboratories, Hercules, CA) in three multiplex suites [7,20,21,22]. The reaction master mixes and PCR protocols for each multiplex reaction are presented in Table S2. Total DNA concentrations ranged from 50 to 300 ng/µL. The amplified DNA fragments were subjected to electrophoresis through a 2% ethidium bromide TBE agarose gel to ascertain amplification. The reaction products were combined for fragment-size analysis in the suites described in Table 2 and Table S2, and amplification fragment sizes were estimated using an ABI 3730xl instrument at the Cornell University Institute of Biotechnology (Ithaca, NY, USA).
Microsatellite fragment sizes were scored using GeneMarker (SoftGenetics, College Park, PA, USA) and reevaluated by an independent worker. Samples that did not amplify or genotypes that were unclear were reanalyzed up to three separate times to produce as large and reliable a dataset as possible. All inconsistent results were removed from the dataset. Once all individuals were amplified at all 12 microsatellite loci, we retained data for eight loci that consistently yielded reliable results (Table 2) for use in population genetic analyses. Ultimately, our data set had genotypes for 1279 individuals at eight microsatellite loci.
2.3. Data Analysis
Preliminary data analyses were conducted iteratively, first with data including all 1679 individuals at all eight loci with null alleles (Table S3), next removing all data from loci with more than 70% missing data (5 loci and 1679 individuals), and finally with all 8 loci and removal of individuals missing data at 5 of 8 loci (with a final n = 1279 from across the entire range). We used Arlequin v. 3.5.2.2 [24] to test for linkage disequilibrium and deviations from Hardy–Weinberg equilibrium (HWE). Population genetic diversity was quantified as a proportion of polymorphic loci, allelic richness, and expected and observed heterozygosities. MicroChecker [25] was applied to determine the frequencies of genotypes, detect segregation, and estimate the frequencies of any null alleles. All analyses were screened using STRUCTURE version 2.3.4 [26] with a burn-in of 10,000 and an MCMC of 1000 iterations for values of K from 1 to 20 with 5 iterations. Since there were no major differences among results after removing loci with null alleles, we retained data for all eight loci and 1249 individuals from all six watersheds.
Population genetic diversity—quantified as the proportion of polymorphic loci; allelic richness; and expected and observed heterozygosities—was calculated using Arlequin. The possibility of recent population genetic bottlenecks was assessed using the m-ratio [27]. STRUCTURE [26], a Bayesian algorithm that uses a Markov chain Monte Carlo (MCMC) algorithm, was applied to assess the clustering of multilocus genotypes and to assign individuals to their most likely source cluster(s). STRUCTURE analyses were run both with and without data for loci with null alleles (that had frequencies over the threshold of 0.1) to assess the impact of inclusion or exclusion of those data. STRUCTURE runs included 100,000 iterations as burn-in and 100,000 MCMC iterations. STRUCTURE plots from these analyses were visualized using the CLUMPAK program [28]. The ancestry model assumed admixture with correlated allele frequencies. We applied two approaches to determine the best-supported number of clusters in the data. First, we used the mean LnP(D|K)—i.e., the highest likelihood of the data given the number of clusters reported in STRUCTURE output. Second, results were uploaded into Structure Harvester [29] to visualize the best-supported number of clusters across the collection of samples using the Evanno et al. [30] ΔK criterion. Arlequin was used to perform an Analysis of Molecular Variance (AMOVA) [31] and to quantify population differentiation as FST among the population clusters identified in the analysis of STRUCTURE results. AMOVA was applied to partition population differentiation into its underlying components, i.e., (1) within individuals, meaning heterozygosity; (2) among individuals within populations or groups, meaning heterozygote excess relative to Hardy–Weinberg expectations; and (3) among populations or groups, as non-local departures from Hardy–Weinberg expectations. NeEstimator [32] was used to estimate the effective population size of population samples using the linkage disequilibrium approach. The possibility of inbreeding was assessed by calculating the degree of deviation from Hardy–Weinberg equilibrium (HWE) in terms of Wright’s FIS coefficient using Arlequin and also by directly assessing relatedness among individuals using MLRelate [33]. The significance of departures of FIS values from zero was then tested by a randomization procedure implemented within MLRelate. To assess the significance of statistical test results, we adjusted the nominal α value of 0.05 using sequential Bonferroni adjustments [34] to determine the critically significant value of α = 0.00625.
3. Results
Population genetic analyses were executed at the range-wide scale and also at smaller scales, as presented below.
3.1. Range-Wide Analysis of Individual Population Samples
A first set of analyses considered the population genetic variation of Walleye across the full set of 38 population samples across six major watersheds (Table 1). Levels of within-population sample genetic variation differed (Table 3 and Table S4). The number of alleles per locus varied among population samples, and observed heterozygosity (HO) was almost always less than expected heterozygosity (HE). M-ratios were lower than the criterion value of 0.68 [28], suggesting the occurrence of recent population bottlenecks. Population samples with the highest m-ratios were Hatchet Creek, AL, USA (0.45) and Mille Lacs, MN, USA (0.48). Inbreeding coefficients (FIS) for individual population samples (Table 4) were all positive and greater than 0.10, with such small probabilities of a random FIS being greater than the observed FIS indicating that all values were significantly greater than zero. The smallest value, 0.10, was observed in the New River, which is a known mixed-ancestry population group and which has been subject to marker-assisted selection for the alleles characterizing the native stock [5,6,35]. All population samples had an estimated Ne of under 100 effective breeding individuals (Table 5). The population samples with the highest estimated Ne values were Lake Santeetlah, NC, USA (87.9), Fellows Lake, MO (68.7), and the Coosa drainage, AL, USA (63.1). Estimated Ne for all other population samples were under 20 effective breeding individuals, with Goose Creek, KY, USA (2.7), Lake Erie (1.9), and Lake Hiwassee, NC, USA (1.8) having the lowest estimated breeding population sample sizes. We note that some of these low estimates could have been affected by missing data, segregation of null alleles, or a limited sample size.
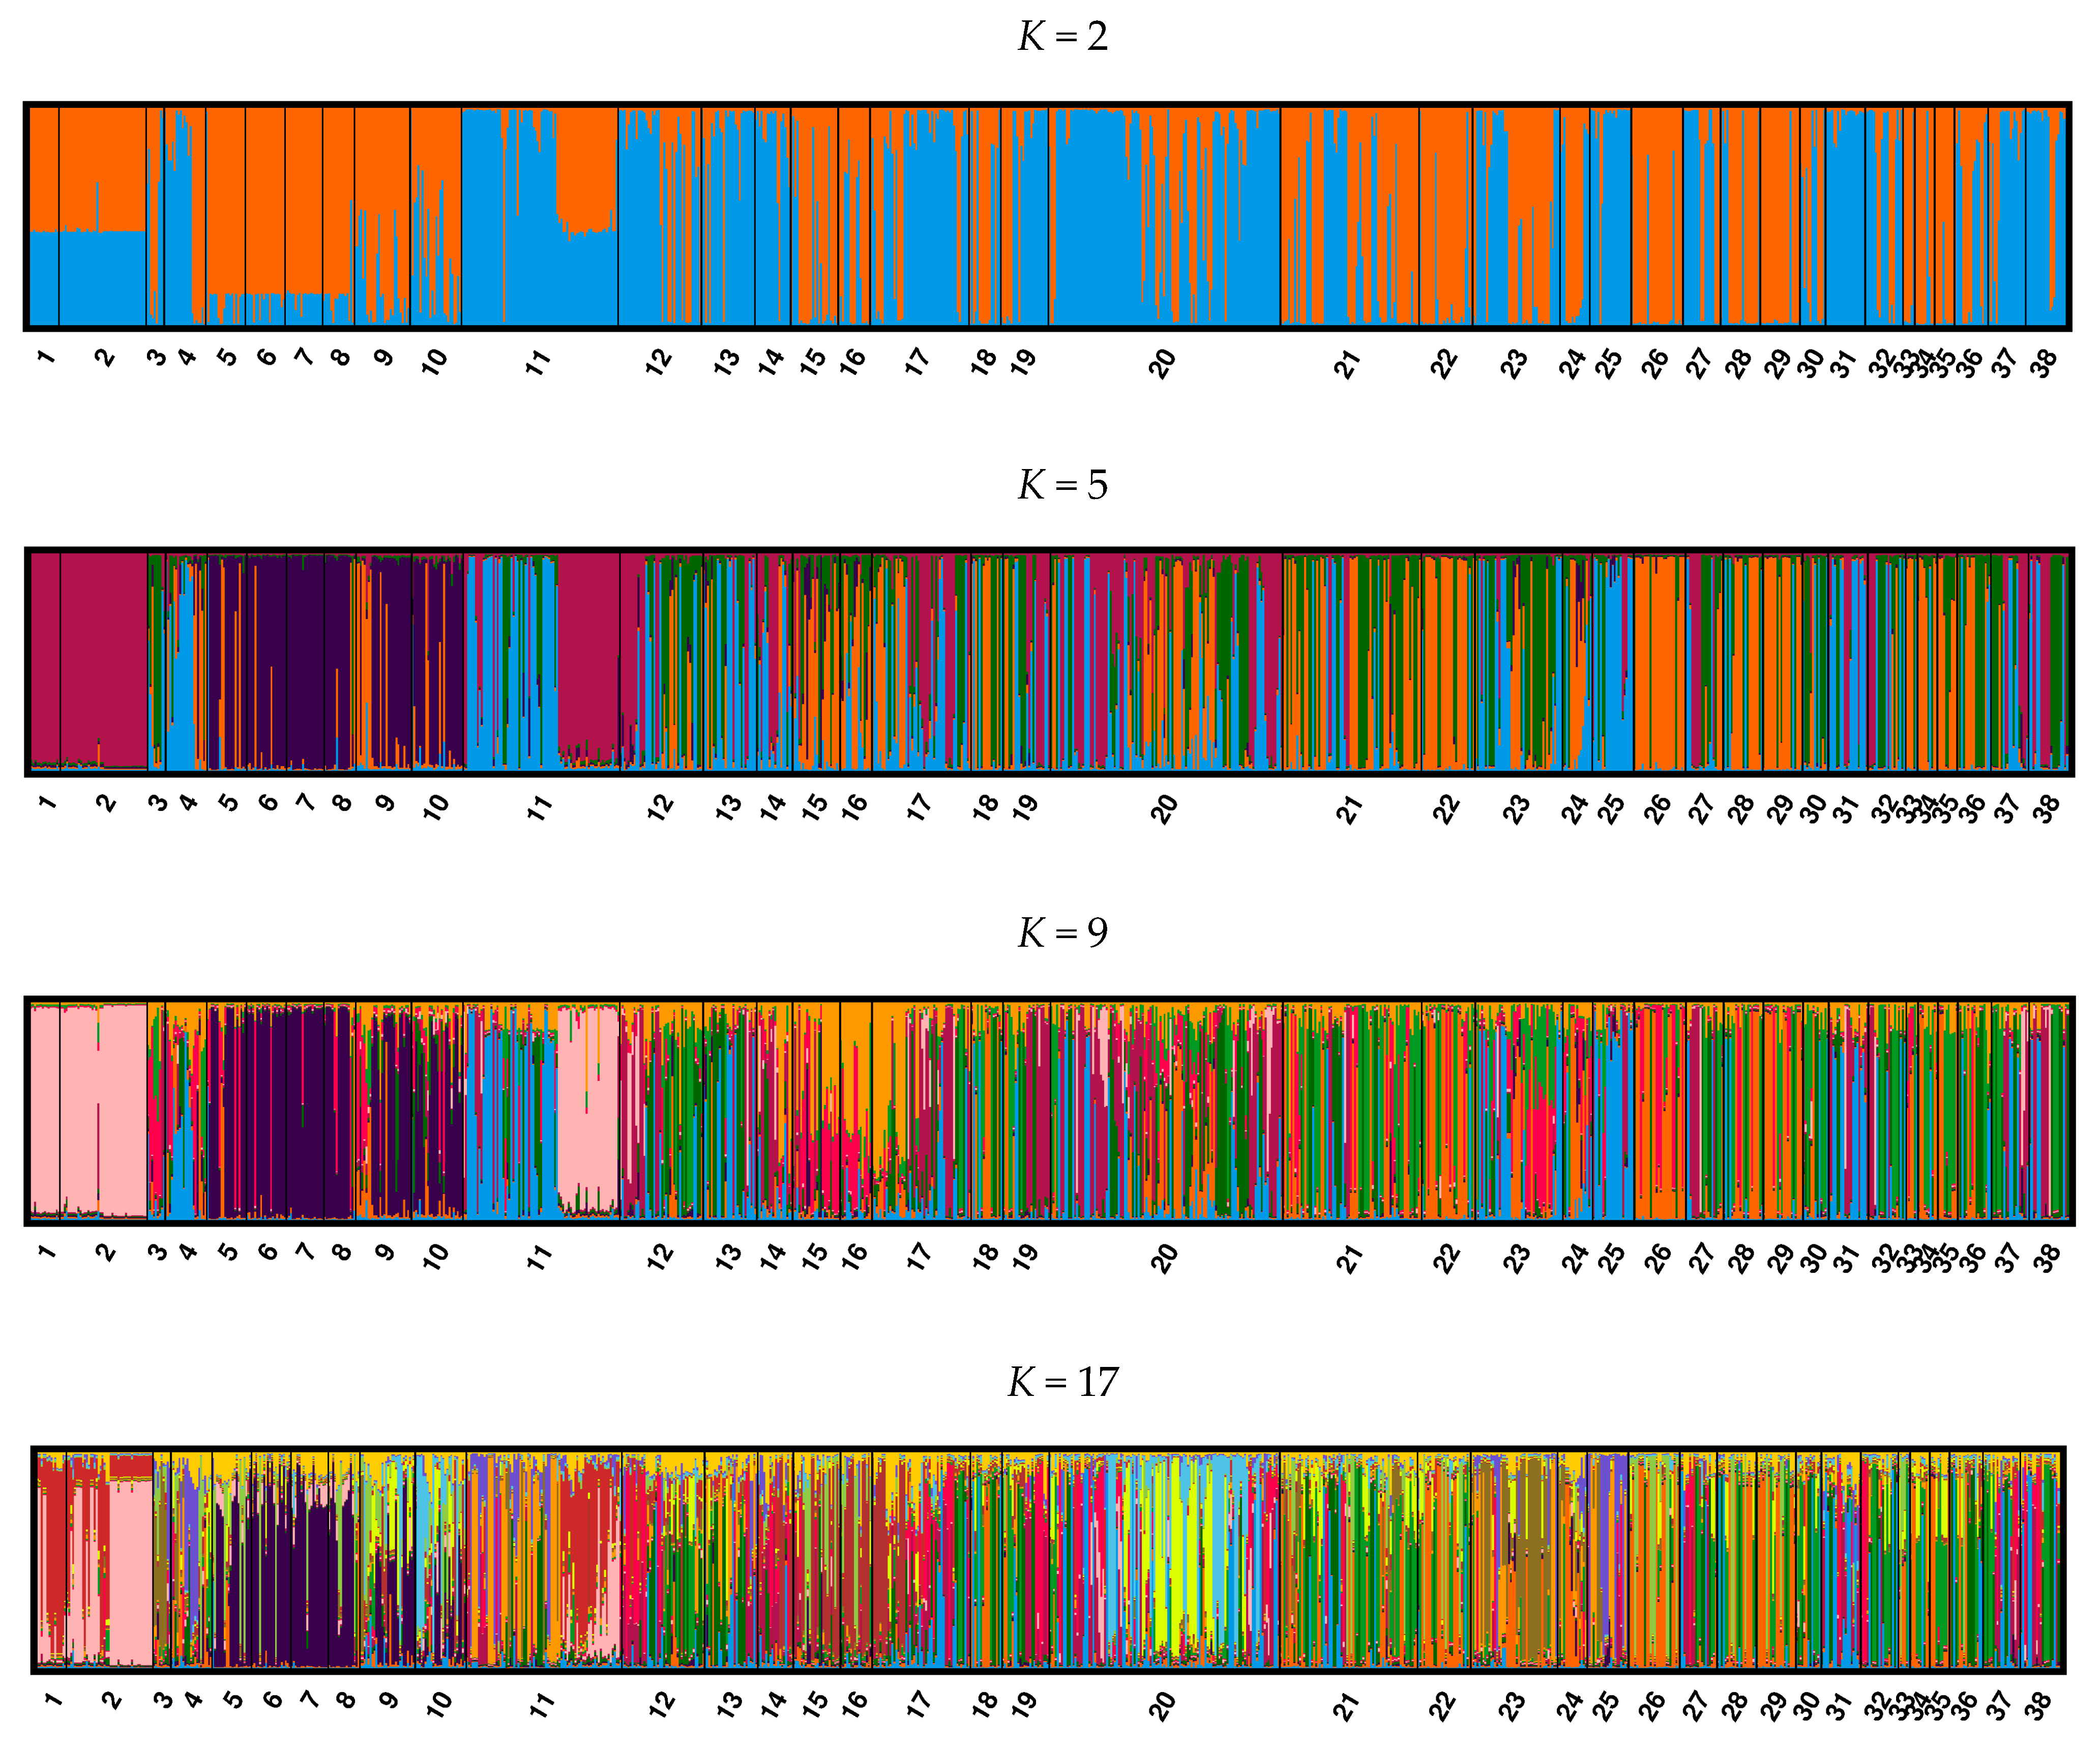
To evaluate divergence among Walleye population samples, we analyzed the data within and among sampling locations. The Evanno et al. [30] metric best supported K = 17 population groups, and the mean LnP(D|K) metric best supported K = 20, although other levels of K also showed structuring of interest. At K = 2, the Mobile Bay basin and Mississippi River population groups were separated from the Tennessee, New, and Ohio Rivers and the Great Lakes (Figure 2). At K = 5, similarities between the Mississippi River and the Eastern Highlands Walleye became apparent. The Tennessee and New River population groups, comprising part of the Eastern Highlands complex, shared many similarities and began to resemble populations within the Ohio River and Great Lakes systems. At K = 9, Fellows and Stockton Lakes in Missouri clustered separately from other Missouri and Arkansas populations within the Mississippi River drainage. The clustering results showed two separate populations in the Clinch and Powell Rivers, VA. Great Lakes populations also began to show differentiation from the Ohio River populations. At K = 17, we observed similar structuring as at lower values of K, but some populations became more distinct. The Alabama samples were distinct from all other Walleye populations in all watersheds. In the Mississippi River, Fellows and Stockton Lakes in Missouri were clustered and differentiated from the Mozingo and Smithville Lakes populations in Missouri. The upper Tennessee River populations were distinct from the North Carolina populations within the Tennessee River system. Populations in the Ohio River system also showed genetic differentiation, with Goose Creek and Rockcastle River (Kentucky) being the most distinctive populations.
Using population clusters defined by Structure, we conducted AMOVA. Results of a range-wide AMOVA among Walleye population samples (Table 6A) showed that 49.5% of genetic variation was within individuals, 41.0% among population samples, and 9.5% among the major watersheds. The overall departure from Hardy–Weinberg equilibrium (HWE) FIT was 0.50, the localized departure FIS was 0.39, and the departure between pairs of sites within watersheds FST was 0.18, indicating that most of the departure from HWE was within population samples. The FST metric of differentiation among individual populations (Table S5) reflected geographical relationships. As expected, populations within watersheds were less divergent from one another than those among different watersheds.
3.2. Range-Wide Analysis of Population Assemblages within Watersheds
A second set of analyses considered populations as assemblages within the respective watersheds. The mean number of alleles per locus varied between such assemblages of populations, with Alabama river system populations having the lowest (4.00) and New River having the highest (23.25) mean values (Table 7). The results of the application of Structure showed considerable support for K = 2, 4, or 6 clusters. Bar plots from this analysis (Figure S1) for K = 4 or 6 showed the distinctiveness of the Mobile Bay, Mississippi, Tennessee, and New and Great Lakes assemblages, with some degree of cluster-sharing among the Tennessee and especially the New River and Great Lakes assemblages. Partitioning of genetic variance among assemblages of populations using AMOVA (Table 6B) showed 49.1% of variance within individuals, 32.0% among individuals within population samples, 13.0% among populations within watersheds, and 5.9% among watersheds (considered as assemblages of populations) (Table 8). FST values reflected both historic and current geographical connections. FST values between the Alabama assemblage of populations and others were all moderately high, about 0.2. The overall FST between the New and Tennessee River populations was 0.094. Populations in the New and Mississippi Rivers were more distinct from one another (0.102) than were populations in the Tennessee and Mississippi Rivers (0.043). Populations in the Ohio River and Great Lakes watersheds were more closely related (0.067) than they were to populations in the New River (0.115). Populations in the Tennessee, New, and Ohio Rivers all showed lower FST values with one another than with Mississippi and Great Lakes populations. The Tennessee and Ohio River populations had an FST of 0.050, and the Tennessee and Great Lakes populations had a mean FST of 0.027. Populations in the New and Ohio Rivers had an FST of 0.030. All FST values were significantly greater than zero.
3.3. Mississippi-Tennessee-New-Ohio-Great Lakes Watersheds
We analyzed data for this group of populations to seek insight into their natural history, in particular regarding how Walleye recolonized the landscape after the Pleistocene glaciers receded. We considered the differentiation of 36 Walleye populations sampled across five major watersheds (Mississippi, Tennessee, Ohio, New, and Great Lakes drainages) within the Mississippi drainage. Considering Walleye at this scale, the Evanno et al. [30] metric best-supported K = 2, while mean LnP(D|K) best-supported K = 6 clusters. STRUCTURE bar-plot outputs (Figure S2) supported different insights into differentiation among population clusters at different K values. At K = 2, there was structuring across all populations from the Tennessee River northward to the Great Lakes populations, as seen in the full population analysis. Mississippi River populations, aside from those in Fellows and Stockton Lakes (MO, USA), maintained a large separation from those in other watersheds. Although the Ohio River and Great Lakes populations shared some similarities with the Tennessee and New River populations, there was a difference in structuring—especially among the Barren River (KY); Goose Creek (KY); Lake Erie; Mille Lacs (MN); and Lake Michigan. At K = 3, there was much the same structuring as at K = 2, but we observed similarities between the Mississippi River cluster and a few of the Great Lakes populations, i.e., Lake Erie, Lake Michigan, and Mille Lacs, MN. The divergence between the Tennessee and New River populations also became apparent. At K = 5, we began to see more structuring between the Current and Black Rivers (MO, AR) from those elsewhere within the Mississippi River drainage. Populations in the New and Tennessee Rivers also shared genetic similarity, supporting the view that they are a part of the Eastern Highlands complex of Walleye. There were also distinctive populations within the Great Lakes region, namely Lake Erie, Winnipeg (MB), Mistassini (QC), and the Flint River (MI). While at K = 6, some clusters seemed over-split, the Tennessee and New Rivers maintained genetic similarity, while the New River exhibited greater distinction. For AMOVA analyses, we divided the respective Walleye populations into five groups based on major watersheds. Partitioning of genetic variation among these different geographical regions showed that 49.3% of variation across these watersheds was within individuals, 32.7% was among individuals within the sampling populations, 15.8% was among populations within the watersheds, and 2.2% was among watersheds. The overall departure from HWE FIT was 0.51, the localized departure FIS was 0.40, the departure between sites within major groups FSC was 0.16, and the departure between watersheds FCT was 0.02.
3.4. Mississippi-Tennessee-New Watersheds
We analyzed data for this assemblage of populations to better understand population genetic structuring among Eastern Highlands Walleye populations. The Evanno et al., 2005 [32] metric best-supported K = 2, while mean LnP(D|K) best-supported K = 5. STRUCTURE bar plots (Figure S3) supported different insights into differentiation among population clusters. At K = 2, Mississippi River drainage populations were highly differentiated from Tennessee and New River populations. Some populations within the Mississippi River drainage, Fellows and Stockton lakes (MO, USA), were similar to the Tennessee and New River populations. At K = 3, we observed further differentiation between Mississippi River populations and the Tennessee and New River populations. Populations in Bear and Wolf Lakes (NC) of the Tennessee drainage showed similarities to populations of the Mississippi River drainage. The Clinch/Powell River populations did not cluster with the other Tennessee drainage populations, a result noted in cluster analyses at all geographic scales. At K = 3, the New River Walleye population became distinct from populations of the Tennessee River. At K = 5, populations in the Mississippi River drainage were fully separated from those in the Eastern Highlands. We also saw further separation between populations on the New and Tennessee Rivers. For AMOVA analyses, we divided the Walleye populations into three groups based on the three major watersheds. Partitioning of genetic variance among these different geographical regions showed that 49.3% of variation across these watersheds was within individuals, 32.7% was among individuals within the respective populations, 15.8% was among populations within watersheds, and 2.2% was among watersheds. The overall departure from HWE FIT was 0.51, the localized departure FIS was 0.40, the departure between sites within major groups FSC was 0.16, and the departure between watersheds FCT was 0.02. These results accorded with the results of AMOVAs for assessments at other geographic scales reported above.
3.5. Mobile Bay—Tennessee Watersheds
This analysis considered the population genetics of Walleye across four populations in the Mobile Bay drainage and three in the Tennessee drainage to which they were connected historically before the Appalachian River changed course [36], approximately 1.7 MYA. The Evanno et al. [30] metric best supported K = 2 and K = 3, while the mean LnP(D|K) metric best supported K = 5. STRUCTURE bar-plot outputs (Figure S4) supported different insights into differentiation among population clusters. At K = 2, there was differentiation between the Alabama and Tennessee river systems. Populations of the Clinch and Powell Rivers showed some similarities with those of both sampling locations in Alabama. At K = 3, populations of the Clinch and Powell Rivers shared similarities with those of Lake Fontana (NC), which follows from them all being within the Tennessee River drainage. Populations in the Alabama system, while differentiated, shared some background with Tennessee River populations. At K = 4, structuring within the Alabama system emerges. Although at K = 4, some clusters were broken into subgroupings that had no apparent population genetic basis, populations in these two watersheds were distinct but did share some genetic background. For AMOVA analyses, we assessed variance within and among groups of populations inhabiting the Alabama or Tennessee river systems. The results showed that 34.5% of the variance across these watersheds was within individuals, 43.6% was among individuals within the respective population samples, 12.2% was among populations within watersheds, and 9.7% was among watersheds. The overall departure from HWE FIT was 0.65, the localized departure FIS was 0.56, the departure between sites within major groups FSC was 0.13, and the departure between watersheds FCT was 0.10.
4. Discussion
4.1. Population Genetic Processes within Walleye Populations
Analysis of our data suggests that the Walleye populations that we examined are subject to small-population genetic processes. M-ratios were less than 0.68 (Table 3) and estimated Ne was less than 100 (Table 5) in all population samples, suggesting recent genetic bottleneck(s) and the importance of random genetic drift [27]. Observed heterozygosity HO was less than expected heterozygosity HE at most loci in most populations (Table S4), and the inbreeding coefficient FIS was positive and significantly greater than zero in all populations (Table 4). The departures of genotype frequencies from HWE discussed above in association with the results of the respective AMOVA analyses may be due to violations of assumptions underlying the Hardy–Weinberg model, including but not limited to non-random mating and high levels of mixing due to the stocking of many reservoirs across the range. Reconstruction of the stocking history of Claytor Lake, Virginia, supported the hypothesis that stocking contributed to departures from HWE there [17]. In contrast, a study of stocking in Cattaraugus Creek, eastern Lake Erie, using mtDNA sequences and eight microsatellite loci—including four of those used here—showed no departures from HWE and no influence of the stocking on the genetic composition of the spawning run or on the lake population [37]. The populations that we sampled in this study could have been affected by the actions of agencies in 14 states and provinces. Assessment of the hypothesis that stocking affected departures from HWE more generally would require detailed reconstruction of stocking histories and testing for differentiation among stocked and native populations within the respective systems. Stocking and the associated Wahlund effect could have contributed to the high values of the inbreeding coefficient FIS for these populations. Low effective population sizes may have resulted from the tendency of Walleye populations to boom-bust recruitment, i.e., poor recruitment most years with only occasional strong recruitment [38,39], and from the tendency to home to natal sites to spawn [40,41,42], thereby limiting the pool of potential mates. Stocking of hatchery fish propagated from a limited number of spawners may also depress Ne for a receiving population [43]. Franckowiak et al. [44] noted a low ratio of Ne/Nc (effective to census population sizes) in the introduced Walleye population in Escanaba Lake, Wisconsin, linking it to a high variance in reproductive success and a high rate of juvenile mortality. Characterizing population genetic processes in 15 populations of Walleye in Wisconsin, Waterhouse et al. [45] noted skewed sex ratios and inferred depression of Ne as a consequence of variable recruitment dynamics and generational overlap. Examining genetic variation in 46 Walleye populations in Ontario, Canada, Cena et al.’s [24] estimates of FIS ranged from −0.05 to +0.12, lower than ours. They related inbreeding to lake-specific characteristics, hatchery supplementation, population bottlenecks, and small population size. Our findings extend the inference of small-population processes to Walleye populations not sampled in earlier studies.
4.2. Genetic Differentiation of Walleye Populations
Applying established allozyme, mitochondrial, and microsatellite DNA markers, Palmer et al. [17] recognized the distinctiveness of the New River Walleye population. This led fisheries geneticists to screen additional populations across the region and ultimately recognize the existence of a distinctive assemblage of Eastern Highlands walleye populations [15]. We applied microsatellite markers to seek insights into population genetic differentiation that might contribute to the management of Walleye within and beyond that region.
Our results demonstrate that Mississippi River Walleye populations are distinct from Tennessee and New River populations. Current population genetic structuring reflects the process by which the respective populations arose through natural history. The lower Mississippi River watershed was likely a refugium for Walleye during Pleistocene glaciation [1]; however, Walleye populations in Virginia and West Virginia were not sampled in that study. Our results provide support for the interpretation that Eastern Highlands populations are descendants of Walleye from one or more refugia in more easterly, unglaciated portions of the species’ range. In the results of our Structure analysis for K = 2, the Mississippi River drainage had two distinct populations, Fellows and Stockton Lakes (MO), that seem genetically similar to those in the Tennessee/New River system (Figure 2). Genetic similarity would be expected due to the Tennessee and Missouri populations being within the Mississippi River drainage. However, stocking of Missouri populations may have fostered similarity of these populations to source populations, thereby affecting genetic structure in the Mississippi drainage. At K = 3, we observed that Mississippi River populations are distinct from those in the Tennessee/New River systems. Distinct populations include Bear and Wolf lakes in North Carolina; although these populations are within the Tennessee River system, they share similarity with the Mississippi River populations, leading us to suggest that these populations show the influence of stocking from outside sources, causing anthropogenic differentiation from geographically more proximal populations in Lakes Fontana and Nantahala, North Carolina. At K = 3, we also noted some degree of differentiation between the Tennessee and New River populations, which may be attributed to both natural and anthropogenic processes. The New River has a recognized native population that historically was stocked with Walleye derived from the Great Lakes region [17]. Since 2001, however, Walleye-bearing native microsatellite alleles have increased in frequency in a program of marker-assisted selection of broodstock for captive propagation and stocking [35].
Clinch and Powell River Walleye populations clustered separately from other populations within the Tennessee River drainage in our Structure analyses, notably from populations in North Carolina tributary drainages to the Tennessee River. We attribute this differentiation within the watershed as the consequence of heavy stocking from outside sources. New River-derived Walleye have been stocked into the Clinch and Powell rivers.
4.3. Inferences Regarding Natural History
Our findings showed that Walleye in the Mobile River basin are quite distinct from other populations across the range, likely as a consequence of having diverged from northern Walleye ~1.17 (±0.31) million years ago [10,18,36,46]. Allozyme studies [3,47] showed that Walleye from the Tombigbee River drainage are genetically distinctive, and mitochondrial DNA data [5] confirmed that they represent a unique and genetically divergent population. Results confirming deep differentiation of Mobile Basin Walleye were obtained using single nucleotide polymorphisms [9]. The mtDNA divergence time between northern and southern walleyes was compatible with the hypothesis that Walleye in the Mobile Bay drainage became isolated from northern Walleye during the pre-Pleistocene change in the course of the Appalachian River. This deep divergence is also apparent in Yellow Perch Perca flavescens from the Mobile Bay drainage, with mtDNA control region sequences and 15 microsatellite loci alike, mirroring the deep divergence found for Mobile Bay walleye with control region sequences and 9 microsatellite loci [48].
It has long been recognized that Pleistocene glaciation confined Walleye into three major refugia in the Lower Mississippi Valley: the east and the northwest [1]. As the glaciers retreated, Walleye populations that had been isolated began mixing upon secondary contact as they recolonized newly available habitat. Assessing the population structure of Walleye across 26 spawning sites in watersheds across the Great Lakes, Lake Winnipeg, upper Mississippi River, Ohio River, and Mobile Bay drainage, Stepien et al. [10] showed divergence among population groups arising from historic isolation in distinct glacial refugia, subsequent dispersal patterns, and current basin divisions. The greatest divergence distinguished Gulf Coast and northwest populations, the latter tracing to dispersal from the Missourian refugium to the former glacial Lake Agassiz, followed by isolation of that basin ~7000 years ago. Genetic barriers in the Great Lakes separated groups in Lake Superior, Huron’s Georgian Bay, Erie, and Ontario, with different levels of contribution from Mississippian and Atlantic refugia and subsequent changes in patterns of connectivity among adjacent ecosystems. Our results support the elaboration of the view that population genetic patterning in Walleye reflects dispersal from distinct glacial refugia and changing drainage connections. Thus, Great Lakes walleye have genetic backgrounds from the Eastern Highlands and the northwestern refugium [1]. Because periglacial rivers flowed along different courses at the close of the Pleistocene, Walleye entered the western Great Lakes through the Chicago River (in IL) and St. Croix River (MN), and the eastern Great Lakes through the Allegheny (PA) and Wabash-Maumee (OH) rivers. This natural history explains the resemblance of Eastern Highlands and eastern Great Lakes walleye and less resemblance to western Great Lakes walleye, which show the genetic signature of another ancestral stock. Our data support that interpretation; we observed divergence among populations in the eastern and western portions of the Great Lakes region (Figure 1 and Figure 2) stemming from multiple sources of colonization following deglaciation. From the east, Walleye moved through the Maumee (OH) and Allegheny (PA) rivers. The Allegheny River population shares population genetic signals with the Tennessee River, as well as Lake Ontario, Flint River, and Saginaw Bay in the Lake Huron drainage, and Lac Mistassini in QC, Canada. The similarities between Eastern Highlands and Great Lakes Walleye assemblages of populations suggest that the “Atlantic” refugium discussed in earlier work was actually a collection of refugia in rivers of the Eastern Highlands. This hypothesis could be tested with a larger collection of regional samples and with more genetic markers. These deep divergences in the eastern Atlantic range also characterize Yellow Perch population groups, which range more into saline waters than do Walleye [48,49].
We also observed that the Tennessee and New River populations have distinct genetic signatures that differentiate them from Mississippi Valley populations. The area having been a major glacial refugium explains the high genetic variation observed in lower Mississippi drainage populations by Billington and Strange [5]. While Billington and colleagues in their series of studies did not sample extensively in the Eastern Highlands, later work by Palmer et al. [17], Stepien et al. [10], and White et al. [15] led to recognition that Eastern Highlands Walleye are distinct. Our results support that interpretation and also show how Missouri populations fit within the Mississippi drainage assemblage.
At a finer scale, we noted some degree of differentiation among Tennessee and Ohio watershed Walleye populations. Although assemblages of Walleye populations in the Tennessee and Ohio River watersheds were not highly differentiated (Table 8 and Table S5; Figure 2), FST metrics in Table 8 show that New River Walleye is well differentiated from Ohio River Walleye (FST = 0.115), especially for comparisons involving the Barren River and Goose Creek (KY) populations (Figure 2 and Figure S2, Table S5). These similarities could be attributed to local adaptation as well as recent translocations of Walleye across watersheds. These populations within the Eastern Highlands show genetic differentiation, which should be reflected in fishery management practices, as discussed in the following section.
Patterns of population genetic differentiation in Walleye reflect those seen in other cool- and cold-water fishes that were affected by Pleistocene and post-glacial natural history. Lake Trout Salvelinus namaycush (Walbaum 1792) also shows signs of having dispersed from the Mississippi, Atlantic, and Beringian refugia [50]. Both Brook Trout Salvelinus fontinalis (Mitchell 1818) [51,52] and Lake Whitefish Coregonus clupeaformis (Mitchell 1818) [53] dispersed from refugia in the Mississippi drainage, southern Quebec/northern Maine, and Acadia and now show a contact zone in the Great Lakes region [49].
4.4. Management Implications
Fisheries management has increasingly come to consider geographic patterns of genetic variation to define biological units for management. Genetic differentiation as a factor underlying fisheries management is increasingly based on two critical concepts. Management units (MUs) are populations that are demographically independent of one another [54]. Identification of MUs is useful for determining short-term management actions, such as managing habitat, determining sources of broodstock for captive propagation and stocking, and setting harvest rates. MUs are frequently nested within higher-order units, recognition of which is critical for conservation purposes. An evolutionary significant unit (ESU) can be defined as a population or group of populations that merits priority for conservation and independent management because of its high genetic and ecological distinctiveness from other such units [54]. Ryder [55] defined ESUs as populations that present significant adaptive variation based on concordant sets of data derived from different techniques. Dizon et al. [56] regarded ESUs as populations that are distinctive based on morphology, geographic distribution, population demographic parameters, and genetic variation.
We suggest four provisional Evolutionarily Significant Units, or ESUs, of Walleye among the six major watersheds that we sampled. The Mobile Bay watershed populations are isolated from all other watersheds and show significant genetic differentiation. Through analyses including the Alabama reservoirs and the Tennessee River, we suggest that the Alabama populations are the descendants of Tennessee River populations that became isolated after the Appalachian River changed course, giving rise to the Tennessee and Alabama drainages of today. The findings of Zhao et al. [6] support this interpretation of natural history. Other provisional ESUs are those respectively in the Mississippi drainage, Great Lakes, and Eastern Highlands—the Tennessee; New; and Ohio Rivers combined. We suggest that these ESUs be regarded as provisional because adaptive genetic variation must yet be demonstrated [57]. However, Walleye in the New River are known river-spawners, compared to lake-spawners seen in the Great Lakes region. Native New River Walleye eggs are significantly larger than those of other populations [13], giving rise to relatively large larvae more likely to survive in flowing-water systems. Walleye have high fidelity to spawning locations [41,42], and there may be a general contrast between southern Walleye populations spawning in riverine habitats and northern Walleye spawning in lake habitats [10,42], which may mark ESUs across the range.
The results reported here constitute a baseline genetic analysis of Virginia walleye populations. Although the upper Tennessee and New River populations are both members of the Eastern Highlands ESU, because they show a level of genetic differentiation and are demographically independent, they should be recognized as distinct MUs, each with its own management plan. While there is a well-defined management plan for New River walleye, there is not one for upper Tennessee drainage walleye. With the recognition that upper Tennessee River system walleye are a distinct MU, it would be appropriate to design a targeted management plan for Walleye in the Clinch and Powell rivers.
Although this research focused mainly on Eastern Highlands Walleye, aspects of the results are applicable across the entire range. A key change in management practice is to not translocate Walleye across watersheds when stocking. To preclude the mixing of locally adapted populations and maintain a cohesive MU within given drainages, Walleye broodstock should be collected and their progeny stocked within their home watershed.
4.5. Future Work
A more complete understanding of the phylogeography [58] of Walleye would advance our understanding of the natural history of the species and inform management planning. Effort might focus on sequencing selected mitochondrial regions, including the control region, cytochrome b, ND1/2, and the nuclear S7 intron. The results would contribute, for example, to understanding the historic differentiation of Tennessee, New River, and Mobile Bay drainage Walleye from other lineages.
Phenotypic traits important for local adaptation are encoded by underlying genetic variation, which can be detected by screening single-nucleotide polymorphisms (SNPs) to assess population genetic differentiation and identify loci under selection. Experimental designs demonstrated for model fish species such as Threespine Stickleback Gasterosteus aculeatus Linnaeus 1758 [59,60] and extended to non-model systems including salmonids [61,62,63] and mollusks [64] can be applied to Walleye. Understanding the molecular basis of adaptation can inform conservation and management of species [65,66,67], which could include Walleye.
5. Conclusions
After screening microsatellite DNA variation within and among 38 Walleye samples, we inferred the effects of random genetic drift and inbreeding within them. Assemblages of populations within the Mobile Bay, Mississippi, Eastern Highlands, and Great Lake drainages were genetically differentiated following major watershed boundaries, the consequence of isolation in distinct Pleistocene refugia and secondary contact in the Holocene. The effects of translocations of Walleye were apparent in some populations. Knowledge of population genetic processes and structuring can inform the conservation and management of Walleye.
Supplementary Materials
The following supporting information can be downloaded at: https://www.mdpi.com/article/10.3390/fishes9010015/s1. Table S1. Summary of 19 microsatellite loci used in preliminary genetic screenings of 40 individuals from four Walleye populations. Table S2. PCR protocols for amplification of 8 microsatellite loci used to assess the population genetic structure of Walleye. Table S3. Frequencies of null alleles in regional assemblages of populations estimated using Microchecker [27]. Table S4. Full locus-by-locus genetic diversity indices for each population of Walleye across the sampled range. Table S5. FST values among populations of Walleye. Figure S1. Structure plots representative of population genetic structuring of Walleye populations grouped within watersheds at different levels of K. Figure S2. Structure plots representative of population genetic structuring of Walleye populations from the Mississippi, Tennessee, New, and Ohio River drainages and the Great Lakes at different levels of K. Figure S3. Structure plots representative of population genetic structuring of Walleye populations from the Mississippi, Tennessee, and New River drainages at different levels of K.
Author Contributions
Conceptualization, funding acquisition, and project administration, E.M.H.; methodology, S.C.H. and E.M.H.; sample acquisition, S.C.H., E.M.H., G.P. and C.A.S.; laboratory work, S.C.H.; formal analysis, S.C.H. and E.M.H.; writing, original draft, S.C.H.; writing—review and editing, S.C.H., G.P., C.A.S. and E.M.H. All authors have read and agreed to the published version of the manuscript.
Funding
This research was funded through a U.S. Fish and Wildlife Service State Wildlife Grant managed by the Virginia Department of Wildlife Resources as award EP2424446-0001201520.
Institutional Review Board Statement
All work was in accordance with collection permits issued by the Virginia Department of Wildlife Resources and Protocol 16-188FIW, approved by the Virginia Tech Institutional Animal Care and Use Committee on 1 November 2016.
Data Availability Statement
The data presented in this study are available upon request from the corresponding author.
Acknowledgments
We are grateful to personnel from the Kentucky Department of Fisheries and Wildlife Resources, Missouri Department of Conservation, North Carolina Wildlife Resources Commission, Ohio Division of Wildlife (Carey Knight and Kevin Kayle), Michigan Department of Natural Resources (Mike Thomas, William Wellenkamp, and Robert Haas), Ontario Ministry of Natural Resources (Tim Johnson and Chris Wilson), US Fish and Wildlife Service (Henry Quinlan and Nick Milroy), and Virginia Department of Wildlife Resources (especially Joe Williams and John Copeland), and to Matt White of Ohio University and Eric Peatman of Auburn University, Lars Rudstam of Cornell University, along with Wolfgang Jansen of North/South Consultants, and Barbara Evans of Lake Superior State University, who provided the genetic material from Walleye that provided the basis for this study. Caitlin Miller assisted with the laboratory work. The participation of E.M. Hallerman was supported in part by the Virginia Agricultural Experiment Station under the U.S. Department of Agriculture National Institute of Food and Agriculture.
Conflicts of Interest
The authors declare no conflicts of interest.
References
- Billington, N.; Hebert, P.D.N. Mitochondrial DNA variation in Great Lakes Walleye (Stizostedion vitreum) populations. Can. J. Fish. Aquat. Sci. 1998, 45, 643–654. [Google Scholar] [CrossRef]
- Stepien, C.A.; Faber, J.E. Population genetic structure, phylogeography and spawning philopatry in Walleye (Stizostedion. vitreum) from mitochondrial DNA control region sequences. Mol. Ecol. 1998, 7, 1757–1776. [Google Scholar] [CrossRef] [PubMed]
- Murphy, B.R. Evidence for a genetically unique Walleye population in the upper Tombigbee River system of northeastern Mississippi. Southeast. Fishes Counc. Proc. 1990, 22, 14–16. [Google Scholar]
- Billington, N.; Maceina, M. Genetic and population characteristics of Walleyes in the Mobile drainage of Alabama. Trans. Am. Fish. Soc. 1997, 126, 804–814. [Google Scholar] [CrossRef]
- Billington, N.; Strange, R.M. Mitochondrial DNA analysis confirms the existence of a divergent Walleye population in Northeastern Mississippi. Trans. Am. Fish. Soc. 1995, 124, 770–776. [Google Scholar] [CrossRef]
- Zhao, H.; Silliman, K.; Lewis, M.; Johnson, S.; Kratina, G.; Rider, S.J.; Stepien, C.A.; Hallerman, E.M.; Beck, B.; Fuller, A.; et al. SNP discovery and panel development for genetic identification and hybridization analysis in Walleye, Sander vitreus. Can. J. Fish. Aquat. Sci. 2020, 77, 1366–1378. [Google Scholar] [CrossRef]
- Strange, R.M.; Stepien, C.A. Genetic divergence and connectivity among river and reef spawning groups of Walleye (Sander vitreus vitreus) in Lake Erie. Can. J. Fish. Aquat. Sci. 2007, 64, 437–448. [Google Scholar] [CrossRef]
- Stepien, C.A.; Banda, J.A.; Murphy, D.M.; Haponski, A.E. Temporal and spatial genetic consistency of Walleye spawning groups. Trans. Am. Fish. Soc. 2012, 14, 660–672. [Google Scholar] [CrossRef]
- Haponski, A.E.; Stepien, C.A. Genetic connectivity and diversity of walleye (Sander vitreus) spawning groups in the Huron–Erie Corridor. J. Great Lakes Res. 2014, 40, 89–100. [Google Scholar] [CrossRef]
- Stepien, C.A.; Murphy, D.J.; Lohner, R.N.; Sepulveda-Villet, O.J.; Haponski, A.E. Signatures of vicariance, postglacial dispersal and spawning philopatry: Population genetics of the Walleye Sander vitreus. Mol. Ecol. 2009, 18, 3411–3428. [Google Scholar] [CrossRef]
- Stepien, C.A.; Murphy, D.J.; Lohner, R.N.; Haponski, A.E.; Sepulveda-Villet, O.J. Status and delineation of Walleye (Sander vitreus) genetic stock structure across the Great Lakes. In Status of walleye in the Great Lakes: Proceedings of the 2006 symposium. Great Lakes Fish. Comm. Technol. Rep. 2010, 69, 189–223. [Google Scholar]
- Euclide, P.T.; Larson, W.A.; Bootsma, M.; Miller, L.M.; Scribner, K.T.; Stott, W.; Wilson, C.C.; Latch, E.K. A new GTSeq resource to facilitate multijurisdictional research and management of Walleye Sander vitreus. Ecol. Evol. 2022, 12, e9591. [Google Scholar] [CrossRef] [PubMed]
- Hopkins, C.B.; Hilling, C.D.; Orth, D.J. Egg Size Variation among Walleye in Virginia. Unpublished manuscript, 2023.
- Billington, N.; Sloss, B.L. Mitochondrial DNA and allozyme analysis of Walleyes from the Rockcastle River and the Cumberland River (Big South Fork), Kentucky. In Report of Cooperative Fisheries Research Laboratory; Southern Illinois University to Kentucky Department of Fish and Wildlife Resources: Frankfort, KY, USA, 1998. [Google Scholar]
- White, M.M.; Faber, J.E.; Zipfel, K.J. Genetic identity of Walleye in the Cumberland River. Am. Midl. Nat. 2012, 167, 373–383. [Google Scholar] [CrossRef]
- White, M.M.; Kassler, T.W.; Philipp, D.P.; Schell, S.A. A genetic assessment of Ohio River Walleyes. Trans. Am. Fish. Soc. 2005, 134, 661–675. [Google Scholar] [CrossRef]
- Palmer, G.C.; Culver, M.; Dutton, D.; Murphy, B.R.; Hallerman, E.M.; Billington, N.; Williams, J. Genetically distinct Walleye stocked in Claytor Lake and the Upper New River, Virginia. Proc. Southeast Assoc. Fish. Wildl. Agencies 2006, 60, 125–131. [Google Scholar]
- Billington, N.; Barrette, R.J.; Hebert, P.D.N. Management implications of mitochondrial DNA variation in Walleye stocks. N. Am. J. Fish. Manag. 1992, 12, 276–284. [Google Scholar] [CrossRef]
- Haponski, A.E.; Sloss, B.L. Distribution and population genetics of Walleye and Sauger. BMC Evol. Biol. 2014, 14, 133. [Google Scholar]
- Borer, S.; Miller, L.M.; Kapuscinski, A.R. Microsatellites in Walleye Stizostedion vitreum. Mol. Ecol. 1999, 8, 36–37. [Google Scholar]
- Wirth, T.; Saint-Laurent, R.; Bernatchez, L. Isolation and characterization of microsatellite loci in the Walleye (Stizostedion vitreum), and cross-species amplification within the family Percidae. Mol. Ecol. 1999, 8, 1960–1963. [Google Scholar] [CrossRef]
- Eldridge, W.E.; Bacigalupi, M.D.; Adelman, I.R.; Miller, L.M.; Kapuscinski, A.R. Determination of relative survival of two stocked Walleye populations and resident natural-origin fish by microsatellite DNA parentage assignment. Can. J. Fish. Aquat. Sci. 2002, 59, 282–290. [Google Scholar] [CrossRef]
- Cena, C.J.; Morgan, G.E.; Malette, M.D.; Heath, D.D. Inbreeding, outbreeding and environmental effects on genetic diversity in 46 Walleye (Sander vitreus) populations. Mol. Ecol. 2006, 15, 303–320. [Google Scholar] [CrossRef] [PubMed]
- Excoffier, L.; Lischer, H.E.L. Arlequin suite, version 3.5: A new series of programs to perform population genetics analyses under Linux and Windows. Mol. Phylogenet. Evol. 2010, 10, 310–322. [Google Scholar]
- Van Oosterhout, C.; Hutchinson, W.F.; Willis, D.P.M.; Shipley, P. MICRO-CHECKER: Software for identifying and correcting genotyping errors in microsatellite data. Mol. Ecol. Notes 2004, 4, 535–538. [Google Scholar] [CrossRef]
- Pritchard, J.K.; Stephens, M.; Donnelly, P. Inference of population structure using multilocus genotype data. Genetics 2000, 155, 945–959. [Google Scholar] [CrossRef]
- Garza, M.H.; Williamson, E.G. Detection of reduction in population size using data from microsatellite loci. Mol. Ecol. 2001, 10, 305–318. [Google Scholar] [CrossRef] [PubMed]
- Kopelman, N.M.; Mayzel, J.; Jakobsson, M.; Rosenberg, N.A.; Mayrose, I. CLUMPAK: A program for identifying clustering modes and packaging population structure inferences across K. Mol. Ecol. Resour. 2015, 5, 1179–1191. [Google Scholar] [CrossRef] [PubMed]
- Earl, D.A.; von Holdt, B.M. STRUCTURE HARVESTER: A website and program for visualizing STRUCTURE output and implementing the Evanno method. Conserv. Genet. Resour. 2012, 4, 359–361. [Google Scholar] [CrossRef]
- Evanno, G.; Regnaut, S.; Goudet, J. Detecting the number of clusters of individuals using the software STRUCTURE: A simulation study. Mol. Ecol. 2005, 14, 2611–2620. [Google Scholar] [CrossRef]
- Excoffier, L.; Smouse, P.E.; Quattro, J. Analysis of molecular variance inferred from metric distances among DNA haplotypes: Application to human mitochondrial DNA restriction data. Genetics 1992, 131, 479–491. [Google Scholar] [CrossRef]
- Do, C.; Waples, R.S.; Peel, D.; Macbeth, G.M.; Tillett, B.J.; Ovenden, J.R. NeEstimator v2: Re-implementation of software for the estimation of contemporary effective population size (Ne) from genetic data. Mol. Ecol. Resour. 2014, 14, 209–214. [Google Scholar] [CrossRef]
- Kalinowski, S.T.; Wagner, A.P.; Taper, M.L. ML-Relate: A computer Program for maximum likelihood estimation of relatedness and relationship. Mol. Ecol. Notes 2006, 6, 576–579. [Google Scholar] [CrossRef]
- Holm, J. A simple sequentially rejective Bonferroni test procedure. Scand. J. Stat. 1979, 6, 71–76. [Google Scholar]
- Palmer, G.C.; Williams, J.; Scott, M.; Finne, K.; Johnson, N.; Dutton, D.; Murphy, B.R.; Hallerman, E.M. Genetic marker-assisted restoration of the presumptive native Walleye fishery in the New River, Virginia and West Virginia. Proc. Annu. Conf. Southeast. Assoc. Fish Wildl. Agencies 2007, 61, 17–22. [Google Scholar]
- Adams, G.I. The course of the Tennessee River and the physiography of the southern Appalachian region. J. Geol. 1928, 36, 481–493. [Google Scholar] [CrossRef]
- Haponski, A.E.; Dean, H.; Blake, B.; Stepien, C.A. Genetic history of walleye (Sander vitreus) spawning in Lake Erie’s Cattaraugus Creek: A comparison of pre- and post-stocking. Trans. Am. Fish. Soc. 2014, 143, 1295–1307. [Google Scholar] [CrossRef]
- Hansen, M.J.; Bozek, M.A.; Newby, J.R.; Newman, S.P.; Staggs, M.D. Factors affecting recruitment of walleyes in Escanaba Lake, Wisconsin, 1958–1996. N. Am. J. Fish. Manag. 1998, 18, 764–774. [Google Scholar] [CrossRef]
- Bozek, M.A.; Baccante, D.A.; Lester, N.P. Walleye and sauger life history. In Biology, Management, and Culture of Walleye and Sauger; Barton, B.A., Ed.; American Fisheries Society: Bethesda, MD, USA, 2011; pp. 233–301. [Google Scholar]
- Crowe, W.R. Homing behavior in walleyes. Trans. Am. Fish. Soc. 1962, 91, 350–354. [Google Scholar] [CrossRef]
- Jennings, M.J.; Claussen, J.E.; Philipp, D.P. Evidence for heritable preferences for spawning habitat between two Walleye populations. Trans. Am. Fish. Soc. 1996, 125, 978–982. [Google Scholar] [CrossRef]
- Hayden, T.T.; Binder, T.R.; Holbrook, C.M.; Vandergoot, C.S.; Fielder, D.G.; Cooke, S.J.; Dettmers, J.M.; Krueger, C.C. Spawning site fidelity and apparent annual survival of Walleye (Sander vitreus) differ between a Lake Huron and Lake Erie tributary. Ecol. Freshw. Fish 2018, 27, 339–349. [Google Scholar] [CrossRef]
- Ryman, N.; Laikre, L. Effects of supportive breeding on the genetically effective population size. Conserv. Biol. 1991, 5, 325–329. [Google Scholar] [CrossRef]
- Franckowiak, R.P.; Sloss, B.L.; Bozek, M.A.; Newman, S.P. Temporal effective size estimates of a managed Walleye Sander vitreus population and implication for genetic-based management. J. Fish Biol. 2009, 74, 1086–1103. [Google Scholar] [CrossRef] [PubMed]
- Waterhouse, M.D.; Sloss, B.L.; Isermann, D.A. Relationships among Walleye population characteristics and genetic diversity in northern Wisconsin lakes. Trans. Am. Fish. Soc. 2014, 143, 744–756. [Google Scholar] [CrossRef]
- Mayden, R.L. Vicariance biogeography, parsimony, and evolution in North American freshwater fishes. Syst. Biol. 1988, 37, 329–355. [Google Scholar] [CrossRef]
- Wingo, W.M. Characteristics of Walleye in the Tombigbee River and Tributaries. Master’s Thesis, Mississippi State University, Starkville, MA, USA, 1992. [Google Scholar]
- Stepien, C.A.; Sepulveda-Villet, O.J.; Haponski, A.E. Comparative genetic diversity, population structure, and adaptations of Walleye and Yellow Perch across North America. In Biology and Culture of Percid Fishes: Principles and Practices; Kestemont, P., Dabrowski, K., Summerfelt, R.C., Eds.; Springer: Dordrecht, The Netherlands, 2015; pp. 643–689. [Google Scholar] [CrossRef]
- Sepulveda-Villet, O.J.; Stepien, C.A. Waterscape genetics of the Yellow Perch (Perca flavescens): Patterns across large connected ecosystems and isolated relict populations. Mol. Ecol. 2012, 21, 5795–5826. [Google Scholar] [CrossRef] [PubMed]
- Wilson, C.C.; Hebert, P.D.N. Phylogeographic origins of Lake Trout (Salvelinus nemaycush) in eastern North America. Can. J. Fish. Aquat. Sci. 1996, 53, 2764–2775. [Google Scholar] [CrossRef]
- Bernatchez, L.; Wilson, C.C. Comparative phylogeography of Nearctic and Palearctic fishes. Mol. Ecol. 1998, 7, 431–452. [Google Scholar] [CrossRef]
- Kazyak, D.C.; Lubinski, B.A.; Kulp, M.A.; Pregler, K.C.; Whiteley, A.R.; Hallerman, E.; Coombs, J.A.; Kanno, Y.; Rash, J.M.; Morgan, R.P.; et al. Population genetics of Brook Trout in the southern Appalachian Mountains. Trans. Am. Fish. Soc. 2022, 151, 127–149. [Google Scholar] [CrossRef]
- Bernatchez, L.; Dodson, J.J. Phylogenetic relationships among Palearctic and Nearctic whitefish (Coregonus sp.) populations as revealed by mitochondrial DNA variation. Can. J. Fish. Aquat. Sci. 1994, 51 (Suppl. 1), 240–251. [Google Scholar] [CrossRef]
- Allendorf, F.W.; Luikart, G. Conservation and the Genetics of Populations; Blackwell Publishing: Malden, MA, USA, 2007. [Google Scholar]
- Ryder, O. Species conservation and systematics: The dilemma of subspecies. Trends Ecol. Evol. 1986, 1, 9–10. [Google Scholar] [CrossRef]
- Dizon, A.E.; Lockyear, C.; Perrin, W.F.; Demaster, D.P.; Sisson, J. Rethinking the stock concept—A phylogeographic approach. Conserv. Biol. 1992, 6, 24–36. [Google Scholar] [CrossRef]
- Waples, R.S. Pacific salmon, Oncorhynchus spp., and the definition of “species” under the Endangered Species Act. Mar. Fish. Rev. 1991, 53, 11–22. [Google Scholar]
- Avise, J.C. Phylogeography: The History and Formation of Species; Harvard University Press: Cambridge, MA, USA, 2000. [Google Scholar]
- Hohenlohe, P.A.; Bassham, S.; Etter, P.D.; Stiffler, N.; Johnson, E.A.; Cresko, W.A. Population genomics of parallel adaptation in Threespine Stickleback using sequenced RAD tags. PLoS Genet. 2010, 6, e1000862. [Google Scholar] [CrossRef] [PubMed]
- DeFaveri, J.; Shikano, T.; Shimada, Y.; Goto, A.; Merila, J. Global analysis of genes involved in freshwater adaptation in Threespine Sticklebacks (Gasterosteus aculeatus). Evolution 2011, 65, 1800–1807. [Google Scholar] [CrossRef] [PubMed]
- Larson, W.A.; Seeb, L.W.; Everett, M.V.; Waples, R.K.; Templin, W.D.; Seeb, J.E. Genotyping by sequencing resolves shallow population structure to inform conservation of Chinook salmon (Oncorhynchus tshawytscha). Evol. Appl. 2014, 7, 355–369. [Google Scholar] [CrossRef] [PubMed]
- Moore, J.S.; Bourret, V.; Dionne, M.; Bradbury, I.; O’Reilly, P.; Kent, M.; Chaput, G.; Bernatchez, L. Conservation genomics of anadromous Atlantic salmon across its North American range: Outlier loci identify the same patterns of population structure as neutral loci. Mol. Ecol. 2014, 23, 5680–5697. [Google Scholar] [CrossRef]
- Ackiss, A.S.; Larson, W.A.; Stott, W. Genotyping-by-sequencing illuminates high levels of divergence among sympatric forms of coregonines in the Laurentian Great Lakes. Evol. Appl. 2020, 13, 1037–1054. [Google Scholar] [CrossRef]
- Yan, X.; Nie, H.; Huo, Z.; Ding, J.; Li, Z.; Yan, L.; Jiang, L.; Mu, Z.; Wang, H.; Meng, X.; et al. Clam genome sequence clarifies the molecular basis of its benthic adaptation and extraordinary shell color diversity. Iscience 2019, 19, 1225–1237. [Google Scholar] [CrossRef]
- Shafer, A.B.; Wolf, J.B.; Alves, P.C.; Bergström, L.; Bruford, M.W.; Brännström, I.; Colling, G.; Dalén, L.; De Meester, L.; Ekblom, R.; et al. Genomics and the challenging translation into conservation practice. Trends Ecol. Evol. 2015, 30, 78–87. [Google Scholar] [CrossRef]
- Benestan, L.M.; Ferchaud, A.L.; Hohenlohe, P.A.; Garner, B.A.; Naylor, G.J.; Baums, I.B.; Schwartz, M.K.; Kelley, J.L.; Luikart, G. Conservation genomics of natural and managed populations: Building a conceptual and practical framework. Mol. Ecol. 2016, 25, 2967–2977. [Google Scholar] [CrossRef]
- Hohenlohe, P.A.; Funk, W.C.; Rajora, O.P. Population genomics for wildlife conservation and management. Mol. Ecol. 2021, 30, 62–82. [Google Scholar] [CrossRef]
Figure 1.
Walleye populations sampled: Great Lakes drainage—pink; Ohio River drainage—red; Mississippi River drainage—yellow; Tennessee River—purple; New River—grey; Mobile Bay drainage—green.
Figure 1.
Walleye populations sampled: Great Lakes drainage—pink; Ohio River drainage—red; Mississippi River drainage—yellow; Tennessee River—purple; New River—grey; Mobile Bay drainage—green.

Figure 2.
STRUCTURE plots represent the population genetic structuring of Walleye sample populations at different levels of K. Population samples are: (1) Hatchet Creek, Coosa Drainage, AL, USA; (2) John Allen Fish Hatchery, Tombigbee drainage, AL, USA; (3) Fellows Lake, MO, USA; (4) Stockton Lake, MO, USA; (5) Beaver/Table Rock Lake, AK/MO, USA; (6) James/Table Rock Lake, MO, USA; (7) Mozingo Lake, MO, USA; (8) Smithville Lake, MO, USA; (9) Current River, MO, USA; (10) Black River, AK, USA; (11) Clinch and Powell Rivers, VA, USA; (12) Lake Fontana, NC, USA; (13) Nantahala Lake, NC, USA; (14) Lake Santeetlah, NC, USA; (15) Bear Lake, NC, USA; (16) Wolf Lake, NC, USA; (17) Lake James, NC, USA; (18) Lake Hiwassee, NC, USA; (19) Lake Glenville, NC, USA; (20) New River, VA, USA; (21) Barren River, KY, USA; (22) Goose Creek, KY, USA; (23) Rockcastle River, KY, USA; (24) Levisa and Russell Forks, KY, USA; (25) Allegheny River, PA, USA; (26) Lake Erie; (27) Lake Ontario; (28) Mille Lacs, MN, USA; (29) Lake Michigan; (30) Grand River, MI, USA; (31) Flint River, MI, USA; (32) St. Mary’s River, MI, USA; (33) Thunder Bay, ON, Canada; (34) Saginaw Bay, MI, USA; (35) Oneida Lake, NY, USA; (36) Lake Manitoba, MB, Canada; (37) Lake Winnipeg, Manitoba; and (38) Lac Mistassini, QC, Canada.

Table 1.
Walleye samples’ for microsatellite DNA analysis. Total samples: n = 1279. No mention of the year indicates that the collection date is unknown.
Table 1.
Walleye samples’ for microsatellite DNA analysis. Total samples: n = 1279. No mention of the year indicates that the collection date is unknown.
| Major Drainage | River | Location | Number (Year) | Provided by |
|---|---|---|---|---|
| New | New River, VA | Foster Falls, VA, USA | 23 (2015–2016) | Virginia Department of Wildlife Resources |
| Ivanhoe, VA, USA | 23 (2015–2016) | |||
| Native New River-spawning individuals | 320 (2008, 2017–2018) | |||
| Ohio | Barren River | Barren River, KY, USA | 69 (2017) | Kentucky Dept. of Fisheries and Wildlife Resources |
| Rockcastle River | Rockcastle River, KY, USA | 43 (2017–2018) | ||
| Big Sandy River | Levisa Fork, KY, USA | 8 (2017–2018) | ||
| Russell Fork, KY, USA | 7 (2017–2018) | |||
| Goose Creek, KY, USA | 26 (2018) | |||
| Allegheny River | Allegheny River, PA, USA | 20 | ||
| Tennessee | Clinch River | Ft. Blackmore, VA, USA | 20 (2016–2017) | Virginia Department of Wildlife Resources |
| Clinchport, VA, USA | 20 (2015–2017) | |||
| Dungannon, VA, USA | 10 (2015–2017) | |||
| Burton’s Ford, VA, USA | 13 (2015–2017) | |||
| Carterton, VA, USA | 12 (2015–2017) | |||
| Powell River, TN | 4 (2018) | North Carolina Wildlife Resources Commission | ||
| Little Tennessee River | Lake Fontana, NC, USA | 41 | ||
| Hiwassee River | Lake Hiwassee, NC, USA | 15 | ||
| Tuckasegee River | Lake Glenville, NC, USA | 23 | ||
| Little Tennessee River | Nantahala Lake, NC, USA | 26 | ||
| Cheoah River | Lake Santeelah, NC, USA | 17 | ||
| Tuckasegee River | Bear Lake, NC, USA | 24 | ||
| Wolf Lake, NC, USA | 15 | |||
| Lake James, NC, USA | 49 | |||
| Mississippi | White River Basin | Fellows Lake, MO, USA | 9 | Missouri Department of Conservation |
| Stockton Lake, MO, USA | 21 | |||
| Beaver tailwater/Table Rock Lake, AK/MO, USA | 20 | |||
| James River/Table Rock Lake, MO, USA | 20 | |||
| Mozingo Lake, MO, USA | 19 | |||
| Smithville Lake, MO, USA Current River, MO, USA Black River, AK, USA | 16 28 26 | |||
| Mississippi | Upper Mississippi R. | Mille Lacs, MN, USA | 19 (2004). | Nick Milroy, U.S. Fish and Wildlife Service |
| Great Lakes | Lake Ontario | Oneida Lake, NY, USA | 10 (2005) | Lars Rudstam, Cornell University |
| Bay of Quinte, Lake Ontario | 18 (2005) | Timothy Johnson, Ontario Ministry of Natural Resources | ||
| Lake Michigan | Grand River, MI, USA | 12 (1998) | Michael Thomas, Michigan Department of Natural Resources | |
| Lake Superior | THUNDER BAY, ON, Canada | 6 (2000) | Henry Quinlan, USFWS | |
| Lake Michigan | Muskegon River, Lake Michigan | 19 (1998) | Michael Thomas, Michigan Department of Natural Resources | |
| Lake Huron | Flint River, MI, USA | 19 (1998) | Michael Thomas, Michigan Department of Natural Resources | |
| Tittabawassee River, Saginaw Bay, MI, USA | 10 (2012) | William Wellenkamp, Michigan Department of National Resources | ||
| St. Mary’s River | Munuscong Bay MI, Lake Huron | 18 (2002) | Barbara Evans, Lake Superior State University | |
| Lake Winnipeg | Lake Manitoba, MB, Canada | 17 (2006) | Wolfgang Jansen, North/South Consultants, Winnipeg, MN, USA | |
| Lake Winnipeg, MB, Canada | 18 (2012) | Christopher Wilson, Ontario Ministry of Natural Resources and Forestry | ||
| Lac Mistassini | Lac Mistassini, QC, Canada | 19 | Christopher Wilson, Ontario Ministry of Natural Resources and Forestry | |
| Lake Erie | Fairport, OH, USA | 25 (1996) | Ohio Department of Wildlife | |
| Alabama | Coosa River | Hatchet Creek, AL, USA | 15 (2005–2014) | Eric Peatman, Auburn University |
| Tombigbee River | John Allen Fish Hatchery, AL, USA | 44 (2018) |
Table 2.
Summary information for the amplification of eight microsatellite loci used to assess the population genetic structure of Walleye. PCR protocol information appears in Table S2.
Table 2.
Summary information for the amplification of eight microsatellite loci used to assess the population genetic structure of Walleye. PCR protocol information appears in Table S2.
| Locus | Multiplex, Master Mix | PCR Protocol | Size Range (bp) | Number of Alleles | (°C) | Source |
|---|---|---|---|---|---|---|
| Svi5 | 1 | 1 | 130–192 | 32 | 50/59 | [24] |
| Svi6 | 1 | 1 | 126–164 | 14 | 50/59 | [24] |
| Svi16 | 1 | 1 | 175–299 | 42 | 50/59 | [24] |
| Svi17 | 2 | 2 | 99–113 | 7 | 57 | [22] |
| Svi18 | 1 | 1 | 110–142 | 17 | 50/59 | [22] |
| Svi33 | 2 | 2 | 73–95 | 12 | 57 | [22] |
| SviL1 | 3 | 3 | 151–209 | 29 | 53 | [23] |
| SviL7 | 3 | 4 | 135–269 | 39 | 48 | [23] |
Table 3.
Genetic diversity at the population sample level. N = number of polymorphic loci, A = mean number of alleles per locus, HO = mean served heterozygosity, HE = mean expected heterozygosity, allele size range = mean difference between lengths (N nucleotides) of the largest and smallest alleles at a particular locus, and M = ratio of the number of alleles observed at a locus to the number of possible alleles between the largest and smallest alleles [27]. The numbers in parentheses indicate standard deviations.
| Population Sample | N | A | HO | HE | Allele Size Range | M |
|---|---|---|---|---|---|---|
| Coosa drainage, AL, USA | 4 | 3.00 (1.41) | 0.32 (0.44) | 0.51 (0.18) | 7.00 (6.22) | 0.45 (0.20) |
| Tombigbee drainage, AL, USA | 6 | 3.83 (1.33) | 0.23 (0.41) | 0.55 (0.08) | 70.83 (66.17) | 0.21 (0.23) |
| Fellows Lake, MO, USA | 7 | 6.43 (2.64) | 0.65 (0.24) | 0.82 (0.10) | 63.57 (62.69) | 0.26 (0.23) |
| Stockton Lake, MO, USA | 8 | 8.38 (3.33) | 0.44 (0.26) | 0.75 (0.14) | 158.88 (52.64) | 0.05 (0.01) |
| Beaver/Table Rock Lake, AK/MO, USA | 7 | 8.29 (3.00) | 0.49 (0.36) | 0.82 (0.08) | 65.00 (72.17) | 0.33 (0.25) |
| James/Table Rock Lake, MO, USA | 7 | 7.57 (1.51) | 0.39 (0.25) | 0.78 (0.09) | 111.71 (82.17) | 0.17 (0.19) |
| Mozingo Lake, MO, USA | 8 | 6.75 (2.82) | 0.40 (0.31) | 0.71 (0.25) | 77.38 (77.00) | 0.29 (0.26) |
| Smithville Lake, MO, USA | 7 | 8.29 (3.50) | 0.51 (0.31) | 0.82 (0.07) | 41.14 (41.06) | 0.38 (0.22) |
| Current River, MO, USA | 7 | 6.00 (3.65) | 0.23 (0.32) | 0.59 (0.27) | 112.86 (87.28) | 0.19 (0.25) |
| Black River, AK, USA | 7 | 7.29 (4.07) | 0.32 (0.38) | 0.61 (0.23) | 101.86 (98.28) | 0.27 (0.27) |
| Clinch and Powell Rivers, VA, USA | 8 | 12.25 (4.59) | 0.34 (0.17) | 0.76 (0.13) | 155.75 (78.43) | 0.14 (0.18) |
| Lake Fontana, NC, USA | 8 | 10.75 (3.92) | 0.33 (0.26) | 0.75 (0.20) | 119.75 (66.04) | 0.17 (0.20) |
| Nantahala Lake, NC, USA | 6 | 8.33 (3.45) | 0.30 (0.29) | 0.74 (0.15) | 67.00 (48.55) | 0.25 (0.22) |
| Lake Santeetlah, NC, USA | 6 | 8.33 (3.67) | 0.43 (0.22) | 0.82 (0.12) | 129.83 (81.64) | 0.12 (0.17) |
| Bear Lake, NC, USA | 6 | 7.83 (3.76) | 0.37 (0.20) | 0.79 (0.07) | 28.83 (33.59) | 0.43 (0.18) |
| Wolf Lake, NC, USA | 7 | 6.29 (2.50) | 0.48 (0.31) | 0.72 (0.18) | 112.43 (111.03) | 0.24 (0.25) |
| Lake James, NC, USA | 7 | 10.57 (4.43) | 0.55 (0.27) | 0.83 (0.08) | 80.71 (93.36) | 0.31 (0.24) |
| Lake Hiwassee, NC, USA | 6 | 6.33 (1.97) | 0.49 (0.32) | 0.76 (0.11) | 61.67 (49.89) | 0.24 (0.23) |
| Lake Glenville, NC, USA | 7 | 7.86 (2.91) | 0.51 (0.30) | 0.75 (0.24) | 96.14 (116.61) | 0.32 (0.26) |
| New River, VA, USA | 7 | 11.57 (6.88) | 0.66 (0.37) | 0.73 (0.33) | 90.29 (125.17) | 0.37 (0.23) |
| Barren River, KY, USA | 8 | 11.75 (4.65) | 0.44 (0.30) | 0.78 (0.13) | 126.00 (76.99) | 0.16 (0.18) |
| Goose Creek, KY, USA | 7 | 8.00 (3.46) | 0.50 (0.40) | 0.73 (0.14) | 108.57 (109.14) | 0.23 (0.24) |
| Rockcastle River, KY, USA | 8 | 8.50 (4.04) | 0.38 (0.30) | 0.68 (0.28) | 88.00 (67.33) | 0.21 (0.19) |
| Levisa and Russell Forks, KY, USA | 7 | 8.29 (3.10) | 0.55 (0.24) | 0.80 (0.10) | 64.43 (76.82) | 0.33 (0.22) |
| Allegheny River, PA, USA | 8 | 7.63 (3.34) | 0.49 (0.31) | 0.77 (0.18) | 32.00 (46.13) | 0.44 (0.18) |
| Lake Erie | 7 | 5.57 (1.90) | 0.53 (0.38) | 0.67 (0.28) | 12.29 (7.52) | 0.48 (0.13) |
| Lake Ontario | 7 | 8.29 (3.04) | 0.55 (0.27) | 0.83 (0.07) | 76.71 (93.96) | 0.30 (0.25) |
| Mille Lacs, MN, USA | 6 | 6.33 (1.34) | 0.42 (0.36) | 0.78 (0.07) | 41.00 (45.84) | 0.37 (0.24) |
| Lake Michigan | 7 | 6.14 (0.68) | 0.44 (0.34) | 0.68 (0.15) | 71.57 (92.27) | 0.31 (0.26) |
| Grand River, MI, USA | 7 | 5.57 (1.27) | 0.27 (0.20) | 0.71 (0.15) | 124.00 (101.50) | 0.19 (0.25) |
| Flints River, MI, USA | 7 | 7.71 (2.29) | 0.62 (0.32) | 0.83 (0.04) | 76.14 (94.43) | 0.30 (0.24) |
| St. Mary’s River, MI, USA | 7 | 8.00 (2.31) | 0.47 (0.33) | 0.79 (0.10) | 76.71 (94.48) | 0.30 (0.24) |
| Thunder Bay, ON, Canada | 6 | 5.00 (1.79) | 0.50 (0.45) | 0.76 (0.15) | 76.17 (86.18) | 0.24 (0.24) |
| Saginaw Bay, MI, USA | 7 | 5.29 (1.38) | 0.53 (0.39) | 0.69 (0.15) | 71.29 (94.07) | 0.28 (0.24) |
| Oneida Lake, NY, USA | 6 | 4.00 (0.89) | 0.50 (0.37) | 0.67 (0.13) | 38.33 (44.40) | 0.27 (0.19) |
| Lake Manitoba, MB, Canada | 7 | 6.57 (2.30) | 0.47 (0.35) | 0.77 (0.10) | 73.57 (92.76) | 0.30 (0.25) |
| Lake Winnipeg, MB, Canada | 7 | 8.71 (3.95) | 0.51 (0.38) | 0.77 (0.14) | 77.86 (90.34) | 0.29 (0.23) |
| Lac Mistassini, QC, Canada | 7 | 7.71 (3.77) | 0.51 (0.37) | 0.80 (0.10) | 109.71 (107.70) | 0.23 (0.24) |
Table 4.
Inbreeding coefficients (FIS) for all individual population samples in the analysis across the range. All FIS values were significantly different from zero.
Table 4.
Inbreeding coefficients (FIS) for all individual population samples in the analysis across the range. All FIS values were significantly different from zero.
| Population Sample | FIS |
|---|---|
| Hatchet Creek, AL, USA | 0.39 |
| J. Allen Fish Hatchery, AL, USA | 0.58 |
| Fellows Lake, MO, USA | 0.21 |
| Stockton Lake, MO, USA | 0.42 |
| Beaver/Table Rock Lake, AK/MO, USA | 0.41 |
| James/Table Rock Lake, MO, USA | 0.50 |
| Mozingo Lake, MO, USA | 0.44 |
| Smithville Lake, MO, USA | 0.39 |
| Current River, MO, USA | 0.62 |
| Black River, AK, USA | 0.48 |
| Clinch and Powell Rivers, VA, USA | 0.56 |
| Lake Fontana, NC, USA | 0.56 |
| Nantahala Lake, NC, USA | 0.60 |
| Lake Santeetlah, NC, USA | 0.49 |
| Bear Lake, NC, USA | 0.54 |
| Wolf Lake, NC, USA | 0.34 |
| Lake James, NC, USA | 0.34 |
| Lake Hiwassee, NC, USA | 0.37 |
| Lake Glenville, NC, USA | 0.33 |
| New River, VA, USA | 0.10 |
| Barren River, KY, USA | 0.43 |
| Goose Creek, KY, USA | 0.32 |
| Rockcastle River, KY, USA | 0.44 |
| Levisa and Russell Forks, KY, USA | 0.31 |
| Allegheny River, PA, USA | 0.37 |
| Lake Erie | 0.21 |
| Lake Ontario | 0.35 |
| Mille Lacs, MN, USA | 0.47 |
| Lake Michigan | 0.36 |
| Grand River, MI, USA | 0.62 |
| Flint River, MI, USA | 0.26 |
| St. Mary’s River, MI, USA | 0.42 |
| Thunder Bay, ON, Canada | 0.36 |
| Saginaw Bay, MI, USA | 0.25 |
| Oneida Lake, NY, USA | 0.27 |
| Lake Manitoba, MB, Canada | 0.40 |
| Lake Winnipeg, MB, Canada | 0.34 |
| Lac Mistassini, QC, Canada | 0.36 |
Table 5.
Estimated effective breeding numbers, Ne, for each of the sampled populations, with a 95% confidence interval (C.I.). Undefined bounds for particular populations may be attributed to small sample sizes or missing data.
Table 5.
Estimated effective breeding numbers, Ne, for each of the sampled populations, with a 95% confidence interval (C.I.). Undefined bounds for particular populations may be attributed to small sample sizes or missing data.
| Population Sample | N | Estimated Ne | 95% C.I. | Jackknife Estimate |
|---|---|---|---|---|
| Hatchet Creek, AL, USA | 15 | 63.1 | 1.6–Undefined | 0.7–Undefined |
| J. Allen Fish Hatchery, AL, USA | 44 | 8.9 | 3.0–23.5 | 2.0–48.8 |
| Fellows Lake, MO, USA | 9 | 68.7 | 7.6–Undefined | 3.1–Undefined |
| Stockton Lake, MO, USA | 21 | 8.6 | 4.5–16.2 | 2.5–47.9 |
| Beaver/Table Rock Lake, AK/MO, USA | 20 | 10.7 | 6.8–17.7 | 4.1–31.5 |
| James/Table Rock Lake, MO, USA | 20 | 5.3 | 2.7–10.5 | 2.0–21.5 |
| Mozingo Lake, MO, USA | 19 | 8.0 | 4.0–14.5 | 2.7–27.4 |
| Smithville Lake, MO, USA | 16 | 10.6 | 5.9–20.8 | 4.0–32.6 |
| Current River, MO, USA | 28 | 4.4 | 2.2–11.9 | 1.4–66.3 |
| Black River, AK, USA | 26 | 11.6 | 5.3–31.5 | 3.1–81.0 |
| Clinch and Powell Rivers, VA, USA | 79 | 8.9 | 6.6–11.6 | 5.1–13.4 |
| Lake Fontana, NC, USA | 42 | 17.0 | 11.8–26.2 | 8.2–48.6 |
| Nantahala Lake, NC, USA | 27 | 4.5 | 2.6–8.5 | 1.8–15.3 |
| Lake Santeetlah, NC, USA | 18 | 87.9 | 19.0–Undefined | 18.4–Undefined |
| Bear Lake, NC, USA | 24 | 16.8 | 8.7–41.9 | 6.1–118.1 |
| Wolf Lake, NC, USA | 16 | 19.9 | 7.3–Undefined | 2.9–Undefined |
| Lake James, NC, USA | 50 | 14.4 | 10.9–19.8 | 8.2–26.3 |
| Lake Hiwassee, NC, USA | 16 | 1.8 | 1.3–2.7 | 1.0–5.1 |
| Lake Glenville, NC, USA | 24 | 6.8 | 4.0–10.3 | 3.0–12.7 |
| New River, VA, USA | 117 | 15.3 | 12.8–18.1 | 12.0–19.2 |
| Barren River, KY, USA | 70 | 8.6 | 6.6–10.8 | 4.3–13.2 |
| Goose Creek, KY, USA | 27 | 2.7 | 2.1–4.6 | 1.8–6.4 |
| Rockcastle River, KY | 44 | 7.2 | 4.9–10.0 | 3.2–12.6 |
| Levisa and Russell Forks, KY, USA | 15 | 16.4 | 7.8–61.1 | 3.1–Undefined |
| Allegheny River, PA, USA | 21 | 6.4 | 3.4–9.6 | 2.7–14.0 |
| Lake Erie | 26 | 1.9 | 1.5–2.4 | 0.9–5.6 |
| Lake Ontario | 19 | 4.1 | 2.7–7.2 | 2.1–11.0 |
| Mille Lacs, MN, USA | 20 | 2.3 | 1.7–3.1 | 1.5–4.3 |
| Lake Michigan | 20 | 2.7 | 1.9–5.3 | 1.1–18.7 |
| Grand River, MI, USA | 13 | 8.5 | 2.1–Undefined | 1.4–Undefined |
| Flint River, MI, USA | 20 | 7.6 | 4.4–12.4 | 4.0–13.2 |
| St. Mary’s River, MI, USA | 19 | 6.8 | 3.2–12.1 | 2.6–19.1 |
| Thunder Bay, ON, Canada | 6 | 8.3 | 1.3–Undefined | 0.8–Undefined |
| Saginaw Bay, MI, USA | 10 | 3.0 | 1.5–25.9 | 1.1–Undefined |
| Oneida Lake, NY, USA | 10 | 1.1 | 0.6–2.2 | 0.6–2.4 |
| Lake Manitoba, MB, Canada | 17 | 7.0 | 2.9–15.4 | 2.9–16.1 |
| Lake Winnipeg, MB, Canada | 19 | 4.7 | 2.7–8.6 | 2.4–10.9 |
| Lac Mistassini, QC, Canada | 20 | 2.5 | 1.9–3.3 | 1.2–10.8 |
Table 6.
Analysis of molecular variance (AMOVA) for: A. Walleye population samples, and B. Groups of populations.
Table 6.
Analysis of molecular variance (AMOVA) for: A. Walleye population samples, and B. Groups of populations.
| A. Within and among Individual Populations. | ||||
| Source of Variation | d.f. | Sum of Squares | Variance Components | Percentage of Variation |
| Among population samples | 5 | 668.38 | 0.32 | 9.5 |
| Among individuals within population samples | 1273 | 5583.44 | 1.37 | 41.0 |
| Within individuals | 1279 | 2114.50 | 1.65 | 49.5 |
| Total | 2557 | 8366.23 | 3.34 | |
| B. Within and among Populations and Groups of Populations (Mississippi, Tennessee, New, and Ohio River Drainages, and Great Lakes). | ||||
| Source of Variation | d.f. | Sum of Squares | Variance Components | Percentage of Variation |
| Among groups of populations | 5 | 537.11 | 0.19 | 5.9 |
| Among population samples within groups | 32 | 748.75 | 0.42 | 13.0 |
| Among individuals within population samples | 989 | 3642.52 | 1.04 | 32.0 |
| Within individuals | 1027 | 1640.50 | 1.60 | 49.1 |
| Total | 2053 | 6568.88 | 3.23 | |
Table 7.
Genetic diversity at the regional level is quantified as the number of polymorphic loci among eight screened microsatellite loci, the number of gene copies (=2 × the number of individuals screened), and the mean number of alleles per locus with the standard deviation in parentheses.
Table 7.
Genetic diversity at the regional level is quantified as the number of polymorphic loci among eight screened microsatellite loci, the number of gene copies (=2 × the number of individuals screened), and the mean number of alleles per locus with the standard deviation in parentheses.
| Population | Number of Polymorphic Loci | Number of Gene Copies | Number of Alleles |
|---|---|---|---|
| Mobile Bay drainage | 6 | 118 | 4.00 (1.67) |
| Mississippi River | 8 | 318 | 14.75 (5.70) |
| Tennessee River | 8 | 592 | 17.63 (7.25) |
| New River | 8 | 738 | 23.25 (16.04) |
| Ohio River | 8 | 354 | 16.88 (8.54) |
| Great Lakes | 7 | 438 | 13.29 (0.77) |
Table 8.
Matrix of metrics of differentiation among groups of Walleye population samples: MB—Mobile Bay drainage; MR—Mississippi River; TR—Tennessee River; NR—New River; OR—Ohio River; and GL—Great Lakes. All FST values were significantly different from zero after the Bonferroni correction.
Table 8.
Matrix of metrics of differentiation among groups of Walleye population samples: MB—Mobile Bay drainage; MR—Mississippi River; TR—Tennessee River; NR—New River; OR—Ohio River; and GL—Great Lakes. All FST values were significantly different from zero after the Bonferroni correction.
| MB | MR | TR | NR | OR | GL | |
|---|---|---|---|---|---|---|
| MB | - | |||||
| MR | 0.233 | - | ||||
| TR | 0.233 | 0.043 | - | |||
| NR | 0.274 | 0.102 | 0.094 | - | ||
| OR | 0.244 | 0.072 | 0.050 | 0.030 | - | |
| GL | 0.305 | 0.074 | 0.027 | 0.115 | 0.067 | - |
Disclaimer/Publisher’s Note: The statements, opinions and data contained in all publications are solely those of the individual author(s) and contributor(s) and not of MDPI and/or the editor(s). MDPI and/or the editor(s) disclaim responsibility for any injury to people or property resulting from any ideas, methods, instructions or products referred to in the content. |
© 2023 by the authors. Licensee MDPI, Basel, Switzerland. This article is an open access article distributed under the terms and conditions of the Creative Commons Attribution (CC BY) license (https://creativecommons.org/licenses/by/4.0/).
Share and Cite
MDPI and ACS Style
Harris, S.C.; Palmer, G.; Stepien, C.A.; Hallerman, E.M. Population Genetic Differentiation of Walleye (Sander vitreus) across the Eastern Highlands of the United States. Fishes 2024, 9, 15. https://doi.org/10.3390/fishes9010015
AMA Style
Harris SC, Palmer G, Stepien CA, Hallerman EM. Population Genetic Differentiation of Walleye (Sander vitreus) across the Eastern Highlands of the United States. Fishes. 2024; 9(1):15. https://doi.org/10.3390/fishes9010015
Chicago/Turabian StyleHarris, Sheila C., George Palmer, Carol A. Stepien, and Eric M. Hallerman. 2024. "Population Genetic Differentiation of Walleye (Sander vitreus) across the Eastern Highlands of the United States" Fishes 9, no. 1: 15. https://doi.org/10.3390/fishes9010015