Article

Biomass Quantification of the Critically Endangered European eel from Running Waters Using Environmental DNA

by
Sara Fernandez
1,
Álvaro Gutiérrez
1,
Dumas Deconinck
1,
Jose Luis Martinez
2,
Almudena Alvarez
3,
Isabel Marquez
3,
Gonzalo Machado-Schiaffino
1,*,† and
Eva Garcia-Vazquez
1,*,†
1
Department of Functional Biology, University of Oviedo, 33006 Oviedo, Spain
2
DNA Analysis Unit, Scientific-Technical Services, University of Oviedo, 33071 Oviedo, Spain
3
Centro de Experimentación Pesquera, Dirección General de Pesca Marítima, Consejería de Medio Rural y Cohesión Territorial del Principado de Asturias, Escuela de Formación Profesional Naútico Pesquera 2ª Planta, Avda, Príncipe de Asturias 74, 33212 Gijón, Spain
*
Authors to whom correspondence should be addressed.
These authors contributed equally to this work.
Fishes 2023, 8(6), 279; https://doi.org/10.3390/fishes8060279
Submission received: 28 March 2023 / Revised: 17 May 2023 / Accepted: 22 May 2023 / Published: 24 May 2023
(This article belongs to the Special Issue Biology and Ecology of Eels)

Abstract

:
The European eel Anguilla anguilla is a critically endangered catadromous species. There is an urgent need for close surveillance of the populations that are still viable in European rivers. The species is difficult to observe in freshwater because of its bottom-dwelling behavior; the currently employed methods of eel monitoring in Europe based on the physical capture of individuals are stressful and may cause mortality. Here, we present a new highly sensitive method based on an A. anguilla-specific qPCR marker designed within the cytochrome oxidase I mitochondrial gene for application on environmental DNA (eDNA). Since the detectability of eDNA depends on the hydrographic conditions, we applied correction for altitude and a linear model and were able to predict the eel biomass from the eDNA in the different rivers of northern Spain still holding wild populations. The method was validated by electrofishing surveys. This novel eDNA-based marker allows for estimating the European eel biomass in running waters from small 1.5 L water samples and could complement, or replace in some cases, current eel surveys without disturbing wild populations.
Key Contribution: This is a new molecular marker to estimate Anguilla anguilla biomass from water samples in running rivers by using qPCR. The quantity of environmental eel DNA measured is corrected by the river hydrography for a more accurate estimation.

1. Introduction

European eel (Anguilla anguilla) populations have been threatened by anthropogenic activities during the last decades. Populations were reduced by 80% across the species’ distribution range, from Norway to North Africa, in the 1980s [1], principally due to habitat losses for the construction of river barriers and overexploitation [2] as well as due to the presence of Anguillicola crassus, a nematode that parasites the species, causing injuries in the swimbladder that impede migration [3]. Catalogued as critically endangered by the IUCN since 2007 [4] and declared out of safe biological limits by the International Council for the Exploration of the Sea (ICES), actions are needed to maintain the still-viable populations [5].
European eel has a complex life cycle that involves a challenging 5000 km migration from the Sargasso Sea, where they spawn at a depth of 250 m, to the European rivers where they feed until maturity to a return to reproduce back in the Sargasso Sea [6]. Thus, they face a variety of threats from the sea to the rivers. Given the wide latitudinal range of the species’ distribution, management involves different countries. Of enormous ecological, economic, and cultural importance [5], the European eel is a target of professional and recreational fishing in Europe and Northern Africa [7]. Mitigation actions to avoid stock depletion include reducing fishing quotas, restocking, river habitat improvement, and the removal of river barriers [2]. However, the conservation measures in practice as well as the monitoring techniques vary a lot depending on the local stakeholders [8].
European legislation mandates that eel mortality is reduced and that new sampling techniques are incorporated to monitor and facilitate an efficient management of the species [9]). However, the lack of the standardization of monitoring methods across countries makes the management of the European eel very complex [10]. In Spain and other countries, the most-employed technique to monitor eel populations is electrofishing [11], while other countries use fyke nets, mark and recapture, or tagging and telemetry for population surveys (as reviewed by [12]). All these methods require the fish to be extracted from the water, which is problematic because, like the majority of wild fish, this species is sensitive to human manipulation. Practices such as catch-and-release may encompass mortalities of 60% or higher [13], and electrofishing and fyke nets cause stress and increase post-survey mortality [12,14]. Therefore, non-intrusive monitoring techniques are urgently needed. However, it is not easy to find a method that is useful for all the life stages in different hydrological conditions. For example, high-frequency multi-beam sonar can be used to estimate the biomass of the large eels abandoning rivers during the escapement period [12], and video surveillance can serve to visualize fish and understand their behavior [15]; however, these techniques rely on good river conditions, so they are inaccurate in turbid waters with suspended material, and are not adequate to estimate the biomass of small juveniles.
In addition to the problems mentioned above, conventional methods such as electrofishing and fyke nets have limitations in detecting species at low densities [16]. This is the case of endangered species such as Anguilla anguilla, for which many populations remain at a low density after population declines, and, even in relatively large populations, the density is very low upstream [17]. In these cases, the use of environmental DNA (eDNA) for species detection has advantages over individual sampling [18]. The eDNA-based methodology is a noninvasive technique that does not disturb endangered populations [19], is highly efficient in detecting scarce or evasive species [20], and can be used in river areas where electrofishing is not feasible such as those under a high current speed or in deep ponds [21]. The use of eDNA was proposed as a complement to or substitute for traditional methods such as electrofishing [22]. Some countries, such as Japan, several EU countries, the UK, and the US, incorporated this technology into their governmental monitoring programs [23]. However, it is still necessary to test the tool before its incorporation into a new program, in order to determine its limitations and to know how to interpret the obtained results. In order to perform this, it is highly advisable to follow the recommendations by [24] as much as possible, such as by reporting the primer sequences and design, detecting the target species from the environmental DNA, and disclosing the filter type and pore size.
In the North American congeneric Anguilla rostrata, which has a similar life cycle and latitudinal distribution range, the use of eDNA was encouraged to assist with population assessments and guide conservation efforts [25]. A quantitative PCR marker for application on eDNA was further described for the assessment of North American eel populations [26]. Regarding the European eel, two qPCR markers were published for the detection of Anguilla anguilla from eDNA. Halvorsen et al. [27] targeted a DNA fragment within the mitochondrial cytochrome b gene and used the marker to study the occurrence of eels along rivers with different types and numbers of barriers in Norway; however, they employed the marker for eel detection and not to quantify eel biomass. Weldon et al. [9,10,27] conducted a survey in Irish lakes with eel populations of different sizes, comparing the results of a qPCR marker that was also developed within the cytochrome b gene with those obtained from fyke net surveys. The probability of the detection of eels using the eDNA marker was 83%, with eDNA concentrations generally associated with population size, which were lower in lakes with low eel populations [9]—although with no clear difference between high and medium eel populations. It is worth noting that this marker was not tested in rivers.
Halvorsen et al. [27] encouraged the development of eDNA methods that could quantify populations from running waters, for application in conservation efforts; Halvorsen et al. [28] developed a method to estimate haplotypes from water samples, although they are not yet able to quantify individuals. For community inventories from the presence/absence of metabarcoding data, eDNA has a spatial signal (upstream–downstream species distribution) comparable to that of local-capture-based methods [29]. However, using eDNA concentrations to estimate biomass in rivers cannot be accomplished in a straightforward way because the river hydrography may have a strong effect on the amount of eDNA that can be detected from water samples. Working with crayfish, Rice et al. [30] found a strong relationship between eDNA detection probability and upstream river distance, which was interpreted as the downstream transport of eDNA from upstream locations. River discharge is positively associated with the average length of downstream eDNA transport [31]; therefore, in streams with high discharges, eDNA rapidly runs downstream. Another intervening factor is the average flow velocity, which is inversely proportional to the eDNA concentration at a river point [32]. The influence of these factors is likely intertwined with the habitat preferences of the European eel in the river because the probability of eel occurrence increases with river size and water temperature (both being generally higher downstream than upstream) and decreases with the distance to the river mouth [17]. Correction for river hydrography is yet to be considered in European eel eDNA studies in running waters.
To fill the gap detected by Halvorsen et al. [27], in this study we developed a qPCR assay to detect and quantify eels’ eDNA from running waters and tested it in experimental tanks and in real river samples from the Asturias region in northern Spain (Figure 1), where electrofishing surveys are conducted as part of the governmental annual monitoring program. We validated this method in the field by comparing the eDNA results with electrofishing surveys, applying a simple correction to the eDNA concentration for the dependence of eDNA capture on river hydrography [30,31,32].

2. Material and Methods

2.1. Real-Time PCR Marker Design and qPCR Procedures

2.1.1. Primer Design

TaqMan primers and probe were designed to amplify a fragment from the mitochondrial gene cytochrome oxidase subunit 1 (COI) of Anguilla anguilla. National Center for Biotechnology Information (NCBI) nucleotide database was employed to download the sequences from A. anguilla and other related and cohabitant species in order to find a specific region allowing for the specific amplification of the target A. anguilla. PrimerExpress 3.0 (Applied Biosystems, Waltham, MA, USA) was the software employed for the design. BlastN tool (Basic Local Alignment Search Tool-N) was then used to check possible in silico cross-amplification. There was no in silico cross-amplification against the species present in the database. The primers and probe designed were as follows: ANG-Forward-5′-GGA GCT GGT ACA GGC TGA ACT G-3′; ANG-Reverse-5′-AGT GAG AAA ATT GTC AGG TCA ACA GA-3′; ANG-Probe: 5′-6-FAM TGG CTG GAA ACT TAG CCC ACG CC BHQ1-3′.
Amplification was assayed in vitro using tissue from A. anguilla. Other species that can be found in these and other European rivers, such as the fish Salmo trutta, Salmo salar, Carasius auratus, and Squalius caroliterti and the invasive gastropod Potamopyrgus antipodarum, were also assayed to check for possible cross-amplification.

2.1.2. qPCR

Amplification was performed using a 7900 HT Fast Real-Time PCR System (Life Technologies, Inc., Applied Biosystems, Carlsbad, CA, USA). It was carried out in a total volume of 25 μL containing 1X TaqMan® Environmental Master Mix 2.0 (Life Technologies, Inc., Applied Biosystems, Carlsbad, CA, USA), 6 μL environmental DNA, 0.5 μL of each primer, and the probe (10 μM). PCR standard conditions were 50 °C for 2 min and 95 °C for 10 min, followed by 40 cycles of 95 °C 15 s and 60 °C 1 min. Negative controls to monitor for contamination as well as extraction and filtration negative controls were included in the amplification. Three PCR technical replicates were amplified per sample. The standard curve was performed by serial dilution of DNA from European eel, of known concentration (72.8 ng/μL, from 10−1 to 10−6 serial dilution).

2.2. Validation of the qPCR Marker

2.2.1. Experimental Validation in Aquaculture Tanks

To determine the ability of the new qPCR assay as a quantitative method for the inventory of eel biomass from eDNA, an experiment using tanks with different biomass of eels was developed. A linear relation between the biomass of eels in a tank and the amount of eel eDNA is expected for low and moderate eel densities. In conditions of very high eel density and biomass, we expect a saturation of extraction and quantification methods due to excessive eDNA amounts. The experiment consisted of nine 60 L tanks that were filled with freshwater and supplied with oxygen. Anguilla anguilla individuals were acquired from Marina Eel company, weighed, and distributed among tanks.
The tanks were kept at 18 °C. Eels were left for a week and were not fed to minimize contamination from fishmeal. Water samples of 1.5 L were taken from each tank (three samples per tank as sampling replicates). For this, a sterile bottle was introduced 10 cm from the bottom, avoiding touching eels. Sterile gloves were worn and changed between tanks to avoid contamination. The water samples were preserved at 4 °C before filtration. All samples were filtered within 24 h after sampling.

2.2.2. Validation in Natural Rivers

The field validation in running waters was conducted in rivers from Asturias (northwestern Spain). The region is located in the center of the southern Bay of Biscay (Figure 1), which is one of the original distribution areas of Anguilla anguilla still holding eel populations [5]. The information was found from the Hydrographic Confederation of North Spain, https://www.chcantabrico.es/las-cuencas-cantabricas/marco-fisico/hidrologia/rios/piguena and https://www.chcantabrico.es/organismo/las-cuencas-cantabricas/marco-fisico/hidrologia/rios/dhc-occidental/-/asset_publisher/OFa1sWDJLb6J/content/rio-ponga for Pigüeña and Ponga, respectively, accessed on 1 March 2023). Pigüeña River’s head is at 1700 m over sea level, the basin is much larger (47.6 km until discharging in the main Narcea River, 404.46 km2), and the regime is regulated by three hydroelectric facilities, one of them upstream at La Riera site (Figure 1). The upstream part of the river is located within Somiedo Natural Park. Ponga River is smaller (head at 1500 m, 28.9 km) and runs free until discharging in the main Sella River. Data of discharge and flow velocity are not available for these rivers. The upper part where the sample was collected belongs to the Natural Park “Cabecera del río Ponga”. Relatively large populations of native salmonids (Atlantic salmon Salmo salar and brown trout Salmo trutta) occur in the two rivers.
In contrast to the experimental tanks, low amount of eel eDNA, mixed with eDNA from other species, is expected to be found in wild samples. Water samples from the same sampling points where eel biomass was previously estimated from electrofishing were employed for both qPCR and eel-specific end-time PCR validation.
The validation consisted of three steps.
1.
Correction for river hydrography
In our case study, we considered stream order (level of branching in a river system: 2–6 in the streams where this marker was validated, based on Strahler, 1957) as a proxy for river discharge and altitude—also associated with temperature and implying a steeper slope in these rivers—as a proxy for mean flow velocity. These two hydrographic features are inversely proportional to eDNA concentration at a river point [33] and are especially important here because the probability of eel occurrence is higher at lower altitudes and higher-order streams [18]. We checked the association of these variables with indicators of the amount of eDNA occurring at the sampling points: the total eDNA quantity (measured from QubitHS methodology as described above); positive PCR amplification using end-time PCR with universal primers; end-time PCR with eel-specific primers [21] that show the presence of specific eel eDNA. Quantitative eDNA data (in terms of Ct values) are corrected by the factor showing a higher correlation with total eDNA quantity.
2.
Correlational validation
The quantity of Anguilla anguilla eDNA from water samples is expected to be significantly correlated with eel biomass measured from the individuals captured in electrofishing sampling (see below), applying the correction defined in 1. This was accomplished in Pigüeña River.
3.
Predictive value of the new marker
Proof of concept to explore the applicability of the marker for routine surveys in different waters, where the eel eDNA from Ponga River is predicted from eel biomass using the curve equation estimated from Pigüeña River.
A regression with significant slope in (2), with the values corrected for hydrography according to results in (1), and eel eDNA quantity within the range estimated from that regression in (3) indicate that the new marker can be considered reliable for its use in the field.
In the river samples, additional markers amplified with end-time PCR (PCR) were assayed to check the effect of river hydrography (see below Section 2.4.1) on total eDNA detectability and to confirm lack of PCR inhibition.

2.2.3. Sampling Procedures in the Field

Water sample collection took place, combined with electrofishing surveys, during September 2021. The Pigüeña River (Asturias, Spain) was selected (Figure 1), where eels are annually monitored by electrofishing by the competent authority (Government of Asturias Principality). Pigüeña is a 46 km long mountainous stream tributary of Narcea River within Nalón-Narcea basin. Samples for the proof of concept were taken from Ponga River, a 25 km long tributary of Sella River.
The government of Asturias region has carried out periodical electrofishing at predetermined sites within a regional river monitoring network since 2011. Water samples for eDNA analysis were taken immediately before electrofishing (Table 1). Electrofishing was conducted by applying the same sampling effort in all the sites. Zippin’s method was used to determine eel density [34,35]. Three-pass electrofishing covering the whole river from bank to bank was completed at each sampling point, without replacement. Eels were taken out from the river with a handle net and placed in containers with water and air supply until the end of the electrofishing passes. The individuals were counted, measured, and weighed, before being released back into the same river area.

2.3. eDNA Analysis Procedures

2.3.1. Water Samples Filtration

Each sample of 1.5 L water was vacuum-filtered using filter membranes with a 0.22 µm pore size and a 47 mm diameter (Pall Corporation, Life Sciences, Ann Arbor, MI, USA). Filtering process was performed in a specialized laboratory separated from the main molecular facility to avoid contamination. Filtration apparatus, forceps, and surfaces were cleaned using 10% bleach solution between samples to avoid cross-contamination as much as possible. Filtration blanks of 1.5 L distilled water were filtered under the same conditions after each filtration process.

2.3.2. eDNA Purification

Power Water DNA Isolation Kit (Qiagen, Hilden, Germany), in accordance with the protocol of the manufacturer, was used to isolate eDNA from filters. Each filter was divided into two halves to perform the extraction. Then, both extractions were combined after the elution step. Extractions were quantified using Qubit™ dsDNA HS Assay Kit (Invitrogen, Carlsbad, CA, USA).) (Supplementary Table S1).

2.3.3. Inhibition Testing and Detection Probability

To check for potential presence of enzymatic inhibitors in the DNA extracts, a quantitative polymerase chain reaction (qPCR) assay targeting an internal positive control was carried out using Applied Biosystems® TaqMan® Exogenous Internal Positive Control Reagents (Thermo Fisher Scientific, Waltham, MA, USA). Amplification values for cycle threshold (CT; the first PCR cycle at which DNA is detected, with smaller CT values corresponding to higher DNA quantities) were compared between reactions containing 2 μL PCR grade water and reactions containing 2 μL of template eDNA. To enable an appropriate assessment of potential inhibition during subsequent steps, Taqman® environmental master mix 2.0 (ThermoFisher Scientific, Waltham, MA, USA) was used in all the performed qPCRs. Each qPCR was carried out in a 25 μL reaction volume containing 2.5 μL of 10× Exo IPC Mix and 0.5 μL of 50× Exo IPC DNA. The thermal cycle profile consisted of a hot start at 94 °C for 2 min, a denaturing step at 95 °C for 5 s, and an annealing step at 60 °C for 15 s for 40 cycles.
Detection probability (ρ) was calculated as demonstrated by Laramie et al. (2015). It is calculated based on the number of positive sampling replicates (ƞ = 0–3) divided by the total number of replicates per sampling point (N = 3).

2.4. End-Time PCR Markers Assayed on Field Samples

In addition to the new qPCR marker, two more markers were assayed in the field water samples. A universal marker was employed to confirm the presence of DNA in each sample, and an eel-specific marker detectable by end-time PCR [21] was used for comparison of its performance with the new marker.

2.4.1. Universal Marker

Universal primers were chosen to check for amplification success, as they can amplify DNA from a broad range of organisms and discard inhibition issues in the end-time PCR. The primers mlCOIintF (5′ GWACWGGWTGAACWGTWTAYCCYCC-3′) and jgHCO2198: 5′-TANACYTCNGGRTGNCCRAARAAYCA-3′) from Leray et al. [37], amplifying a 313 bp fragment within the cytochrome oxidase subunit 1 gene (COI), were also employed. End-time PCR reaction was performed with the same reagents using the following conditions: 95 °C for 5 min; 35 cycles of 95 °C for 1 min, 48 °C for 1 min, and 72 °C for 1 min; 72 °C for 5 min extension.

2.4.2. End-Time PCR Eel-Specific Marker

European eel species-specific primers from Burgoa Cardás et al. [21] were employed in end-time PCR using the eDNA samples (Forward-5′-GCT GTA TTA GTA ACC GCC GTT TT-3′, Reverse-5′-GCA GGA TCA AAG AAG GTC GT-3′). End-time PCR amplifications were performed in a total volume of 20 µL, including Green GoTaq® Buffer (1X), MgCl2+ (2.5 mM), dNTPs (0.25 mM), forward and reverse primers (1 µM), BSA (200 ng/μL), 0.65 U of TaqMan Polymerase (Promega®), and 4 µL eDNA. Amplification conditions were 95 °C for 5 min, 95 °C for 30 s, and 65 °C for 30 s and a final extension step at 72 °C for 7 min.

2.5. Data Analysis and Statistics

Variables employed in the analyses were as follows.
-
Stream order: The number defining the level of river branching at the considered sampling point. It is a discontinuous quantitative variable.
-
Altitude: Meters above sea level at each sampling point. It is a continuous quantitative variable.
-
Total eDNA quantity: The amount of eDNA in a sample, measured using HS Qubit Fluorometer. It is a continuous quantitative variable.
-
End-time PCR eel-specific marker: Using the primers described above from Burgoa Cardás et al. [21], it measures presence/lack of presence of eels’ eDNA (positive amplification/no amplification); thus, the primary variable is binary (0/1). It may be secondarily transformed into a discontinuous quantitative variable using the number of sampling replicates with positive end-time PCR amplification per sampling site (variation range 0–3).
-
End-time PCR universal marker: As in the previous case but using Leray et al. [37] universal primers instead of an eel-specific marker.
-
Eel eDNA quantity: CT values obtained when amplifying eel eDNA using the species-specific primers developed in the current study. It is a continuous quantitative variable.
-
Adjusted eel eDNA quantity: Amount of eel eDNA estimated from field samples as an extrapolation from the standard curve. It is a continuous quantitative variable. In the analysis of field results, CT values were preferred as a proxy to eDNA quantity estimations for being a fitter measurement for regression analysis.
To check the effect of river hydrography on eDNA detectability in the field case study, a multivariate multiple regression was performed with stream order and altitude as independent variables and the total eDNA quantity and positive PCR amplification using end-time PCR universal marker as dependent variables. Independent variables predicting the dependent ones were employed for the correction of eel eDNA quantity in field samples.
Best-fit model for the relation between eel biomass and eel eDNA as CT values (in experimental tanks and in field samples) was tested using Akaike information criterion procedure, and the corresponding equation was determined. Ordinary least squares regression was used to express linear relationships between pairs of variables, such as eel biomass and CT or eDNA quantity measured using Qubit. Homoscedasticity was tested using Breusch–Pagan statistics. Durbin–Watson test was employed to check for the presence of autocorrelation in the errors of regression models, in order to ensure the dataset met the conditions for regression analysis.
Pearson’s r was used to test for linear correlations between pairs of variables. Statistical analyses were performed using PAST software [38].

3. Results

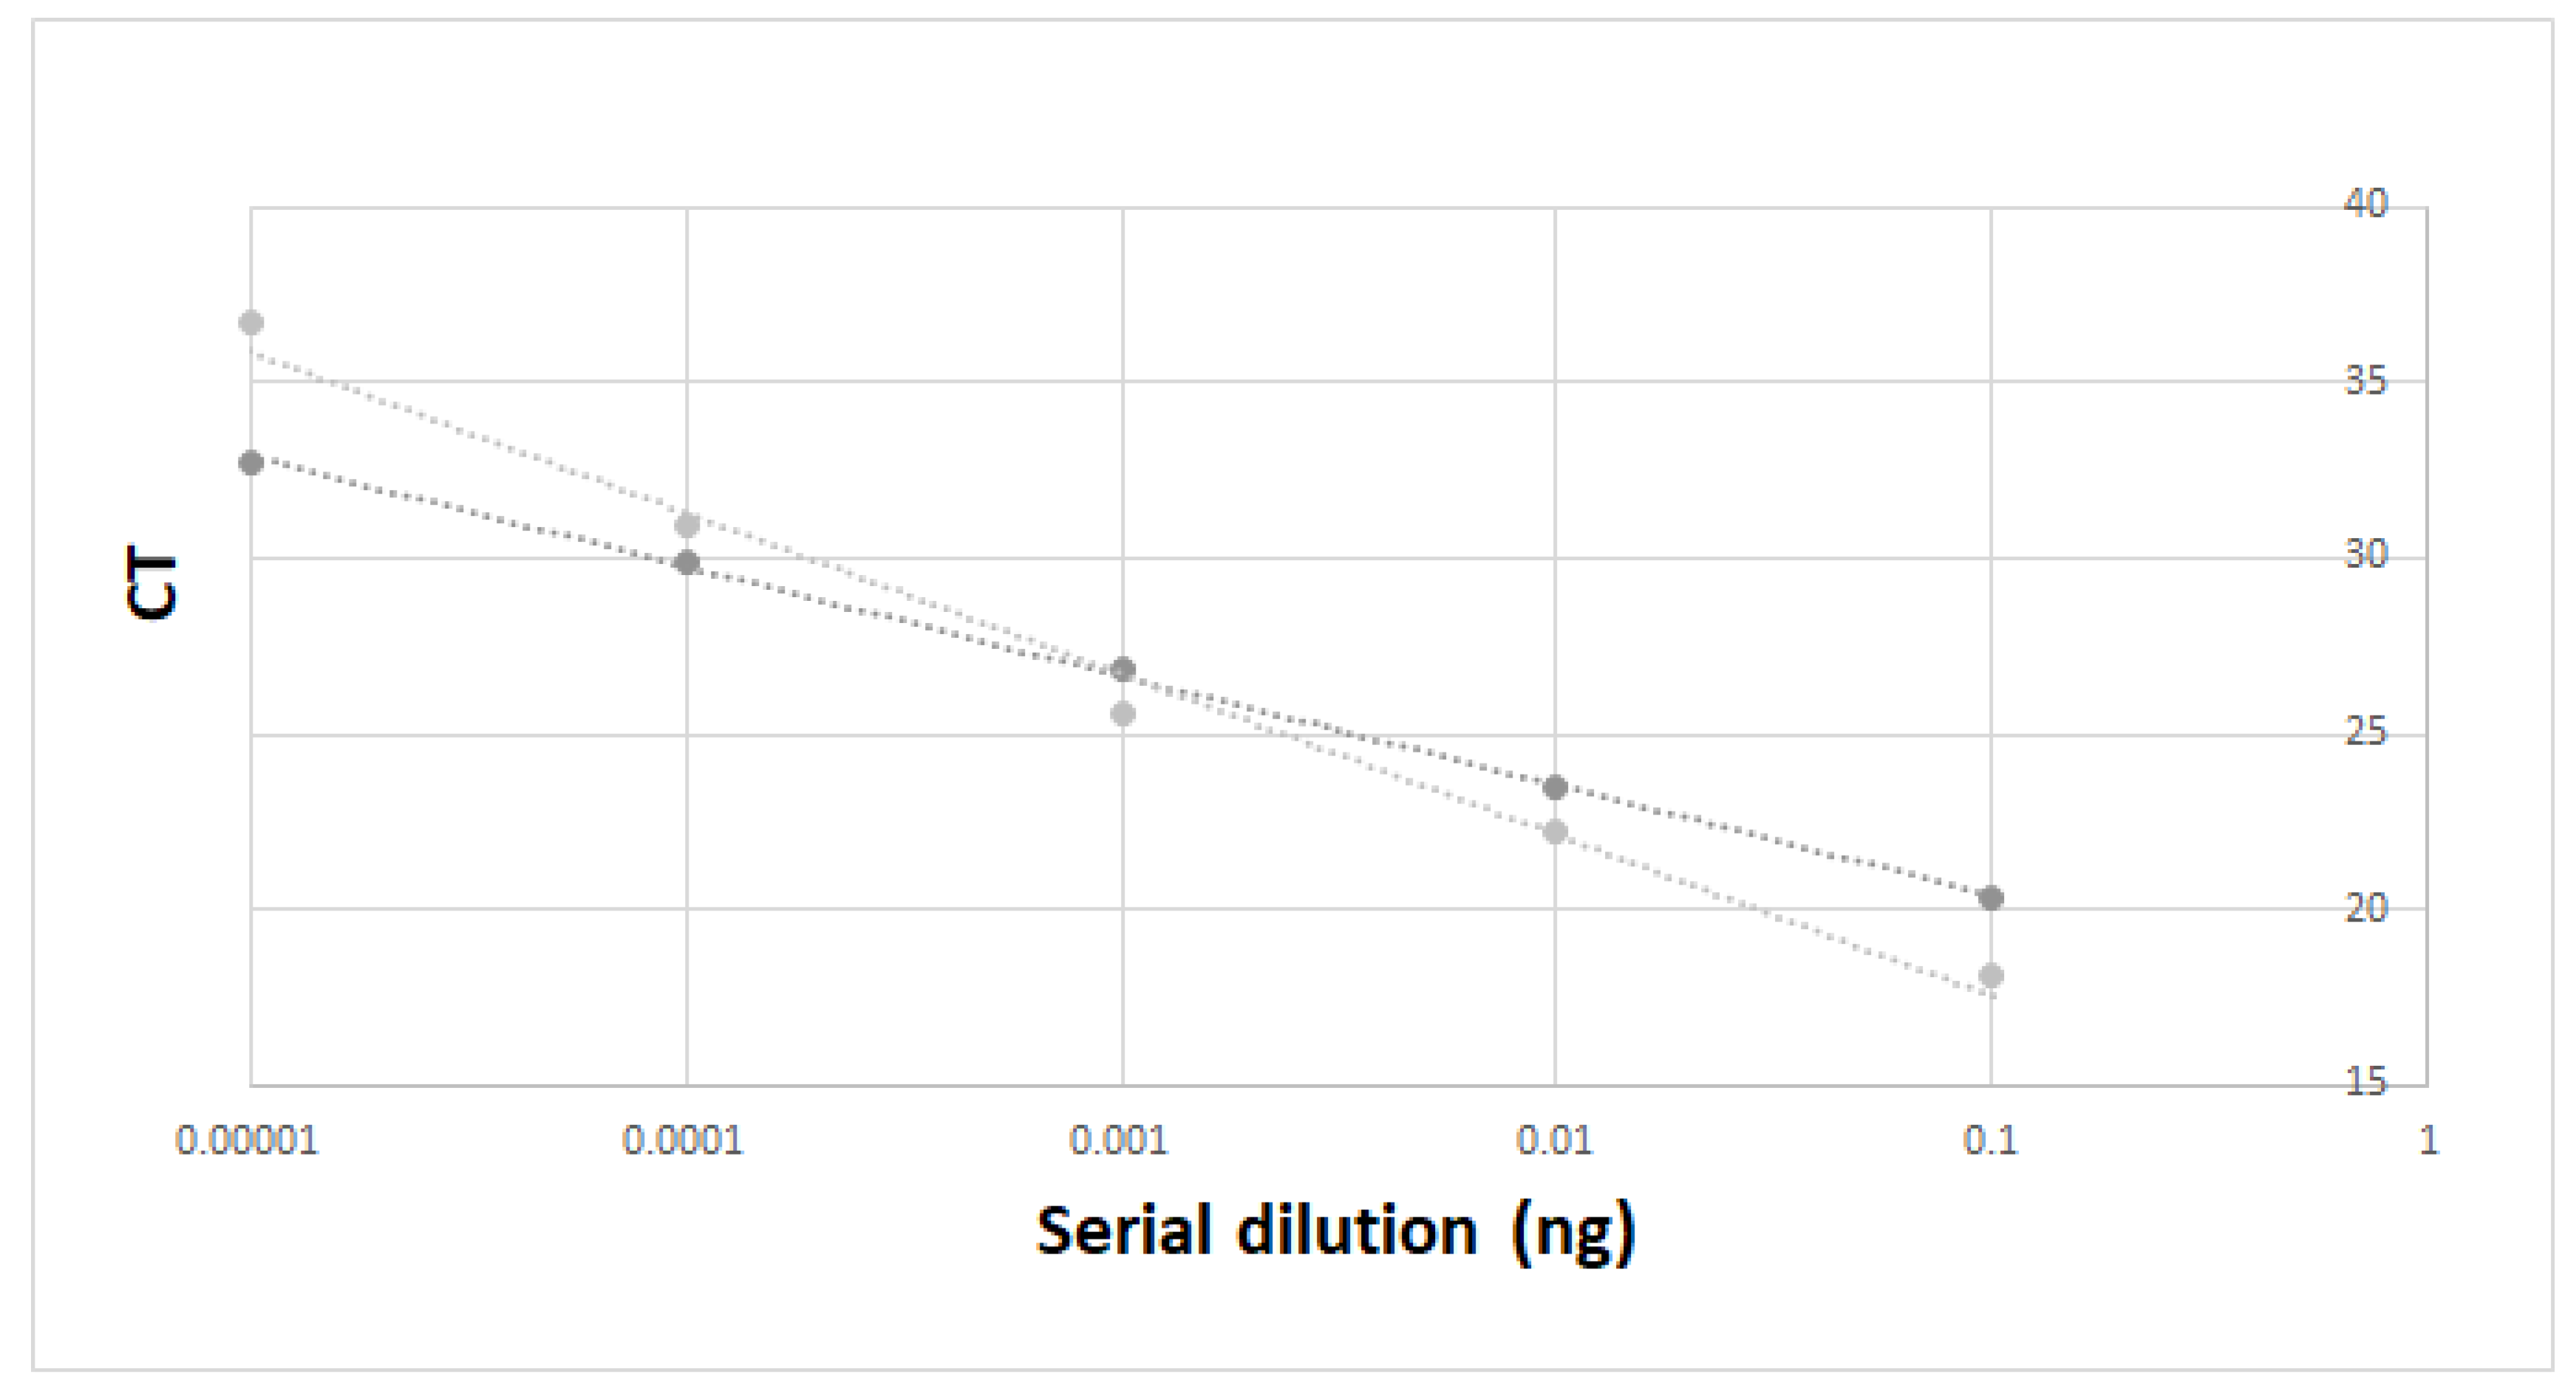
3.1. Primers Validation In Vitro and in Experimental Tanks

In vitro, no cross-amplification of the new marker was found with the DNA of any species that was tested.
In experimental tanks, the eel DNA quantity increased with the eel biomass up to a point where a saturation effect appeared (Table 2). Considering the nine tanks, the best-fit model for the adjusted DNA quantity means (Akaike IC = 11.45) corresponded to a power curve (positive with saturation) with the following equation:
y = 63.46x0.003 − 63.7
For CT means (Akaike IC = 11.48) the best-fit model was Michaelis–Menten (negative with saturation), with the following equation:
Y = 26.72x/(−1.976 + x)
Table 2. Tank experiment results. DNA quantity: amount of DNA (ng) measured by qPCR using the new markers. Eel biomass is expressed in grams.
Tank NumberBiomassNumber of IndividualsTank Sampling ReplicateCT MeanEels’ DNA Quantity Per Tank (ng)
T134.53A28.270.275
B28.810.176
C28.490.197
T280.574A27.040.508
B26.520.723
C26.700.651
T381.154A28.230.344
B28.290.286
C27.910.310
T4196.38A26.310.832
B27.310.465
C24.931.902
T5211.714A26.180.896
B26.740.691
C26.041.027
T6358.620A26.171.619
B26.101.772
C26.441.496
T7399.524A25.131.750
B26.860.608
C27.150.945
T8745.543A28.600.459
B28.680.392
C27.410.857
T9748.643A27.120.935
B27.580.778
C28.190.490
However, for further validation and the objective of applying this method in wild populations, we used the linear part of the curve before saturation, because it is extremely unlikely to find densities like those of tanks T8 and T9 (43 eels summing 750 g of biomass in only 60 L of water) in the wild.
Considering the part of the curve before saturation, that is, excluding the two tanks with the highest biomass T8 and T9 (Figure 2), a positive significant correlation between the eels’ DNA quantity in the tanks and the eels’ biomass was found (r2 = 0.485, p = 0.001). The Durbin–Watson statistic was 2.05 with p = 0.54 n.s. (no autocorrelation of errors), and the Breusch–Pagan statistic was 4.58 with p = 0.03 (no homoscedastic); thus, the conditions for regression analysis were not totally met. The equation of the linear regression was y = 0.003x + 0.239. For the estimation of eel eDNA from CT values, a significant negative correlation was found (r2 = 0.399, p = 0.002). In this case, the Durbin–Watson was 1.44 with p = 0.09 n.s., and the Breusch–Pagan was 0.00005 with p = 0.994 n.s., confirming homoscedasticity for this estimator. The equation was y = −0.005x + 27.919. For its adjustment to homoscedasticity, we used CT values as estimators of the eel eDNA quantity, with the higher CT value for the smaller eel eDNA amount.

3.2. Field Validation

3.2.1. eDNA Detection and River Hydrography

The three end-time PCR technical replicates of each sample gave the same result (positive or negative) for the two assayed end-time PCR markers.
DNA extracted from water samples (total eDNA) was quantifiable using Qubit for at least one water sample per site (one sampling replicate) in the Pigüeña River locations. Positive amplification from universal primers [37] was achieved for those water samples and two more (Table 3).
Positive amplification from end-time PCR eel-specific primers [21] was obtained from six samples, corresponding to three of the locations analyzed (none from Aguasmestas); in one of these samples that was positive for eel DNA, PCR amplification was not achieved using universal primers (Table 3). This means that eDNA was present in all the samples where PCR amplification was obtained with any of the two markers, even in samples where the amount of DNA was below the detection threshold.
Regarding the effect of the hydrographic river profile on the total eDNA, multivariate multiple regression indicated that both altitude (t = −4.28, p = 0.002) and stream order (t = −5.66, p = 0.0003) significantly predicted the total eDNA quantity detected from the water samples. The association was negative in the two cases, as expected given the higher water speed at higher altitudes and the higher water flow in the lower river reaches with a higher stream order; both water speed and flow are physical constraints for eDNA detection. This means that the eDNA results should be corrected by any of those hydrographic indicators that, at the same time, are normally correlated in free-flowing rivers such as the zone considered here (r = −0.93, p << 0.001).
As predicted, the positive amplification using the end-time PCR universal marker (binary variable) was significantly correlated with the amount of eDNA detected using Qubit in a sampling replicate (r = 0.68, p = 0.014). The samples with positive amplification from the end-time PCR eel-specific marker were not significantly correlated with the total eDNA quantity (r = 0.30, p = 0.35), as expected because eDNA belongs to the different species inhabiting a location, not only to eels.

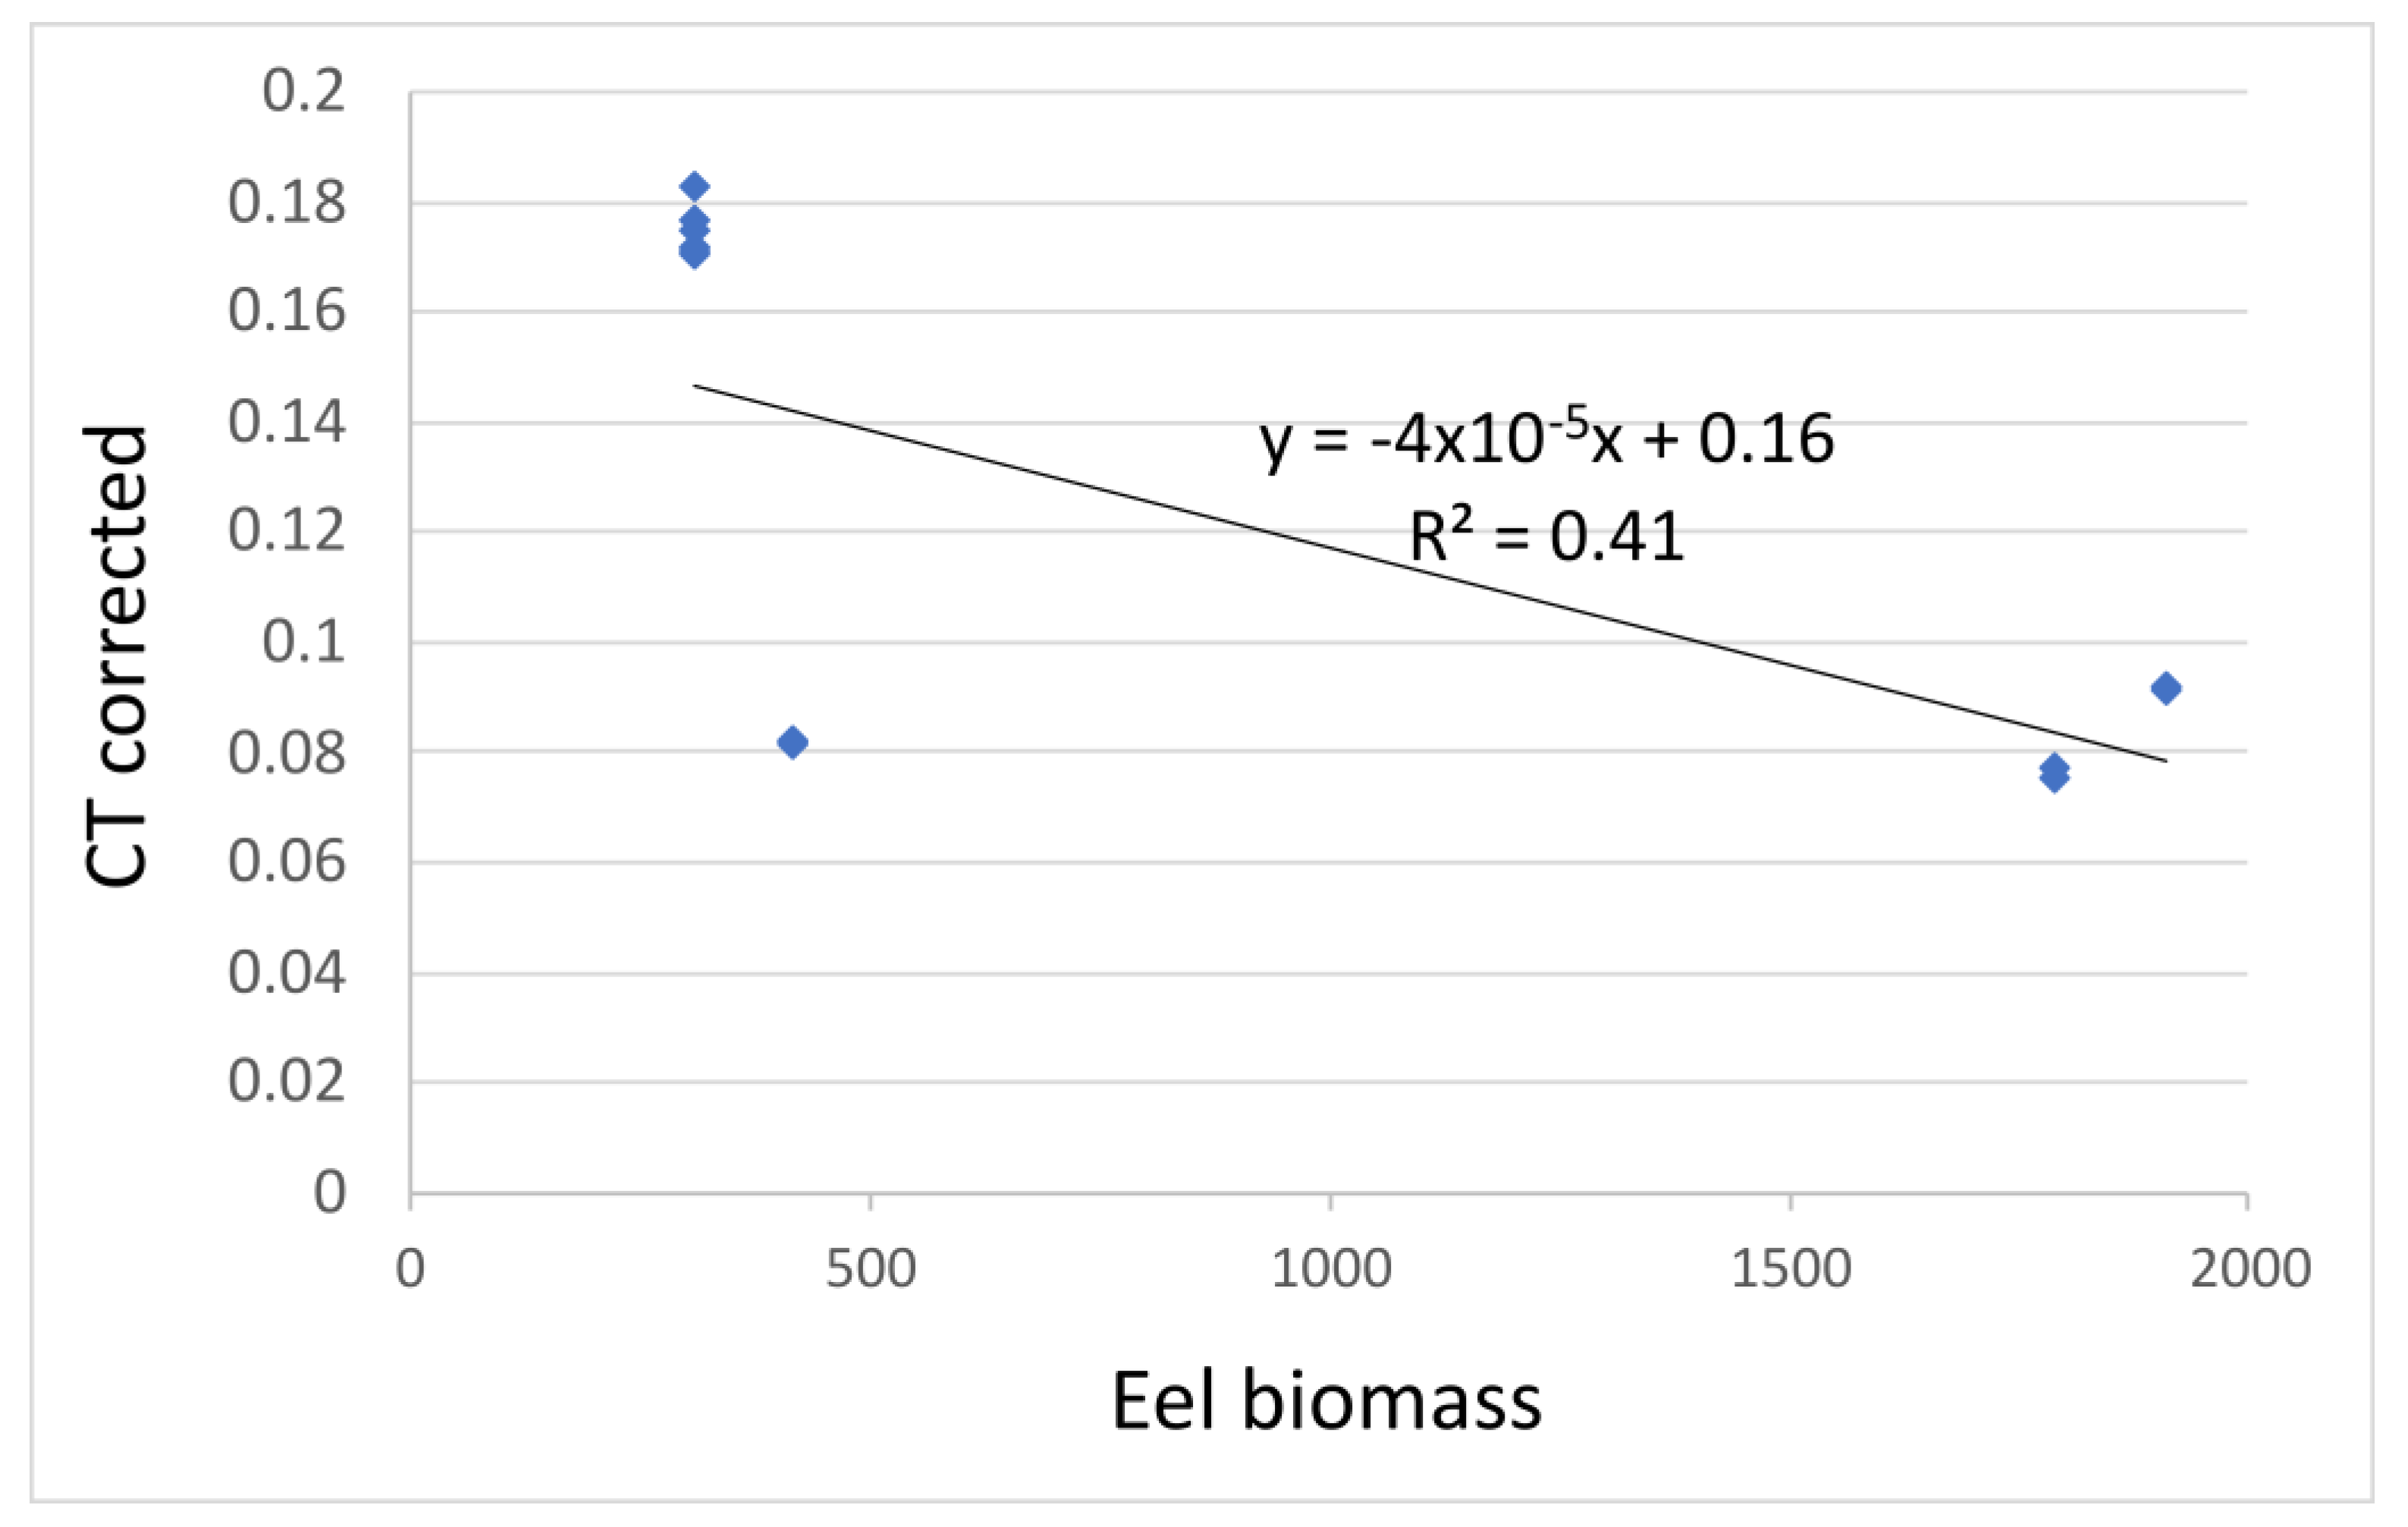
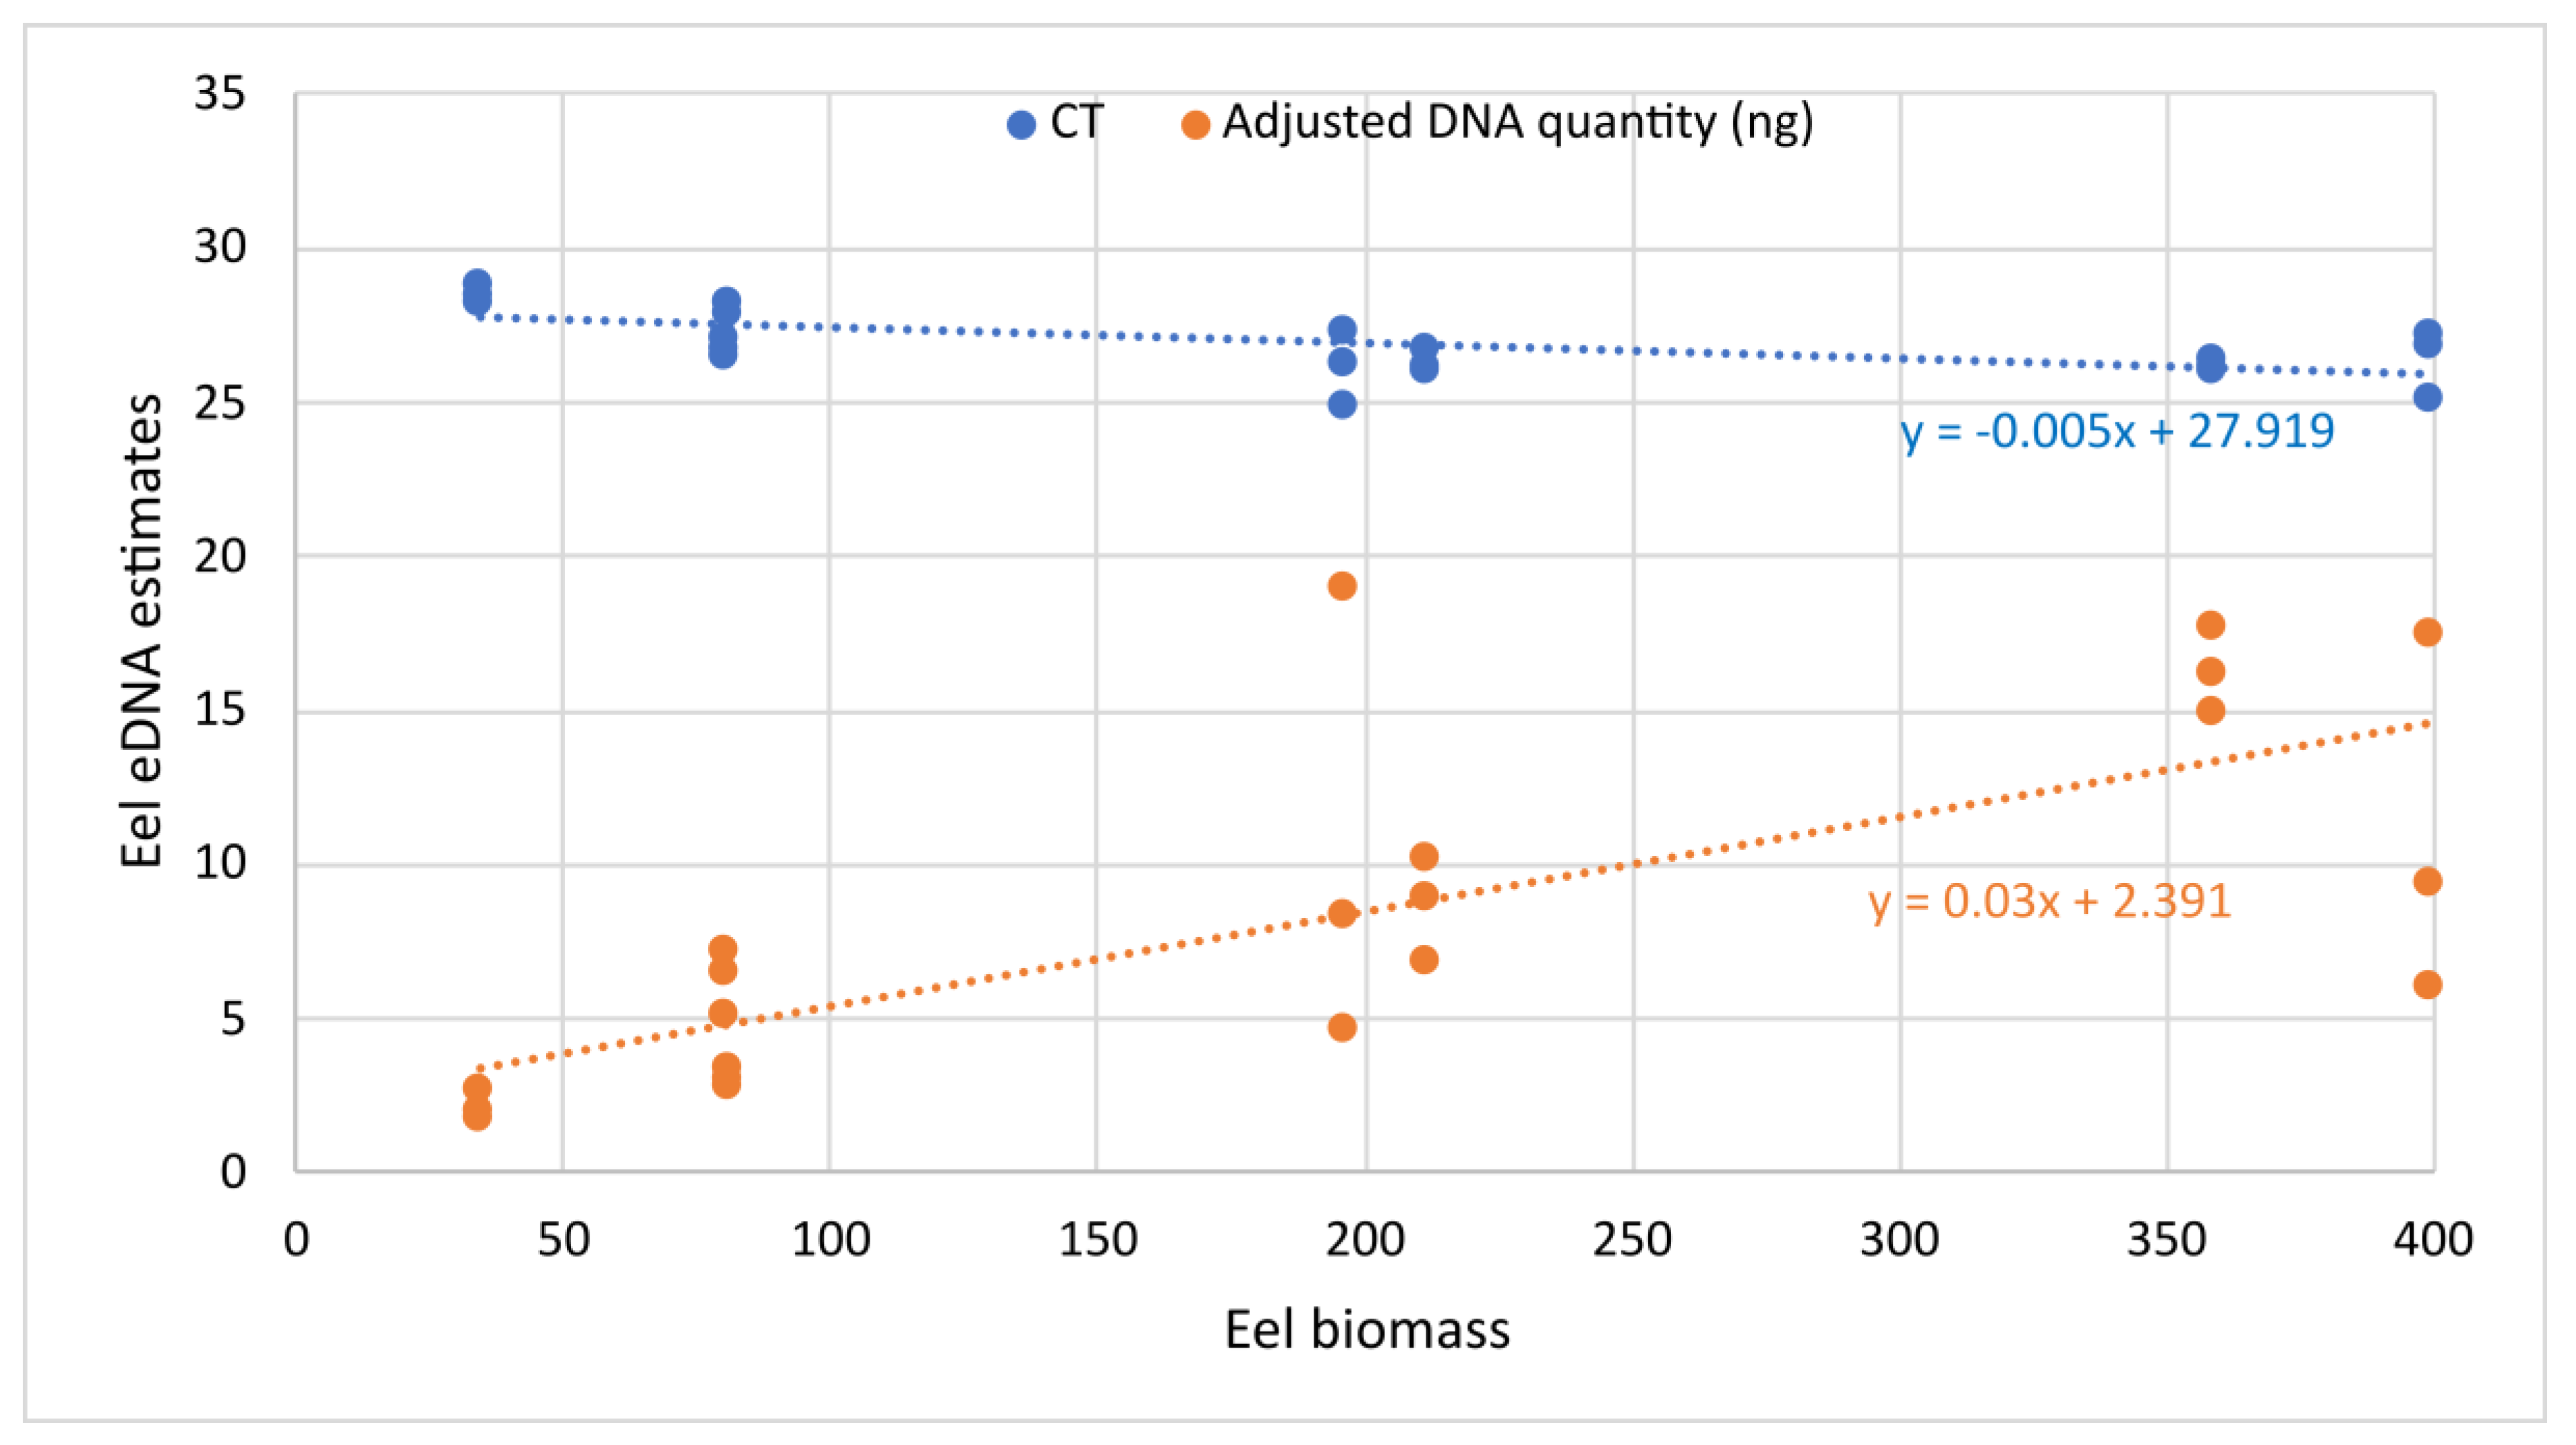
3.2.2. Relationship between Eel Biomass and Eel eDNA

In the river water samples, amplification was not detected in any of the negative controls, so no evidence of contamination was found. Furthermore, there was no evidence of inhibition (Supplementary Table S1).
The standard curves for A. anguilla fitted the equation y = −3.33x + 23.07, with R2 = 0.995 and y = −3.49x + 21.33, and with R2 = 0.986 for the two replicates (Figure 3). The limit of detection obtained was 2.42 × 10⁻⁵ ng/μL (LOD6).
European eel DNA was detected from qPCR at all sampling points, although not all the PCR technical replicates from each sample were positive (Supplementary Table S1; positive results shown in Table 4). Following the criteria already employed in similar studies [10,27,39], a sample was considered positive if at least one of the PCR technical replicates was positive. All sampling points in the Pigüeña River (n = 4) and Las Mestas in the Ponga River showed positive amplifications, reaching 100% detection rate for the locations and 73.3% for the water samples.
As expected from the results obtained from the total eDNA quantity and real-time PCR markers, multiple regression (adjusted multiple r2 = 0.49, p = 0.014) showed that the eel eDNA quantity measured with CT values was significantly predicted from the stream order (t = 2.45, p = 0.03, r2 = 0.12) and from the altitude (t = 3.27, p = 0.008, r2 = 0.32). From the stronger correlation, we chose altitude to correct the raw CT values, which were accordingly divided by altitude for further analysis.
A significant correlation (r = −0.64, p = 0.018) was found between the altitude-corrected CT, as the eel eDNA quantity estimator, and the biomass of the eels found by electrofishing (Figure 4). The relationship between the corrected CT as the dependent variable and the eel biomass was:
y = −4 × 10⁻⁵x + 0.1596
With 95% bootstrapped (N = 1999) confidence intervals (−6.288 × 10⁻⁵, −2.401 × 10⁻⁵) for the slope and (0.128, 0.196) for the intercept, the correlation between the corrected CT and the number of eels caught by electrofishing was also statistically significant (r = −0.667, p = 0.013; regression formula y = −0.001x + 0.159), as expected given the strong correlation between the number of eels and the biomass in this case study (r = 0.997, p << 0.001).
Figure 4. Linear regression showing the relationship between the biomass (in grams) of eels sampled by electrofishing and the CT obtained in qPCR-eDNA assay on Pigüeña River water samples. The equation and r2 are given.
Fishes 08 00279 g004

3.2.3. Predictive Value of the New Marker

In the Las Mestas (LM) location within the Ponga River (350 m above sea level), one sampling replicate of water sample LM2 (total eDNA quantity 0.162 ng/μL) and one of water sample LM3 (total eDNA 0.232 ng/μL) provided significant amplification in the qPCR, with CT values of 36.39 and 37.25, respectively. In these samples, no positive amplification was found from the end-time PCR using eel-specific primers, although the end-time PCR with universal primers was positive. The altitude-corrected CT values were 0.104 and 0.11 for LM2.3 and LM3.1, respectively.
From the eel biomass found in Las Mestas (x = 290 g), by applying the formula obtained for the Pigüeña River, we expected a corrected CT in the 95% range (0.11, 0.189). The values obtained from the water samples were in the lower part of the range.

4. Discussion

4.1. Overview of the Innovations of the New qPCR Marker

The qPCR assay designed here was successfully validated in controlled conditions and applied in river samples where Anguilla anguilla eDNA was detected and quantified. Despite the limited number of river sampling points, the detection probabilities found using the assay were very high, especially considering the small water volume that was analyzed (100% detection rate by location, based on only three water samples of 1.5 L). The tool was, therefore, useful for the detection of the species of interest. The sensitivity of the marker was similar in Weldon et al. [10], but the probability of detection was higher for the current assay (being 83% for Weldon et al. [10]); however, they employed lake samples, and the markers were not tested in mesocosm conditions. No limit of detection was reported in Halvorsen et al. [27]; thus, the sensitivity of the markers cannot be compared.
In addition to detection, it was possible to quantify the eels’ eDNA. Based on the experimental tanks, the linearity between the eels’ eDNA quantity and the eels’ biomass is lost once it reaches a certain level of DNA quantity. In any case, the density of eels and biomass per liter in Tanks 7 and 9 were much higher than any expected value in the field. This type of experiment provides information about the thresholds of new assays, but river conditions are very dissimilar to mesocosms, so other variables influence the DNA detection and quantification [24]. With the obtained formula for the controlled experiment in aquaculture tanks, we expected a range of raw CT values of (25.05, 28.14), if the 290 g of eels were living in 60 L tanks for several days. The obtained CT values were much higher, as expected for a wild population of eels living in running waters, with a much lower biomass density per liter of water. However, they were still detectable, highlighting the sensitivity of the marker. Moreover, one of the main novelties of this study was the capacity of eDNA concentration to predict eel biomass. Even if this case study was limited to a few sampling points (those determined by the resource managers in the network of eel surveys in the region), and a very simple correction for altitude was made, the linear regression was sufficient, principally due to the fact that the eel eDNA quantities in the field were far smaller than the saturation values found from the experimental tanks. After further refinement, considering other hydrographic factors and more sampling points, this method would meet the need of the quantitative population assessment from eDNA highlighted by Halvorsen et al. [27].
Local hydrographic conditions could explain the results of qPCR in Santullano, which seem to not fit the regression line shown in Figure 4 (with corrected CT values close to 0.08). Located upstream of the Pigüeña River (Figure 1), it was the field point over 400 m of altitude with the lowest density of eels measured by electrofishing (1.99 g of biomass and 0.08 individuals per square meter). However, at that particular point, the total amount of eDNA directly measured from Qubit was much higher than at the other points (Table 3), suggesting a somewhat lower flow velocity or discharge—thus, an easier eDNA capture—at that point in the moment of sampling.
Differences between the end-time PCR and qPCR results for eel-specific markers were found in this study, with a positive end-time PCR for six sampling replicates and a positive qPCR for nine. Although it is not possible to properly estimate the relative sensitivities of Burgoa Cardas et al.’s [21] marker and this qPCR marker in the field with the current data, the results from Aguasmestas in the Pigüeña River and Las Mestas in the Ponga River would suggest that the new qPCR marker is more sensitive, since end-time PCR was not positive in any sample from those sites, while qPCR was positive in two samples from each site. Similar results were found in rivers of the same region for trout eDNA, which was better detected from qPCR than from end-time PCR [40]. More data are needed to confirm this point, but the results obtained from the different species and markers would point to a higher sensitivity for qPCR.

4.2. Limitations of This Study

One of the limitations of the eDNA-based population surveys highlighted in the current study is the strong effect of river hydrography on the recovered DNA quantity. Both the altitude and stream order influenced the capacity to recover sufficient eDNA for the detection and quantification of eels, as water discharge and velocity did [37]. In population inventories based on electrofishing, this fact was also observed [17,41]. Different electrofishing efforts would be necessary to obtain representative samples depending on the altitude, flow, and other river features as well as on the density of eels. Therefore, eDNA sampling strategies must be adapted to this issue: a higher sampling effort and, thus, higher water volumes and more replicates, would be necessary when monitoring areas with lesser eel abundance and higher water flow and speed.
Another limitation of this study was the small number of sampled field sites, as commented above. Although we found a significant correlation between the eDNA and biomass estimated from electrofishing, by applying a simple correction of the CT values by altitude, it is worth noting that it could be much more accurate with more sampling points and larger water volumes [10,42,43,44]. Individual hauls are nearly impossible to replicate [45]; thus, not only a higher number of points but also replicates from the same location would be recommended.

5. Management Recommendations

The results obtained in this study reveal the potential utility of eDNA and the developed assay to monitor European eel (Anguilla anguillla) populations. It may replace some of the intrusive electrofishing and fyke net surveys, since it gives numerous advantages, especially because it is harmless and does not disturb any fish. Conventional monitoring using netting, trapping, etc., requires specific skills and resources that can be overcome by using eDNA.
More expensive eDNA-based techniques such as metabarcoding were previously employed to monitor fish species, for example in the assessment of barriers removal [46]. We propose including the novel eel-specific qPCR technique developed here in the monitoring programs of the European eel, as part of the toolkit for endangered species surveys. This allows for not only the detection but also relative comparisons of eel abundance in different river zones, once corrected for altitude, stream order, and/or any other indicator of river hydrography. This is crucial for management purposes, especially in hard-to-reach areas where electrofishing is not efficient.
For application of this new method in other European regions, further research would be needed, taking into account the enormous diversity of European rivers. The method was validated here in relatively small rivers in southern Europe. Although the marker seems to be highly sensitive, it should still be validated in large rivers and lakes. Moreover, given the high variation of biotic communities in Europe, the local biota should be considered for additional cross-amplification tests.

6. Conclusions

Here, we describe and validate, using experiments in tanks and in the field, a new tool for the quantification of European eel biomass from environmental DNA in running waters. After correction for river hydrography, this qPCR marker enables the prediction of Anguilla anguilla biomass from water samples. The newly validated eDNA-based approach could complement or even replace conventional surveys, as a new molecular toolkit for European eel monitoring programs.

Supplementary Materials

The following supporting information can be downloaded at https://www.mdpi.com/article/10.3390/fishes8060279/s1, Table S1: Raw data of this study showing variables measured from each sampling point. CT, values for the new eel-specific marker. CT-IPC means the CT values in the qPCR when amplifying the inhibition control.

Author Contributions

S.F.: conceptualization, methodology, formal analysis, and writing—original draft. Á.G.: methodology and review and editing. D.D.: methodology and review and editing. J.L.M.: methodology, review and editing, I.M.: methodology and review and editing. A.A.: methodology and review and editing. E.G.-V.: conceptualization, formal analysis, writing—review and editing, and funding acquisition. G.M.-S.: conceptualization, methodology, writing—review and editing, supervision, project administration, and funding acquisition. All authors have read and agreed to the published version of the manuscript.

Funding

This study was funded by the Government of the Principado de Asturias, Spain (contract numbers FUO-18-106, FUO-21-342, and IDI/AYUD2021/50967). S.F. holds a Margarita Salas Grant, with reference number AYUD/2021/58385.

Institutional Review Board Statement

The study was approved by the Research Ethics Committee of the Asturias Principality (Spain). Approval code: 101/16. Approval date: 15 July 2016.

Data Availability Statement

All the data employed in this study are available upon approval.

Acknowledgments

We would like to thank the technicians and staff of the Centro de Experimentacion Pesquera (CEP-Gijon).

Conflicts of Interest

The authors declare no conflict of interest.

References

  1. Feunteun, E. Management and Restoration of European Eel Population (Anguilla anguilla): An Impossible Bargain. Ecol. Eng. 2002, 18, 575–591. [Google Scholar] [CrossRef]
  2. Bevacqua, D.; Melià, P.; Di Milano, P. Assessing Management Plans for the Recovery of the European Eel: A Need for Multi-Objective Analyses. Am. Fish. Soc. Symp. 2009, 69, 637–647. [Google Scholar]
  3. Székely, C.; Palstra, A.; Molnár, K.; van den Thillart, G. Impact of the Swim-Bladder Parasite on the Health and Performance of European Eels. In Spawning Migration of the European Eel; Springer: Berlin/Heidelberg, Germany, 2009; pp. 201–226. [Google Scholar] [CrossRef]
  4. Jacoby, D.; Gollock, M. Anguilla anguilla. The IUCN Red List of Threatened Species; IUCN: Gland, Switzerland, 2014. [Google Scholar]
  5. Clavero, M.; Hermoso, V. Historical Data to Plan the Recovery of the European Eel. J. Appl. Ecol. 2015, 52, 960–968. [Google Scholar] [CrossRef]
  6. Aarestrup, K.; Økland, F.; Hansen, M.M.; Righton, D.; Gargan, P.; Castonguay, M.; Bernatchez, L.; Howey, P.; Sparholt, H.; Pedersen, M.I.; et al. Oceanic Spawning Migration of the European Eel (Anguilla anguilla). Science 2009, 325, 1660. [Google Scholar] [CrossRef] [PubMed]
  7. Dekker, W. The History of Commercial Fisheries for European Eel Commenced Only a Century Ago. Fish. Manag. Ecol. 2019, 26, 6–19. [Google Scholar] [CrossRef]
  8. Dekker, W. A Conceptual Management Framework for the Restoration of the Declining European Eel Stock. Am. Fish. Soc. Symp. 2009, 58, 3–19. [Google Scholar]
  9. European Union. Establishing Measures for the Recovery of the Stock of European eel in E Union. 1100/2007; European Union: Maastricht, The Netherlands, 2007. [Google Scholar]
  10. European Union. Official Journal of the European Union; European Union: Maastricht, The Netherlands, 2007; Volume 248, pp. 281–304. [Google Scholar]
  11. Weldon, L.; O’Leary, C.; Steer, M.; Newton, L.; Macdonald, H.; Sargeant, S.L. A Comparison of European Eel Anguilla anguilla eDNA Concentrations to Fyke Net Catches in Five Irish Lakes. Environ. DNA 2020, 2, 587–600. [Google Scholar] [CrossRef]
  12. Lobón-Cerviá, J.; Iglesias, T. Long-Term Numerical Changes and Regulation in a River Stock of European Eel Anguilla anguilla. Freshw. Biol. 2008, 53, 1832–1844. [Google Scholar] [CrossRef]
  13. Bilotta, G.S.; Sibley, P.; Hateley, J.; Don, A. The Decline of the European Eel Anguilla anguilla: Quantifying and Managing Escapement to Support Conservation. J. Fish Biol. 2011, 78, 23–38. [Google Scholar] [CrossRef]
  14. Weltersbach, M.S.; Strehlow, H.V.; Ferter, K.; Klefoth, T.; de Graaf, M.; Dorow, M. Estimating and Mitigating Post-Release Mortality of European Eel by Combining Citizen Science with a Catch-and-Release Angling Experiment. Fish. Res. 2018, 201, 98–108. [Google Scholar] [CrossRef]
  15. Nielsen, J.L. Scientific Sampling Effects: Electrofishing California’s Endangered Fish Populations. Fisheries 1998, 23, 6–12. [Google Scholar] [CrossRef]
  16. Ellender, B.R.; Becker, A.; Weyl, O.L.F.; Swartz, E.R. Underwater Video Analysis as a Non-Destructive Alternative to Electrofishing for Sampling Imperilled Headwater Stream Fishes. Aquat. Conserv. 2012, 22, 58–65. [Google Scholar] [CrossRef]
  17. Kanno, Y.; Vokoun, J.C.; Dauwalter, D.C.; Hughes, R.M.; Herlihy, A.T.; Maret, T.R.; Patton, T.M. Influence of Rare Species on Electrofishing Distance When Estimating Species Richness of Stream and River Reaches. Trans. Am. Fish. Soc. 2011, 138, 1240–1251. [Google Scholar] [CrossRef]
  18. Degerman, E.; Tamario, C.; Watz, J.; Nilsson, P.A.; Calles, O. Occurrence and Habitat Use of European Eel (Anguilla anguilla) in Running Waters: Lessons for Improved Monitoring, Habitat Restoration and Stocking. Aquat. Ecol. 2019, 53, 639–650. [Google Scholar] [CrossRef]
  19. Fernandez, S.; Sandin, M.M.; Beaulieu, P.G.; Clusa, L.; Martinez, J.L.; Ardura, A.; García-Vázquez, E. Environmental DNA for Freshwater Fish Monitoring: Insights for Conservation within a Protected Area. PeerJ 2018, 2018, e4486. [Google Scholar] [CrossRef]
  20. Thomsen, P.F.; Willerslev, E. Environmental DNA—An Emerging Tool in Conservation for Monitoring Past and Present Biodiversity. Biol. Conserv. 2015, 183, 4–18. [Google Scholar] [CrossRef]
  21. Jerde, C.L.; Mahon, A.R.; Chadderton, W.L.; Lodge, D.M. “Sight-Unseen” Detection of Rare Aquatic Species Using Environmental DNA. Conserv. Lett. 2011, 4, 150–157. [Google Scholar] [CrossRef]
  22. Burgoa Cardás, J.; Deconinck, D.; Márquez, I.; Peón Torre, P.; Garcia-Vazquez, E.; Machado-Schiaffino, G. New eDNA Based Tool Applied to the Specific Detection and Monitoring of the Endangered European Eel. Biol. Conserv. 2020, 250, 108750. [Google Scholar] [CrossRef]
  23. Lacoursière-Roussel, A.; Côté, G.; Leclerc, V.; Bernatchez, L. Quantifying Relative Fish Abundance with EDNA: A Promising Tool for Fisheries Management. J. Appl. Ecol. 2016, 53, 1148–1157. [Google Scholar] [CrossRef]
  24. Minamoto, T.; Miya, M.; Sado, T.; Seino, S.; Doi, H.; Kondoh, M.; Nakamura, K.; Takahara, T.; Yamamoto, S.; Yamanaka, H.; et al. An Illustrated Manual for Environmental DNA Research: Water Sampling Guidelines and Experimental Protocols. Environ. DNA 2021, 3, 8–13. [Google Scholar] [CrossRef]
  25. Thalinger, B.; Deiner, K.; Harper, L.R.; Rees, H.C.; Blackman, R.C.; Sint, D.; Traugott, M.; Goldberg, C.S.; Bruce, K. A Validation Scale to Determine the Readiness of Environmental DNA Assays for Routine Species Monitoring. Environ. DNA 2021, 3, 823–836. [Google Scholar] [CrossRef]
  26. Cairns, D.K.; Benchetrit, J.; Bernatchez, L.; Bornarel, V.; Casselman, J.M.; Castonguay, M.; Charsley, A.R.; Dorow, M.; Drouineau, H.; Frankowski, J.; et al. Thirteen Novel Ideas and Underutilised Resources to Support Progress towards a Range-Wide American Eel Stock Assessment. Fish. Manag. Ecol. 2022, 29, 516–541. [Google Scholar] [CrossRef]
  27. Moyer, G.R.; Bartron, M.L.; Galbraith, H.S.; Grassi, J.; Rees, C.B. Development and Validation of Two Environmental DNA Assays for American Eel (Anguilla rostrata). Environ. DNA 2023, 5, 175–190. [Google Scholar] [CrossRef]
  28. Halvorsen, S.; Korslund, L.; Gustavsen, P.; Slettan, A. Environmental DNA Analysis Indicates That Migration Barriers Are Decreasing the Occurrence of European Eel (Anguilla anguilla) in Distance from the Sea. Glob. Ecol. Conserv. 2020, 24, e01245. [Google Scholar] [CrossRef]
  29. Halvorsen, S.; Korslund, L.; Mattingsdal, M.; Slettan, A. Estimating Number of European Eel (Anguilla anguilla) Individuals Using Environmental DNA and Haplotype Count in Small Rivers. Ecol. Evol. 2023, 13, e9785. [Google Scholar] [CrossRef]
  30. Cantera, I.; Decotte, J.B.; Dejean, T.; Murienne, J.; Vigouroux, R.; Valentini, A.; Brosse, S. Characterizing the Spatial Signal of Environmental DNA in River Systems Using a Community Ecology Approach. Mol. Ecol. Resour. 2022, 22, 1274–1283. [Google Scholar] [CrossRef]
  31. Rice, C.J.; Larson, E.R.; Taylor, C.A. Environmental DNA Detects a Rare Large River Crayfish but with Little Relation to Local Abundance. Freshw. Biol. 2018, 63, 443–455. [Google Scholar] [CrossRef]
  32. Jo, T.; Yamanaka, H. Meta-Analyses of Environmental DNA Downstream Transport and Deposition in Relation to Hydrogeography in Riverine Environments. Freshw. Biol. 2022, 67, 1333–1343. [Google Scholar] [CrossRef]
  33. Carraro, L.; Hartikainen, H.; Jokela, J.; Bertuzzo, E.; Rinaldo, A. Estimating Species Distribution and Abundance in River Networks Using Environmental DNA. Proc. Natl. Acad. Sci. USA 2018, 115, 11724–11729. [Google Scholar] [CrossRef] [PubMed]
  34. Zippin, C. The Removal Method of Population Estimation. J. Wildl. Manag. 1958, 22, 82–90. [Google Scholar] [CrossRef]
  35. Zippin, C. An Evaluation of the Removal Method of Estimating Animal Populations. Biometrics 1956, 12, 163–189. [Google Scholar] [CrossRef]
  36. Strahler, A.N. Quantitative Analysis of Watershed Geomorphology. Eos Trans. Am. Geophys. Union 1957, 38, 913–920. [Google Scholar] [CrossRef]
  37. Leray, M.; Yang, J.Y.; Meyer, C.P.; Mills, S.C.; Agudelo, N.; Ranwez, V.; Boehm, J.T.; Machida, R.J. A New Versatile Primer Set Targeting a Short Fragment of the Mitochondrial COI Region for Metabarcoding Metazoan Diversity: Application for Characterizing Coral Reef Fish Gut Contents. Front. Zool. 2013, 10, 34. [Google Scholar] [CrossRef] [PubMed]
  38. Hammer, Ø.; Harper, D.A.T.; Ryan, P.D. PAST: Paleontological Statistics Software Package for Education and Data Analysis. Paleontol. Stat. Softw. Stat 2013, 105, 1352–1357. [Google Scholar]
  39. Laramie, M.B.; Pilliod, D.S.; Goldberg, C.S. Characterizing the Distribution of an Endangered Salmonid Using Environmental DNA Analysis. Biol. Conserv. 2015, 183, 29–37. [Google Scholar] [CrossRef]
  40. Fernández, S.; Rodríguez, S.; Martínez, J.L.; Borrell, Y.J.; Ardura, A.; García-Vázquez, E. Evaluating Freshwater Macroinvertebrates from EDNA Metabarcoding: A River Nalón Case Study. PLoS ONE 2018, 13, e0201741. [Google Scholar] [CrossRef]
  41. Lobón-Cerviá, J.; Rincón, P. Variations in the Populationdynamics of the European Eel Anguilla anguilla (L.) along the Course of a Cantabrian River. Ecol. Freshw. Fish. 1995, 4, 17–27. [Google Scholar] [CrossRef]
  42. Takahara, T.; Minamoto, T.; Yamanaka, H.; Doi, H.; Kawabata, Z. Estimation of Fish Biomass Using Environmental DNA. PLoS ONE 2012, 7, 3–10. [Google Scholar] [CrossRef]
  43. Pilliod, D.S.; Laramie, M.B.; MacCoy, D.; Maclean, S. Integration of EDNA-Based Biological Monitoring within the U.S. Geological Survey’s National Streamgage Network. JAWRA J. Am. Water Resour. Assoc. 2019, 55, 1505–1518. [Google Scholar] [CrossRef]
  44. Itakura, H.; Wakiya, R.; Sakata, M.K.; Hsu, H.-Y.; Chen, S.-C.; Yang, C.-C.; Huang, Y.-C.; Han, Y.-S.; Yamamoto, S.; Minamoto, T.; et al. Estimations of Riverine Distribution, Abundance, and Biomass of Anguillid Eels in Japan and Taiwan Using Environmental DNA Analysis. Zool. Stud. 2020, 59, 17. [Google Scholar] [CrossRef]
  45. Knudsen, S.W.; Ebert, R.B.; Hesselsøe, M.; Kuntke, F.; Hassingboe, J.; Mortensen, P.B.; Thomsen, P.F.; Sigsgaard, E.E.; Hansen, B.K.; Nielsen, E.E.; et al. Species-Specific Detection and Quantification of Environmental DNA from Marine Fishes in the Baltic Sea. J. Exp. Mar. Biol. Ecol. 2019, 510, 31–45. [Google Scholar] [CrossRef]
  46. Muha, T.P. Using EDNA Metabarcoding to Monitor Changes in Fish Community Composition After Barrier Removal. Front. Ecol. Evol. 2021, 9, 28. [Google Scholar] [CrossRef]
Figure 1. Map showing the rivers where the marker was validated in situ in the region of Asturias (southern Bay of Biscay, Spain). Sampling locations are marked with an asterisk.
Fishes 08 00279 g001
Figure 2. Linear regression showing the relationship between the eel biomass (g) per tank and the eel eDNA measured by qPCR, with the new marker in the linear part of the curve (before saturation) in experimental tanks. Eel eDNA estimates are CT and adjusted DNA quantity (ng*10 in the plot for better visualization). The equations are shown.
Fishes 08 00279 g002
Figure 3. Standard curve performance. Serial dilution and CT values as the axes. Regression lines are shown.
Fishes 08 00279 g003
Table 1. Sampling sites’ locations and results of the electrofishing surveys. Altitude in meters over sea level and stream order [36] are indicated. Total eel biomass is expressed in grams.
RiverLocation NameCoordinatesAltitude (m)Electrofishing SurfaceStream OrderEel BiomassEel Number
PigüeñaLa Riera43°09′09.0″ N; 6°15′12.3″ O480280 m23178974
PigüeñaSantullano43°09′57.4″ N; 6°19′01.1″ O430210 m2241817
PigüeñaAguasmestas43°10′31.2″ N; 6°18′00.5″ O400385 m24191072
PigüeñaBelmonte P. Industrial43°17′17.6″ N; 6°13′16.94″ O200455 m2631011
PongaLas Mestas43°10′10.8″ N; 5°10′37.9″ O350329 m242906
From each sampling point, three sampling replicates of 1.5 L water were collected using sterile plastic bottles. After collection, water samples were frozen until filtration. Researchers wore disposable gloves that were changed between sampling points to avoid cross-contamination.
Table 3. Results of eDNA quantification using Qubit fluorometer and end-time PCR amplification using universal [37] or Anguilla anguilla-specific primers [21] from the water samples analyzed in Pigüeña River. PCR amplification: 1 = positive; 0 = negative. The amount of total eDNA is expressed in ng/μL. ND, not detected.
LocationSampleTotal eDNA QuantityUniversal PrimersEel-Specific Primers
AguasmestasA1ND00
A2ND00
A30.04610
BelmonteB1ND10
B2ND01
B30.05211
La RieraLR10.03211
LR20.02611
LR3ND10
SantullanoS10.15810
S20.11411
S30.25511
Table 4. River water positive results obtained from qPCR employing the new marker. Adjusted DNA quantity: ng, estimated from the standard curve calibration.
LocationSampling ReplicatePCR ReplicateCTAdjusted Eel eDNA Quantity
AguasmestasA2A2.336.454.71 × 10−5
A3A3.136.718.08 × 10−5
BelmonteB1B1.136.588.84 × 10−5
B2B2.134.371.85 × 10−4
B2.334.962.71 × 10−4
B3B3.135.329.92 × 10−5
B3.234.222.06 × 10−4
B3.334.075.02 × 10−4
La RieraLR1LR1.136.116.22 × 10−4
LR1.337.136.05 × 10−5
SantullanoS1S1.335.221.06 × 10−4
S2S2.135.142.38 × 10−4
S3S3.235.251.00 × 10−4
Disclaimer/Publisher’s Note: The statements, opinions and data contained in all publications are solely those of the individual author(s) and contributor(s) and not of MDPI and/or the editor(s). MDPI and/or the editor(s) disclaim responsibility for any injury to people or property resulting from any ideas, methods, instructions or products referred to in the content.

