
The Threshold Effect of Overfishing on Global Fishery Outputs: International Evidence from a Sustainable Fishery Perspective

1
Department of International Business, National Kaohsiung University of Science and Technology, Kaohsiung 811213, Taiwan
2
School of Economics and Law, Tra Vinh University, Tra Vinh 87000, Vietnam
3
Agricultural Policy Research Center, Agricultural Technology Research Institute (ATRI), Taipei 106018, Taiwan
4
Department of Shipping and Transportation Management, National Kaohsiung University of Science and Technology, Kaohsiung 811213, Taiwan
*
Authors to whom correspondence should be addressed.
Fishes 2023, 8(2), 71; https://doi.org/10.3390/fishes8020071
Submission received: 20 December 2022
/
Revised: 19 January 2023
/
Accepted: 19 January 2023
/
Published: 24 January 2023
(This article belongs to the Special Issue Aquaculture Economics and Fisheries Management)
Abstract
:Using global fishery outputs from 62 countries during the period 2001–2020, this study applies the threshold panel data model of Hansen (2000) to empirically explore the nonlinear relations between the number of fishing vessels, fishers, and fishery production, with distinct overfishing stocks (overfishing) and fish caught by trawling or dredging techniques (trawling) as the threshold variables. Our findings show that the levels of fishery outputs could be increased by different combinations of primary factors, such as the number of fishing vessels and fishers. More specifically, when the number of fishing vessels and fishermen operating in countries with a high ratio of overfishing (overfishing > 4.4456) increased, their fishery outputs significantly increased as compared with countries with a low percentage of overfishing. As overfishing activities increase, they can result in significant shortages and imbalances of fishery resources, directly influencing fish biomass, biodiversity, and sustainability of fisheries, as well as making destructive fishing practices worse for marine ecosystems. Countries with a relatively high proportion of trawler net usage (trawling > 4.5516) would have significantly lower fishery outputs, as more fishing vessels are invested in them, compared with countries with a low proportion of trawling net use. This implies that trawler net usage is a non-sustainable fishing technique and harms fishery resources. The policy implications of this study indicate that taxing overfished species and implementing trawling regulations could significantly improve species richness and site-based abundance, thus helping to sustain fishery outputs.
1. Introduction
The production of food from the ocean has a crucial position in supply, provides resources, and ensures food security for our society [1,2], but human population growth has contributed to a decline in biologically sustainable fishing stocks, approximately from over 89% to under 70% in recent years. Specifically, marine fish consumption increased by more than 60% between 1990 and 2018 [3]. Regardless of the scenario, the global primary production and presence of top predators are anticipated to decline significantly [4,5]. An ensemble of ecosystem models predicts for a long period from 2006 to 2100 claim that fish biomass will decrease by an average of 17% under high emission conditions [6]. The effects of overfishing vary significantly between species and geographical areas [7,8].
The term overfishing refers to situations where insufficient fishing and defaunation result in declining fish populations [9]. High overfishing damages community structures and fish sizes, resulting from the selective harvesting of species and the bycatching of other species, along with habitat modification as a result of changes in biomass, species composition, and size structure [10,11,12]. The FAO [13] reported that more than 85% of global fish stocks are either overfished or fully exploited, and overfishing or lower biomass limits are responsible for the 40% reduction in Europe’s fish stocks [14,15]. Several fisheries in the European Union (EU) have a current fleet size and capacity that exceed sustainable levels by two to three times [16].
Overfishing reduces the adaptability of fish stocks and aquatic resources to climate change [15,17]. Moreover, overfishing is directly related to a variety of detrimental fishing practices, including illegal, unreported and unregulated (IUU) fishing, bycatching, and harmful subsidies [18,19]. Overfishing could occur if harmful fishing techniques such as bottom trawling are continued, as this destroys the ocean’s seafloor and affects both some species that are specifically targeted and those that are not [20,21]. Furthermore, harmful subsidies lead to overfishing by supporting fleets with excessive numbers, resources, and technology [18,22].
Therefore, the research objective of this study is to empirically investigate the threshold impacts of overfishing stocks (SDG14 overfishing) and fish caught by trawling or dredging techniques (SDG14 trawling) on global fishing outputs, by controlling for the number of fishing vessels, number of fishers, and national income.
2. Materials and Methods
Once fisheries are unable to keep up with the growing demand for fishery products, aquaculture has expanded and now exceeds fish production [13]. The more prominent role of aquaculture has resulted in more fish production, competition between wild and aquaculture fish production, and increased trade. The high demand for seafood products inadvertently creates opportunities for fishermen to overfish, due to the high economic value associated with maximizing the discounted value of present and future net benefits [23]. Overall, overfishing actions can cause a significant reduction in fishery outputs.
2.1. Study Area
In this study, we used a global fishing output database, covering 2001 to 2020, derived from the fisheries’ statistical yearbooks published by the FAO website https://www.fao.org/fishery/en/statistics, accessed on 17 August 2022. We have also collected data on sustainable development goal scores (SDG14) from the website https://dashboards.sdgindex.org/rankings, accessed on 17 August 2022. Finally, we obtained the GDP annual growth rate and poverty rate as control variables provided by the World Bank statistics (available website: https://databank.worldbank.org/source/world-development-indicators, accessed on 17 August 2022). We then aggregated the data to enable us to analyze the more specific target levels, which include the global fishery outputs and the goals of SDG14 (fish grabbed from overfishing or tumbled stocks and fish grabbed by trawling or dredging).
This study primarily focuses on the global fishery outputs from 2001 to 2020 using the data from 62 countries (see Figure 1). Overall, the fishery outputs caught in Asia fluctuated from 1,504,057 to 50,100,000 (tons of live weight). As shown in Figure 1, we found that Chinese fishermen caught an average of 50,100,000 tons of live fish each year, followed by Indonesia (8,326,168 tons), India (4,424,787 tons), and Vietnam (2,658,570 tons). There is an interesting difference between the fishery production in the Americas and Asia during the period 2001–2020. Asia region grabbed almost as much freshwater and anadromous fish, ranging from 18,314,993 to 47,260,766 tons live weight, in comparison to the Americas region’s 1,250,587 and 1,516,139 tons live weight.
Overfishing’s impact on global fishery outputs. Assemblage overfishing, a common phenomenon, refers to fishing down marine (or aquatic) food webs [10,24]. The phenomenon of “fishing down” is when fisheries target large fish in an ecosystem, and their abundance is reduced relative to that of smaller fish [25]. Additionally, overfishing has become increasingly evident, causing indirect changes in habitat structure and processes [26,27,28,29]. Overfishing is a longer-term issue that results from an imbalance between the resources used for harvesting (the resulting current level of output) and the resources required (corresponding output) for harvesting at an “optimal” scale. Overcapacity and excessive fishing inputs have been a leading concern around the world since the recent debate about managing fishing capacity began. According to the Code of Conduct for Responsible Fisheries proposed by The Food and Agriculture Organization (FAO), excessive fishing capacity threatens fisheries’ resources and their ability to sustainably provide catches as well as benefits to fishers and consumers. However, the FAO reported in Article 6.3 section and cautioned that “Nations could take steps to avoid overfishing and excess fishing capacity and implement management measures to ensure that fishing effort is adequate for the productive capacity of fishery resources and their long-term consumption.”
Overfishing and habitat destruction have depleted one-third of the world’s fish stocks [17]. Overexploitation has had long-term effects on marine ecosystems and poses severe risks to ocean health, such as biodiversity, food security, and coastal livelihoods and economies [17,30,31,32]. Overfishing frequently has significant environmental impacts [33,34], and has even been recognized as a driver of shifts in ecosystem regimes [35]. Overfishing directly impacts fish biomass, biodiversity, and the sustainability of fisheries, as well as exacerbating destructive fishing approaches’ impact on marine ecosystems (e.g., bottom trawlers). As a result of illegal, unreported, or unregulated fishing, overfishing is usually performed with high-impact fishing gear, such as bottom trawlers, which negatively affect the benthic substrate [36]. Overfishing activities over time can lead to a significant scarcity of aquaculture resources. Evidence shows that up to 70% of fish stocks in European waters are currently overfished, or at their lower biomass limits [37]. While some encouraging actions are being taken, several regulations have been implemented to control overexploitation. The buyback of fishing vessels, or the setting of tax rates by species in proportion to the extent of overexploitation, have been performed [38]. The level of tax related to overfished species should be determined by how much effort is being focused on each species—more severely overfished species will incur a higher rate [38]. Taxing overexploited fish species would increase the price for consumers, resulting in a reduction in fish consumption. In response to lower demand, processors and wholesalers offer fishers lower prices upon landing, resulting in lower fishing efforts.
Trawling or dredging. Trawling accounts for approximately 25% of the global capture of fishing [39], and it is increasingly being considered as an unsustainable fishing technique [40,41,42]. It has two impacts on benthic ecosystems. First, by disrupting epibenthic sediments, fishing gear causes losses of habitat complexity and the resuspension of sediments into the water column [43,44,45], leading to lower organic matter contents in sediments [46]. The second consequence of trawling is that it disrupts the structure of benthic communities by selectively removing large-bodied species, which results in small r-selected species dominating in benthic communities [21]. The management of fisheries and the preservation of aquatic life have long been affected by bottom trawling (BOT) [47,48]. BOT results in bycatching and the discarding of non-target species, such as endangered or protected species [49,50]. From 1950 to 2014, BOT accounted for 23% of landed marine catches and 60% of fisheries’ discards globally [51]. However, Roda et al. [52] showed that this percentage has dropped to 46% in recent years (2010–2014). Since most of its effects are felt in coastal waterways, pressure is being placed on those ecosystems [53,54]. A few countries prohibit bottom trawling because of the harm it causes to marine life [55,56]. For example, since 2013, Chinese policymakers have undertaken several steps to safeguard marine fisheries and tighten regulations on bottom trawling, such as prohibiting the authorization and production of bottom trawlers [56]. Additionally, the authorities of the Hong Kong Special Administrative Region also banned trawling to aid in the recovery of fishery resources and associated benthic ecosystems. Their findings indicate that a trawl ban can significantly improve species richness and site-based abundance, which implies that it is an efficient approach for conserving biodiversity in tropical coastal seas [20].
Sustainable development goal 14 (SDG14). The primary target of SDG14 is to protect and utilize the oceans, seas, and marine ecosystems sustainably. To accomplish this, all maritime stakeholders must participate in the various aspects of SDG14. Most efforts have been directed towards the first four targets: sustainable management, marine pollution, sustainable fishing, and ocean acidification. It has been more difficult to eliminate fishery subsidies, as stated in target 14.6.
SDG—Sustainable management. Sustainable development goal (SDG) 14.2 aspires to effectively manage and safeguard marine and coastal habitats, increase their resilience, reduce harmful effects, and attain productive and healthy oceans (United Nations, 2018). Management plans that consider all human activities are necessary if we are to achieve this aim. However, all these steps are administered by different entities, leading to extremely fragmented ocean management [57,58,59]. The project manager of marine resources is a critical contributor to ocean management. Most of these resources are managed via a specific species approach, which neglects interspecies interactions, habitat influences, and ecosystem dynamics, leading to overfishing, habitat damage, and changes in the aquatic community [60]. Integrating ecosystem-based management (EBM) into fisheries management is one efficient way to achieve comprehensive management [61,62,63]. Executing ecosystem-based management is a long-term goal that requires much more effort be applied at different levels. The fishing industry could provide a valuable input by participating in EBM discussions and decision making [64]. Bycatch and other effects of fishing represent additional avenues of engaging with this goal. Generally, the involvement in environmental management of fishing enterprises will be critical to restoring marine ecology and reducing overfishing [65]. While EBM has several benefits, implementation has been relatively slow due, primarily, to training challenges [62].
SDG—Subsidies. Subsidies aggravate the problem of overexploitation and fleet overcapacity. They are monetary payments made by the government to private recipients in the fishing industry [66,67]. According to Sumaila et al. [68] and Da-Rocha et al. [69], subsidized overcapacities can harm the marine environment in the long run, and directly impact its productivity. Sustainable Development Goal 14.6 aims to prevent subsidies that significantly exacerbate these problems (United Nations 2018). However, eliminating the use of harmful subsidies in the fishing industry is made complicated by political and social concerns. Thus, if the management institution is to address this issue, it may require the careful consideration of financing for income supplements and transitional measures to minimize immediate losses [70]. Research by Da-Rocha, García-Cutrín, Prellezo and Sempere [69] demonstrated that cutting subsidies leads to lower societal costs than anticipated. Diversifying and governing days at sea are two methods for reducing the number of vessels, a common strategy that the government could use to reduce harms and prevent overfishing [71].
2.2. Threshold Panel Data Model
The study examined the impact of overfishing on global fishery outputs, and the dependent variable is the fishing outputs. In order to reduce heteroscedasticity, logarithmic processing was performed, which referred to prior study [72]. Fishery outputs can be used to reflect the intensity of fishery resources’ development, and will be affected by many factors, such as the number of fishers, and sustainable development goal scores for ocean-related issues (SDG14).
The independent variables in this study are calculated by the logarithm of the number of fishing vessels (LogNFV) and the number of fishers (LogNF). In terms of control variables, we have utilized a dummy income variable (high income, lower-middle income, and upper-middle income). These data were obtained from the fisheries’ statistical yearbooks published by the FAO with time series data from 2001 to 2020. All variables are reported clearly in Appendix A.
Remarkably, the threshold panel data model put forward by Hansen (2000) was combined with the Log of SDG14 overfishing (the proportion of grabbed from overfishing or tumbled stocks (% of total catch)) and SDG14 trawling (the proportion of fish grabbed by trawling or dredging) as the threshold variables to evaluate the function parameters of fishery outputs. The single-regime threshold panel data model for cross-country panel data is represented in Equation (1), where ki stands for the threshold variables, λ1* stands for the optimal threshold value, and f(.) is an indicator function. If the relationship in (.) is true, then f(.) equals 1; otherwise, f(.) is 0. The parameters α1, α2, γ1, γ2, θ1, θ2, ξ1, and ξ2 are to be estimated:
where Log refers to the logarithm; GFOi is global fishing outputs as a proxy for fishing production performance (tons of live weight); (Technological progress)i,t presents time trend, represented as by the years between 2001 and 2020; NFVi,t is the global number of fishing vessels (motorized vessels propelled by engines); NFi,t is the global number of fishers; and Incomei is categorized into distinct levels (HIC = high income, LMIC = lower-middle income, UMIC = upper-middle income).
In this equation (Equation (1)), the threshold parameter λ (SDG14 overfishing and SDG14 trawling) as sample-splitting (or threshold) variables. The impact of technological progress, the number of fishing vessels, fishers, and income level on global fishery outputs will be α1 and α2 for countries with a low or high regime, respectively. It is obvious that under the hypothesis, α1 = α2; γ1 = γ2; θ1 = θ2; and ξ1 = ξ2 in the model.
Our estimate procedure compares the threshold model in Equation (1) to the linearity null hypothesis, H0: α1 = α2. The fact that the threshold parameter λ was not detected when the null hypothesis was kept caused a non-standard inference concern. Both Wald and Lagrange multiplier tests failed to follow their typical chi-square patterns [73,74]. Instead, conclusions are reached by generating Wald or Lagrange multiplier (score) statistics for each possible value of λ, and then making inferences based on the sum of the Wald or Lagrange multiplier potential λs. This statistic’s limiting distribution is non-standard and relies on several model-specific nuisance factors. Instead of tabulations, inferences are produced using a bootstrap model whose validity and features have been demonstrated by Hansen (1996). The slope parameters’ estimations come naturally as β(λ) and γ(λ) after an estimate of λ has been acquired (as the minimizer of the residual sum of squares computed over all possible values of λ). The failure of the test demonstrates that the threshold effect exists. Secondly, for robustness, we also follow the procedure proposed by Hansen [74] for investigating the possibility of multiple threshold effects. We posit the detailed hypotheses: the single threshold corresponds to the linear and single-threshold models (hypotheses H0 and Ha). In contrast, the double threshold equals single and double-threshold models (including hypothesis H0 and Ha), respectively, and so forth.
3. Results
3.1. Preliminary Analysis
The global fishery outputs in tons of live weight are reported in Table 1. Panel A of Table 1 demonstrates the mean value of variables by year regarding the global fishery outputs, the global number of fishing vessels, the number of fishers, SDG14 overfishing, SDG14 trawling, GDP growth rate, and poverty ratio for the years 2001 to 2020. Specifically, the average global fishery outputs ranged from 716,897 to 1,941,143 (tons of live weight). Connecting Panel C, we found that China’s highest average global fishing output was 50,100,000 (tons live weight), followed by Indonesia, India, and Vietnam with the mean value of 8,326,168, 4,424,787, and 2,658,570 (tons live weight), correspondingly. All remaining variables are shown in the details of Panel A and C. Panel B demonstrates the mean value of all variables by region, the global fishing outputs in the Southeast Asia region have a mean value of 5,535,225 tons live weight, which is the highest region in comparison to Africa and Oceania regions of 29,353 and 2829 (tons live weight), respectively. Interestingly, the percentage of overfishing in Oceania, the Middle East, North Africa, and South East Asia is higher than in the other regions. At the same time, Oceania, Europe, and Central Asia have the most remarkable rate of fishing by trawling and dredging. Other variables are clearly described in Panel B of Table 1.
We present the groups of species of the global fishery outputs by continent from 2001 to 2020 (see Appendix B: Groups of species from FAO by continent), including Aquatic Animals NEI, Aquatic Plants, Crustaceans, Demersal Marine Fish, Freshwater and Diadromous Fish, Marine Fish NEI, Molluscs excluding Cephalopods, and Pelagic Marine Fish. Specifically, fishery outputs in Asia almost related to Freshwater and Diadromous Fish (ranging from 18,314,993 to 47,260,766, tons live weight), in comparison to the Americas region (between 1,250,587 and 1,516,139, tons live weight) in grabbing Freshwater and Diadromous Fish. Furthermore, Demersal Marine Fish species range from 100,753 to 453,845 in Africa where European region shows fishery outputs between 116,212 and 205,799 (tons live weight). In terms of Aquatic Plants species and Molluscs without Cephalopods, the fishery outputs in Asia range from 10,781,141 to 34,916,316 (tons live weight) and between 9,219,565 and 16,158,709 (tons live weight).
Moreover, the species groups of worldwide fishing outputs by income classification based on the World Bank are shown in Appendix C. It found that lower-middle-income nations yield more freshwater and diadromous fish, ranging from 4,675,907 to 22,060,390 tons, compared to upper-middle-income nations’ 14,044,467 to 27,839,930 tons. According to Mollusks excluding Cephalopods, the value of upper-middle-income nations (8,350,940–15,231,576 tons) shows substantially higher than that of low-income countries (60,000–62,420 tons). Similarly, the outputs of Aquatic Plants in upper-middle-income countries present the highest in other countries, ranging from 8,423,150 to 21,075,219 tons.
Figure 2a shows that the nonlinear effects of overfishing (SDG14 overfishing) negatively impact global fishing outputs. Similarly, the results of trawling net (SDG14 trawling) negatively impact fishing outputs, which indicates that overfishing and trawling activities can lead to a decrease in the global fishery outputs (see Figure 2b).
3.2. Summary Descriptive Statistics
Table 2 demonstrates the descriptive statistics about the global fishing outputs, the global number of fishing vessels, the number of fishers, SDG14 overfishing, and SDG14 trawling for the years 2001 to 2020. Specifically, the average global fishing outputs were 10.754 (1,312,997 tons of live weight). We can see that China’s highest average global fishing output was 50,100,000 (tons live weight), followed by Indonesia with a mean value of 8,326,168 (tons live weight). The mean global number of fishing vessels was 9.047 (40,671 motorized vessels propelled by engines), while the average global number of fishers was 11.184 (559,292 number of fishers).
Regarding the sustainable development goals, the average value for SDG14 overfishing in the period 2001 to 2020 was 4.171 (68.619% of total catch). The countries with the highest proportions of total catch fish stocks were Bangladesh and Sierra Leone, with percentages of 98.273 and 98.253, respectively. Furthermore, the average SDG14 trawling was 4.361 (81.566% of fish caught by trawling).
The correlation matrix analysis for the variables employed in the analysis is presented in Table 3. The table demonstrates that the threshold groups (SDG14 overfishing; SDG14 trawling) are negatively associated with global fishery outputs. For example, the correlation between global fishery output and SDG14 overfishing is −0.563, whereas that between global fishery outputs and sustainable development SDG14 trawling is −0.205. In addition, the remaining variables (fishery fleet; global number of fishers; income levels) are positively correlated, whereby the correlation between global fishery outputs and number of fishing vessels is 0.601. The Pearson correlation result between SDG14 overfishing and upper-middle income is negative but insignificant, with a value of −0.0949, while at the same time, SDG14 overfishing is strongly positive with low-middle income of 0.304, GDP growth rate of 0.124, and the poverty rate of 0.296.
3.3. The Threshold Effect of Overfishing on Global Fishery Outputs
Table 4 displays the results of formula (1) using two distinct SDG14 threshold variables: overfishing and trawling. The bootstrap method with 5000 replications and a 15%-trimmed mean was utilized to estimate the p-value, which was used to assess the statistical significance of the threshold value. The bootstrap p-values demonstrate that the test of the no-threshold effect can be rejected in all models. Thus, we divided the sample into two distinct regimes. For example, in models 1 and 2, logarithm (NFV) is the global number of fishing vessels (motorized vessels propelled by engines) and logarithm (NF) is the global number of fishers, and the empirical results favor a threshold model. Based on model 1, an overfishing threshold of 4.4456 is estimated, with a 95 percent confidence level of 4.396–4.455. The finding implies that countries categorized as low-SDG14 overfishing clusters (i.e., having a low percentage of fish caught from overexploited groups) are those with threshold values of less than 4.4456, while those classified as high-SDG14 overfishing clusters are those with threshold values greater than 4.4456 (high percentage of fish caught from overexploited groups). Additionally, the threshold value for SDG14 trawling in model 2 has an estimate of 4.5516 and a 95% confidence range from 4.5077 to 4.5523. The finding implies that nations with threshold values below 4.5516 are categorized as belonging to the low-SDG14-trawling clusters (i.e., having a low percentage of fish captured by trawling or dredging), whereas nations with higher values are classified as belonging to the high-SDG14-trawling clusters (with a high rate of fish caught by trawling or dredging).
In Table 5, 1240 observations are grouped into two regimes. The first regime (SDG14 overfishing) gave 905 observations, and the second included the following 335 observations. The Lagrange multiplier test for no threshold was rejected. The overfishing threshold variable shows nonlinear statistically significant correlations with overall fishing outputs. Furthermore, to gauge the threshold effect, we presume that the single threshold corresponds to the linear and single-threshold models (hypotheses H0 and Ha). In contrast, the double threshold equals single and double-threshold models (including hypothesis H0 and Ha), respectively. The results for regime 1 (SDG14 overfishing ≤ 4.4456) show that with a higher number of fishing vessels and fishers (coefficient value of 0.412 and 0.623), global fishery outputs may significantly increase. Similarly, the income level and time period are also significantly positively related with fishing production. Specifically, the coefficients for income levels are as follows: high income = 4.017, lower-middle income = 0.951, upper-middle income = 2.221. The results for Regime 2 (SDG14 overfishing > 4.4456), on the other hand, indicate that with a higher number of fishing vessels, the number of fishers may significantly increase global fishery outputs. This finding maintains the sense, but the coefficient values of NFV (0.776) and NF (0.927) are significantly higher than in regime 1. Furthermore, the effects of high income level and time are nonexistent when SDG14 overfishing > 4.4456.
Regarding the result of the SDG14 trawling threshold estimation, there were 829 observations in regime 1 and 411 observations in regime 2. Similarly, the Lagrange multiplier (LM) test for no threshold thus rejected the null hypothesis. In other words, the global fishery outputs and the trawling threshold variable exhibit statistically significant nonlinear correlations. The results remains the same when using SDG14 overfishing. More precisely, a higher fishery fleet threshold (SDG14 trawling ≤ 4.5516) significantly increases the global fishery product (coefficient value of the number of fishing vessels = 0.728) compared with lower thresholds (SDG14 trawling > 4.5516; the coefficient value of the number of fishing vessels = 0.283). In contrast, the number of fishers with the threshold shown in regime 1 (SDG14 trawling ≤ 4.5516) increases the fishery outputs significantly less notably (coefficient value of the NF = 0.576) compared to using regime 2 (SDG14 trawling > 4.5516; the coefficient value of the number of NF = 0.599). According to the income level, and replicating the result of threshold SDG14 overfishing, in regime 1 (SDG14 trawling ≤ 4.5516), the income level and time positively affect global fishery outputs significantly less notably (high income = 4.400; lower-middle income = 1.932; upper-middle income = 2.515) than regime 2 (SDG14 trawling > 4.5516) (high income = 4.515; lower-middle income = 1.985; upper-middle income = 3.513). This is consistent with our expectation that countries with a high income level will drive greater demand for marine food, leading to increased global fishery outputs.
3.4. Additional Analysis by Controling for the Country GDP Growth and Property Rate
We add the GDP growth rate and poverty ratio for controlling variables and specify our second model (Equation (2)) as follows to generate new estimated threshold values.
Table 6 demonstrates the results of Equation (2) utilizing two distinct threshold variables of SDG14 overfishing and SDG14 trawling. The threshold value’s statistical significance was evaluated based on the p-value, estimated using the bootstrap technique with 5000 replications and a 15% trimming percentage. For an additional test, we divided our sample into two separate regimes. The point estimate of the threshold value of SDG14 overfishing is 4.4456, with a 95 percent confidence level ranging from 4.396 to 4.455 for Model 1. Besides, the threshold value for SDG14 trawling in model 2 has an estimate of 4.4038, with a corresponding 95% confidence interval from 4.1596 to 4.4073. Taken together, the number of fishers and fishing vessels in Table 7 keep the same results compared to baseline models (Equation (1)).
As shown in Table 7, interestingly, the results for regime 1 (SDG14 overfishing ≤ 4.4456) show that with a higher GDP growth rate (coefficient value of 0.164), global fishery outputs would be significantly increased, compared to SDG14 overfishing > 4.4456 (Regime 2), as GDP growth rate in these countries increases, their fishery production will reduce (coefficient value of the GDP growth rate = −0.274). We also duplicated the result of threshold SDG14 trawling in regime 1 (SDG14 trawling ≤ 4.4038) and found that the GDP growth rate positively affects global fishery outputs (coefficient value of 0.392) in comparison to countries with a high proportion of trawl net use (SDG14 trawling > 4.4038), meaning that fishery resources decrease significantly when using more trawling nets in countries.
In terms of the poverty rate for both threshold values of SDG14 overfishing and SDG14 trawling, we discovered that poverty rates are significantly negative to fishery outputs. This implied that as the poverty ratio in these countries increased, their fishery production decreased significantly compared with countries with a low proportion of overfishing and trawling. Overfishing and trawling net use are much more complex concerns in countries with high poverty ratios, and poverty drives poor fishers to deplete stocks far below levels at which bioeconomic balance would generally be reached.
4. Discussions
Regarding countries with a high proportion of overfishing activities (SDG14 overfishing > 4.4456), as the number of fishing vessels and the number of fishermen operating in these countries increased, their fishery production also increased significantly compared with countries with a low proportion of overfishing, but at the same time, this also led to an increase in overfishing or the presence of fish species lacking their required resources. Prior studies have proposed taxing overfished species or limiting the operation of fishing vessels as policy management tools [38,75,76,77]. Furthermore, implementing a wide range of policies such as subsidies and vessel buybacks has been suggested by Milazzo (1998) [78] as a “green subsidy”. The aim of the vessel buyback agendas is to lessen fleet overfishing, which improves the sustainability of the fishing industry and resource conservation [78]. Switching capacity-enhancing subsidies from fishing for reduced fish stocks to sustainable activities, such as promoting “fishing for plastic” instead of depleted fish stocks, is a high priority that would still allow fishers to receive subsidies [68].
On the other hand, in countries with a relatively high proportion of trawl net use (SDG14 trawling > 4.5516), as the number of fishing vessels increases in these countries, their fishery outputs are significantly reduced in comparison to countries with a low proportion of trawl net use, meaning that the use of trawl nets has a negative impact on fishery resources. For example, Hong Kong’s trawl ban policy, which aims to restore marine biodiversity and fisheries resources, offers an excellent opportunity to mitigate the adverse effects of trawling [79]. After two and a half years of trawling in Hong Kong waters, significant biodiversity improvements were shown [20,79]. Additionally, there have been attempts at implementing similar trawl bans in Canada and Italy, with mixed results [80,81].
We also found that in countries with a high overfishing ratio (SDG14 overfishing > 4.4456), such as low-income countries, fishery outputs are significantly higher than in middle-income and high-income countries, and specifically, low-income countries display a lower production of fishing vessels, often investing more manpower in increasing fishery production. The physical risk in fishery production will increase significantly and cause biodiversity to decrease and marine ecosystems to suffer damage. People suffer from fishery income and employment problems when the ocean ecosystem is damaged [82,83]. Furthermore, regarding countries with a high proportion of overfishing and trawling activities (threshold values: SDG14 overfishing > 4.4456; SDG trawling > 4.4038), as the GDP annual growth rate in these countries increased, their fishery production also decreased significantly compared with countries with a low proportion of overfishing and trawling, but at the same time, this also led to a decrease in overfishing and trawling net use. Interestingly, we also found that overfishing and trawling net use are much more complex problems in countries with high poverty ratios, and that poverty drives poor fishers to deplete stocks far below levels at which bioeconomic equilibrium would usually be achieved, which is consistent with prior studies [84,85]. Hence, providing appropriate fisheries management and alleviating poverty policies in these areas should be a priority, aiming to protect the vulnerable ecosystems in these regions [84,86].
Advances in science and technology enable humans to collect more data more quickly [87,88], and also to detect changes in the status of fish groups in a timely manner, so that they can be intervened in effectively. By using catch control principles, overfishing can be avoided when fish stocks decline, regardless of the cause of the decline. In the face of the problem of ocean productivity, it may be feasible to use a strategy such as this. Several areas of the United States already employ these types of fishing control principles [89]. In fact, fisheries have successfully used this method for capturing unstable stocks such as sardines and anchovies [90], as have fisheries focused on long-lived demersal fish [89].
International agreements, such as the Parties to the Nauru Agreement (PNA) ship-related scheme, have been used to regulate and control a variety of fish stocks (tuna) and thus reduce disputes and accommodate changes in fish populations and distributions. When the abundance or distribution of tuna changes, the quantity of tuna catch allocated to each PNA member country will change [91]; the catch allowance can also be shared between countries to avoid overfishing when the fish stocks change. In addition, there are precedents for compensatory payments (e.g., the US/Canada Pacific Salmon Treaty) and the trading of fishing rights (e.g., between Norway and Russia), which act as countermeasures between economic zones [92]. Introducing management systems or measures that encourage fishermen to reduce their catches of specific fish stocks can reduce the risk of fish stock depletion, ecosystem damage and fishery closures. For example, the change in the catch sharing system for bottom fish can reduce the fishing of endangered species [93].
5. Conclusions
Using panel data from 62 countries, this study applied a threshold panel data model to empirically explore the possible threshold effects of SDG14. It used distinct overfishing (SDG14 overfishing) and fish caught by trawling or dredging techniques (SDG14 trawling) as the threshold variables to examine the nonlinear interaction between the factors affecting the fishery fleet, fishers, and fishery outputs. Regarding overfishing and bottom trawling impacts, the study supports a single-threshold effect. The results demonstrate that various combinations of the primary components may enhance the levels of global fishery output (the number of fishers, fishing vessels, and income levels). The threshold value effect has various implications for fishermen regarding their fishing output.
The regime 1 results (low SDG14 overfishing) indicate that the numbers of fishery fleets and fishers, and income levels, positively increase fishery outputs, which effect remains the same when using the alternative threshold of SDG14 trawling. In regime 2 (high overfishing), the high income level and time factors are insignificant and inconsistent with baseline regression. In contrast, the other variables retain a similar level of significance, but their coefficient values are significantly greater than those of low fishing stocks. As for the threshold variable low bottom trawling, we find that the number of fishers, income levels, and time positively affect global fishery outputs slightly less significantly than in countries with high bottom trawling. In contrast, the result regarding fishing vessels is also significantly positive, but this coefficient is lower in cases with high trawling. This finding implies that countries with greater investments in trawl nets will endanger fishery resources due to the bycatching and discarding of non-target species; this is consistent with prior reports that bottom trawling accounted for approximately 23% of landed marine catches and 60% of fisheries’ discards globally, from 1950 to 2014 [50,51].
Finally, we discovered that in countries with high rates of overfishing, such as low-income nations, their fishery outputs are significantly higher than those of middle- and high-income countries. In particular, substantial investments in staffing or subsidies in low-income nations may lead to overfishing and impact global fishery production in the long term [94,95].
Author Contributions
Conceptualization, C.-V.P.; Methodology, J.-M.L.; Software, C.-V.P.; Validation, H.-C.W. and S.-H.C.; Formal analysis, H.-C.W.; Data curation, C.-V.P.; Writing—review & editing, J.-M.L.; Visualization, S.-H.C.; Supervision, H.-C.W. All authors have read and agreed to the published version of the manuscript.
Funding
This research received no external funding.
Data Availability Statement
Data available on request due to restrictions of privacy or ethical issue.
Conflicts of Interest
The authors declare no conflict of interest.
Appendix A. Definition of Variables

| Indicators | Definition | Measurement unit | Sources |
|---|---|---|---|
| Dependent variable | |||
| GFO | Global fishing outputs is the cultivation of aquatic organisms such as fish, mollusks, aquatic plants, and crabs. Farming requires specific rearing process interventions to improve production, such as frequent stocking, feeding, predator protection, etc., which pertain specifically to aquaculture products meant for final harvest for consumption. | Tons live weight | Food and Agriculture Organization of the United Nations (FAO) https://www.fao.org/fishery/en/statistics, accessed on 17 August 2022 |
| Threshold variables | |||
| SDG14 Overfishing | Fish grabbed from overfishing or tumbled stocks | % of total catch | Sustainable development reporting https://dashboards.sdgindex.org/rankings, accessed on 17 August 2022 |
| SDG14 Trawling | Fish grabbed by trawling or dredging | % of fish caught by trawling | |
| Countries control variables | |||
| NFV | The global number of fishing vessels is the number of boats or ships used to catch fish in the sea, on a lake, etc. | Number of motorized vessels propelled by engines | Food and Agriculture Organization of the United Nations (FAO) https://www.fao.org/fishery/en/statistics, accessed on 17 August 2022 |
| NF | Global number of fishers is the total number of people who work full-time in the commercial fishing industry in freshwater, brackish water, and marine habitats to capture and land all aquatic creatures and plants. | Number of fishers | |
| HIC | High income | Dummy variable | |
| LMIC | Lower-middle income | Dummy variable | |
| UMIC | Upper-middle income | Dummy variable | |
| Technological progress (Time trend) | Time takes values from 1 to 20 for years between 2001 and 2020: 2001 = 1, 2002 = 2, … 2020 = 20. | Number | |
| GDP growth rate | Gross domestic product annual growth rate | Annual percentage | World Development Indicators, The World Bank https://databank.worldbank.org/source/world-development-indicators, accessed on 17 August 2022 |
| Poverty rate | Proportion of poverty headcount at national poverty lines | Percentage of population | |
Appendix B. The Groups of Species of Global Fishery Outputs by Continent (Measurement Unit: Tons Live Weight)
| Continent | ASFIS Species | 2001 | 2002 | 2003 | 2004 | 2005 | 2006 | 2007 | 2008 | 2009 | 2010 |
|---|---|---|---|---|---|---|---|---|---|---|---|
| Africa | Aquatic Animals NEI | - | - | - | - | - | 1 | 1 | 1 | 1 | 1 |
| Africa | Aquatic Plants | 83,592 | 117,188 | 105,561 | 79,492 | 81,158 | 88,530 | 96,267 | 119,311 | 114,132 | 138,329 |
| Africa | Crustaceans | 32 | 32 | 15 | 10 | 12 | 7 | 8 | 12 | 12 | 4 |
| Africa | Crustaceans | 5824 | 8411 | 8570 | 7884 | 11,919 | 10,587 | 9644 | 9242 | 3968 | 5701 |
| Africa | Demersal Marine Fish | 100,753 | 118,054 | 142,292 | 139,912 | 168,590 | 234,809 | 256,915 | 223,014 | 227,051 | 164,650 |
| Africa | Freshwater and Diadromous Fish | 297,489 | 324,675 | 366,077 | 408,994 | 463,477 | 506,358 | 550,954 | 706,978 | 754,869 | 1,112,276 |
| Africa | Marine Fish NEI | 43 | 17 | 16 | 15 | 23 | 17 | 1 | 11 | 35 | 18 |
| Africa | Molluscs excl. Cephalopods | 1533 | 1696 | 1921 | 2049 | 2074 | 2332 | 2662 | 2812 | 2775 | 3034 |
| Africa | Pelagic Marine Fish | 1 | 9 | 152 | 91 | 366 | 604 | 517 | 613 | 380 | 373 |
| Americas | Aquatic Animals NEI | 693 | 735 | 728 | 728 | 797 | 820 | 746 | 949 | 968 | 871 |
| Americas | Aquatic Plants | 65,608 | 71,829 | 40,104 | 20,283 | 15,512 | 38,234 | 26,402 | 28,038 | 88,733 | 12,932 |
| Americas | Crustaceans | 206,581 | 272,388 | 340,109 | 367,022 | 422,576 | 499,748 | 503,061 | 530,940 | 525,049 | 560,834 |
| Americas | Demersal Marine Fish | 2244 | 2287 | 656 | 1805 | 2223 | 2214 | 2609 | 2197 | 2323 | 1967 |
| Americas | Freshwater and Diadromous Fish | 1,250,587 | 1,286,977 | 1,311,579 | 1,375,873 | 1,422,785 | 1,476,098 | 1,441,335 | 1,500,145 | 1,516,139 | 1,420,627 |
| Americas | Marine Fish NEI | 25 | 24 | 5 | 9 | - | - | 1 | 5 | 8 | 2 |
| Americas | Molluscs excl. Cephalopods | 239,211 | 238,282 | 282,194 | 393,052 | 323,835 | 384,666 | 408,607 | 431,474 | 417,776 | 527,056 |
| Americas | Pelagic Marine Fish | 532 | 541 | 570 | 4261 | 4640 | 5004 | 3752 | 4095 | 3898 | 3269 |
| Asia | Aquatic Animals NEI | 182,666 | 186,754 | 331,465 | 375,808 | 425,463 | 464,650 | 505,831 | 614,948 | 720,963 | 790,435 |
| Asia | Aquatic Plants | 10,781,141 | 11,691,332 | 12,464,506 | 13,773,982 | 14,726,157 | 15,513,891 | 16,212,167 | 17,109,776 | 18,444,553 | 20,008,197 |
| Asia | Crustaceans | 1,759,554 | 1,929,317 | 2,648,350 | 3,007,946 | 3,337,173 | 3,833,752 | 4,279,664 | 4,470,283 | 4,756,460 | 4,905,196 |
| Asia | Demersal Marine Fish | 182,352 | 211,239 | 529,909 | 572,340 | 634,916 | 666,357 | 704,565 | 726,825 | 742,121 | 734,873 |
| Asia | Freshwater and Diadromous Fish | 18,314,993 | 19,453,023 | 19,987,314 | 21,873,479 | 23,318,699 | 24,817,123 | 26,360,428 | 28,573,708 | 29,870,489 | 31,586,011 |
| Asia | Marine Fish NEI | 477,758 | 541,287 | 219,605 | 238,503 | 279,932 | 330,340 | 323,394 | 540,757 | 436,285 | 460,565 |
| Asia | Molluscs excl. Cephalopods | 9,219,565 | 9,866,930 | 10,261,153 | 10,640,295 | 10,994,804 | 11,441,253 | 11,804,560 | 11,831,314 | 12,200,074 | 12,477,154 |
| Asia | Pelagic Marine Fish | 163,604 | 172,228 | 193,159 | 187,420 | 198,576 | 227,291 | 244,940 | 243,986 | 279,708 | 278,688 |
| Asia | Others | 35 | 32 | 2924 | 13,046 | 16,407 | 21,267 | 21,203 | 24,275 | 19,223 | 61,115 |
| Europe | Aquatic Animals NEI | 5 | - | - | 4 | - | 25 | 25 | 55 | 148 | 478 |
| Europe | Aquatic Plants | 542 | 181 | 104 | 253 | 290 | 851 | 363 | 1326 | 1870 | 2058 |
| Europe | Cephalopods | 16 | 14 | 8 | 12 | 16 | 11 | 27 | 30 | 15 | 10 |
| Europe | Crustaceans | 2725 | 2538 | 3236 | 3244 | 3278 | 3331 | 3252 | 3266 | 3379 | 3285 |
| Europe | Demersal Marine Fish | 116,212 | 108,978 | 132,664 | 121,215 | 141,221 | 155,366 | 172,614 | 182,780 | 191,260 | 193,266 |
| Europe | Freshwater and Diadromous Fish | 1,226,100 | 1,263,484 | 1,313,460 | 1,347,136 | 1,307,027 | 1,330,771 | 1,488,822 | 1,518,792 | 1,658,491 | 1,716,060 |
| Europe | Marine Fish NEI | 1991 | 1593 | 3891 | 2973 | 4012 | 4879 | 5897 | 5460 | 5892 | 5443 |
| Europe | Molluscs excl. Cephalopods | 746,304 | 666,992 | 709,370 | 697,961 | 679,485 | 696,196 | 694,292 | 615,097 | 657,376 | 604,396 |
| Europe | Pelagic Marine Fish | 1260 | 1917 | 1803 | 10,698 | 8616 | 16,751 | 17,776 | 12,543 | 10,221 | 10,231 |
| Oceania | Aquatic Animals NEI | 480 | 342 | 1134 | 941 | 2065 | 2273 | 2137 | 1892 | 1550 | 1852 |
| Oceania | Aquatic Plants | 12,514 | 5104 | 4604 | 6095 | 8139 | 11,381 | 2628 | 3202 | 6557 | 12,809 |
| Oceania | Crustaceans | 5217 | 5993 | 5712 | 6304 | 6089 | 6190 | 5544 | 5498 | 6160 | 6770 |
| Oceania | Demersal Marine Fish | 7 | 7 | 1 | 2 | 1 | 2 | - | - | - | - |
| Oceania | Freshwater and Diadromous Fish | 25,211 | 25,780 | 23,042 | 24,496 | 27,622 | 32,859 | 39,360 | 40,310 | 48,096 | 51,486 |
| Oceania | Marine Fish NEI | 190 | 159 | 1532 | 1410 | 2508 | 2462 | 3253 | 3966 | 4947 | 5649 |
| Oceania | Molluscs excl. Cephalopods | 81,096 | 92,149 | 93,267 | 102,669 | 113,025 | 115,647 | 120,658 | 120,741 | 110,933 | 116,610 |
| Oceania | Pelagic Marine Fish | 3889 | 4008 | 2373 | 4554 | 2231 | 3611 | 2139 | 4532 | 8786 | 7284 |
| Oceania | Others | 877 | 1285 | 1954 | 1849 | 2900 | 2420 | 2210 | 1903 | 1866 | 2145 |
| Africa | Aquatic Animals NEI | 1 | 1 | 1 | 1 | 25 | 37 | 101 | 63 | 63 | 60 |
| Africa | Aquatic Plants | 141,120 | 161,458 | 123,194 | 149,368 | 196,570 | 139,359 | 136,833 | 113,875 | 110,373 | 104,090 |
| Africa | Crustaceans | 6977 | 6382 | 11527 | 12339 | 3732 | 4643 | 6171 | 5581 | 4888 | 7618 |
| Africa | Demersal Marine Fish | 166,047 | 175,332 | 159,849 | 170,154 | 211,781 | 239,006 | 325,176 | 347,135 | 362,527 | 453,845 |
| Africa | Freshwater and Diadromous Fish | 1,220,024 | 1,305,182 | 1,444,882 | 1,530,740 | 1,557,634 | 1,728,811 | 1,691,354 | 1,879,181 | 1,903,076 | 1,781,492 |
| Africa | Marine Fish NEI | 19 | 15 | 17 | 1 | - | - | - | - | - | - |
| Africa | Molluscs excl. Cephalopods | 2741 | 3269 | 3903 | 4475 | 4919 | 5959 | 5527 | 5836 | 7351 | 5994 |
| Africa | Pelagic Marine Fish | 350 | 841 | 380 | 549 | 199 | 218 | - | - | - | 1194 |
| Americas | Aquatic Animals NEI | 900 | 891 | 743 | 857 | 821 | 664 | 706 | 591 | 478 | 370 |
| Americas | Aquatic Plants | 15,443 | 5029 | 13,332 | 13,641 | 12,818 | 15,727 | 17,694 | 22,244 | 28,067 | 25,315 |
| Americas | Crustaceans | 618,364 | 637,099 | 614,514 | 703,004 | 792,808 | 792,922 | 861,838 | 1,000,688 | 1,164,234 | 1,266,090 |
| Americas | Demersal Marine Fish | 1859 | 2076 | 2425 | 2130 | 2070 | 1931 | 2026 | 4286 | 4468 | 5300 |
| Americas | Freshwater and Diadromous Fish | 844,409 | 914,932 | 937,817 | 1,082,143 | 1,017,448 | 1,042,779 | 1,092,918 | 1,130,032 | 1,149,848 | 1,179,727 |
| Americas | Freshwater and Diadromous Fish | 751,734 | 910,725 | 875,063 | 1,010,734 | 990,251 | 892,436 | 1,008,046 | 1,040,804 | 1,137,781 | 1,225,123 |
| Americas | Marine Fish NEI | - | - | 601 | 714 | 619 | 611 | 628 | 1276 | 1518 | 1340 |
| Americas | Molluscs excl. Cephalopods | 552,648 | 521,578 | 546,649 | 538,136 | 464,780 | 573,990 | 609,277 | 659,382 | 727,752 | 688,077 |
| Americas | Pelagic Marine Fish | 4929 | 3247 | 8579 | 11,056 | 10,386 | 11,681 | 8571 | 11,936 | 9022 | 9206 |
| Asia | Aquatic Animals NEI | 713,393 | 777,976 | 829,036 | 828,958 | 843,550 | 906,681 | 923,813 | 914,231 | 972,685 | 1,052,345 |
| Asia | Aquatic Plants | 21,597,225 | 24,480,914 | 27,837,570 | 28,878,515 | 30,841,267 | 31,473,785 | 32,442,126 | 33,281,704 | 34,427,039 | 34,916,316 |
| Asia | Crustaceans | 5,176,715 | 5,369,903 | 5,595,283 | 6,030,841 | 6,312,175 | 6,871,655 | 7,759,255 | 8,454,936 | 9,370,474 | 9,951,148 |
| Asia | Demersal Marine Fish | 783,216 | 846,950 | 896,385 | 970,249 | 1,051,938 | 1,094,310 | 1,240,763 | 1,301,177 | 1,422,748 | 1,519,924 |
| Asia | Freshwater and Diadromous Fish | 32,715,476 | 34,944,744 | 37,387,252 | 39,060,979 | 40,836,410 | 42,593,525 | 43,736,146 | 45,211,394 | 46,419,231 | 47,260,766 |
| Asia | Marine Fish NEI | 552,319 | 560,543 | 596,918 | 653,765 | 639,088 | 676,692 | 718,286 | 724,768 | 761,000 | 858,180 |
| Asia | Molluscs excl. Cephalopods | 266,545 | 264,060 | 259,436 | 521,244 | 259,516 | 257,793 | 226,562 | 209,427 | 201,725 | 192,671 |
| Asia | Molluscs excl. Cephalopods | 12,257,179 | 12,873,857 | 13,453,885 | 13,928,542 | 14,404,018 | 15,278,828 | 15,706,153 | 15,859,689 | 15,721,931 | 16,158,709 |
| Asia | Pelagic Marine Fish | 313,580 | 350,480 | 355,587 | 326,088 | 333,196 | 342,557 | 379,443 | 386,760 | 402,389 | 390,617 |
| Asia | Others | 50,658 | 19,601 | 30,923 | 46,218 | 39,158 | 53,018 | 64,143 | 25,589 | 631 | 473 |
| Europe | Aquatic Animals NEI | 250 | 323 | 349 | 928 | 917 | 2200 | 2196 | 2827 | 5052 | 6671 |
| Europe | Aquatic Plants | 2071 | 2869 | 2678 | 2819 | 2531 | 1640 | 2032 | 5373 | 11388 | 21792 |
| Europe | Cephalopods | 3 | 5 | 2 | 1 | 1 | 1 | 2 | 1 | 1 | - |
| Europe | Crustaceans | 3462 | 3293 | 3213 | 3275 | 3373 | 3373 | 3368 | 3444 | 3585 | 3563 |
| Europe | Demersal Marine Fish | 181,102 | 178,726 | 174,583 | 169,504 | 168,358 | 183,819 | 194,580 | 197,370 | 205,799 | 198,140 |
| Europe | Freshwater and Diadromous Fish | 1,840,173 | 2,065,497 | 2,009,110 | 2,127,983 | 2,157,742 | 2,149,894 | 2,177,825 | 2,173,721 | 2,391,459 | 2,440,403 |
| Europe | Marine Fish NEI | 2422 | 2219 | 1519 | 1229 | 1474 | 1263 | 1396 | 3124 | 1633 | 5823 |
| Europe | Molluscs excl. Cephalopods | 618,528 | 579,284 | 563,639 | 620,721 | 620,430 | 628,579 | 646,253 | 687,470 | 621,891 | 578,712 |
| Europe | Pelagic Marine Fish | 8536 | 8840 | 11,710 | 10,849 | 15,376 | 18,840 | 20,479 | 28,289 | 23,265 | 29,303 |
| Oceania | Aquatic Animals NEI | 3536 | 2841 | 3645 | 1354 | 5593 | 4772 | 3993 | 973 | 2899 | 2844 |
| Oceania | Aquatic Plants | 12,508 | 17,400 | 16,864 | 23,229 | 20,336 | 15,153 | 9,750 | 10,200 | 10,190 | 10,065 |
| Oceania | Crustaceans | 5824 | 5956 | 5613 | 5700 | 6862 | 6543 | 6434 | 6108 | 6619 | 8597 |
| Oceania | Demersal Marine Fish | 7 | 10 | 9 | 13 | 24 | 29 | 37 | 35 | 29 | 31 |
| Oceania | Freshwater and Diadromous Fish | 58,030 | 63,777 | 61,396 | 58,749 | 67,695 | 75,911 | 74,909 | 86,605 | 77,750 | 89,267 |
| Oceania | Marine Fish NEI | 3625 | 1538 | 890 | 579 | 1098 | 2018 | 2294 | 2487 | 2951 | 3068 |
| Oceania | Molluscs excl. Cephalopods | 120,789 | 104,624 | 101,947 | 114,684 | 94,316 | 111,818 | 118,272 | 101,904 | 113,966 | 116,363 |
| Oceania | Pelagic Marine Fish | 5800 | 7087 | 7486 | 7544 | 8418 | 8895 | 8100 | 8000 | 8252 | 8345 |
| Oceania | Others | 2868 | 2574 | 2610 | 1985 | 1799 | 1218 | 1210 | 1210 | 1210 | 1210 |
Note: Unit of measurement: tons live weight; The group of species categorized by ASFIS species. Source: Food and Agriculture Organization of the United Nations (FAO), from the website: https://www.fao.org/fishery/en/statistics, accessed on 17 August 2022.
Appendix C. The Groups of Species of Global Fishery Outputs by World Bank Income Classification
| Country | ASFIS Species | 2001 | 2002 | 2003 | 2004 | 2005 | 2006 | 2007 | 2008 | 2009 | 2010 |
|---|---|---|---|---|---|---|---|---|---|---|---|
| HIC | Aquatic Animals NEI | 48,811 | 36,548 | 27,504 | 30,081 | 30,625 | 26,925 | 25,660 | 24,092 | 32,551 | 30,805 |
| HIC | Aquatic Plants | 966,192 | 1,143,999 | 982,130 | 1,060,976 | 1,146,877 | 1,299,863 | 1,342,762 | 1,413,017 | 1,408,800 | 1,352,987 |
| HIC | Cephalopods | 16 | 14 | 8 | 12 | 16 | 11 | 27 | 30 | 15 | 10 |
| HIC | Crustaceans | 52,647 | 68,312 | 87,599 | 85,636 | 91,186 | 90,787 | 102,791 | 108,862 | 100,242 | 105,987 |
| HIC | Demersal Marine Fish | 251,175 | 269,771 | 331,714 | 309,347 | 338,080 | 351,024 | 379,259 | 395,435 | 409,371 | 376,880 |
| HIC | Freshwater and Diadromous Fish | 2,369,963 | 2,399,951 | 2,466,081 | 2,525,324 | 2,494,064 | 2,556,448 | 2,651,428 | 2,670,068 | 2,755,598 | 2,681,088 |
| HIC | Marine Fish NEI | 14,426 | 14,149 | 16,816 | 14,915 | 16,366 | 17,363 | 20,717 | 20,268 | 23,766 | 26,330 |
| HIC | Molluscs excl. Cephalopods | 1,791,519 | 1,756,050 | 1,913,145 | 1,990,836 | 1,897,647 | 2,074,066 | 2,200,864 | 2,000,511 | 2,033,211 | 2,053,695 |
| HIC | Pelagic Marine Fish | 168,737 | 178,161 | 172,808 | 176,810 | 182,098 | 186,136 | 191,863 | 180,244 | 182,320 | 163,949 |
| HIC | Others | 902 | 1311 | 1985 | 1865 | 2916 | 2447 | 2237 | 1926 | 1889 | 2167 |
| LIC | Aquatic Animals NEI | - | - | - | 10 | 50 | 51 | 101 | 101 | 101 | 126 |
| LIC | Aquatic Plants | 444,995 | 446,565 | 450,325 | 446,015 | 445,765 | 449,800 | 448,690 | 448,720 | 448,200 | 449,400 |
| LIC | Crustaceans | 5411 | 7928 | 7359 | 6679 | 8214 | 9810 | 9456 | 8757 | 3789 | 4822 |
| LIC | Freshwater and Diadromous Fish | 19,374 | 23,191 | 25,504 | 26,503 | 31,808 | 54,645 | 73,458 | 75,553 | 101,041 | 121,874 |
| LIC | Molluscs excl. Cephalopods | 60,000 | 60,000 | 60,000 | 60,000 | 60,000 | 60,020 | 60,020 | 60,120 | 60,220 | 60,220 |
| LMIC | Aquatic Animals NEI | - | 25 | 40 | 42 | 96 | 116 | 114 | 490 | 28,184 | 31,240 |
| LMIC | Aquatic Plants | 1,109,060 | 1,255,327 | 1,345,709 | 1,733,369 | 2,372,211 | 2,752,820 | 3,342,265 | 3,947,178 | 4,841,142 | 5,886,379 |
| LMIC | Crustaceans | 586,820 | 648,564 | 760,193 | 893,952 | 1,036,632 | 1,118,234 | 1,096,986 | 1,165,178 | 1,145,230 | 1,126,726 |
| LMIC | Demersal Marine Fish | 115,193 | 138,286 | 162,099 | 158,087 | 187,350 | 249,381 | 269,106 | 239,061 | 245,392 | 185,150 |
| LMIC | Freshwater and Diadromous Fish | 4,675,907 | 5,030,920 | 5,552,321 | 6,478,141 | 7,083,636 | 7,713,803 | 8,447,715 | 9,925,845 | 10,281,891 | 11,744,244 |
| LMIC | Marine Fish NEI | 28,990 | 35,083 | 40,292 | 49,281 | 55,576 | 118,670 | 86,617 | 254,231 | 181,647 | 214,524 |
| LMIC | Molluscs excl. Cephalopods | 85,243 | 101,822 | 131,814 | 191,384 | 187,263 | 196,324 | 223,507 | 234,065 | 235,880 | 171,143 |
| LMIC | Pelagic Marine Fish | 16 | 17 | 170 | 98 | 262 | 528 | 950 | 2649 | 2298 | 956 |
| LMIC | Others | - | 1 | 2867 | 12,992 | 16,349 | 16,349 | 16,001 | 19,663 | 15,857 | 58,079 |
| UPMIC | Aquatic Animals NEI | 135,033 | 151,258 | 305,783 | 347,348 | 397,554 | 440,677 | 482,865 | 593,162 | 662,794 | 731,465 |
| UPMIC | Aquatic Plants | 8,423,150 | 9,039,743 | 9,836,715 | 10,639,745 | 10,866,403 | 11,150,404 | 11,204,110 | 11,452,738 | 11,957,703 | 12,485,559 |
| UPMIC | Crustaceans | 1,334,997 | 1,493,820 | 2,150,790 | 2,406,102 | 2,644,992 | 3,134,759 | 3,591,913 | 3,736,422 | 4,045,746 | 4,244,243 |
| UPMIC | Demersal Marine Fish | 35,160 | 32,451 | 311,401 | 367,557 | 421,232 | 458,067 | 488,113 | 500,107 | 507,807 | 532,554 |
| UPMIC | Freshwater and Diadromous Fish | 14,044,467 | 14,894,818 | 14,952,631 | 15,993,666 | 16,923,806 | 17,836,569 | 18,706,196 | 19,666,546 | 20,707,444 | 21,337,143 |
| UPMIC | Marine Fish NEI | 436,590 | 493,848 | 167,941 | 178,714 | 214,533 | 201,665 | 225,212 | 275,700 | 241,725 | 230,807 |
| UPMIC | Molluscs excl. Cephalopods | 8,350,940 | 8,948,175 | 9,242,944 | 9,593,783 | 9,968,309 | 10,309,682 | 10,546,385 | 10,706,741 | 11,059,622 | 11,443,192 |
| UPMIC | Pelagic Marine Fish | 532 | 521 | 25,079 | 30,114 | 32,061 | 66,588 | 76,295 | 82,848 | 118,350 | 134,924 |
| UPMIC | Others | 10 | 5 | 26 | 39 | 43 | 4891 | 5175 | 4589 | 3344 | 3015 |
| HIC | Aquatic Animals NEI | 28,640 | 24,111 | 26,583 | 27,926 | 48,658 | 65,945 | 55,691 | 60,249 | 50,739 | 51,548 |
| HIC | Aquatic Plants | 1,362,855 | 1,471,995 | 1,567,462 | 1,475,191 | 1,610,419 | 1,758,272 | 2,187,546 | 2,123,924 | 2,183,809 | 2,180,819 |
| HIC | Cephalopods | 3 | 5 | 2 | 1 | 1 | 1 | 2 | 1 | 1 | - |
| HIC | Crustaceans | 95,620 | 86,244 | 87,359 | 112,789 | 118,834 | 131,493 | 138,867 | 162,821 | 172,917 | 160,956 |
| HIC | Demersal Marine Fish | 353,688 | 360,612 | 364,777 | 378,679 | 381,007 | 385,915 | 408,172 | 405,625 | 417,456 | 415,385 |
| HIC | Freshwater and Diadromous Fish | 2,923,440 | 3,337,750 | 3,226,558 | 3,468,081 | 3,428,471 | 3,293,062 | 3,445,749 | 3,470,853 | 3,753,319 | 3,880,933 |
| HIC | Marine Fish NEI | 22,421 | 9782 | 11,260 | 13,486 | 9249 | 10,252 | 11,436 | 13,014 | 11,976 | 16,566 |
| HIC | Molluscs excl. Cephalopods | 2,002,476 | 1,972,154 | 1,839,422 | 2,001,602 | 1,966,128 | 2,055,385 | 2,133,868 | 2,226,744 | 2,187,898 | 2,088,811 |
| HIC | Pelagic Marine Fish | 167,390 | 193,669 | 188,172 | 175,143 | 186,149 | 190,080 | 192,760 | 201,496 | 197,455 | 202,262 |
| HIC | Others | 2877 | 2593 | 2631 | 2004 | 1818 | 1238 | 1230 | 1231 | 1229 | 1226 |
| LIC | Aquatic Animals NEI | 136 | 141 | 146 | 146 | 175 | 186 | 264 | 215 | 215 | 215 |
| LIC | Aquatic Plants | 447,129 | 446,842 | 450,035 | 509,110 | 517,497 | 570,613 | 570,617 | 608,547 | 612,075 | 611,164 |
| LIC | Crustaceans | 6066 | 5096 | 5377 | 4696 | 3452 | 4139 | 5439 | 4947 | 4308 | 5273 |
| LIC | Demersal Marine Fish | 6 | 75 | 145 | 165 | 15 | 15 | 15 | 15 | 15 | 15 |
| LIC | Freshwater and Diadromous Fish | 113,084 | 131,021 | 133,449 | 148,061 | 157,777 | 164,447 | 173,820 | 167,677 | 168,143 | 195,506 |
| LIC | Marine Fish NEI | - | - | - | 65 | 65 | 65 | 80 | 120 | 120 | 120 |
| LIC | Molluscs excl. Cephalopods | 60,220 | 60,220 | 60,270 | 60,270 | 60,270 | 60,270 | 62,320 | 62,420 | 62,420 | 62,420 |
| LMIC | Aquatic Animals NEI | 5074 | 5609 | 7218 | 20735 | 7093 | 6850 | 8410 | 7269 | 14,090 | 13,224 |
| LMIC | Aquatic Plants | 7,182,520 | 8,468,204 | 11,012,765 | 11,809,920 | 13,060,792 | 12,604,842 | 12,109,910 | 11,943,968 | 11,407,845 | 11,210,375 |
| LMIC | Crustaceans | 1,377,612 | 1,386,460 | 1,751,470 | 2,016,426 | 2,142,801 | 2,338,030 | 2,775,903 | 2,844,304 | 3,187,139 | 3,436,716 |
| LMIC | Demersal Marine Fish | 183,898 | 195,679 | 188,546 | 191,449 | 236,946 | 258,227 | 396,200 | 378,561 | 389,048 | 477,291 |
| LMIC | Freshwater and Diadromous Fish | 12,326,745 | 13,860,385 | 15,189,862 | 15,926,170 | 16,705,250 | 17,899,023 | 18,964,905 | 20,590,216 | 21,756,243 | 22,060,390 |
| LMIC | Marine Fish NEI | 262,837 | 250,932 | 243,287 | 253,792 | 193,009 | 232,871 | 255,316 | 259,814 | 279,827 | 288,311 |
| LMIC | Molluscs excl. Cephalopods | 185,297 | 206,242 | 253,919 | 258,627 | 294,898 | 333,637 | 349,787 | 429,493 | 352,229 | 357,712 |
| LMIC | Pelagic Marine Fish | 1007 | 12,610 | 2571 | 3242 | 1999 | 1857 | 1704 | 1507 | 3639 | 5647 |
| LMIC | Others | 48,449 | 17,251 | 29,091 | 44,399 | 37,505 | 51,406 | 63,181 | 24,863 | - | - |
| UPMIC | Aquatic Animals NEI | 684,230 | 752,170 | 799,827 | 783,292 | 794,979 | 841,374 | 866,445 | 850,952 | 916,132 | 997,303 |
| UPMIC | Aquatic Plants | 12,775,863 | 14,280,629 | 14,963,377 | 15,273,351 | 15,884,812 | 16,711,935 | 17,740,362 | 18,756,957 | 20,383,328 | 21,075,219 |
| UPMIC | Crustaceans | 4,332,032 | 4,544,821 | 4,385,933 | 4,621,235 | 4,853,851 | 5,205,465 | 5,716,847 | 6,458,675 | 7,185,428 | 7,634,064 |
| UPMIC | Demersal Marine Fish | 594,538 | 646,550 | 679,622 | 741,559 | 816,077 | 874,821 | 958,119 | 1,065,722 | 1,188,976 | 1,284,455 |
| UPMIC | Freshwater and Diadromous Fish | 22,064,478 | 22,875,602 | 24,165,553 | 25,328,941 | 26,335,607 | 27,126,752 | 27,196,708 | 27,292,974 | 27,401,423 | 27,839,930 |
| UPMIC | Marine Fish NEI | 273,117 | 303,601 | 345,398 | 388,945 | 439,956 | 437,397 | 455,771 | 458,706 | 475,179 | 563,415 |
| UPMIC | Molluscs excl. Cephalopods | 11,570,434 | 12,108,048 | 12,775,836 | 13,407,238 | 13,526,672 | 14,407,664 | 14,765,973 | 14,804,994 | 14,792,062 | 15,231,576 |
| UPMIC | Pelagic Marine Fish | 164,792 | 164,216 | 192,999 | 177,701 | 179,428 | 190,254 | 222,128 | 231,982 | 241,834 | 230,755 |
| UPMIC | Others | 2199 | 2331 | 1812 | 1800 | 1634 | 1592 | 941 | 705 | 612 | 456 |
Note: Unit of measurement: tons live weight; The group of species categorized by ASFIS species; HIC = High income; LMIC = Lower-middle income; UMIC = Upper-middle income; LIC = Low income. Source: Food and Agriculture Organization of the United Nations (FAO), from the website: https://www.fao.org/fishery/en/statistics, accessed on 17 August 2022.
References
- Costello, C.; Cao, L.; Gelcich, S.; Cisneros-Mata, M.Á.; Free, C.M.; Froehlich, H.E.; Golden, C.D.; Ishimura, G.; Maier, J.; Macadam-Somer, I. The future of food from the sea. Nature 2020, 588, 95–100. [Google Scholar] [CrossRef] [PubMed]
- Duarte, C.M.; Agusti, S.; Barbier, E.; Britten, G.L.; Castilla, J.C.; Gattuso, J.-P.; Fulweiler, R.W.; Hughes, T.P.; Knowlton, N.; Lovelock, C.E. Rebuilding marine life. Nature 2020, 580, 39–51. [Google Scholar] [CrossRef] [PubMed]
- FAO. FAOSTAT Agricultural. Available online: http://www.fao.org/faostat/en/#data (accessed on 17 August 2022).
- Schwalm, C.R.; Glendon, S.; Duffy, P.B. RCP8. 5 tracks cumulative CO2 emissions. Proc. Natl. Acad. Sci. USA 2020, 117, 19656–19657. [Google Scholar] [CrossRef] [PubMed]
- Bopp, L.; Resplandy, L.; Orr, J.C.; Doney, S.C.; Dunne, J.P.; Gehlen, M.; Halloran, P.; Heinze, C.; Ilyina, T.; Seferian, R. Multiple stressors of ocean ecosystems in the 21st century: Projections with CMIP5 models. Biogeosciences 2013, 10, 6225–6245. [Google Scholar] [CrossRef] [Green Version]
- Lotze, H.K.; Tittensor, D.P.; Bryndum-Buchholz, A.; Eddy, T.D.; Cheung, W.W.; Galbraith, E.D.; Barange, M.; Barrier, N.; Bianchi, D.; Blanchard, J.L. Global ensemble projections reveal trophic amplification of ocean biomass declines with climate change. Proc. Natl. Acad. Sci. USA 2019, 116, 12907–12912. [Google Scholar] [CrossRef] [Green Version]
- Cheung, W.W.L. The future of fishes and fisheries in the changing oceans. J. Fish Biol. 2018, 92, 790–803. [Google Scholar] [CrossRef]
- Holsman, K.; Haynie, A.; Hollowed, A.; Reum, J.; Aydin, K.; Hermann, A.; Cheng, W.; Faig, A.; Ianelli, J.; Kearney, K. Ecosystem-based fisheries management forestalls climate-driven collapse. Nat. Commun. 2020, 11, 4579. [Google Scholar] [CrossRef]
- McCauley, D.J.; Pinsky, M.L.; Palumbi, S.R.; Estes, J.A.; Joyce, F.H.; Warner, R.R. Marine defaunation: Animal loss in the global ocean. Science 2015, 347, 1255641. [Google Scholar] [CrossRef] [Green Version]
- Pauly, D.; Christensen, V.; Dalsgaard, J.; Froese, R.; Torres, F., Jr. Fishing down marine food webs. Science 1998, 279, 860–863. [Google Scholar] [CrossRef]
- Bianchi, G.; Gislason, H.; Graham, K.; Hill, L.; Jin, X.; Koranteng, K.; Manickchand-Heileman, S.; Paya, I.; Sainsbury, K.; Sanchez, F. Impact of fishing on size composition and diversity of demersal fish communities. J. Mar. Sci. 2000, 57, 558–571. [Google Scholar] [CrossRef] [Green Version]
- Jennings, S.; Blanchard, J.L. Fish abundance with no fishing: Predictions based on macroecological theory. J. Anim. Ecol. 2004, 73, 632–642. [Google Scholar] [CrossRef]
- FAO. The State of World Fisheries and Aquaculture; Rome FAO: Rome, Italy, 2012. [Google Scholar]
- Dulvy, N.K.; Sadovy, Y.; Reynolds, J.D. Extinction vulnerability in marine populations. Fish Fish. Res. 2003, 4, 25–64. [Google Scholar] [CrossRef]
- Sumaila, U.R.; Tai, T.C. End overfishing and increase the resilience of the ocean to climate change. Front. Mar. Sci. 2020, 7, 523. [Google Scholar] [CrossRef]
- Sissenwine, M.; Symes, D. Reflections on the common fisheries policy. In Report to the General Directorate for Fisheries Maritime Affairs of the European Commission; European Commission: Brussels, Belgium, 2007; p. 75. [Google Scholar]
- Pauly, D.; Watson, R.; Alder, J. Global trends in world fisheries: Impacts on marine ecosystems and food security. Philos. Trans. R. Soc. B Biol. Sci. 2005, 360, 5–12. [Google Scholar] [CrossRef] [Green Version]
- Sumaila, U.R.; Skerritt, D.J.; Schuhbauer, A.; Villasante, S.; Cisneros-Montemayor, A.M.; Sinan, H.; Burnside, D.; Abdallah, P.R.; Abe, K.; Addo, K.A. WTO must ban harmful fisheries subsidies. Science 2021, 374, 544. [Google Scholar] [CrossRef]
- Agnew, D.J.; Pearce, J.; Pramod, G.; Peatman, T.; Watson, R.; Beddington, J.R.; Pitcher, T.J. Estimating the worldwide extent of illegal fishing. PloS ONE 2009, 4, e4570. [Google Scholar] [CrossRef] [Green Version]
- Wang, Z.; Leung, K.M.Y.; Sung, Y.-H.; Dudgeon, D.; Qiu, J.-W. Recovery of tropical marine benthos after a trawl ban demonstrates linkage between abiotic and biotic changes. Commun. Biol. 2021, 4, 212. [Google Scholar] [CrossRef]
- Jennings, S.; Dinmore, T.A.; Duplisea, D.E.; Warr, K.J.; Lancaster, J.E. Trawling disturbance can modify benthic production processes. J. Anim. Ecol. 2001, 70, 459–475. [Google Scholar] [CrossRef]
- Schuhbauer, A.; Chuenpagdee, R.; Cheung, W.W.; Greer, K.; Sumaila, U.R. How subsidies affect the economic viability of small-scale fisheries. Mar. Policy 2017, 82, 114–121. [Google Scholar] [CrossRef]
- Conrad, J.M.; Rondeau, D. Bioeconomics of a marine disease. Mar. Resour. Econ. 2015, 30, 393–416. [Google Scholar] [CrossRef]
- Welcomme, R. Principles and approaches for river fisheries management. In Management and Ecology of River Fisheries; John Wiley & Sons: New York, NY, USA, 2000; pp. 331–345. [Google Scholar] [CrossRef]
- Pinsky, M.L.; Jensen, O.P.; Ricard, D.; Palumbi, S.R. Unexpected patterns of fisheries collapse in the world’s oceans. Proc. Natl. Acad. Sci. USA 2011, 108, 8317–8322. [Google Scholar] [CrossRef] [PubMed] [Green Version]
- Gardner, T.A.; Côté, I.M.; Gill, J.A.; Grant, A.; Watkinson, A.R. Long-term region-wide declines in Caribbean corals. Science 2003, 301, 958–960. [Google Scholar] [CrossRef] [PubMed] [Green Version]
- Jackson, J.B.; Kirby, M.X.; Berger, W.H.; Bjorndal, K.A.; Botsford, L.W.; Bourque, B.J.; Bradbury, R.H.; Cooke, R.; Erlandson, J.; Estes, J.A. Historical overfishing and the recent collapse of coastal ecosystems. Science 2001, 293, 629–637. [Google Scholar] [CrossRef] [PubMed] [Green Version]
- Jackson, J.B. What was natural in the coastal oceans? Proc. Natl. Acad. Sci. USA 2001, 98, 5411–5418. [Google Scholar] [CrossRef] [PubMed] [Green Version]
- Bowen, W. Role of marine mammals in aquatic ecosystems. Mar. Ecol. Prog. Ser. 1997, 158, 267–274. [Google Scholar] [CrossRef] [Green Version]
- Gattuso, J.-P.; Magnan, A.K.; Bopp, L.; Cheung, W.W.; Duarte, C.M.; Hinkel, J.; Mcleod, E.; Micheli, F.; Oschlies, A.; Williamson, P. Ocean solutions to address climate change and its effects on marine ecosystems. Front. Mar. Sci. 2018, 5, 337. [Google Scholar] [CrossRef] [Green Version]
- Halpern, B.S.; Frazier, M.; Potapenko, J.; Casey, K.S.; Koenig, K.; Longo, C.; Lowndes, J.S.; Rockwood, R.C.; Selig, E.R.; Selkoe, K.A. Spatial and temporal changes in cumulative human impacts on the world’s ocean. Nat. Commun. 2015, 6, 7615. [Google Scholar] [CrossRef] [Green Version]
- Le Quesne, W.J.F.; Jennings, S. Predicting species vulnerability with minimal data to support rapid risk assessment of fishing impacts on biodiversity. J. Appl. Ecol. 2012, 49, 20–28. [Google Scholar] [CrossRef]
- Sumaila, U.R.; Tai, T.C.; Lam, V.W.; Cheung, W.W.; Bailey, M.; Cisneros-Montemayor, A.M.; Chen, O.L.; Gulati, S.S. Benefits of the Paris Agreement to ocean life, economies, and people. Sci. Adv. 2019, 5, eaau3855. [Google Scholar] [CrossRef] [Green Version]
- Coll, M.; Libralato, S.; Tudela, S.; Palomera, I.; Pranovi, F. Ecosystem overfishing in the ocean. PLoS ONE 2008, 3, e3881. [Google Scholar] [CrossRef] [Green Version]
- Daskalov, G.M.; Grishin, A.N.; Rodionov, S.; Mihneva, V. Trophic cascades triggered by overfishing reveal possible mechanisms of ecosystem regime shifts. Proc. Natl. Acad. Sci. USA 2007, 104, 10518–10523. [Google Scholar] [CrossRef] [Green Version]
- Bailey, M.; Sumaila, U. Destructive fishing and fisheries enforcement in eastern Indonesia. Mar. Ecol. Prog. Ser. 2015, 530, 195–211. [Google Scholar] [CrossRef] [Green Version]
- Froese, R.; Winker, H.; Coro, G.; Demirel, N.; Tsikliras, A.C.; Dimarchopoulou, D.; Scarcella, G.; Quaas, M.; Matz-Lück, N. Status and rebuilding of European fisheries. Mar. Policy 2018, 93, 159–170. [Google Scholar] [CrossRef]
- McGarvey, R. Demand-side fishery management: Integrating two forms of input control. Mar. Policy 2003, 27, 207–218. [Google Scholar] [CrossRef]
- FAO. The State of World Fisheries and Aquaculture 2016. Contributing to Food Security and Nutrition for All; Food Agriculture Organization of the United Nations: Rome, Italy, 2016. [Google Scholar]
- Kumar, A.B.; Deepthi, G. Trawling and by-catch: Implications on marine ecosystem. Curr. Sci. 2006, 90, 922–931. [Google Scholar]
- De Groot, S. The impact of bottom trawling on benthic fauna of the North Sea. Ocean. Manag. 1984, 9, 177–190. [Google Scholar] [CrossRef]
- Foden, J.; Rogers, S.I.; Jones, A.P. Human pressures on UK seabed habitats: A cumulative impact assessment. Mar. Ecol. Prog. Ser. 2011, 428, 33–47. [Google Scholar] [CrossRef] [Green Version]
- Jones, J. Environmental impact of trawling on the seabed: A review. New Zealand J. Mar. Freshw. Res. 1992, 26, 59–67. [Google Scholar] [CrossRef]
- Thrush, S.F.; Dayton, P.K. Disturbance to marine benthic habitats by trawling and dredging: Implications for marine biodiversity. Annu. Rev. Ecol. Syst. 2002, 33, 449–473. [Google Scholar] [CrossRef] [Green Version]
- Hiddink, J.G.; Jennings, S.; Sciberras, M.; Szostek, C.L.; Hughes, K.M.; Ellis, N.; Rijnsdorp, A.D.; McConnaughey, R.A.; Mazor, T.; Hilborn, R. Global analysis of depletion and recovery of seabed biota after bottom trawling disturbance. Proc. Natl. Acad. Sci. USA 2017, 114, 8301–8306. [Google Scholar] [CrossRef] [Green Version]
- Pusceddu, A.; Grémare, A.; Escoubeyrou, K.; Amouroux, J.; Fiordelmondo, C.; Danovaro, R. Impact of natural (storm) and anthropogenic (trawling) sediment resuspension on particulate organic matter in coastal environments. Cont. Shelf Res. 2005, 25, 2506–2520. [Google Scholar] [CrossRef]
- Dureuil, M.; Boerder, K.; Burnett, K.A.; Froese, R.; Worm, B.J.S. Elevated trawling inside protected areas undermines conservation outcomes in a global fishing hot spot. Science 2018, 362, 1403–1407. [Google Scholar] [CrossRef] [PubMed] [Green Version]
- Goode, S.L.; Rowden, A.A.; Bowden, D.A.; Clark, M.R. Resilience of seamount benthic communities to trawling disturbance. Mar. Environ. Res. 2020, 161, 105086. [Google Scholar] [CrossRef] [PubMed]
- Abdulqader, E.A.; Abdurahiman, P.; Mansour, L.; Harrath, A.H.; Qurban, M.A.; Rabaoui, L. Bycatch and discards of shrimp trawling in the Saudi waters of the Arabian Gulf: Ecosystem impact assessment and implications for a sustainable fishery management. Fish. Res. 2020, 229, 105596. [Google Scholar] [CrossRef]
- Gamaza-Márquez, M.A.; Pennino, M.G.; Torres, M.A.; Acosta, J.J.; Erzini, K.; Sobrino, I. Discard practices in the gulf of Cadiz multispecies trawl fishery. Implications for the EU ‘landing obligation’. Mar. Policy 2020, 118, 104008. [Google Scholar] [CrossRef]
- Cashion, T.; Al-Abdulrazzak, D.; Belhabib, D.; Derrick, B.; Divovich, E.; Moutopoulos, D.K.; Noël, S.-L.; Palomares, M.L.D.; Teh, L.C.L.; Zeller, D.; et al. Reconstructing global marine fishing gear use: Catches and landed values by gear type and sector. Fish. Res. 2018, 206, 57–64. [Google Scholar] [CrossRef]
- Roda, P.; Gilman, E.; Huntington, T.; Kennelly, S.J.; Suuronen, P.; Chaloupka, M.; Medley, P. Third Assessment of Global Marine Fisheries Discards; FAO: Rome, Italy, 2019. [Google Scholar]
- Eigaard, O.R.; Bastardie, F.; Hintzen, N.T.; Buhl-Mortensen, L.; Buhl-Mortensen, P.; Catarino, R.; Dinesen, G.E.; Egekvist, J.; Fock, H.O.; Geitner, K. The footprint of bottom trawling in European waters: Distribution, intensity, and seabed integrity. J. Mar. Sci. 2017, 74, 847–865. [Google Scholar] [CrossRef] [Green Version]
- Belhabib, D.; Cheung, W.W.; Kroodsma, D.; Lam, V.W.; Underwood, P.J.; Virdin, J. Catching industrial fishing incursions into inshore waters of Africa from space. Fish Fish. 2020, 21, 379–392. [Google Scholar] [CrossRef]
- de Juan, S.; Demestre, M.; Thrush, S. Defining ecological indicators of trawling disturbance when everywhere that can be fished is fished: A Mediterranean case study. Mar. Policy 2009, 33, 472–478. [Google Scholar] [CrossRef]
- Zhang, X.; Vincent, A.C.J. China’s policies on bottom trawl fisheries over seven decades (1949–2018). Mar. Policy 2020, 122, 104256. [Google Scholar] [CrossRef]
- Blanchard, C. Fragmentation in high seas fisheries: Preliminary reflections on a global oceans governance approach. Mar. Policy 2017, 84, 327–332. [Google Scholar] [CrossRef]
- Gjerde, K.M.; Dotinga, H.; Hart, S.; Molenaar, E.J.; Rayfuse, R.; Warner, R. Regulatory and Governance Gaps in the International Regime for the Conservation and Sustainable Use of Marine Biodiversity in Areas beyond National Jurisdiction; IUCN: Gland, Switzerland, 2008. [Google Scholar]
- Haward, M.G.; Vince, J. Oceans Governance in the Twenty-First Century: Managing the Blue Planet; Edward Elgar Publishing: Cheltenham, UK, 2008. [Google Scholar]
- Pikitch, E.K.; Santora, C.; Babcock, E.A.; Bakun, A.; Bonfil, R.; Conover, D.O.; Dayton, P.; Doukakis, P.; Fluharty, D.; Heneman, B. Ecosystem-based fishery management. Science 2004, 305, 346–347. [Google Scholar] [CrossRef]
- Cormier, R.; Elliott, M. SMART marine goals, targets and management—Is SDG 14 operational or aspirational, is ‘Life Below Water’ sinking or swimming? Mar. Pollut. Bull. 2017, 123, 28–33. [Google Scholar] [CrossRef]
- Link, J.S.; Browman, H.I. Operationalizing and implementing ecosystem-based management. ICES J. Mar. Sci. 2017, 74, 379–381. [Google Scholar] [CrossRef] [Green Version]
- Sardà, R.; O’Higgins, T.; Cormier, R.; Diedrich, A.; Tintoré, J. A proposed ecosystem-based management system for marine waters: Linking the theory of environmental policy to the practice of environmental management. Ecol. Soc. 2014, 19, 51. [Google Scholar] [CrossRef] [Green Version]
- Long, R.D.; Charles, A.; Stephenson, R.L. Key principles of ecosystem-based management: The fishermen’s perspective. Fish Fish. 2017, 18, 244–253. [Google Scholar] [CrossRef] [Green Version]
- Hughes, T.P.; Bellwood, D.R.; Folke, C.; Steneck, R.S.; Wilson, J. New paradigms for supporting the resilience of marine ecosystems. Trends Ecol. Evol. 2005, 20, 380–386. [Google Scholar] [CrossRef]
- Clark, C.W.; Munro, G.R.; Sumaila, U.R. Subsidies, buybacks, and sustainable fisheries. J. Environ. Econ. Manag. 2005, 50, 47–58. [Google Scholar] [CrossRef]
- Bank, W. The Sunken Billions: The Economic Justification for Fisheries Reform; The World Bank: Washington, DC, USA, 2009. [Google Scholar]
- Sumaila, U.R.; Lam, V.; Le Manach, F.; Swartz, W.; Pauly, D. Global fisheries subsidies: An updated estimate. Mar. Policy 2016, 69, 189–193. [Google Scholar] [CrossRef]
- Da-Rocha, J.-M.; García-Cutrín, J.; Prellezo, R.; Sempere, J. The social cost of fishery subsidy reforms. Mar. Policy 2017, 83, 236–242. [Google Scholar] [CrossRef] [Green Version]
- Cisneros-Montemayor, A.M.; Sanjurjo, E.; Munro, G.R.; Hernández-Trejo, V.; Rashid Sumaila, U. Strategies and rationale for fishery subsidy reform. Mar. Policy 2016, 69, 229–236. [Google Scholar] [CrossRef]
- Morgan, R. An investigation of constraints upon fisheries diversification using the Analytic Hierarchy Process (AHP). Mar. Policy 2017, 86, 24–30. [Google Scholar] [CrossRef]
- Law, S.H.; Azman-Saini, W.N.W.; Ibrahim, M.H. Institutional quality thresholds and the finance—Growth nexus. J. Bank. Financ. 2013, 37, 5373–5381. [Google Scholar] [CrossRef]
- Hansen, B.E. Inference When a Nuisance Parameter Is Not Identified Under the Null Hypothesis. Econometrica 1996, 64, 413–430. [Google Scholar] [CrossRef] [Green Version]
- Hansen, B.E. Sample Splitting and Threshold Estimation. Econometrica 2000, 68, 575–603. [Google Scholar] [CrossRef] [Green Version]
- Pradhan, T.; Chaudhuri, K.S. A dynamic reaction model of a two-species fishery with taxation as a control instrument: A capital theoretic analysis. Ecol. Model. 1999, 121, 1–16. [Google Scholar] [CrossRef]
- Pradhan, T.; Chaudhuri, K.S. Bioeconomic harvesting of a schooling fish species: A dynamic reaction model. Korean J. Comput. Appl. Math. 1999, 6, 127–141. [Google Scholar] [CrossRef]
- Clark, C.W. Bioeconomic Modelling of Fisheries Management; John Wiley & Sons: New York, NY, USA, 1985. [Google Scholar]
- Milazzo, M. Subsidies in World Fisheries: A Reexamination; World Bank Publications: Washington, DC, USA, 1998; Volume 23. [Google Scholar]
- Tao, L.S.R.; Lui, K.K.Y.; Lau, E.T.C.; Ho, K.K.Y.; Mak, Y.K.Y.; Sadovy de Mitcheson, Y.; Leung, K.M.Y. Trawl ban in a heavily exploited marine environment: Responses in population dynamics of four stomatopod species. Sci. Rep. 2018, 8, 17876. [Google Scholar] [CrossRef] [Green Version]
- Pipitone, C.; Badalamenti, F.; D’Anna, G.; Patti, B. Fish biomass increase after a four-year trawl ban in the Gulf of Castellammare (NW Sicily, Mediterranean Sea). Fish. Res. 2000, 48, 23–30. [Google Scholar] [CrossRef]
- Fiorentino, F.; Badalamenti, F.; D’anna, G.; Garofalo, G.; Gianguzza, P.; Gristina, M.; Pipitone, C.; Rizzo, P.; Fortibuoni, T. Changes in spawning-stock structure and recruitment pattern of red mullet, Mullus barbatus, after a trawl ban in the Gulf of Castellammare (central Mediterranean Sea). J. Mar. Sci. 2008, 65, 1175–1183. [Google Scholar] [CrossRef]
- Anticamara, J.A.; Go, K.T. Spatio-temporal declines in Philippine fisheries and its implications to coastal municipal fishers’ catch and income. Front. Mar. Sci. 2016, 3, 21. [Google Scholar] [CrossRef] [Green Version]
- Srinivasan, U.T.; Cheung, W.W.L.; Watson, R.; Sumaila, U.R. Food security implications of global marine catch losses due to overfishing. J. Bioeconomics 2010, 12, 183–200. [Google Scholar] [CrossRef]
- Beddington, J.R.; Agnew, D.J.; Clark, C.W. Current problems in the management of marine fisheries. Science 2007, 316, 1713–1716. [Google Scholar] [CrossRef] [Green Version]
- Purcell, S.W.; Mercier, A.; Conand, C.; Hamel, J.-F.; Toral-Granda, M.V.; Lovatelli, A.; Uthicke, S. Sea cucumber fisheries: Global analysis of stocks, management measures and drivers of overfishing. Fish Fish. 2013, 14, 34–59. [Google Scholar] [CrossRef]
- Brashares, J.S.; Abrahms, B.; Fiorella, K.J.; Golden, C.D.; Hojnowski, C.E.; Marsh, R.A.; McCauley, D.J.; Nuñez, T.A.; Seto, K.; Withey, L. Wildlife decline and social conflict. Science 2014, 345, 376–378. [Google Scholar] [CrossRef] [Green Version]
- Greene, C.H.; Meyer-Gutbrod, E.L.; McGarry, L.P.; Hufnagle Jr, L.C.; Chu, D.; McClatchie, S.; Packer, A.; Jung, J.-B.; Acker, T.; Dorn, H. A wave glider approach to fisheries acoustics: Transforming how we monitor the nation’s commercial fisheries in the 21st century. Oceanography 2014, 27, 168–174. [Google Scholar] [CrossRef] [Green Version]
- Fujita, R.; Cusack, C.; Karasik, R.; Takade-Heumacher, H.; Baker, C. Technologies for Improving Fisheries Monitoring; Environmental Defense Fund: San Francisco, CA, USA, 2018; pp. 1–71. [Google Scholar]
- Punt, A.E.; Ralston, S. A management strategy evaluation of rebuilding revision rules for overfished rockfish stocks. In Proceedings of the 2005 Lowell Wakefield Symposium-Biology, Assessment, and Management of North Pacific Rockfishes, University of Alaska Fairbanks, Anchorage, AK, USA, 13–15 September 2005; pp. 329–351. [Google Scholar]
- Mohn, R.; Chouinard, G. Harvest control rules for stocks displaying dynamic production regimes. ICES J. Mar. Sci. 2007, 64, 693–697. [Google Scholar] [CrossRef] [Green Version]
- Johnson, J.; Allain, V.; Bell, J.; Lehodey, P.; Nicol, S.; Senina, I. Impacts of climate change on oceanic fisheries relevant to the Pacific Islands. Pac. Mar. Clim. Change Rep. Card: Sci. Rev. 2018, 2018, 177–188. [Google Scholar]
- Pinsky, M.L.; Reygondeau, G.; Caddell, R.; Palacios-Abrantes, J.; Spijkers, J.; Cheung, W.W. Preparing ocean governance for species on the move. Science 2018, 360, 1189–1191. [Google Scholar] [CrossRef] [Green Version]
- Richards, M. From Disaster to Sustainability: The Story of the Pacific Groundfish; All Graduate Plan B and other Reports; Utah State University: Logan, UT, USA, 2017. [Google Scholar]
- Shen, C.; Chen, T. Impact of fuel subsidies on bottom trawl fishery operation in China. Mar. Policy 2022, 138, 104977. [Google Scholar] [CrossRef]
- Chai, P.; Hu, Q.; Wei, X. Influence of Fishery Subsidies on Fishing: Empirical Test Based on China’s Provincial Panel Data. Fishes 2021, 6, 40. [Google Scholar] [CrossRef]
Figure 1.
Geographical locations of the global fishery outputs from 2001 to 2020.
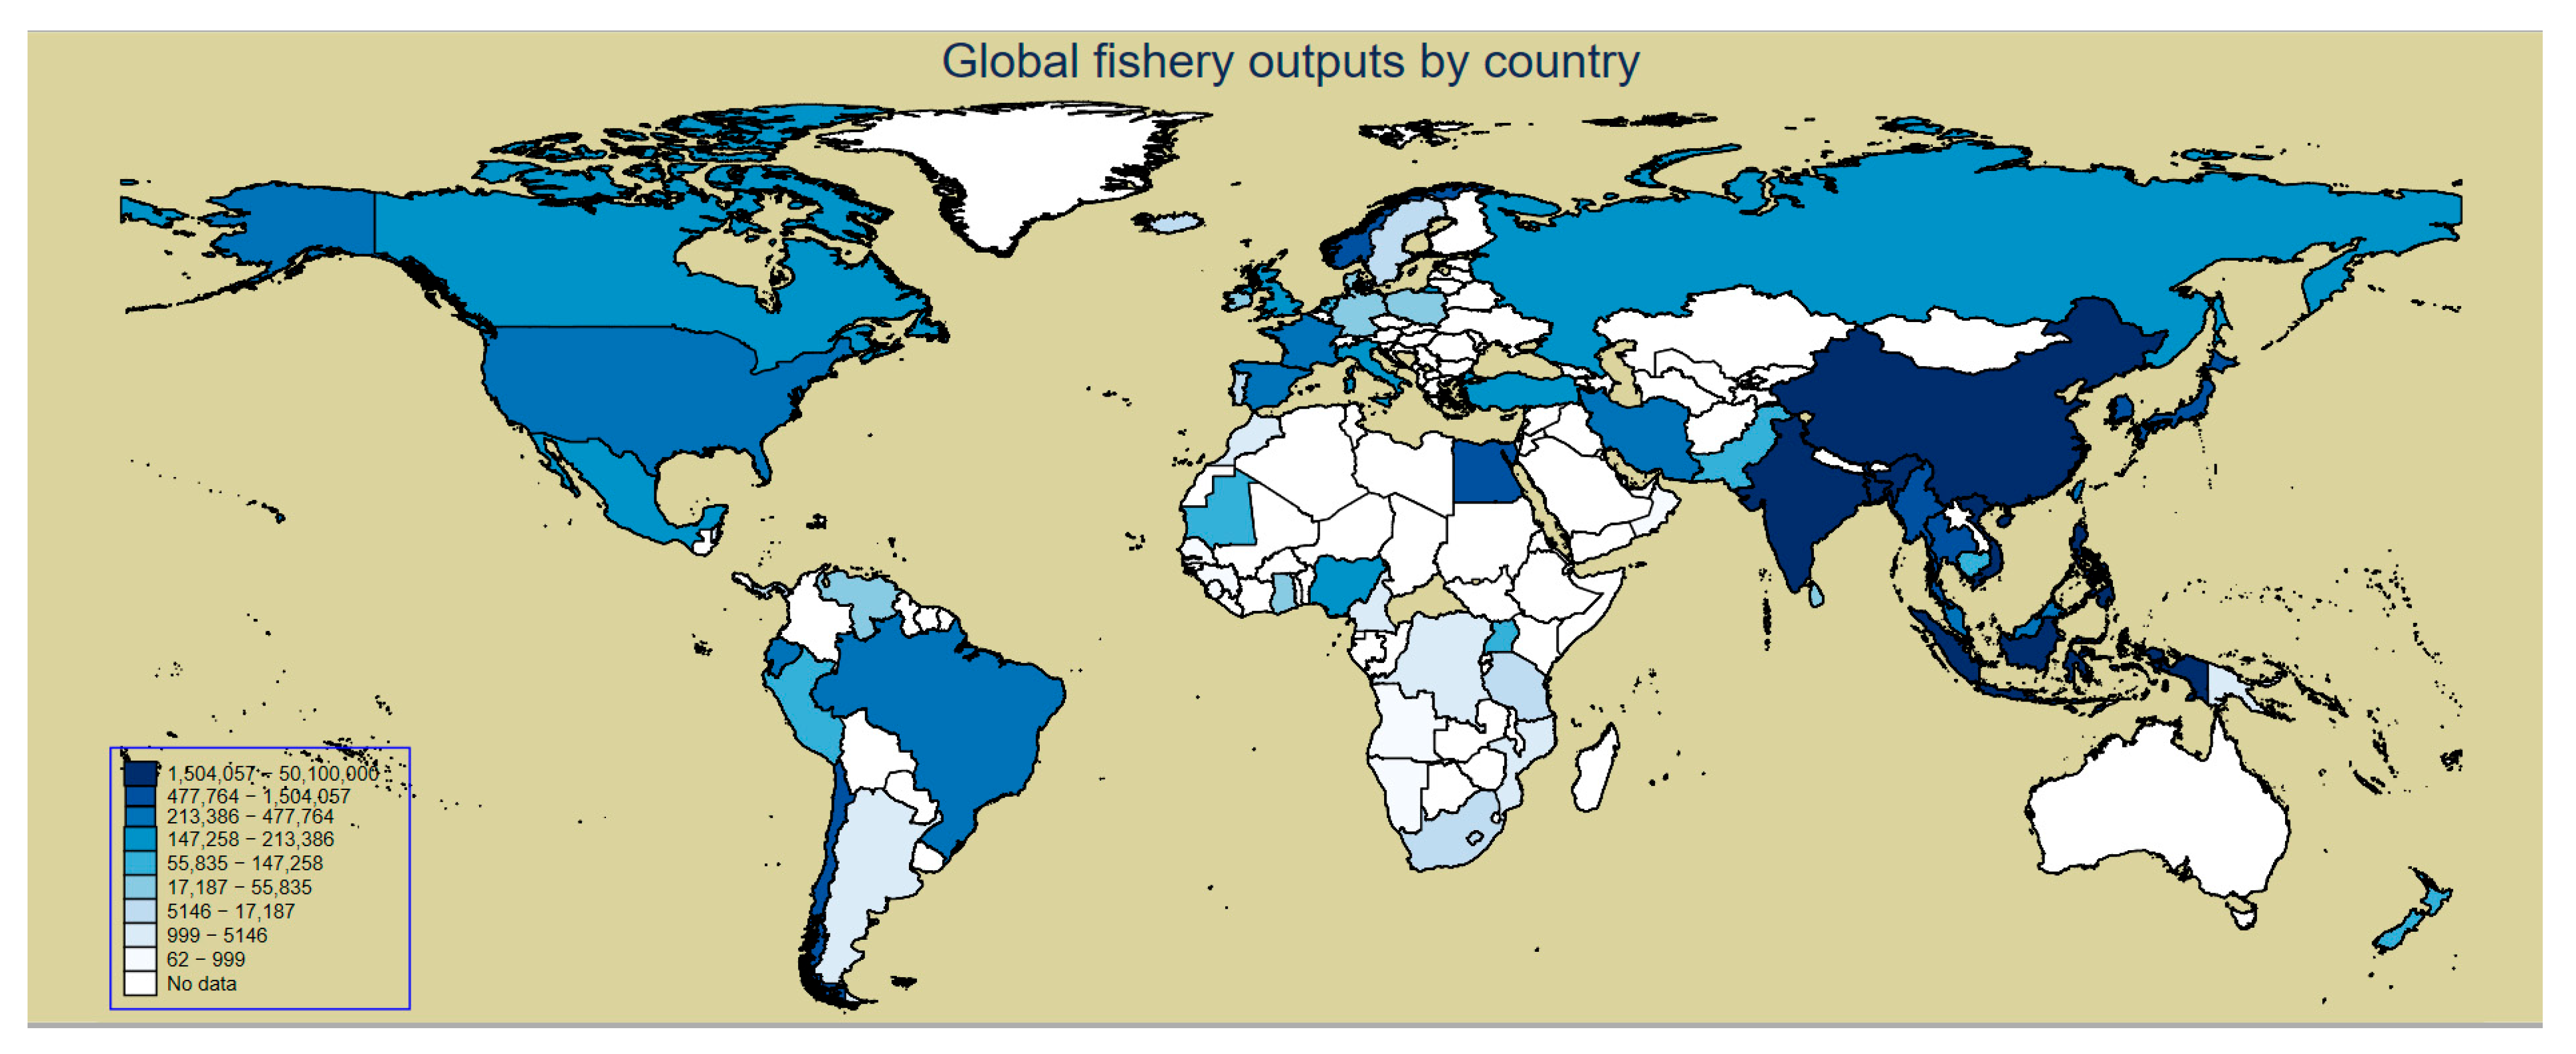
Figure 2.
The nonlinear effects of overfishing (SDG14 overfishing) and fish catch by trawling (SDG14 trawling) on global fishing outputs. (a) Threshold value of overfishing; (b) threshold value of catching fish by trawling or dredging.
Figure 2.
The nonlinear effects of overfishing (SDG14 overfishing) and fish catch by trawling (SDG14 trawling) on global fishing outputs. (a) Threshold value of overfishing; (b) threshold value of catching fish by trawling or dredging.
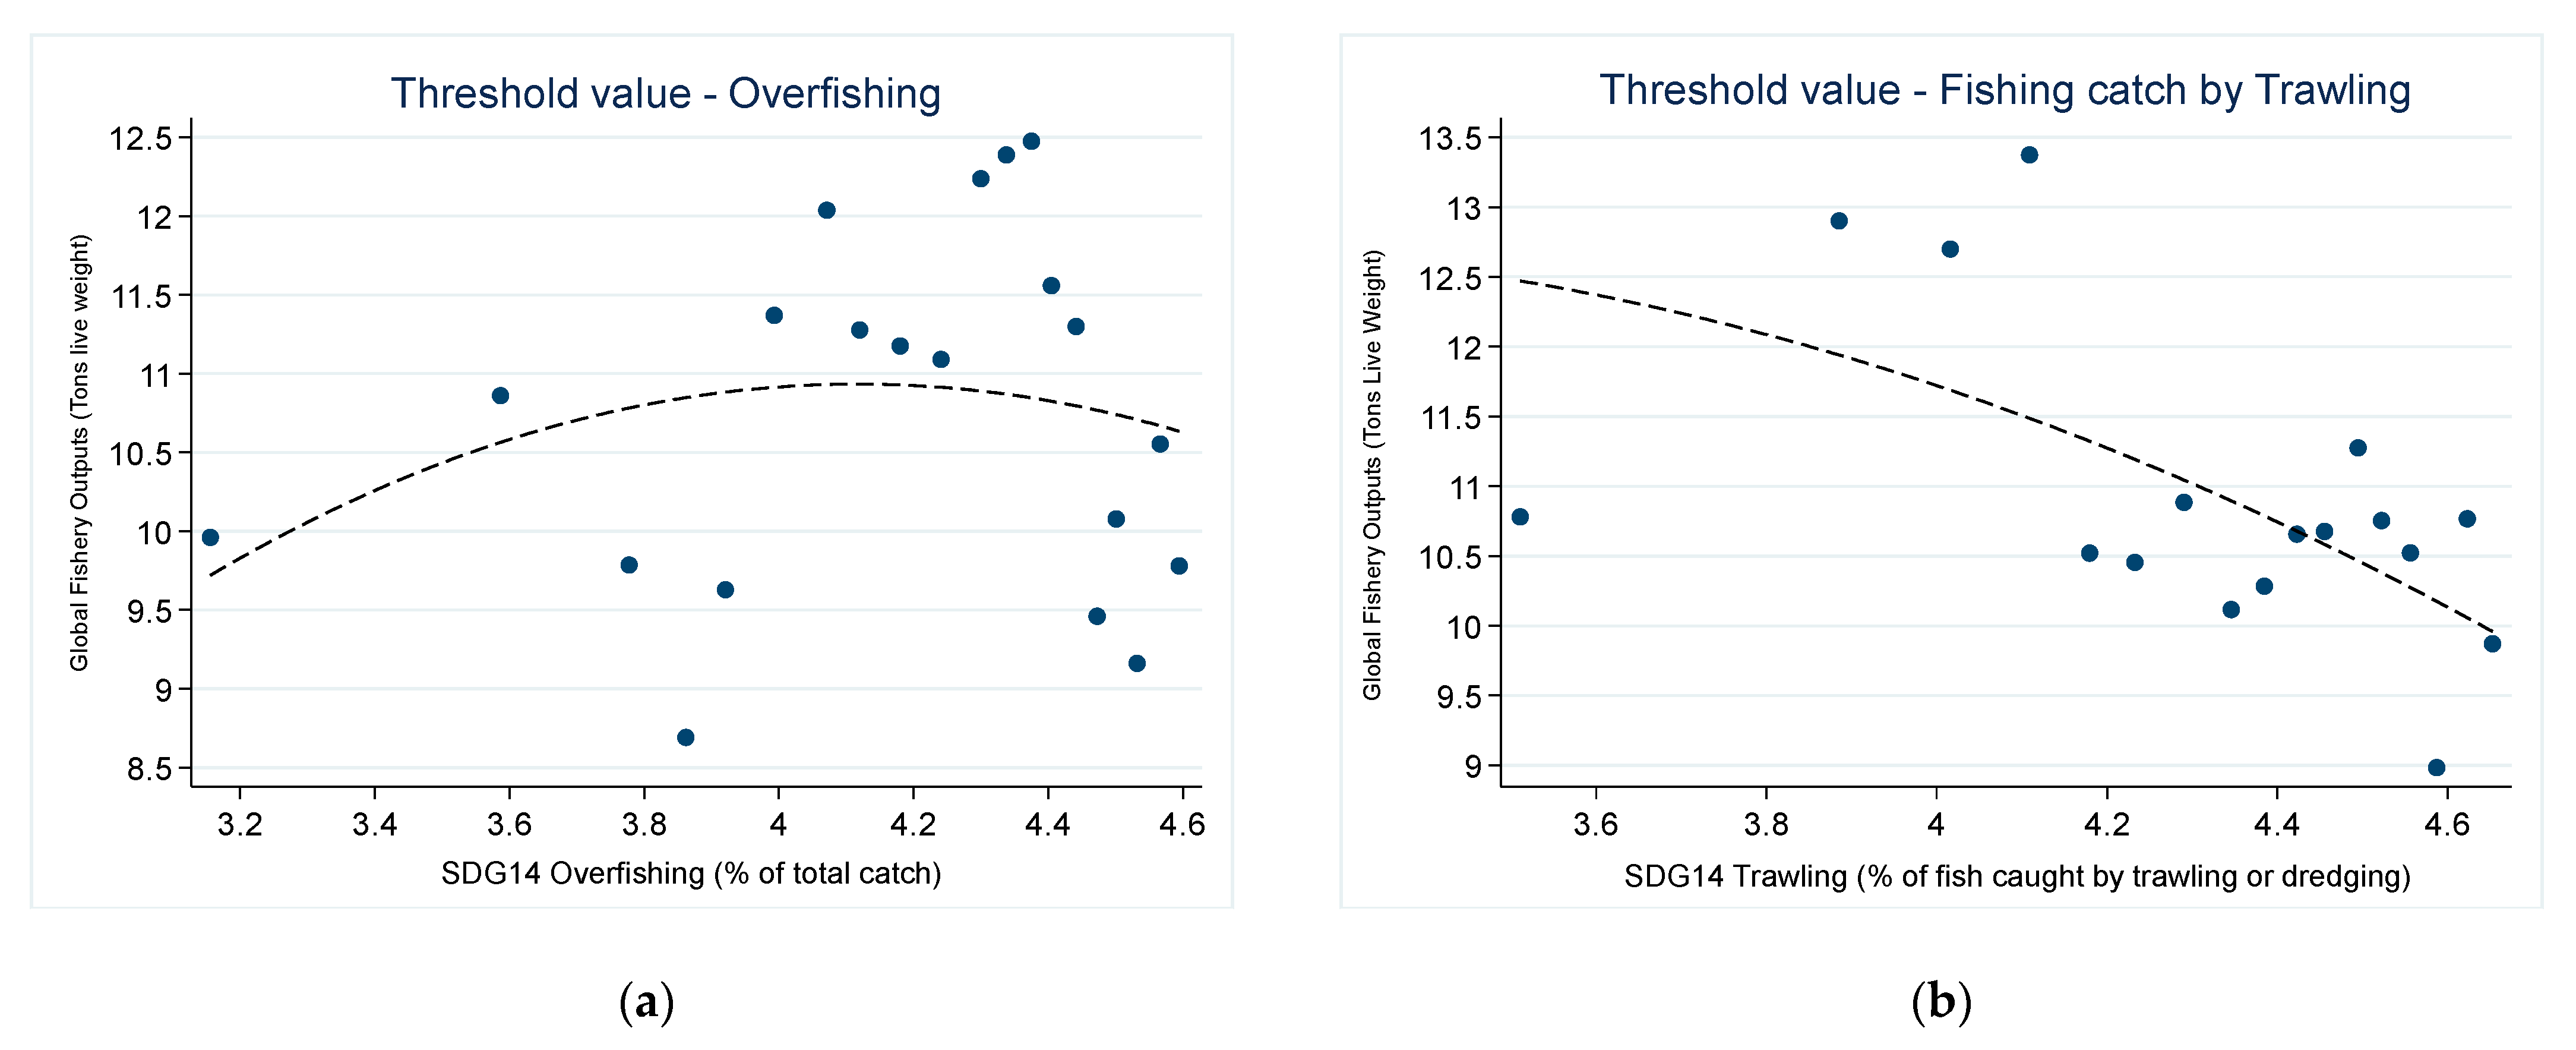
Table 1.
The descriptive statistic variables by year, region, and country from 2001 to 2020.
| Panel A: The mean value of variables by year. | |||||||||||||||||
| Year | Observations | Global Fishery Outputs | Overfishing | Trawling | NFV (Number of Fishing Vessels) | NF (Number of Fishers) | GDP Growth Rate | Poverty Rate | |||||||||
| 2001 | 62 | 716,897 | 74.33 | 80.18 | 39,653 | 527,542 | 47.67 | 18.07 | |||||||||
| 2002 | 62 | 766,203 | 74.29 | 79.81 | 40,292 | 528,153 | 48.79 | 18.02 | |||||||||
| 2003 | 62 | 812,125 | 73.33 | 80.74 | 40,124 | 537,879 | 49.20 | 17.68 | |||||||||
| 2004 | 62 | 881,533 | 71.94 | 80.77 | 38,535 | 557,982 | 50.77 | 17.23 | |||||||||
| 2005 | 62 | 935,467 | 70.31 | 81.88 | 40,880 | 541,681 | 50.18 | 16.30 | |||||||||
| 2006 | 62 | 995,938 | 67.93 | 80.98 | 40,030 | 564,652 | 50.87 | 16.02 | |||||||||
| 2007 | 62 | 1,048,080 | 66.17 | 81.49 | 40,641 | 530,685 | 50.71 | 15.61 | |||||||||
| 2008 | 62 | 1,109,958 | 65.92 | 81.28 | 41,920 | 543,191 | 48.49 | 14.92 | |||||||||
| 2009 | 62 | 1,168,047 | 65.57 | 81.42 | 42,913 | 558,465 | 45.21 | 14.16 | |||||||||
| 2010 | 62 | 1,234,563 | 65.22 | 81.57 | 41,097 | 571,106 | 49.76 | 13.17 | |||||||||
| 2011 | 62 | 1,292,839 | 65.76 | 82.09 | 41,275 | 577,512 | 49.25 | 12.87 | |||||||||
| 2012 | 62 | 1,397,460 | 65.65 | 82.94 | 40,776 | 563,890 | 48.73 | 11.30 | |||||||||
| 2013 | 62 | 1,505,387 | 64.97 | 81.64 | 38,495 | 561,428 | 48.67 | 11.13 | |||||||||
| 2014 | 62 | 1,578,629 | 65.77 | 82.22 | 42,363 | 579,659 | 48.72 | 11.31 | |||||||||
| 2015 | 62 | 1,647,904 | 68.16 | 83.04 | 41,624 | 579,574 | 48.25 | 10.64 | |||||||||
| 2016 | 62 | 1,715,094 | 69.02 | 82.19 | 41,379 | 576,410 | 48.06 | 10.96 | |||||||||
| 2017 | 62 | 1,778,825 | 69.82 | 81.87 | 41,824 | 577,776 | 48.60 | 10.49 | |||||||||
| 2018 | 62 | 1,836,535 | 70.07 | 81.75 | 40,657 | 576,055 | 48.20 | 9.75 | |||||||||
| 2019 | 62 | 1,897,315 | 69.24 | 81.69 | 39,214 | 572,649 | 47.70 | 10.15 | |||||||||
| 2020 | 62 | 1,941,143 | 68.92 | 81.77 | 39,721 | 559,559 | 41.49 | 9.92 | |||||||||
| Panel B: The mean value of variables by world region. | |||||||||||||||||
| Region | Observations | Global Fishery Outputs | Overfishing | Trawling | NFV (Number of Fishing Vessels) | NF (Number of Fishers) | GDP Growth Rate | Poverty Rate | |||||||||
| Africa | 280 | 29,353 | 73.61 | 87.90 | 9150 | 191,327 | 50.92 | 39.15 | |||||||||
| Europe and Central Asia | 40 | 74,129 | 60.04 | 99.91 | 1004 | 85,834 | 50.13 | 5.42 | |||||||||
| South East Asia | 260 | 5,535,225 | 81.11 | 72.97 | 120,028 | 2,199,454 | 51.71 | 12.15 | |||||||||
| Latin America and the Caribbean (LAC) | 140 | 120,545 | 64.97 | 95.24 | 13,525 | 157,712 | 48.77 | 6.83 | |||||||||
| The Middle East and North Africa (MENA) | 80 | 297,380 | 81.30 | 72.63 | 29,505 | 211,453 | 49.49 | 4.08 | |||||||||
| OECD | 420 | 326,311 | 56.35 | 76.95 | 29,423 | 49,295 | 44.28 | 0.68 | |||||||||
| Oceania | 20 | 2829 | 86.03 | 105.00 | 514 | 248,000 | 50.09 | 40.90 | |||||||||
| Note: GFO is the global fishing outputs (tons live weight); Overfishing is the fish caught from overexploited or collapsed stocks (% of the total catch); Trawling is the fish caught by trawling or dredging (% of fish caught by trawling); NFV is the global number of fishing vessels (number of motorized vessels propelled by engines); NF is the global number of fishers (number); GDP growth rate is the gross domestic product annual growth rate (annual %); Poverty rate is the proportion of poverty headcount at national poverty lines (% of population). All variables are reported clearly in Appendix A. | |||||||||||||||||
| Panel C: The mean values of variables by country. | |||||||||||||||||
| Country | Observations | Global Fishery Outputs | Over-Fishing | Trawling | NFV (Number of Fishing Vessels) | NF (Number of Fishers) | GDP Growth Rate | Poverty Rate | Country | Observations. | Global Fishery Outputs | Over-Fishing | Trawling | NFV (Number of Fishing Vessels) | NF (Number of Fishers) | GDP Growth Rate | Poverty Rate |
| Angola | 20 | 553 | 88.52 | 68.65 | 2467 | 84,676 | 51.17 | 17.08 | Mozambique | 20 | 1735 | 83.66 | 105.00 | 1096 | 224,555 | 52.49 | 70.95 |
| Argentina | 20 | 2727 | 58.79 | 53.11 | 1490 | 19,887 | 47.61 | 2.34 | Myanmar | 20 | 748,168 | 85.57 | 54.63 | 15,090 | 2,909,199 | 55.47 | 3.47 |
| Bangladesh | 20 | 1,525,550 | 98.27 | 90.67 | 27,206 | 1,500,570 | 52.07 | 19.35 | Namibia | 20 | 426 | 75.59 | 68.42 | 218 | 19,906 | 49.27 | 22.60 |
| Belize | 20 | 5147 | 44.69 | 104.95 | 586 | 3074 | 48.08 | 5.51 | Netherlands | 20 | 55,836 | 48.22 | 75.79 | 840 | 2526 | 47.24 | 0.10 |
| Brazil | 20 | 419,035 | 81.80 | 91.02 | 31,591 | 848,764 | 48.09 | 6.83 | New Zealand | 20 | 103,553 | 51.07 | 58.47 | 1420 | 1847 | 48.71 | 0.15 |
| Cambodia | 20 | 110,637 | 69.95 | 33.11 | 56,417 | 501,575 | 53.17 | 33.95 | Nigeria | 20 | 184,074 | 85.72 | 96.20 | 36,779 | 1,122,825 | 51.40 | 44.92 |
| Cameroon | 20 | 1235 | 48.25 | 96.41 | 8669 | 173,570 | 50.10 | 25.99 | Norway | 20 | 1,034,438 | 76.66 | 82.06 | 6619 | 12,746 | 47.54 | 0.19 |
| Canada | 20 | 169,108 | 55.17 | 80.02 | 19,795 | 41,199 | 48.28 | 0.22 | Oman | 20 | 333 | 97.55 | 98.19 | 15,089 | 42,455 | 48.88 | 10.58 |
| Chile | 20 | 962,062 | 60.00 | 104.94 | 13,218 | 53,883 | 49.33 | 2.07 | Pakistan | 20 | 127,439 | 62.93 | 105.00 | 13,502 | 371,384 | 50.09 | 13.94 |
| China | 20 | 50,100,000 | 81.34 | 55.21 | 592,406 | 8,709,106 | 54.78 | 12.67 | Panama | 20 | 7495 | 52.61 | 104.84 | 8463 | 36,459 | 50.95 | 4.84 |
| Congo, DP | 20 | 3072 | 43.64 | 105.00 | 19,424 | 275,254 | 51.28 | 81.69 | Papua New Guinea | 20 | 2829 | 86.03 | 105.00 | 514 | 248,000 | 50.09 | 40.90 |
| Denmark | 20 | 37,026 | 59.95 | 66.71 | 2686 | 2300 | 47.21 | 0.21 | Peru | 20 | 73,430 | 94.71 | 104.63 | 4181 | 85,841 | 50.17 | 9.56 |
| Ecuador | 20 | 311,597 | 64.85 | 105.00 | 16,444 | 63,653 | 49.00 | 7.37 | Philippines | 20 | 2,149,586 | 83.65 | 97.81 | 183,824 | 1,927,922 | 50.86 | 10.39 |
| Egypt | 20 | 937,234 | 66.93 | 52.32 | 4583 | 139,358 | 50.33 | 2.30 | Poland | 20 | 36,934 | 38.38 | 66.82 | 839 | 4534 | 49.56 | 0.60 |
| France | 20 | 213,387 | 74.21 | 76.70 | 5845 | 15,120 | 46.93 | 0.29 | Portugal | 20 | 9526 | 22.01 | 68.65 | 7178 | 17,423 | 46.38 | 0.43 |
| Georgia | 20 | 999 | 49.90 | 98.97 | 26 | 2200 | 51.05 | 10.51 | Russian Federati | 20 | 147,259 | 70.18 | 100.86 | 1982 | 169,469 | 49.21 | 0.33 |
| Germany | 20 | 40,757 | 45.51 | 88.83 | 1660 | 2954 | 47.08 | 0.01 | Senegal | 20 | 534 | 63.50 | 87.15 | 7199 | 65,597 | 50.09 | 36.97 |
| Ghana | 20 | 25,459 | 63.04 | 97.16 | 12,689 | 234,408 | 51.99 | 34.84 | Sierra Leone | 20 | 62 | 98.25 | 88.09 | 7442 | 63,570 | 51.58 | 46.98 |
| Guinea | 20 | 315 | 90.71 | 82.08 | 1398 | 33,406 | 50.68 | 34.37 | South Africa | 20 | 6294 | 61.19 | 80.89 | 1784 | 17,748 | 48.21 | 22.13 |
| Iceland | 20 | 11,300 | 50.24 | 85.72 | 1731 | 4633 | 48.68 | 0.05 | Spain | 20 | 282,526 | 54.54 | 59.32 | 10,357 | 32,710 | 47.13 | 0.81 |
| India | 20 | 4,424,787 | 94.49 | 53.51 | 118,084 | 7,521,681 | 52.01 | 27.82 | Sri Lanka | 20 | 17,187 | 84.94 | 105.00 | 25,568 | 223,890 | 50.73 | 5.05 |
| Indonesia | 20 | 8,326,168 | 81.64 | 63.16 | 386,143 | 3,609,297 | 50.99 | 17.52 | Sweden | 20 | 10,154 | 65.13 | 77.89 | 1382 | 1646 | 48.03 | 0.48 |
| Iran | 20 | 250,713 | 70.38 | 103.38 | 79,420 | 552,670 | 48.96 | 0.94 | Taiwan | 20 | 315,074 | 81.97 | 87.39 | 21,872 | 243,565 | 49.68 | 0.46 |
| Ireland | 20 | 46,859 | 58.59 | 91.89 | 1764 | 5547 | 11.22 | 0.26 | Tanzania | 20 | 8592 | 80.33 | 105.00 | 14,149 | 174,718 | 52.29 | 48.82 |
| Italy | 20 | 158,380 | 37.03 | 50.60 | 12,029 | 30,454 | 45.85 | 1.11 | Thailand | 20 | 1,107,688 | 52.24 | 88.24 | 18,243 | 182,686 | 49.53 | 2.64 |
| Japan | 20 | 1,140,500 | 51.09 | 85.39 | 266,099 | 196,766 | 46.56 | 0.27 | Turkey | 20 | 196,146 | 56.96 | 73.39 | 17,813 | 62,021 | 11.84 | 0.98 |
| Korea, Rep. | 20 | 1,504,057 | 71.60 | 67.56 | 75,352 | 145,059 | 49.80 | 0.22 | Uganda | 20 | 70,290 | 60.96 | 76.21 | 6464 | 80,487 | 52.31 | 50.07 |
| Malaysia | 20 | 381,815 | 79.55 | 72.61 | 44,522 | 120,701 | 50.43 | 0.61 | United Kingdom | 20 | 199,784 | 60.65 | 78.95 | 6504 | 12,389 | 47.26 | 0.26 |
| Mauritania | 20 | 108,299 | 87.13 | 74.29 | 8328 | 107,849 | 49.99 | 10.68 | United States | 20 | 477,764 | 68.92 | 82.05 | 76,140 | 149,443 | 47.79 | 1.00 |
| Mexico | 20 | 162,436 | 77.41 | 94.20 | 88,624 | 239,990 | 47.50 | 4.52 | Venezuela | 20 | 24,384 | 57.30 | 103.13 | 31,922 | 46,306 | 47.53 | 11.39 |
| Morocco | 20 | 1240 | 90.34 | 36.62 | 18,929 | 111,330 | 49.80 | 2.52 | Vietnam | 20 | 2,658,570 | 97.92 | 42.25 | 57,484 | 771,327 | 52.48 | 10.06 |
Note: GFO is the global fishing outputs (tons live weight); Overfishing is the fish caught from overexploited or collapsed stocks (% of the total catch); Trawling is the fish caught by trawling or dredging (% of fish caught by trawling); NFV is the global number of fishing vessels (number of motorized vessels propelled by engines); NF is the global number of fishers (number); GDP growth rate is the gross domestic product annual growth rate (annual %); Poverty rate is the proportion of poverty headcount at national poverty lines (% of population). All variables are reported clearly in Appendix A.
Table 2.
Descriptive statistics of 62 countries, 2001–2020.
| Variables | Measurement Unit | Obs. | Mean | Std Dev. | Minimum | Maximum |
|---|---|---|---|---|---|---|
| Log of global fishing outputs (GFO) | Tons live weight | 1240 | 10.754 | 3.029 | 0.693 | 18.071 |
| Log of global number of fishing vessels (NFV) | Number of motorized vessels propelled by engines | 1240 | 9.047 | 1.867 | 3.258 | 13.453 |
| Log of global number of fishers (NF) | Number of fishers | 1240 | 11.184 | 2.082 | 5.298 | 16.182 |
| Log of SDG14_ overfishing | % of total catch | 1240 | 4.171 | 0.366 | 2.194 | 4.604 |
| Log of SDG14_trawling | % of fish caught by trawling | 1240 | 4.361 | 0.312 | 1.609 | 4.654 |
| High income (HIC) | Dummy variable | 1240 | 0.323 | 0.468 | 0.000 | 1.000 |
| Lower-middle income (LMIC) | Dummy variable | 1240 | 0.339 | 0.473 | 0.000 | 1.000 |
| Upper-middle income (UMIC) | Dummy variable | 1240 | 0.242 | 0.428 | 0.000 | 1.000 |
| Technological progress (Time trend) | Year from 2001–2020 | 1240 | 10.5 | 5.768 | 1.000 | 20.000 |
| Log of GDP growth rate | % of annual | 1240 | 3.851 | 0.319 | 0.270 | 4.284 |
| Log of Poverty rate | % of population | 1240 | 2.024 | 1.192 | 0.693 | 4.538 |
Note: Sample countries include Bangladesh, Sierra Leone, Vietnam, Oman, Peru, India, Guinea, Morocco, Angola, Mauritania, Papua New Guinea, Nigeria, Myanmar, Sri Lanka, Mozambique, Philippines, Taiwan, Brazil, Indonesia, China, Tanzania, Malaysia, Mexico, Norway, Namibia, France, South Korea, Iran, Russian Federation, Cambodia, United States, Egypt, Arab Rep., Sweden, Ecuador, Senegal, Ghana, Pakistan, South Africa, Uganda, United Kingdom, Chile, Denmark, Argentina, Ireland, Venezuela, Turkey, Canada, Spain, Panama, Thailand, Japan, New Zealand, Iceland, Georgia, Cameroon, Netherlands, Germany, Belize, Congo, Dem. Rep., Poland, Italy, and Portugal.
Table 3.
Pearson correlation results.
| Variables | GFO | NFV | NF | SDG14 Overfishing | SDG14 Trawling | HIC | LMIC | UMIC | GDP Growth Rate | Poverty Rate |
|---|---|---|---|---|---|---|---|---|---|---|
| GFO | 1 | |||||||||
| NFV | 0.601 | 1 | ||||||||
| NF | 0.419 | 0.720 | 1 | |||||||
| SDG14 Overfishing | −0.563 | 0.216 | 0.437 | 1 | ||||||
| SDG14 Trawling | −0.205 | −0.151 | −0.822 | −0.138 | 1 | |||||
| HIC | 0.139 | −0.981 | −0.549 | −0.363 | −0.706 | 1 | ||||
| LMIC | 0.204 | 0.193 | 0.484 | 0.304 | −0.137 | −0.494 | 1 | |||
| UMIC | 0.336 | −0.538 | 0.201 | −0.0949 | 0.129 | −0.390 | −0.404 | 1 | ||
| GDP growth rate | −0.305 | 0.678 | 0.190 | 0.124 | −0.331 | −0.144 | 0.179 | −0.100 | 1.000 | |
| Poverty rate | −0.409 | 0.170 | 0.381 | 0.296 | 0.149 | −0.620 | 0.406 | −0.476 | 0.228 | 1 |
Note: This table represents the Pearson correlation coefficients of major variables for the full sample of countries. The results of primary Pearson correlations are significant at the 5 percent level or higher, excluding the Pearson correlations in italics. GFO = global fishing outputs; NFV = global number of fishing vessels; NF = global number of fishers; SDG14 Overfishing = sustainable development goals—fish stocks; SDG14 Trawling = sustainable development goals—trawling or dredging; HIC = high income; LMIC = low-middle income; UMIC = upper-middle income, GDP growth rate = the gross domestic product annual growth rate, and Poverty rate = poverty headcount ratio at national poverty lines.
Table 4.
Threshold estimates of using different threshold variables.
| Sample Split | SDG14 Overfishing | SDG14 Trawling |
|---|---|---|
| Model 1 | Model 2 | |
| The Lagrange multiplier test for no threshold | 139.600 | 118.718 |
| Bootstrap p-value | 0.0004 | 0.0001 |
| Threshold estimate | 4.4456 | 4.5516 |
| 95% Confidence Interval | (4.396, 4.455) | (4.5077, 4.5523) |
Table 5.
Regression results using different threshold variables. Dependent variable: global fishery outputs.
Table 5.
Regression results using different threshold variables. Dependent variable: global fishery outputs.
| Variables | Panel GLS without threshold | Threshold Model 1 = SDG14 Overfishing | Threshold Model 2 = SDG14 Trawling | ||
|---|---|---|---|---|---|
| Regime 1 | Regime 2 | Regime 1 | Regime 2 | ||
| Overfishing ≤ 4.4456 | Overfishing > 4.4456 | Trawling ≤ 4.5516 | Trawling > 4.5516 | ||
| Constant | −4.402 ** | −2.548 ** | −10.46 ** | −5.106 ** | −2.981 ** |
| [−9.150] | [−5.332] | [−10.524] | [−14.489] | [−4.869] | |
| Logarithm (NFV) | 0.552 ** | 0.412 ** | 0.776 ** | 0.728 ** | 0.283 ** |
| [10.023] | [7.501] | [7.399] | [18.473] | [7.170] | |
| Logarithm (NF) | 0.605 ** | 0.623 ** | 0.927 ** | 0.576 ** | 0.599 ** |
| [9.967] | [10.237] | [7.786] | [16.919] | [9.160] | |
| High income (HIC) | 4.557 ** | 4.017 ** | −0.358 | 4.400 ** | 4.515 ** |
| [17.689] | [14.543] | [−0.596] | [13.925] | [12.504] | |
| Lower-middle income (LMIC) | 1.755 ** | 0.951 ** | 1.634 ** | 1.932 ** | 1.985 ** |
| [7.867] | [3.814] | [4.385] | [5.944] | [12.962] | |
| Upper-middle income (UMIC) | 3.031 ** | 2.221 ** | 3.400 ** | 2.515 ** | 3.513 ** |
| [13.079] | [8.872] | [7.913] | [8.040] | [22.514] | |
| Technological progress (Time trend) | 0.0574 ** | 0.0659 ** | 0.0255 | 0.0435 ** | 0.0809 ** |
| [5.482] | [6.554] | [1.184] | [10.515] | [8.786] | |
| Observationss | 1240 | 905 | 335 | 829 | 411 |
| Wald χ2 | 7848 ** | 4489 ** | 3731 ** | 6797 ** | 1186 ** |
| Prob > χ2 | 0.0000 | 0.0000 | 0.0000 | 0.0000 | 0.0000 |
Notes: the t-statistics results are shown in square parentheses (white-corrected for heteroscedasticity). The findings correspond to a 15%-trimmed mean. ** indicate 1% level of statistical significance, respectively.
Table 6.
Threshold estimates of using different threshold variables after adding country control variables (GDP growth rate and poverty rate).
Table 6.
Threshold estimates of using different threshold variables after adding country control variables (GDP growth rate and poverty rate).
| Sample Split | SDG14 Overfishing | SDG14 Trawling |
|---|---|---|
| Model 1 | Model 2 | |
| The Lagrange multiplier test for no threshold | 139.600 | 96.704 |
| Bootstrap p-value | 0.0004 | 0.0001 |
| Threshold estimate | 4.4456 | 4.4038 |
| 95% Confidence Interval | (4.396, 4.455) | (4.1596, 4.4073) |
Table 7.
Regression results using different threshold variables after adding country control variables (GDP growth rate and poverty rate). Dependent variable: global fishery outputs.
Table 7.
Regression results using different threshold variables after adding country control variables (GDP growth rate and poverty rate). Dependent variable: global fishery outputs.
| Variables | Panel GLS without Threshold | Threshold Model 1 = SDG14 Overfishing | Threshold Model 2 = SDG14 Trawling | ||
|---|---|---|---|---|---|
| Regime 1 | Regime 2 | Regime 1 | Regime 2 | ||
| Overfishing ≤ 4.4456 | Overfishing > 4.4456 | Trawling ≤ 4.4038 | Trawling > 4.4038 | ||
| Constant | 2.326 ** | 3.901 ** | −5.234 ** | −0.0769 ** | 4.826 ** |
| [3.234] | [16.980] | [−7.584] | [−0.295] | [18.108] | |
| Logarithm (NFV) | 0.493 ** | 0.423 ** | 0.488 ** | 0.966 ** | 0.243 ** |
| [10.422] | [20.701] | [7.710] | [28.849] | [9.677] | |
| Logarithm (NF) | 0.602 ** | 0.457 ** | 1.203 ** | 0.215 ** | 0.699 ** |
| [13.014] | [25.262] | [17.205] | [7.593] | [21.714] | |
| Logarithm of GDP growth rate | 0.00163 | 0.164 ** | −0.274 * | 0.392 ** | −0.331 ** |
| [0.009] | [3.327] | [−1.911] | [7.926] | [−4.678] | |
| Logarithm of poverty rate | −1.433 ** | −1.322 ** | −1.096 ** | −0.861 ** | −1.438 ** |
| [−25.124] | [−58.985] | [−18.631] | [−19.457] | [−38.016] | |
| Technological progress (Time trend) | 0.0117 | 0.0202 ** | −0.00578 | 0.0379 ** | −0.00385 |
| [1.195] | [5.644] | [−0.515] | [8.648] | [−0.789] | |
| Observations | 1240 | 905 | 335 | 558 | 682 |
| Wald χ2 | 6932 ** | 6216 ** | 3137 ** | 5044 ** | 5705 ** |
| Prob > χ2 | 0.0000 | 0.0000 | 0.0000 | 0.0000 | 0.0000 |
Notes: The t-statistics results are shown in square parentheses (white-corrected for heteroscedasticity). The findings correspond to a 15% trimming percentage. * and ** indicate 5% and 1% level of statistical significance, respectively.
Disclaimer/Publisher’s Note: The statements, opinions and data contained in all publications are solely those of the individual author(s) and contributor(s) and not of MDPI and/or the editor(s). MDPI and/or the editor(s) disclaim responsibility for any injury to people or property resulting from any ideas, methods, instructions or products referred to in the content. |
© 2023 by the authors. Licensee MDPI, Basel, Switzerland. This article is an open access article distributed under the terms and conditions of the Creative Commons Attribution (CC BY) license (https://creativecommons.org/licenses/by/4.0/).
Share and Cite
MDPI and ACS Style
Pham, C.-V.; Wang, H.-C.; Chen, S.-H.; Lee, J.-M. The Threshold Effect of Overfishing on Global Fishery Outputs: International Evidence from a Sustainable Fishery Perspective. Fishes 2023, 8, 71. https://doi.org/10.3390/fishes8020071
AMA Style
Pham C-V, Wang H-C, Chen S-H, Lee J-M. The Threshold Effect of Overfishing on Global Fishery Outputs: International Evidence from a Sustainable Fishery Perspective. Fishes. 2023; 8(2):71. https://doi.org/10.3390/fishes8020071
Chicago/Turabian StylePham, Ca-Van, Hui-Cheng Wang, Sheng-Hung Chen, and Jie-Min Lee. 2023. "The Threshold Effect of Overfishing on Global Fishery Outputs: International Evidence from a Sustainable Fishery Perspective" Fishes 8, no. 2: 71. https://doi.org/10.3390/fishes8020071