
Shark Provisioning Influences the Gut Microbiota of the Black-Tip Reef Shark in French Polynesia
by
 , , and
Anaïs Esposito
1,2,3 ,
,
Pierre Sasal
1,4,*,
Éric Clua
4,5,
Emese Meglécz
2 and
Camille Clerissi
1,4 1
CRIOBE, EPHE, Université PSL, UPVD, CNRS, UAR 3278, 52 Avenue Paul Alduy, CEDEX 09, 66860 Perpignan, France
2
Aix Marseille Univ, Avignon Univ, CNRS, IRD, IMBE, 84029 Marseille, France
3
UMR CNRS SPE 6134, Université de Corse Pascal Paoli, F-20250 Corte, France
4
Laboratoire d’Excellence «CORAIL», CRIOBE, 98729 Moorea, French Polynesia
5
CRIOBE, EPHE, Université PSL, UPVD, CNRS, UAR 3278, BP1013, 98729 Moorea, French Polynesia
*
Author to whom correspondence should be addressed.
Fishes 2022, 7(6), 312; https://doi.org/10.3390/fishes7060312
Submission received: 14 September 2022
/
Revised: 24 October 2022
/
Accepted: 27 October 2022
/
Published: 29 October 2022
(This article belongs to the Section Biology and Ecology)
Abstract
:There is an increasing interest in touristic observations of top predators in the wild. Sharks are probably the most sought-after animal in marine ecosystems by divers. Regulations have been put in place, and even if they are more or less respected, providing food is still used in some places in order to attract wild animals. Because of the difficulty in sampling shark guts, few studies have analyzed the microbiota of sharks, and none have evaluated the effect of feeding on this microbiota. In this work, we compare microbiota assemblages of black-tip sharks between sites with and without regular feeding. Our results revealed a significant feeding effect on both alpha and beta diversities of microbiota. Notably, the alpha diversity of fed sharks was lower than unfed sharks. We hypothesize that this result is related to a lower diversity of food intake by sharks in places where feeding is regularly provided. More studies need to be conducted in order to estimate the impact of feeding on shark physiology.
1. Introduction
Sharks are among the most highly threatened species worldwide [1,2]. They are recognized as key species in ecosystems because they are apex predators but also because they provide considerable ecosystem services [3]. Reef sharks are especially threatened by a large set of anthropogenic stressors in connection with the economic activity and the political and/or socio-economic conditions of coastal human populations [4]. Therefore, opportunities for the conservation of reef sharks should be encouraged, notably through the creation of national sanctuaries. In French Polynesia, sharks are emblematic species for Polynesians. Consequently, all French Polynesian waters were decreed as a shark sanctuary in 2006 and are now listed as one of the best-performing places in terms of shark conservation [4]. However, there is still strong pressure from touristic activities, and shark diving has notably developed exponentially during the last decade [5,6]. Even if these activities are regulated, controlled, and even prohibited, most touristic operators provide underwater food in order to attract sharks for observation and to ensure regular sightings of sharks [7].
However, there is little knowledge concerning the effect of provisioning on sharks and, particularly, on their gut microbiota. Indeed, gut microbiota play a central role in digestion and the health status of their host [8]. Studies on fish microbiota have increased these last years, showing that individual factors may affect the bacterial community, such as host sex [9] or development stage [10]. Environmental factors may also influence microbiota [11], and diet seems to be one of the major factors affecting its composition [9,12,13,14,15,16]. Indeed, several studies have shown that in rearing conditions, the intestinal microbiota is food-dependent, and this could be in terms of both alpha (i.e., within each sample) and beta diversity (i.e., between samples) [17,18]. Literature on shark microbial communities is still sparse, probably because of the difficulties linked with the sampling protocol [19,20,21,22,23]. Most of these studies have considered skin microbiota or the microbiota of dead sharks, and none have investigated the factors influencing the variability of bacterial diversity within the gut of living sharks. Recently, a pioneer study on shark fecal microbiomes was conducted on large pelagic shark species [24], revealing a taxon-poor microbiome and a potential role of diet in its composition.
Understanding how anthropogenic stressors alter animal microbiota is a challenging question for researchers. This could be even more challenging when the model system is a protected top predator that has to be kept alive during manipulation. Furthermore, nutritional physiology in terms of digestive biochemistry and gastrointestinal microbiota relationships is still unknown for most sharks [25]. Thereafter, the aim of this study is, first, to develop a non-lethal method for studying shark gut microbiota and, second, to use this method to test the potential effect of reef shark feeding activity on the bacterial community in terms of alpha and beta diversity. In particular, this study was done on the black-tip reef shark (hereafter named BRS), and we hypothesized a potential change in the bacterial community between sites where feeding is regularly provided and sites where sharks eat only non-provided food. Because of a lower diversity in provided food (usually tuna remains) compared to natural food, we expect a reduction in bacterial diversity in sites where food is provided for touristic activities.
2. Materials and Methods
2.1. Shark and Gut-Content Sampling
We sampled gut content from 59 Carcharhinus melanopterus between August 2016 and November 2019 (19 in 2016, 5 in 2017, and 35 in 2019; 17 during the dry season and 42 during the wet season) at four sites around Moorea Island (French Polynesia, n = 30), and five sites in the Tuamotu Archipelago (French Polynesia): three sites in Fakarava Atoll (n = 19), one in Tikehau Atoll (n = 5), and one in Makemo Atoll (n = 5) (Table S2 and Figure 1). Shark feeding is quite common on Moorea Island, while the Tuamotu atolls are preserved from this touristic activity.
We lured BRS with both pieces of fish and surface agitation noise and caught them with barbless hooks. We then placed them in lateral decubitus (either on the beach or in harnesses), which resulted in tonic immobility and facilitated the handling of sharks. We measured the total length of each BRS (from the snout tip to the end of the upper caudal lobe) and reported their sex (presence/absence of pterygopods). We inserted a urinary catheter linked to a syringe in the colon to dilute the gut content with seawater. We collected 20 mL of gut content, which was immediately stored in a 45 mL tube with 20 mL of ethanol (70%). Samples were stored at 10 °C on the boat and then at −20 °C prior to DNA extraction. The hooks were removed with pliers, and the sharks were released at the sampling point in less than 10 min after the catch. Samplings were allowed by a permit from the Environment Department of French Polynesia (ref. 5129/MCE/ENV of 22 June 2016).
2.2. Microbiota Metabarcoding
2.2.1. DNA Extraction and Controls
We extracted DNA from gut contents in a dedicated room using a DNeasy mericon® Food Kit (Qiagen, Hilden, Germany), following the protocol detailed in [26] and the specific safety measures described in [27]. In order to further minimize and control possible cross-sample contamination, extraction series were limited to 20 gut-content samples and additionally included one exogenous control (Mediterranean benthic substrate), one extraction negative control, and one aerosol negative control. We used these controls to evaluate potential cross-sample or exogenous contaminations. Additionally, our analyses also included the two mock samples from the ZymoBiomics™ Microbial Community DNA Standard (Zymo Research, Irvine, CA, USA) as positive controls and standards.
2.2.2. Library Construction and Sequencing
Libraries were generated using a two-step PCR strategy adapted from [28] and [29]. First (PCR1), samples and controls were amplified by PCR in triplicates using the primers 515FY [30] and 806RB [31], which target a 253 bp fragment of the 16S ribosomal (rRNA) gene (V3–V4 regions) (see Table S1 for details). The 515FY and 806RB primers were (i) tagged by short nucleotide sequences (11–13 nt) (described in [30]) differentiated by at least three nucleotides and (ii) modified by adding the partial overhang Illumina sequencing primers in their 5′ ends. Twelve and eight distinct tags were used to label the forward and reverse primers, respectively, and enabled the individualization of each sample in PCR replicates. We then pooled amplicons, respecting replicates, and purified the six amplicon pools using the Wizard®SV Gel and PCR Clean-Up System (Promega, Madison, WI, USA). During the second PCR (PCR2), we used the purified amplicons from PCR1 as the DNA template. PCR2 consisted of a 12-cycle amplification step to add multiplexing indices i5 and i7 and Illumina sequencing adapters P5 and P7 at both ends of each DNA fragment (details Table S1). Amplicons from PCR2 were then purified, as described above, and checked for DNA concentration and fragment size using an Agilent bioanalyzer (Agilent Technologies, Santa Clara County, CA, USA). They were then sequenced on an Illumina MiSeq v3 platform using a 500-cycle Reagent Kit v2 (Illumina, San Diego, CA, USA).
2.2.3. Filtering, Validation, and Taxonomic Assignment of 16S Sequences
High-throughput sequencing (HTS) data were filtered using an ASV-centered (Amplicon Sequence Variant) method adapted from [25] and implemented in VTAM v0.1.18 [32]. The detailed protocol is available at (https://osf.io/3txv7/ (accessed on 13 September 2022)). Briefly, fastq reads from two sequencing runs were merged and demultiplexed using default parameters. The filtering procedure explicitly uses the sequencing outputs of negative and positive controls and exogenous samples in order to minimize false positives in hindgut samples (i.e., experimental/molecular artefacts such as PCR/sequencing errors, tag-switching, and cross-sample contamination). The technical PCR replicates were used to confirm the presence of taxa in a sample and further remove false-positive results [33]. We further discarded chimeras. Optimal filtering parameters were established using the optimize commands of VTAM. Our filtering procedure aimed to limit both type I errors (false negatives), and type II errors (false positives). The taxonomic assignment of ASVs was done online using the rdp classifier [34] and 16S rRNA training set 16, available at http://rdp.cme.msu.edu/classifier/classifier.jsp (last accessed on 28 October 2022). Prior to analyses, sequence counts were Ln(x + 1)-transformed. Lastly, we used variant abundances with default parameters to predict functional profiles using Tax4Fun2 [35]. This analysis provided a table of relative KEGG ortholog (KO) abundances.
2.3. Diversity of BRS Microbiota
All statistical analyses were done with R 3.5.2 [36], using the packages vegan v2.5-6 [37], phyloseq v1.30.0 [38], lme4 v1.1-23 [39], lmerTest v3.1-2 [40], and MuMIn v1.43.17 [41].
We used linear mixed models (LMMs) to assess the microbiota α-diversity major drivers. We included number of reads, season, sex, shark feeding (presence/absence), island, and total length as fixed effects and site and year as random effects. We selected the Shannon index as a measure of α-diversity and used it as the response variable in our models. Prior to constructing our models, we checked the normality of distribution with a Shapiro–Wilk test. We then selected the best-performing model using both the Akaike Information Criterion (AIC) and fixed effects significance, evaluated through a type III variance analysis. We assessed the performance of the selected model, thanks to the coefficients of determination (R2): conditional (variance explained including random effects) and marginal (variance explained excluding random effects) and the sum of squares.
We assessed differences in microbiota β-diversity using constrained ordination (distance-based RDA, [41]) in order to evaluate which variable drives the microbiota composition at the genus level by revealing an eventual significant effect of explanatory variables on the distances between the individual shark microbiotas. We used Bray–Curtis dissimilarities to this end and used the square root of dissimilarities in order to avoid negative eigenvalues that would prevent us from calculating the percentage of explained variance [42]. We selected the most parsimonious model using the vegan ordistep function using 999 permutations. We then checked for multicollinearity using the variance inflation factor (VIF, function vif.cca) and found no collinearity, all VIF values being less than 2. The R scripts are available at https://osf.io/3txv7/ (accessed on 13 September 2022).
2.4. Indicator Species Analysis
In order to know whether some bacterial genera or KO functions were strongly associated with a condition and could thus be considered as an indicator, we performed a Dufrêne–Legendre indicator species analysis [43]. The indicator value (IndVal) is computed for each bacterial genus or KO function based on their relative abundance and frequency of occurrence using the labdsv v2.0-1 package [44]. We calculated the indicator value for male and female and fed and unfed BRS and also for wet and dry seasons and the four islands (Moorea, Fakarava, Tikehau, and Makemo) to check for eventual confounding effects. We only considered genera for which the associated p-value was <0.05 (1000 permutations).
3. Results
3.1. Metabarcoding Data
The raw dataset was gathered from two distinct partial MiSeq runs. After merging read-pairs, assigning reads to sample, and deleting singletons, the dataset consisted of 2.8 million reads that correspond to the 3 PCR replicates of 59 eDNA samples (1 sample was lost during filtration), 7 negative controls, and 2 mock community samples. After filtering, 249 ASVs were validated. These corresponded to 30.1% of the total number of reads (0.8 M validated reads). At the end of the filtering process, one of the initial eDNA samples was lost since it did not contain any validated ASV. None of the negative controls had validated ASVs; all eight ASVs expected in the two mock samples were retrieved, and no other variants were retained in them. Since all control samples (mocks and negatives) complied exactly with our expectations, we assumed that we had minimized random fluctuations and false-positive and false-negative rates.
3.2. Diversity of Gut Microbiota
We used gut contents collected from a total of 59 BRS: 32 females ranging from 60 to 151 cm (mean ± sd = 115 ± 20 cm) and 27 males ranging from 58 to 130 cm (mean ± sd = 109 ± 18 cm).
Following filtration, a total of 799,773 reads and 198 variants were obtained, with a mean ± sd of 13,555 ± 11,715 reads per sample. We detected 70 genera belonging to 8 different phyla. Our samples were dominated (>3% average abundance) by Proteobacteria, Firmicutes, Fusobacteria, and Spirochaetes (Table 1, Figure 2). We identified 13 classes in our samples: the Proteobacteria were mainly Gammaproteobacteria and Alphaproteobacteria, the Firmicutes were mainly Clostridia, and we found only Fusobacteriia among Fusobacteria and Spirochaetia among Spirochaetes.
3.2.1. Gut Microbiota Alpha Diversity
We used LMM to identify factors linked to the alpha diversity of BRS microbiota. The selected LMM included season, feeding, and the square root of the read number as fixed effects and site and year as random effects. Fixed effects explained 41.1% of the variance. Random effects did not explain more of the variance. The number of reads contributed the most to the variance explained by fixed effects (60.0%, 26.1% explained by the season, 13.9% by the feeding) (Table 2). Our results thus suggest that microbial diversity differs according to the number of reads, the season, and shark feeding. Indeed, the Shannon index was higher during the wet season (Table 2, Figure 3) than the dry season (1.9 ± 0.7 and 1.5 ± 0.6, respectively) and higher among unfed than fed BRS (1.8 ± 0.6 and 1.5 ± 0.6, respectively).
3.2.2. Gut Microbiota Beta Diversity
Then, we performed db-RDA to identify factors constraining microbiota assemblages. The selected db-RDA included the number of reads and shark feeding, explaining 4.9% and 3.1% of the variance, respectively (Table 3). BRS gut microbiota thus differed significantly between fed and unfed BRS (Table 3, Figure 4).
3.2.3. Indicator Genus and KO Functions
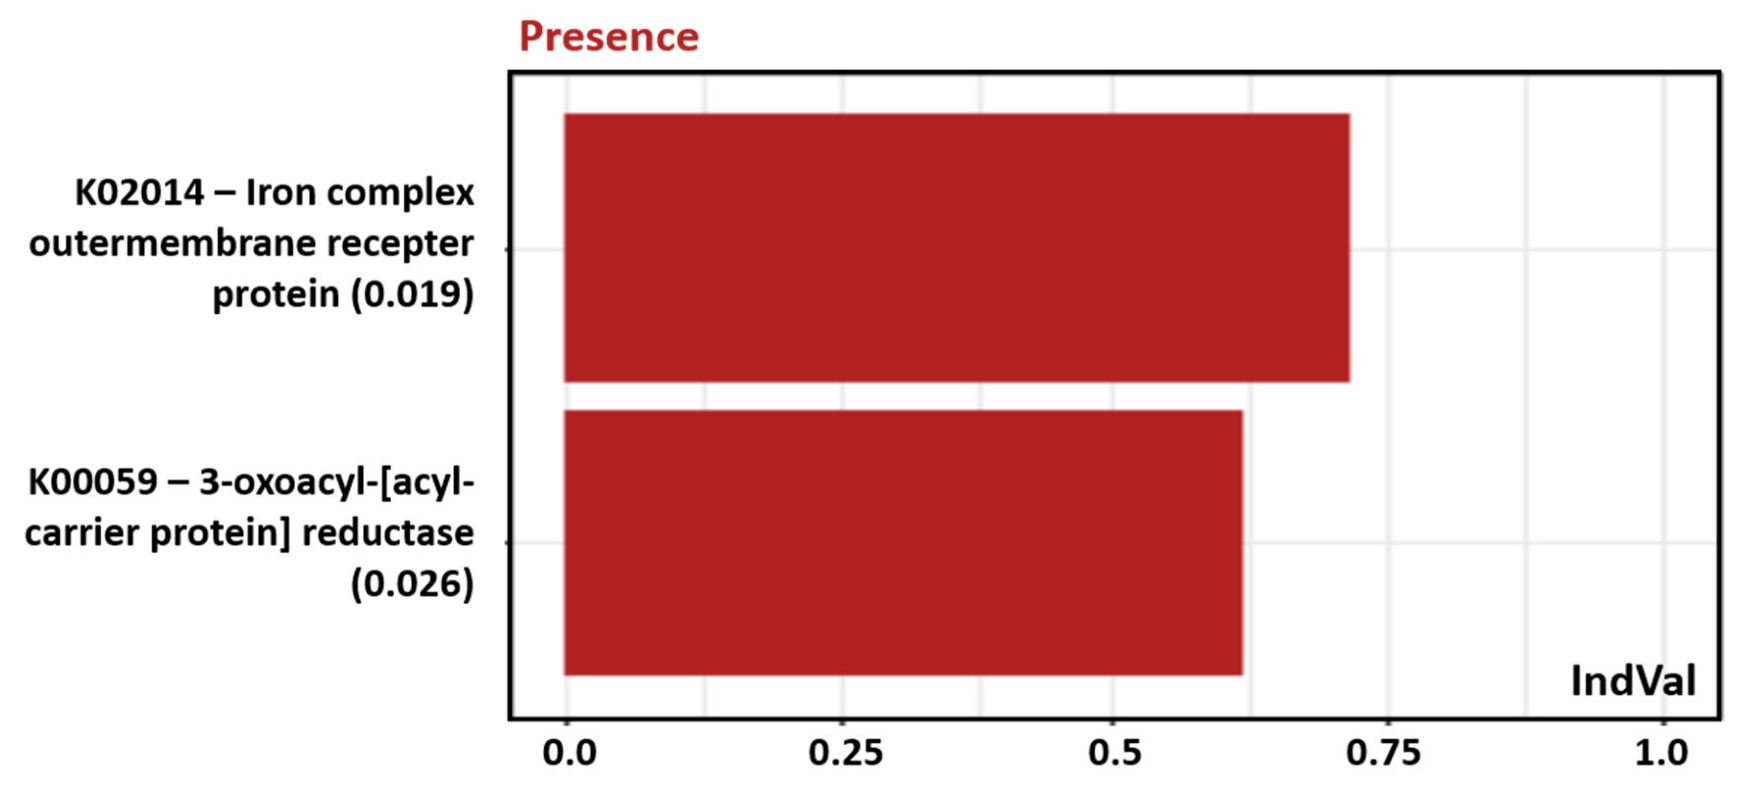
Because we found that shark feeding was significantly linked to the alpha and beta diversity of BRS microbiota, we used IndVal to identify specific the bacterial genera and KO functions of fed and unfed sharks. Only Novosphingobium appeared to be specific to fed BRS, while we found four genera associated with unfed sharks: Cetobacterium, Clostridium XI, Clostridium sensu stricto, and Thiomicrospira (Figure 5). Moreover, numerous KOs (1324) were significantly different between conditions for feeding (Table S1). Among them, two had high abundances (>1% in at least one sample) and were significantly associated with feeding areas (K00059: 3-oxoacyl-acyl-carrier protein reductase; K02014: iron complex outer membrane receptor protein) (Figure 6).
4. Discussion
4.1. Cetobacterium, Photobacterium, and Vibrio Dominated BRS Gut Microbiota
We conducted, with 59 individuals, the first study on shark gut microbiota on a large scale. Few studies have been undertaken to explore shark gut microbiota. According to a meta-analysis, there is a strong distinction between freshwater teleost, dominated by Aeromonadales and Enterobacterales, and their marine counterparts, in which Vibrionales are dominant [13]. Our results support this finding, Vibrionales being the most abundant order (34.8% of reads on average), with very few Aeromonadales and Enterobacterales (0.1% each). Sullam et al. [13] also highlighted discrepancies between diets, with herbivorous teleost being enriched in Clostridiales, Bacteroidales, and Verrucomicrobiales, whereas omnivorous teleost harbored more Rhizobiales, Fusobacteriales, and Planctomycetales and omnivorous and carnivorous teleost were enriched in Desulfovibrionales and Aeromonadales. Our results only partially agree with this finding because we found abundant Fusobacteriales (10.8%), an order associated with omnivorous teleost. We did not detect any Desulfovibrionales and very few Aeromonadales (0.6%). Considering what is known about teleost gut microbiota, our most surprising finding was the high abundance of Clostridiales (11.9%) because this order is rather associated with herbivorous teleost. This observation could be due to the consumption of herbivorous teleost by the BRS since diet is known as a major source of bacteria colonizing the intestine [19,45]. Several studies have pointed out a dominance of Fusobacteriales, notably Cetobacterium, among piscivorous teleost [19,45], which is consistent with our finding, the BRS being mostly piscivorous.
In addition, the presence of Photobacterium damselae, Vibrio harveyi, and Escherichia coli in the guts of some sharks was shown by a pioneering culture-dependent study [46]. The presence of Cetobacterium, Photobacterium, and Vibrio among members of the Carcharhinus genus was also shown, and Propionigenium, Clostridium, and Clostridiaceae were detected in Carcharhinus brevipinna [19]. The deep-sea shark Centroscyllium fabricii harbors Actinobacteria, Proteobacteria, and Acidobacteria as dominant microbial phyla [20]. Finally, there is a fluctuating dominance between Enterobacteriaceae (genus Citrobacter) and Vibrionaceae (genus Photobacterium) among juvenile Sphyrna lewini [47]. While comparing our results with these studies is difficult (different species, low number of individuals), it appears that we partially agree with the available literature. Indeed, Photobacterium and Vibrio (previously detected [19,47]) and Cetobacterium were the three most abundant genera in our samples. We noted other similarities with previous studies. For example, we found Campylobacter and Clostridiaceae, including Clostridium and Pseudomonas, which have been previously detected in Rhizoprionodon terraenovae, Carcharhinus brevipinna, and Sphyrna lewini, respectively [19,47]. Moreover, a study on Bilaterian gut microbiota showed a constantly high abundance of Proteobacteria in Elasmobranch and at least 50% of microbiota constituted by the most abundant taxa, which is verified here with 70% of Proteobacteria and 50.7% of reads assigned to the six most abundant genera.
4.2. Influence of Seasons on Gut Microbiota
We detected a seasonal variability of BRS gut microbiota α-diversity, as measured with the Shannon index. Gut microbiota appeared more diversified during the wet season (which is also the warmer season) than during the dry season. This seasonal variability seems consistent. Indeed, the organisms living in the superior photic zone are exposed to temperature variations (mainly controlled by the season), which are likely to alter the relationship between a host and its microbiota, particularly among ectotherms [29]. To our knowledge, there is no study about Elasmobranch gut microbiota seasonal variability, but some studies have been conducted on teleost. Except for Hovda et al. [48], who found no evidence of a relationship between water temperature and bacterial diversity in Salmo salar, the studies conducted on the subject indicate a higher bacterial diversity during the warm season. However, most studies revealed modifications of bacterial diversity and community arrangement under different temperatures [8,49,50]. Nevertheless, few studies have considered the real impact of seasonal changes in the fish gut microbiome [8], and special attention should be paid to these works in the future, especially in the context of global warming.
4.3. Influence of Shark Feeding on Gut Microbiota
Shark feeding was the most important factor in our data because it significantly influenced both the alpha and beta diversity of BRS microbiota. However, because this variable explained a limited fraction of the total variation, future studies should measure additional environmental variables to better evaluate their influence on microbiota assemblages. Shark-feeding operators use pelagic species (sardine and tuna), which are unlikely to be part of the classic BRS diet. Two studies were conducted on the effects of such a practice on the diet of target Elasmobranch and showed differences in fatty acid profiles (Hypanus americanus [51]) and δ15N (Carcharhinus perezi [52]). Trophic level and diet influence gut microbiota through prey microbiota [12,19,53]. Thus, dietary alteration is the most obvious hypothesis to explain the differences in gut microbiota composition between fed and unfed sharks. However, we can also suppose that tourism-linked stress could contribute to the observed variation. Indeed, stress can alter gut microbiota composition [54,55], and both tourists and boat noise are known to induce stress in teleost [56,57]. Moreover, Elasmobranch are known to suffer from tourist encounter-induced stress, and some operators trigger tonic immobility, which is a stressful state, to impress tourists [56]. In addition, fed BRS microbiota was enriched in Novosphingobium while impoverished in Cetobacterium, Clostridium XI, Clostridium sensu stricto, and Thiomicrospira, which appear typical of unfed sharks. Tunas provided to feed BRS are migratory species, richer in lipids than non-migratory species [58]. They could thus be an additional source of lipids for fed BRS, this hypothesis being corroborated by the fact that Clostridium seemed more abundant in teleost fed a low-fat diet, whereas Sphingobium dominated with higher lipid intakes [59,60]. Notably, Novosphingobium is a genus of Gram-negative bacteria known to degrade aromatic compounds. It has been previously found in marine aquatic environments exposed to high levels of anthropogenic impacts [61]. As a consequence, the association with fed sharks might be directly linked to provisioning and also environmental conditions. Future studies should evaluate the presence of this genus within food webs facing different anthropogenic pressures.
Lastly, functional analyses of microbial assemblages also revealed that 1324 KOs were significantly different between fed and unfed sharks. This result suggested that feeding activity highly influenced the functional diversity of shark gut microbiota. This observation was not surprising because diet is a variable that highly constrains gut microbiota [62,63,64,65]. Among significant KOs, K00059 (3-oxoacyl-acyl-carrier protein reductase) and K02014 (iron complex outer membrane receptor protein) were associated with fed sharks. Notably, K00059 is involved in fatty acid pathways and might be linked to lipid-rich tunas [58] and thus to a change in fatty acid profile, such as previously observed for other fed Elasmobranchs [51,52]. Moreover, iron is an essential element for fundamental cellular processes, such as respiration and DNA synthesis [66]. Because the gut bacteria of fed sharks might not be limited by nutrients, we hypothesized that bacterial growth was favored and thus required a high amount of iron through transporters [65].
5. Conclusions and Perspectives
We described for the first time the BRS gut microbiota and identified significant links with temporal (season) and anthropogenic (provisioning) factors. An important aspect of this study was the development of a non-lethal sampling method to extract and sequence gut microbial DNA. This new method allowed the identification of factors constraining the diversity of BRS microbiota. Shark feeding was the most important factor in this study, and we particularly highlighted a decrease in alpha diversity. Because gut microbiota plays a role in host health and homeostasis, future studies should test whether this decrease affects BRS physiology. Future studies should also measure additional environmental variables (such as fish abundance and biodiversity, etc.) on a larger number of sharks to accurately estimate the effect of provisioning on microbiota assemblages. Finally, if the effect of shark feeding is recognized, it could be recommended to forbid feeding (as is the case now in French Polynesia) or at least limit feeding or use several types of fish in order to maintain bacterial diversity.
Supplementary Materials
The following supporting information can be downloaded at: https://www.mdpi.com/article/10.3390/fishes7060312/s1, Table S1: IndVal analysis of KO functions for the feeding variable. Max (%) indicate the maximal relative abudance of each KO in the whole samples. The column "Association with sharks" shows IndVal result and indicates if KO are associated with non-provisionned or provisionned sharks; Table S2: Details on environmental and host biological parameters.
Author Contributions
P.S. and É.C. conceived and designed the study. É.C., and P.S. conducted the fieldwork. A.E. did the molecular work, and E.M. did the bioinformatics. A.E. and C.C. performed statistical analyses. All authors have read and agreed to the published version of the manuscript.
Funding
This research received no external funding.
Institutional Review Board Statement
The study was conducted in accordance with the Declaration of Helsinki, and approved by the CRIOBE Ethics Committee and the DIREN of French Polynesia (N°5129/MCE/ENV of 22 June 2016 and N°011492/MCE/ENV from 16 October 2019).
Data Availability Statement
Raw reads in the fastq format, metadata, and the detailed bioinformatics protocol are found at https://osf.io/3txv7/ (accessed on 13 September 2022).
Acknowledgments
The work and capture of black-tip reef sharks in French Polynesia were conducted under special permits from the Environment Department of French Polynesia (ref. N°5129/MCE/ENV of 22 June 2016 and N°011492/MCE/ENV from 16 October 2019). Special thanks is given to Captain Franck Dealessandri and his boat FUNAMBULE for logistics support during the Tuamotu field trips (Tikehau and Makemo) as well as to Theodore Teakura, Amelia Harris, Benoit Teiho, Henere Tautu, and the brothers Raph and Yannick Firuu in Tikehau. Kurt Villsen helped with data analyses. Anne Chenuil shared Mediterranean exogenous samples from the SEAMOBB project. Data used in this study were produced by the molecular facilities of CIRAD (Montferrier-sur-Lez) and SCBM (IMBE, Marseille). Authors want to thank very sincerely Vincent DUBUT (IMBE, Marseille) for his help and support throughout all the duration of this work.
Conflicts of Interest
The authors declare no conflict of interest.
References
- Dulvy, N.K.; Fowler, S.L.; Musick, J.A.; Cavanagh, R.D.; Kyne, P.M.; Harrison, L.R.; Carlson, J.K.; Davidson, L.N.; Fordham, S.V.; Francis, M.P. Extinction risk and conservation of the world’s sharks and rays. eLife 2014, 3, e00590. [Google Scholar] [CrossRef] [Green Version]
- Roff, G.; Brown, C.J.; Priest, M.A.; Mumby, P.J. Decline of coastal apex shark populations over the past half century. Commun. Biol. 2018, 1, 223. [Google Scholar] [CrossRef] [PubMed] [Green Version]
- Hammerschlag, N.; Williams, L.; Fallows, M.; Fallows, C. Disappearance of white sharks leads to the novel emergence of an allopatric apex predator, the sevengill shark. Sci. Rep. 2019, 9, 1908. [Google Scholar] [CrossRef] [Green Version]
- MacNeil, M.A.; Chapman, D.D.; Heupel, M.; Simpfendorfer, C.A.; Heithaus, M.; Meekan, M.; Harvey, E.; Goetze, J.; Kiszka, J.; Bond, M.E. Global status and conservation potential of reef sharks. Nature 2020, 583, 801–806. [Google Scholar] [CrossRef]
- Gallagher, A.J.; Hammerschlag, N. Global Shark Currency: The Distribution, frequency, and economic value of shark ecotourism. Curr. Issues Tour. 2011, 14, 797–812. [Google Scholar] [CrossRef]
- Cisneros-Montemayor, A.M.; Barnes-Mauthe, M.; Al-Abdulrazzak, D.; Navarro-Holm, E.; Sumaila, U.R. Global economic value of shark ecotourism: Implications for conservation. Oryx 2013, 47, 381–388. [Google Scholar] [CrossRef] [Green Version]
- Orams, M.B. Feeding wildlife as a tourism attraction: A review of issues and impacts. Tour. Manag. 2002, 23, 281–293. [Google Scholar] [CrossRef]
- Egerton, S.; Culloty, S.; Whooley, J.; Stanton, C.; Ross, R.P. The Gut microbiota of marine fish. Front. Microbiol. 2018, 9, 873. [Google Scholar] [CrossRef]
- Guivier, E.; Pech, N.; Chappaz, R.; Gilles, A. Microbiota associated with the skin, gills, and gut of the fish parachondrostoma toxostoma from the rhône basin. Freshw. Biol. 2020, 65, 446–459. [Google Scholar] [CrossRef]
- Romero, J.; Navarrete, P. 16S RDNA-based analysis of dominant bacterial populations associated with early life stages of coho salmon (Oncorhynchus kisutch). Microb. Ecol. 2006, 51, 422–430. [Google Scholar] [CrossRef]
- Nayak, S.K. Role of gastrointestinal microbiota in fish. Aquac. Res. 2010, 41, 1553–1573. [Google Scholar] [CrossRef]
- Uchii, K.; Matsui, K.; Yonekura, R.; Tani, K.; Kenzaka, T.; Nasu, M.; Kawabata, Z. Genetic and physiological characterization of the intestinal bacterial microbiota of bluegill (Lepomis macrochirus) with three different feeding habits. Microb. Ecol. 2006, 51, 277–284. [Google Scholar] [CrossRef]
- Sullam, K.E.; Essinger, S.D.; Lozupone, C.A.; O’Connor, M.P.; Rosen, G.L.; Knight, R.O.B.; Kilham, S.S.; Russell, J.A. Environmental and ecological factors that shape the gut bacterial communities of fish: A meta-analysis. Mol. Ecol. 2012, 21, 3363–3378. [Google Scholar] [CrossRef] [Green Version]
- Ye, L.; Amberg, J.; Chapman, D.; Gaikowski, M.; Liu, W.-T. Fish gut microbiota analysis differentiates physiology and behavior of invasive Asian carp and indigenous American fish. ISME J. 2014, 8, 541–551. [Google Scholar] [CrossRef] [Green Version]
- Liu, H.; Guo, X.; Gooneratne, R.; Lai, R.; Zeng, C.; Zhan, F.; Wang, W. The Gut microbiome and degradation enzyme activity of wild freshwater fishes influenced by their trophic levels. Sci. Rep. 2016, 6, 24340. [Google Scholar] [CrossRef] [Green Version]
- Jones, J.; DiBattista, J.D.; Stat, M.; Bunce, M.; Boyce, M.C.; Fairclough, D.V.; Travers, M.J.; Huggett, M.J. The Microbiome of the gastrointestinal tract of a range-shifting marine herbivorous fish. Front. Microbiol. 2018, 9, 2000. [Google Scholar] [CrossRef] [Green Version]
- Dehler, C.E.; Secombes, C.J.; Martin, S.A. Environmental and physiological factors shape the gut microbiota of Atlantic salmon parr (Salmo salar L.). Aquaculture 2017, 467, 149–157. [Google Scholar] [CrossRef] [Green Version]
- Giatsis, C.; Sipkema, D.; Smidt, H.; Heilig, H.; Benvenuti, G.; Verreth, J.; Verdegem, M. The Impact of rearing environment on the development of gut microbiota in tilapia larvae. Sci. Rep. 2015, 5, 18206. [Google Scholar] [CrossRef] [Green Version]
- Givens, C.E.; Ransom, B.; Bano, N.; Hollibaugh, J.T. Comparison of the gut microbiomes of 12 bony fish and 3 shark species. Mar. Ecol. Prog. Ser. 2015, 518, 209–223. [Google Scholar] [CrossRef] [Green Version]
- Johny, T.K.; Saidumohamed, B.E.; Sasidharan, R.S.; Bhat, S.G. Metabarcoding data of bacterial diversity of the deep sea shark, Centroscyllium fabricii. Data Brief 2018, 21, 1029–1032. [Google Scholar] [CrossRef]
- Sherrill-Mix, S.; McCormick, K.; Lauder, A.; Bailey, A.; Zimmerman, L.; Li, Y.; Django, J.-B.N.; Bertolani, P.; Colin, C.; Hart, J.A. Allometry and ecology of the bilaterian gut microbiome. mBio 2018, 9, e00319-18. [Google Scholar] [CrossRef] [Green Version]
- Doane, M.P.; Morris, M.M.; Papudeshi, B.; Allen, L.; Pande, D.; Haggerty, J.M.; Johri, S.; Turnlund, A.C.; Peterson, M.; Kacev, D. The Skin microbiome of elasmobranchs follows phylosymbiosis, but in teleost fishes, the microbiomes converge. Microbiome 2020, 8, 93. [Google Scholar] [CrossRef] [PubMed]
- Caballero, S.; Galeano, A.M.; Lozano, J.D.; Vives, M. Description of the microbiota in epidermal mucus and skin of sharks (Ginglymostoma cirratum and Negaprion brevirostris) and one stingray (Hypanus americanus). PeerJ 2020, 8, e10240. [Google Scholar] [CrossRef] [PubMed]
- Pratte, Z.A.; Perry, C.; Dove, A.D.; Hoopes, L.A.; Ritchie, K.B.; Hueter, R.E.; Fischer, C.; Newton, A.L.; Stewart, F.J. Microbiome structure in large pelagic sharks with distinct feeding ecologies. Anim. Microb. 2022, 4, 17. [Google Scholar] [CrossRef] [PubMed]
- Leigh, S.C.; Papastamatiou, Y.; German, D.P. The Nutritional physiology of sharks. Rev. Fish Biol. Fish. 2017, 27, 561–585. [Google Scholar] [CrossRef]
- Corse, E.; Meglécz, E.; Archambaud, G.; Ardisson, M.; Martin, J.-F.; Tougard, C.; Chappaz, R.; Dubut, V. A From-benchtop-to-desktop workflow for validating hts data and for taxonomic identification in diet metabarcoding studies. Mol. Ecol. Resour. 2017, 17, e146–e159. [Google Scholar] [CrossRef]
- Monti, F.; Duriez, O.; Arnal, V.; Dominici, J.-M.; Sforzi, A.; Fusani, L.; Grémillet, D.; Montgelard, C. Being cosmopolitan: Evolutionary history and phylogeography of a specialized raptor, the osprey Pandion haliaetus. BMC Evolutionary Biology 2015, 15, 255. [Google Scholar] [CrossRef] [Green Version]
- Kozich, J.J.; Westcott, S.L.; Baxter, N.T.; Highlander, S.K.; Schloss, P.D. Development of a dual-index sequencing strategy and curation pipeline for analyzing amplicon sequence data on the miseq illumina sequencing platform. Appl. Environ. Microbiol. 2013, 79, 5112–5120. [Google Scholar] [CrossRef] [Green Version]
- Galan, M.; Pons, J.-B.; Tournayre, O.; Pierre, E.; Leuchtmann, M.; Pontier, D.; Charbonnel, N. Metabarcoding for the parallel identification of several hundred predators and their prey: Application to bat species diet analysis. Mol. Ecol. Resour. 2018, 18, 474–489. [Google Scholar] [CrossRef]
- Parada, A.E.; Needham, D.M.; Fuhrman, J.A. Every base matters: Assessing small subunit rRNA primers for marine microbiomes with mock communities, time series and global field samples. Environ. Microbiol. 2016, 18, 1403–1414. [Google Scholar] [CrossRef]
- Apprill, A.; McNally, S.; Parsons, R.; Weber, L. Minor revision to V4 region SSU RRNA 806R gene primer greatly increases detection of SAR11 bacterioplankton. Aquat. Microb. Ecol. 2015, 75, 129–137. [Google Scholar] [CrossRef] [Green Version]
- González, A.; Dubut, V.; Corse, E.; Mekdad, R.; Dechatre, T.; Meglécz, E. VTAM: A Robust Pipeline for Validating Metabarcoding Data Using Internal Controls. Ecology 2020, preprint. [Google Scholar] [CrossRef]
- Robasky, K.; Lewis, N.E.; Church, G.M. The Role of replicates for error mitigation in next-generation sequencing. Nat. Rev. Genet. 2014, 15, 56–62. [Google Scholar] [CrossRef]
- Wang, Q.; Garrity, G.M.; Tiedje, J.M.; Cole, J.R. Naïve bayesian classifier for rapid assignment of rRNA sequences into the new bacterial taxonomy. Appl. Environ. Microbiol. 2007, 73, 5261–5267. [Google Scholar] [CrossRef] [Green Version]
- Wemheuer, F.; Taylor, J.A.; Daniel, R.; Johnston, E.; Meinicke, P.; Thomas, T.; Wemheuer, B. Tax4Fun2: Prediction of habitat-specific functional profiles and functional redundancy based on 16S RRNA gene sequences. Environ. Microb. 2020, 15, 11. [Google Scholar] [CrossRef] [PubMed]
- R Core Team. R: A Language and Environment for Statistical Computing, Version 3.6.3; R Foundation for Statistical Computing: Vienna, Austria, 2020. [Google Scholar]
- Oksanen, J.; Kindt, R.; Legendre, P.; O’Hara, B.; Stevens, M.H.H.; Oksanen, M.J.; Suggests, M. The Vegan Package. Community Ecol. Package 2007, 10, 719. [Google Scholar]
- McMurdie, P.J.; Holmes, S. Phyloseq: An R Package for reproducible interactive analysis and graphics of microbiome census data. PLoS ONE 2013, 8, e61217. [Google Scholar] [CrossRef] [Green Version]
- Bates, D.; Mächler, M.; Bolker, B.; Walker, S. Fitting linear mixed-effects models using Lme4. arXiv 2014, arXiv:1406.5823. [Google Scholar]
- Kuznetsova, A.; Brockhoff, P.B.; Christensen, R.H. LmerTest Package: Tests in linear mixed effects models. J. Stat. Softw. 2017, 82, 1–26. [Google Scholar] [CrossRef] [Green Version]
- MuMIn, B.K. Multi-Model Inference. R Package, Version 1.43.17; R Foundation for Statistical Computing: Vienna, Austria, 2020. [Google Scholar]
- Legendre, P.; Anderson, M.J. Distance-based redundancy analysis: Testing multispecies responses in multifactorial ecological experiments. Ecol. Monogr. 1999, 69, 1–24. [Google Scholar] [CrossRef]
- Dufrêne, M.; Legendre, P. Species assemblages and indicator species: The need for a flexible asymmetrical approach. Ecol. Monogr. 1997, 67, 345–366. [Google Scholar] [CrossRef]
- Roberts, D.W. Labdsv: Ordination and Multivariate Analysis for Ecology. R Package, Version 2.0-1; R Foundation for Statistical Computing: Vienna, Austria, 2019. [Google Scholar]
- Maljković, A.; Côté, I.M. Effects of tourism-related provisioning on the trophic signatures and movement patterns of an apex predator, the caribbean reef shark. Biol. Conserv. 2011, 144, 859–865. [Google Scholar] [CrossRef]
- Grimes, D.; Brayton, P.; Colwell, R.; Gruber, S. Vibrios as autochthonous flora of neritic sharks. Syst. Appl. Microbiol. 1985, 6, 221–226. [Google Scholar] [CrossRef]
- Juste-Poinapen, N.; Yang, L.; Ferreira, M.; Poinapen, J.; Rico, C. Community profiling of the intestinal microbial community of juvenile hammerhead sharks (Sphyrna lewini) from the Rewa Delta, Fiji. Sci. Rep. 2019, 9, 7182. [Google Scholar] [CrossRef] [Green Version]
- Hovda, M.B.; Fontanillas, R.; McGurk, C.; Obach, A.; Rosnes, J.T. Seasonal variations in the intestinal microbiota of farmed atlantic salmon (Salmo salar L.). Aquac. Res. 2012, 43, 154–159. [Google Scholar] [CrossRef]
- Tarnecki, A.M.; Burgos, F.A.; Ray, C.L.; Arias, C.R. Fish intestinal microbiome: Diversity and symbiosis unravelled by metagenomics. J. Appl. Microbiol. 2017, 123, 2–17. [Google Scholar] [CrossRef] [Green Version]
- Butt, R.L.; Volkoff, H. Gut microbiota and energy homeostasis in fish. Front. Endocrinol. 2019, 10, 9. [Google Scholar] [CrossRef] [Green Version]
- Semeniuk, C.A.; Speers-Roesch, B.; Rothley, K.D. Using fatty-acid profile analysis as an ecologic indicator in the management of tourist impacts on marine wildlife: A case of stingray-feeding in the caribbean. Environ. Manag. 2007, 40, 665–677. [Google Scholar] [CrossRef]
- Smith, C.C.; Snowberg, L.K.; Gregory Caporaso, J.; Knight, R.; Bolnick, D.I. Dietary input of microbes and host genetic variation shape among-population differences in stickleback gut microbiota. ISME J. 2015, 9, 2515–2526. [Google Scholar] [CrossRef]
- Bailey, M.T.; Coe, C.L. Maternal separation disrupts the integrity of the intestinal microflora in infant rhesus monkeys. Dev. Psychobiol. 1999, 35, 146–155. [Google Scholar] [CrossRef]
- O’Mahony, S.M.; Marchesi, J.R.; Scully, P.; Codling, C.; Ceolho, A.-M.; Quigley, E.M.; Cryan, J.F.; Dinan, T.G. Early life stress alters behavior, immunity, and microbiota in rats: Implications for irritable bowel syndrome and psychiatric illnesses. Biol. Psychiatry 2009, 65, 263–267. [Google Scholar] [CrossRef]
- Graham, A.L.; Cooke, S.J. The Effects of noise disturbance from various recreational boating activities common to inland waters on the cardiac physiology of a freshwater fish, the largemouth bass (Micropterus salmoides). Aquat. Conserv. Mar. Freshw. Ecosyst. 2008, 18, 1315–1324. [Google Scholar] [CrossRef]
- Lima, A.C.; Assis, J.; Sayanda, D.; Sabino, J.; Oliveira, R.F. Impact of ecotourism on the fish fauna of Bonito region (Mato Grosso Do Sul state, Brazil): Ecological, behavioural and physiological measures. Neotrop. Ichthyol. 2014, 12, 133–143. [Google Scholar] [CrossRef] [Green Version]
- Brooks, E.J.; Sloman, K.A.; Liss, S.; Hassan-Hassanein, L.; Danylchuk, A.J.; Cooke, S.J.; Mandelman, J.W.; Skomal, G.B.; Sims, D.W.; Suski, C.D. The Stress physiology of extended duration tonic immobility in the juvenile lemon shark, Negaprion brevirostris (Poey 1868). J. Exp. Mar. Biol. Ecol. 2011, 409, 351–360. [Google Scholar] [CrossRef]
- Goñi, N.; Arrizabalaga, H. Seasonal and interannual variability of fat content of juvenile albacore (Thunnus alalunga) and bluefin (Thunnus thynnus) tunas during their feeding migration to the Bay of Biscay. Prog. Oceanogr. 2010, 86, 115–123. [Google Scholar] [CrossRef]
- Navarro-Barrón, E.; Hernández, C.; Llera-Herrera, R.; García-Gasca, A.; Gómez-Gil, B. Overfeeding a high-fat diet promotes sex-specific alterations on the gut microbiota of the zebrafish (Danio rerio). Zebrafish 2019, 16, 268–279. [Google Scholar] [CrossRef]
- Soriano, E.L.; Ramírez, D.T.; Araujo, D.R.; Gómez-Gil, B.; Castro, L.I.; Sánchez, C.G. Effect of temperature and dietary lipid proportion on gut microbiota in yellowtail kingfish Seriola lalandi Juveniles. Aquaculture 2018, 497, 269–277. [Google Scholar] [CrossRef]
- Gan, H.M.; Hudson, A.O.; Rahman, A.Y.A.; Chan, K.G.; Savka, M.A. Comparative genomic analysis of six bacteria belonging to the genus Novosphingobium: Insights into marine adaptation, cell-cell signaling and bioremediation. BMC Genom. 2013, 14, 431. [Google Scholar] [CrossRef] [Green Version]
- Sommer, F.; Bäckhed, F. The gut microbiota—Masters of host development and physiology. Nat. Rev. Microbiol. 2013, 11, 227–238. [Google Scholar] [CrossRef]
- Wang, J.; Linnenbrink, M.; Künzel, S.; Fernandes, R.; Nadeau, M.-J.; Rosenstiel, P.; Baines, J.F. Dietary history contributes to enterotype-like clustering and functional metagenomic content in the intestinal microbiome of wild mice. Proc. Natl. Acad. Sci. USA 2014, 111, E2703–E2710. [Google Scholar] [CrossRef] [Green Version]
- Carmody, R.N.; Gerber, G.K.; Luevano, J.M., Jr.; Gatti, D.M.; Somes, L.; Svenson, K.L.; Turnbaugh, P.J. Diet dominates host genotype in shaping the murine gut microbiota. Cell Host Microbe 2015, 17, 72–84. [Google Scholar] [CrossRef] [PubMed] [Green Version]
- Andrews, S.C.; Robinson, A.K.; Rodríguez-Quiñones, F. Bacterial iron homeostasis. FEMS Microbiol. Rev. 2003, 27, 215–237. [Google Scholar] [CrossRef] [Green Version]
- Guerinot, M.L. Microbial iron transport. Annu. Rev. Microbiol. 1994, 48, 743–773. [Google Scholar] [CrossRef] [PubMed]
Figure 1.
Map of French Polynesia, with the global situation and close-ups on Moorea, Fakara, Tikehau, and Makemo. Sampling sites are designated as the presence (red) or absence (green) of shark provisioning.
Figure 1.
Map of French Polynesia, with the global situation and close-ups on Moorea, Fakara, Tikehau, and Makemo. Sampling sites are designated as the presence (red) or absence (green) of shark provisioning.
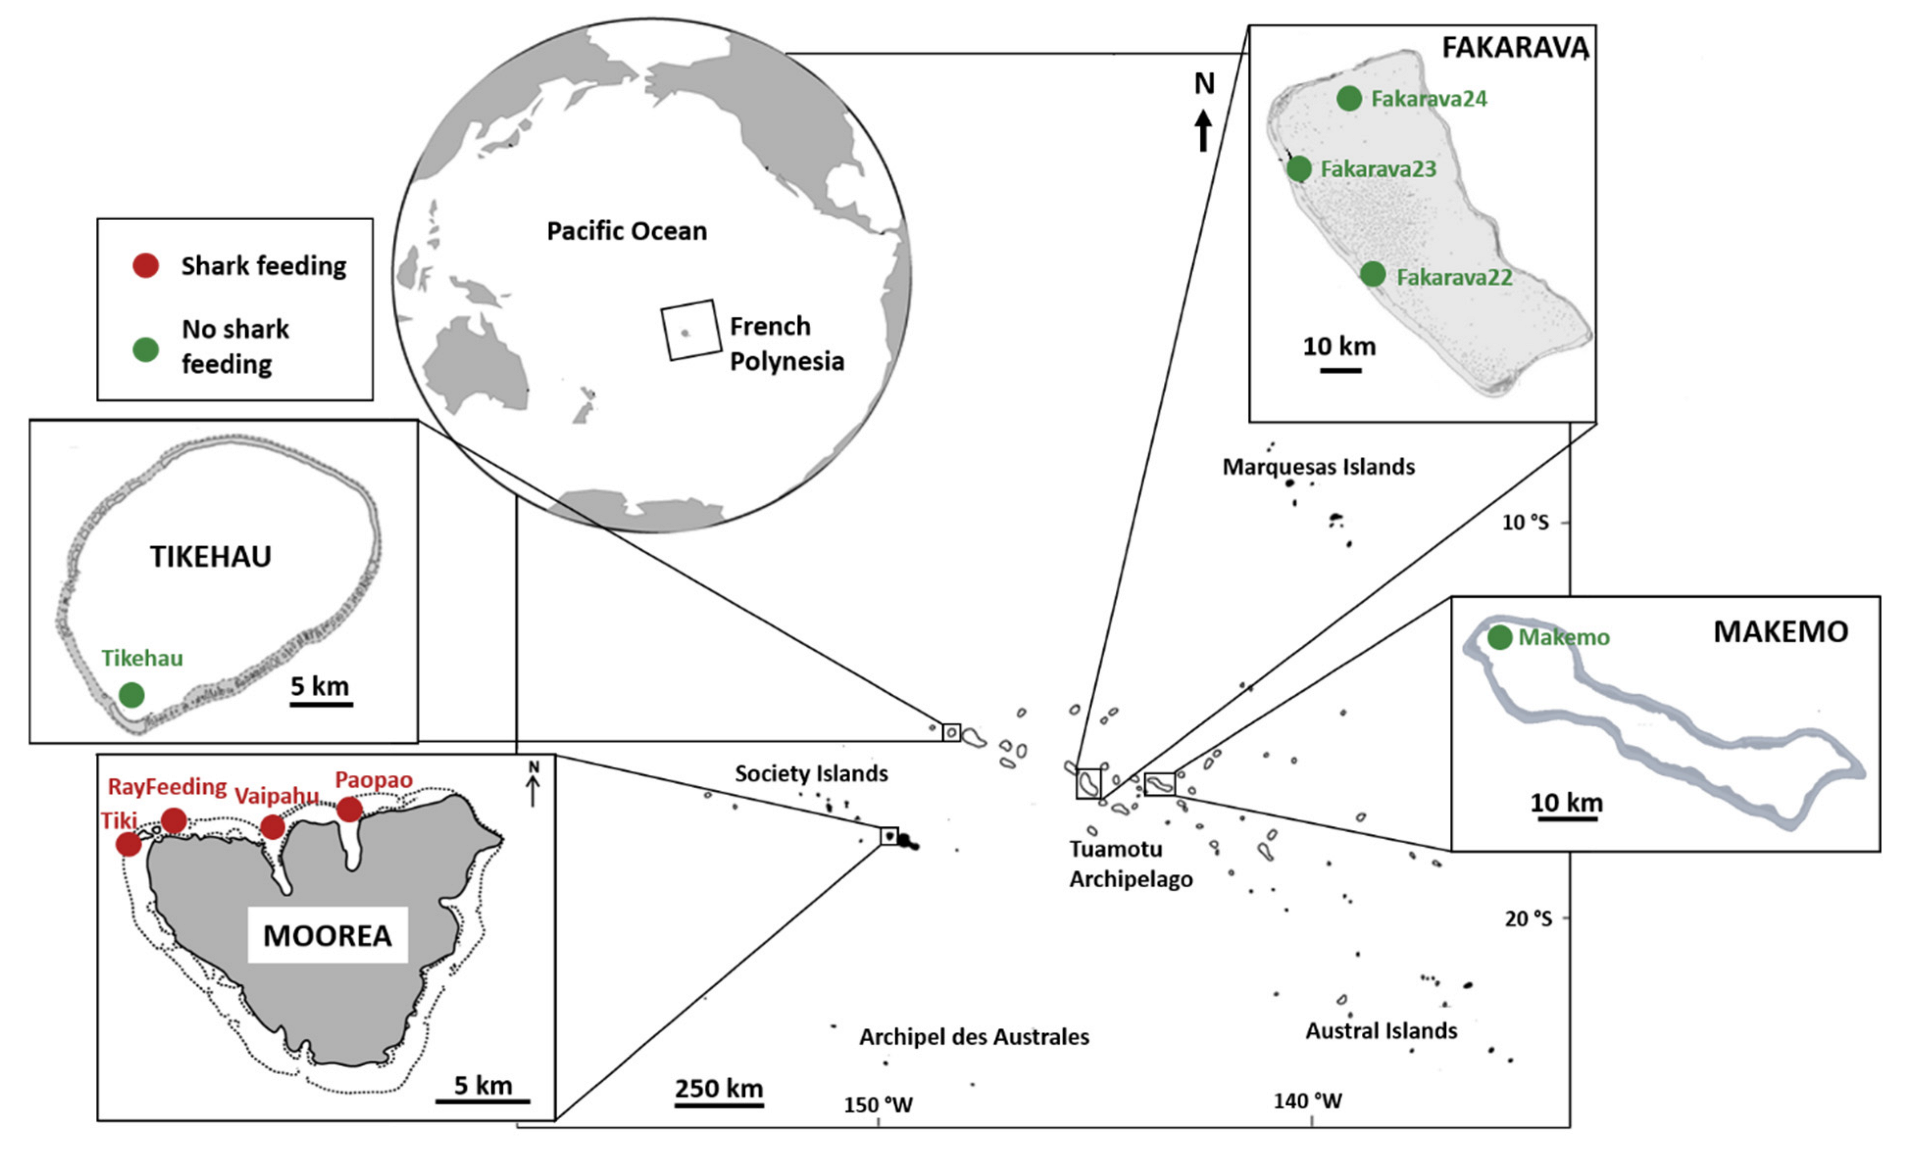
Figure 2.
Relative abundance of the bacterial composition of individual samples. Each column represents a shark number. Colors in a column represent the proportion of each bacterial group.
Figure 2.
Relative abundance of the bacterial composition of individual samples. Each column represents a shark number. Colors in a column represent the proportion of each bacterial group.
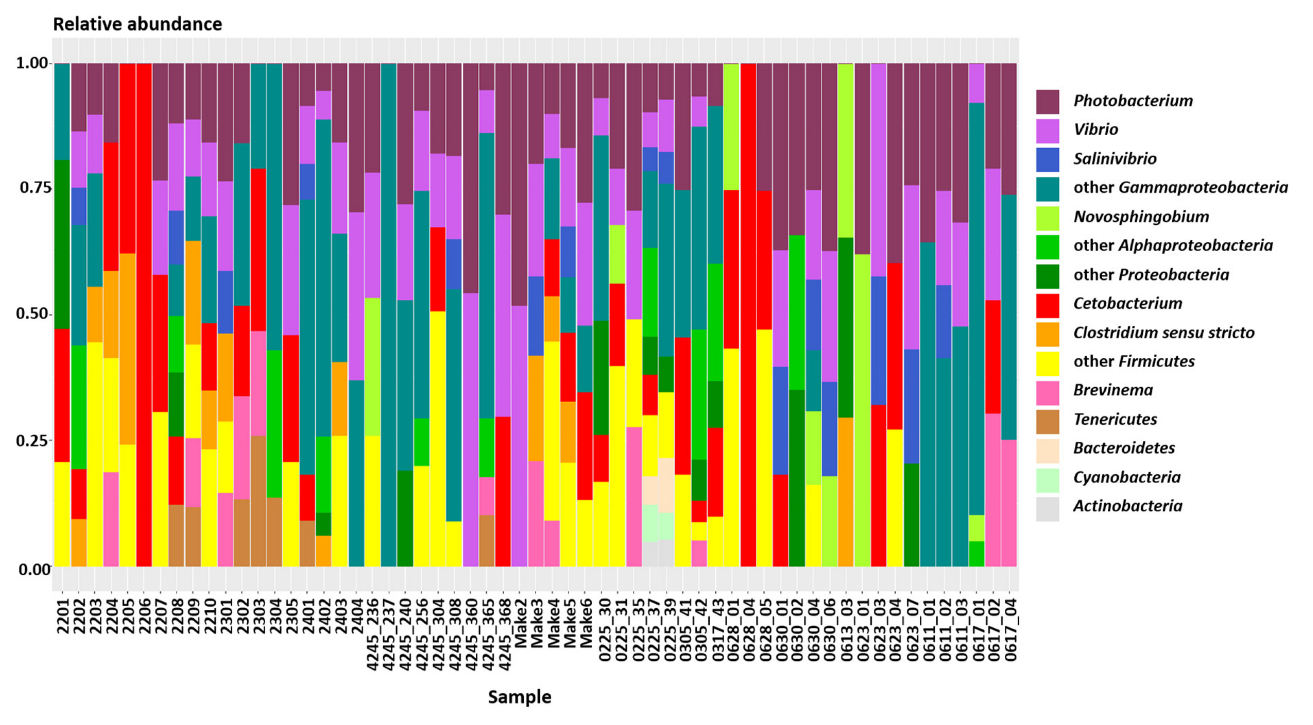
Figure 3.
Alpha diversity measured by the Shannon index for (a) unfed and fed sharks and (b) wet and dry seasons.
Figure 3.
Alpha diversity measured by the Shannon index for (a) unfed and fed sharks and (b) wet and dry seasons.
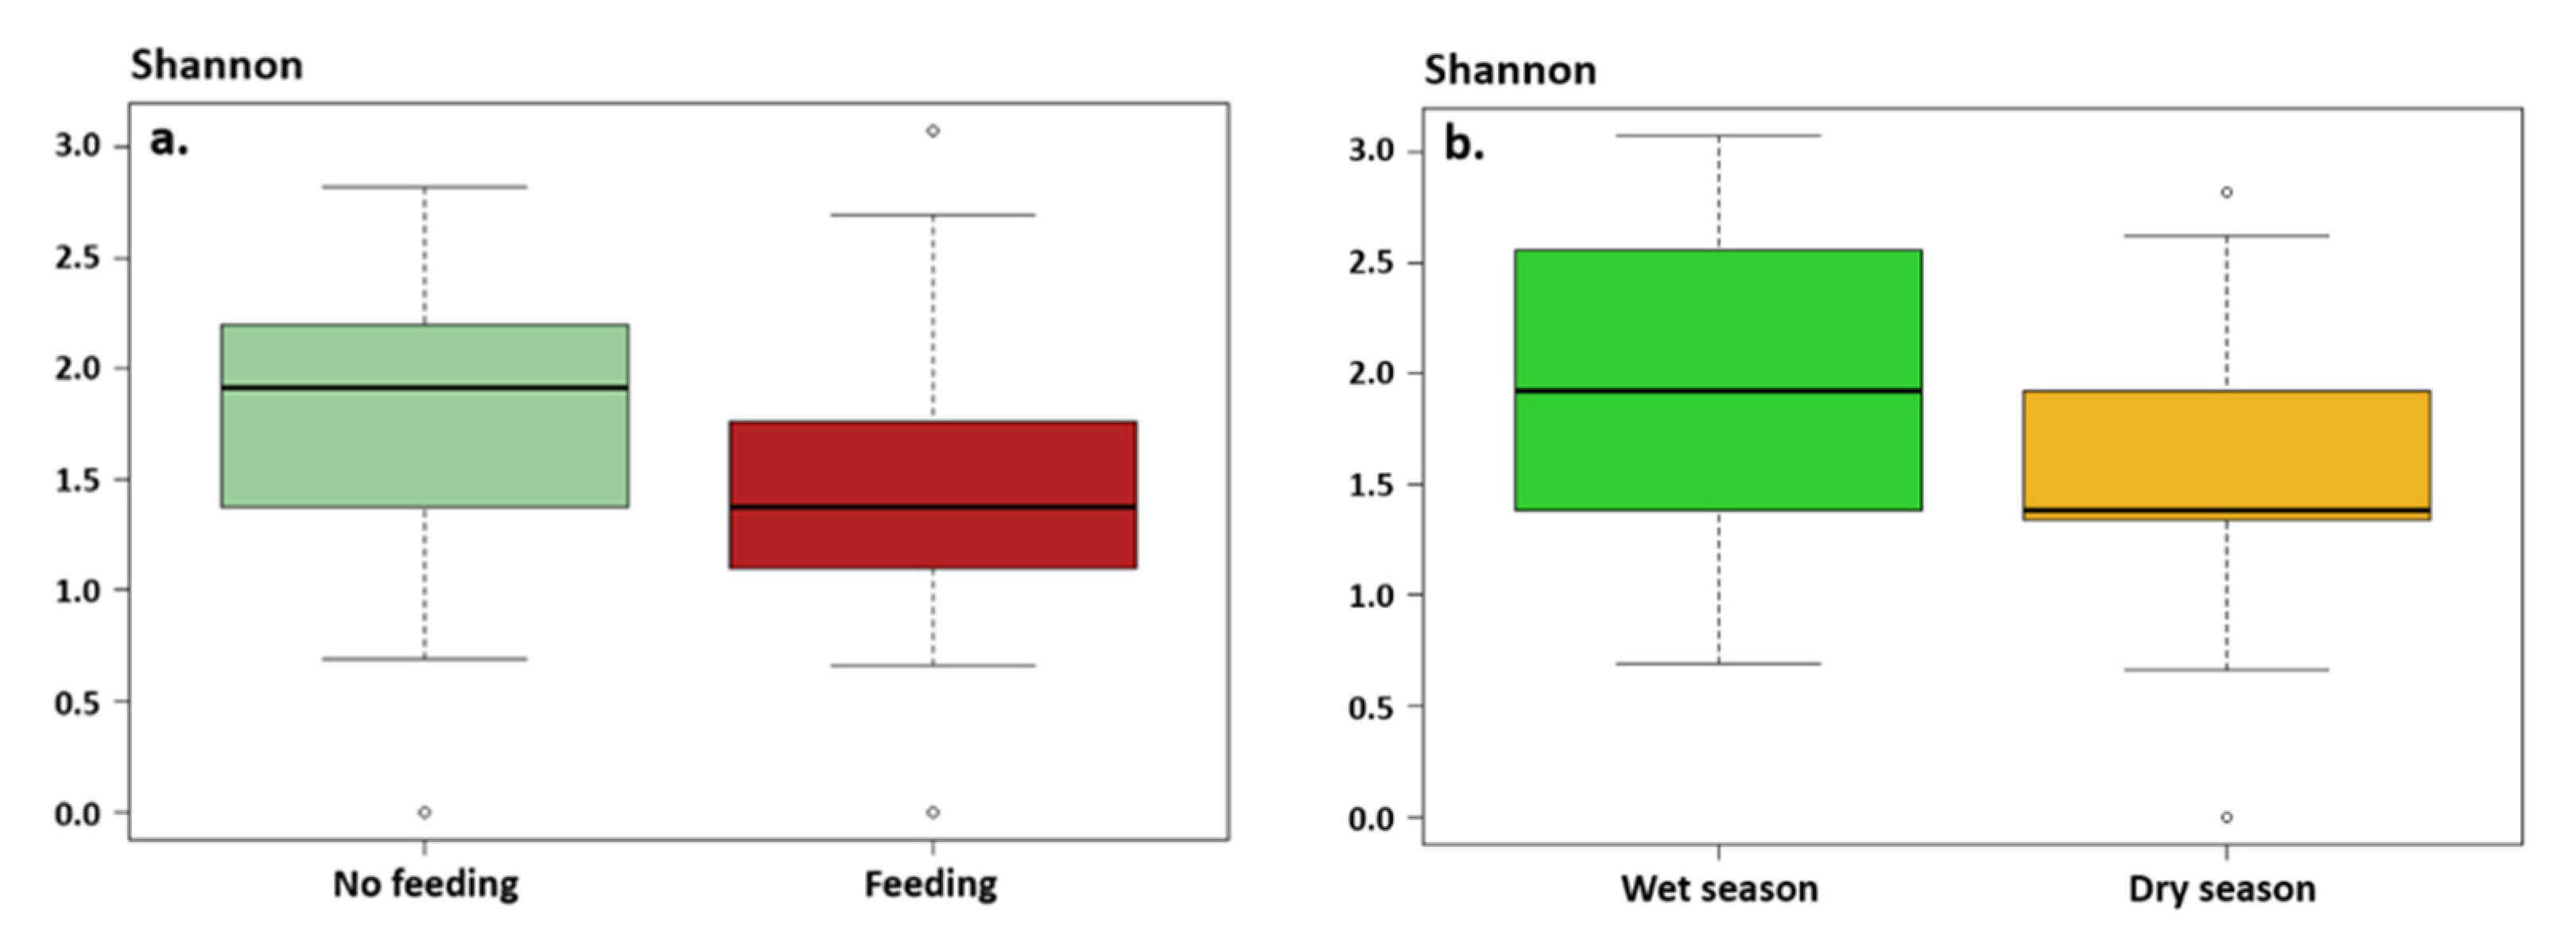
Figure 4.
Microbial communities of BRS gut, as illustrated by a db-RDA using Bray–Curtis dissimilarities (best model: number of reads + shark provisioning). Shark provisioning being factorial, it is represented by its centroid (black diamonds).
Figure 4.
Microbial communities of BRS gut, as illustrated by a db-RDA using Bray–Curtis dissimilarities (best model: number of reads + shark provisioning). Shark provisioning being factorial, it is represented by its centroid (black diamonds).
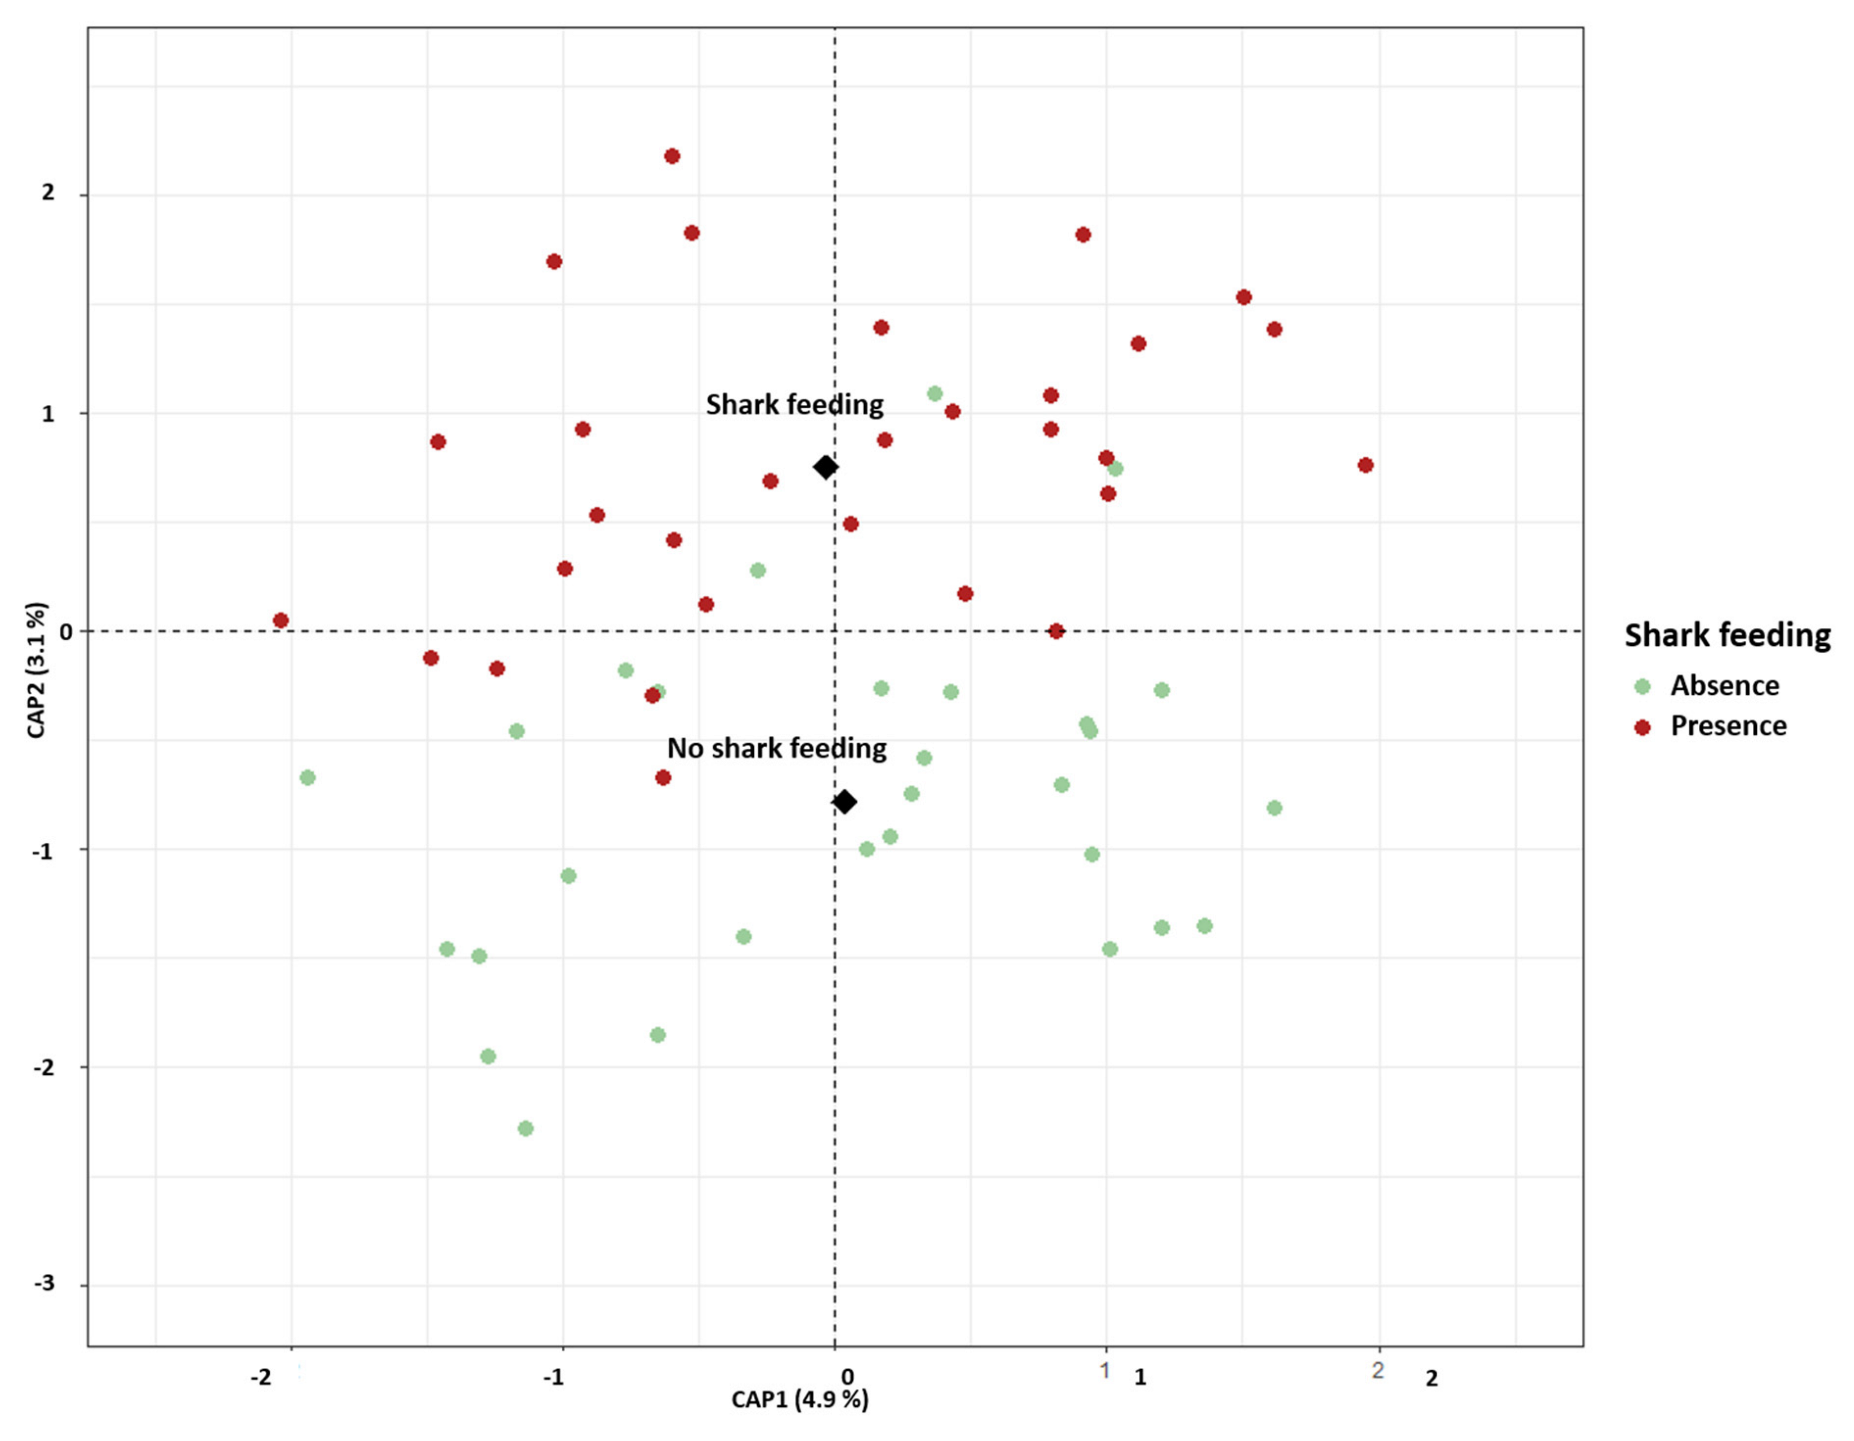
Figure 5.
Indicator values of specific bacterial genera of provisioned and non-provisioned sharks; p-values in brackets.
Figure 5.
Indicator values of specific bacterial genera of provisioned and non-provisioned sharks; p-values in brackets.
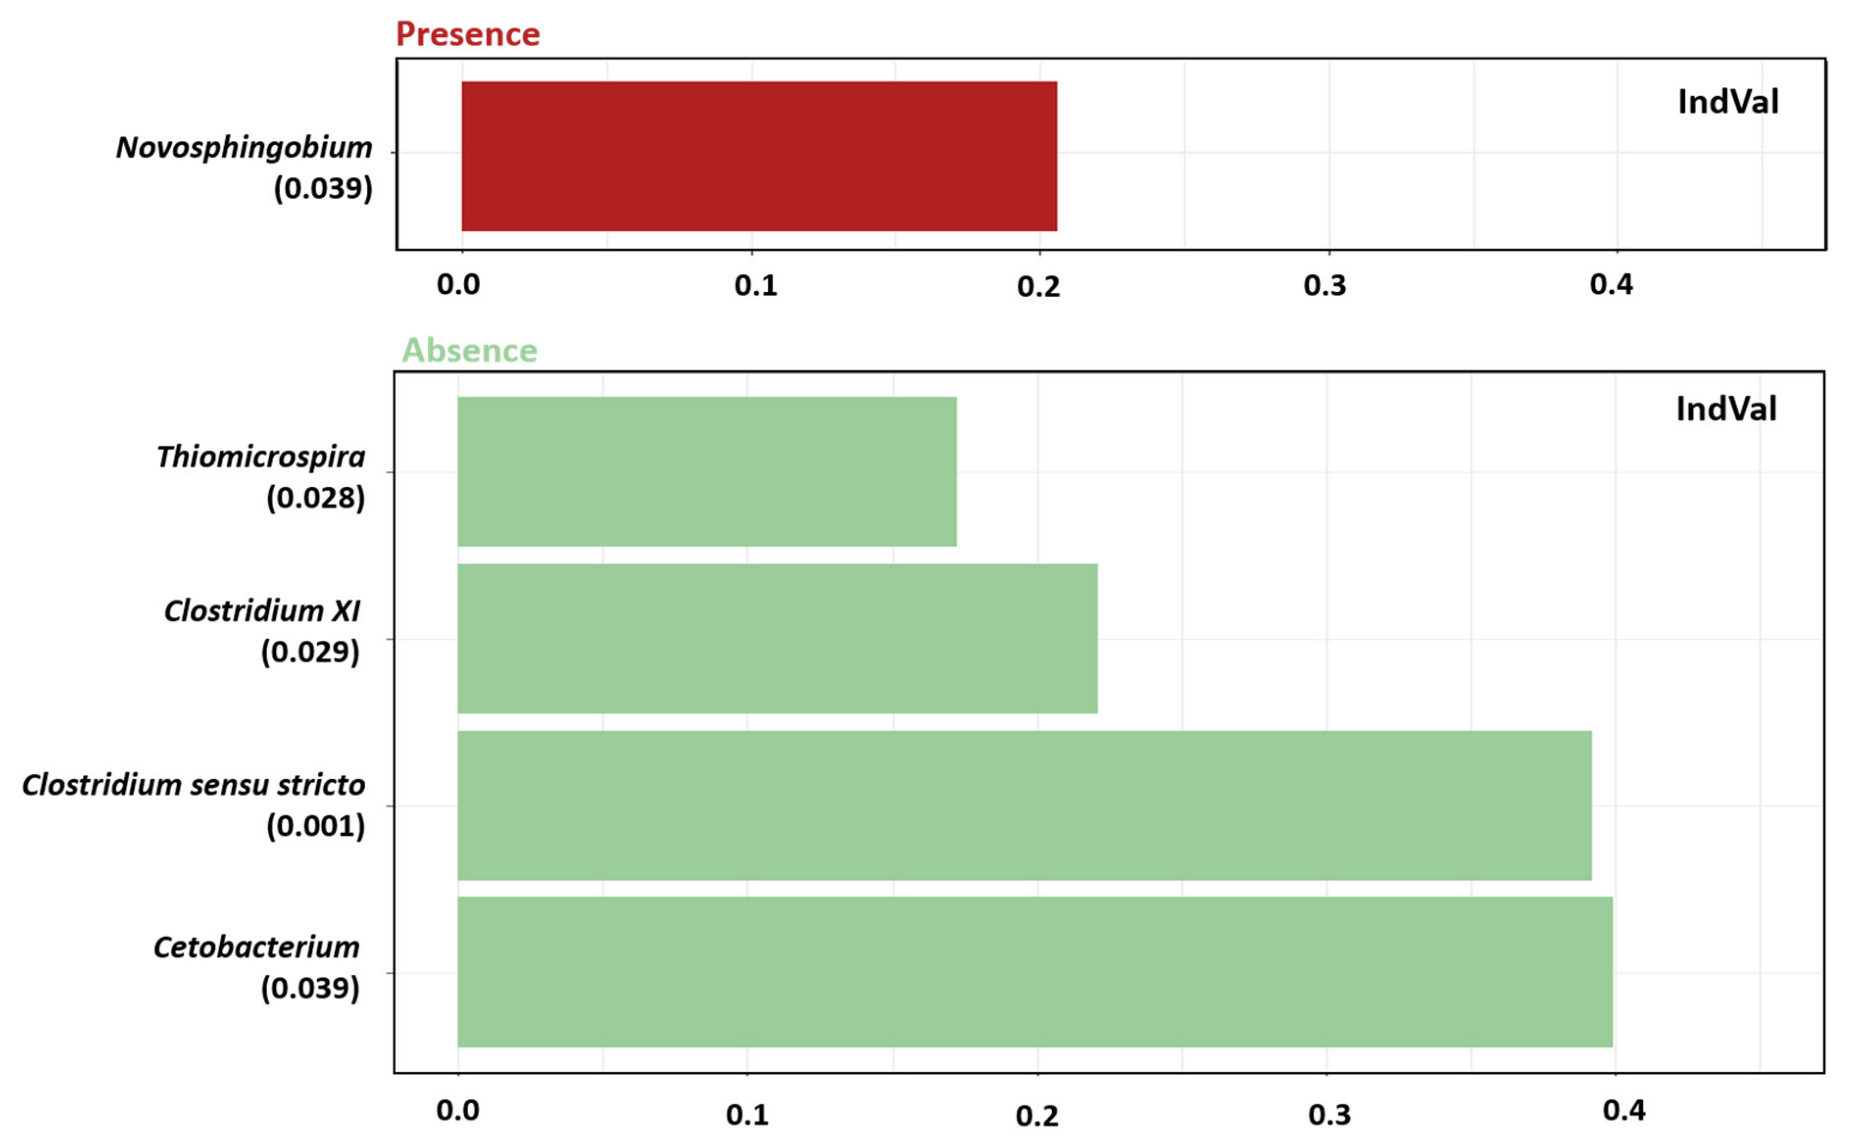
Figure 6.
Indicator values of specific KO functions of provisioned sharks. Only KO functions with a frequency above 1% in at least one sample are shown; p-values in brackets.
Figure 6.
Indicator values of specific KO functions of provisioned sharks. Only KO functions with a frequency above 1% in at least one sample are shown; p-values in brackets.

Table 1.
Relative abundance of bacterial groups in the gut of Carcharhinus melanopterus.
| Phylum | Class | Genus | Mean% ± sd |
|---|---|---|---|
| Proteobacteria | Gammaproteobacteria | Photobacterium | 17.6 ± 13.1 |
| Vibrio | 13.5 ± 13.4 | ||
| Salinivibrio | 3.4 ± 6.7 | ||
| Psychrobacter | 2.6 ± 6.1 | ||
| Acinetobacter | 2.5 ± 5.6 | ||
| Halomonas | 2.5 ± 5.1 | ||
| Shewanella | 2.2 ± 5.2 | ||
| Pseudoalteromonas | 1.8 ± 4.5 | ||
| Thiomicrospira | 1.1± 3.9 | ||
| Pseudomonas | 1.1 ± 3.6 | ||
| Stenotrophomonas | 1.1 ± 4.2 | ||
| Other Gammaproteobacteria (<1%) | 0.1 ± 0.1 | ||
| Alphaproteobacteria | Novosphingobium | 3.4 ± 10.6 | |
| Other Alphaproteobacteria (<1%) | 0.0 ± 0.1 | ||
| Betaproteobacteria | Burkholderia | 1.8 ± 7.1 | |
| Other Betaproteobacteria (<1%) | 0.0 ± 0.0 | ||
| Epsilonproteobacteria | Campylobacter | 1.3 ± 5.3 | |
| Firmicutes | Clostridia | Clostridium sensu stricto | 3.7 ± 8.1 |
| Cellulosilyticum | 2.9 ± 7.5 | ||
| Clostridium XI | 2.6 ± 6.5 | ||
| Clostridium XIVb | 1.4 ± 5.0 | ||
| Other Clostridia | 0.0 ± 0.0 | ||
| Bacilli | Bacillus | 1.3 ± 6.3 | |
| Other bacilli | 0.0 ± 0.1 | ||
| Other Firmicutes (<1%) | 0.8 ± 2.9 | ||
| Fusobacteria | Fusobacteriia | Cetobacterium | 13.2 ± 20.3 |
| Spirochaetes | Spirochaetia | Brevinema | 3.6 ± 8.0 |
| Tenericutes | Mollicutes | Mycoplasma | 1.1 ± 4.3 |
| Other Mollicutes | 0.5 ± 2.3 | ||
| Other Bacteria (including Archaea) (<1%) | 0.0 ± 0.0 | ||
Items that were <1% in relative abundance were grouped into the ‘Other’ categories.
Table 2.
Results for the selected LMM based on the Shannon index.
| Estimate | Sum of Squares | Degree of Freedom | F | p-Value | |
|---|---|---|---|---|---|
| Shannon | |||||
| Number of reads | 5.67 | 1 | 22.89 | 1.32 × 10⁻⁵ | |
| Season | 2.46 | 1 | 9.95 | 2.61 × 10⁻³ | |
| Provisioning | 5.67 | 1 | 5.31 | 0.03 | |
| Intercept | 1.48 | 55 | 1.02 × 10⁻⁸ | ||
| Number of reads | 6.3 × 10⁻³ | 55 | 1.33 × 10⁻⁵ | ||
| Season Dry | −0.47 | 55 | 2.61 × 10⁻³ | ||
| Provisioning presence | −0.31 | 55 | 0.03 | ||
Table 3.
The db-RDA results based on Bray–Curtis dissimilarities.
| Sum of Squares | Degree of Freedom | F | p-Value | |
|---|---|---|---|---|
| Number of reads | 1.02 | 1 | 2.97 | 0.001 |
| Shark provisioning | 0.66 | 1 | 1.93 | 0.006 |
| Residual | 19.18 | 56 |
Publisher’s Note: MDPI stays neutral with regard to jurisdictional claims in published maps and institutional affiliations. |
© 2022 by the authors. Licensee MDPI, Basel, Switzerland. This article is an open access article distributed under the terms and conditions of the Creative Commons Attribution (CC BY) license (https://creativecommons.org/licenses/by/4.0/).
Share and Cite
MDPI and ACS Style
Esposito, A.; Sasal, P.; Clua, É.; Meglécz, E.; Clerissi, C. Shark Provisioning Influences the Gut Microbiota of the Black-Tip Reef Shark in French Polynesia. Fishes 2022, 7, 312. https://doi.org/10.3390/fishes7060312
AMA Style
Esposito A, Sasal P, Clua É, Meglécz E, Clerissi C. Shark Provisioning Influences the Gut Microbiota of the Black-Tip Reef Shark in French Polynesia. Fishes. 2022; 7(6):312. https://doi.org/10.3390/fishes7060312
Chicago/Turabian StyleEsposito, Anaïs, Pierre Sasal, Éric Clua, Emese Meglécz, and Camille Clerissi. 2022. "Shark Provisioning Influences the Gut Microbiota of the Black-Tip Reef Shark in French Polynesia" Fishes 7, no. 6: 312. https://doi.org/10.3390/fishes7060312