
Anthropogenic Contaminants Shape the Fitness of the Endangered European Eel: A Machine Learning Approach
 , , , , ,
Abstract
:1. Introduction
2. Methods
2.1. Data Origin
2.2. Eel Sampling
2.3. Biometry and Dissection
2.4. Lipids, Contaminants and Parasitism
2.5. Life History Traits
2.6. Statistics
2.7. Geographic Features
2.8. Correlation between Predictors
2.9. Non-Parametric Models
2.10. Model Tuning
2.11. Significance Tests
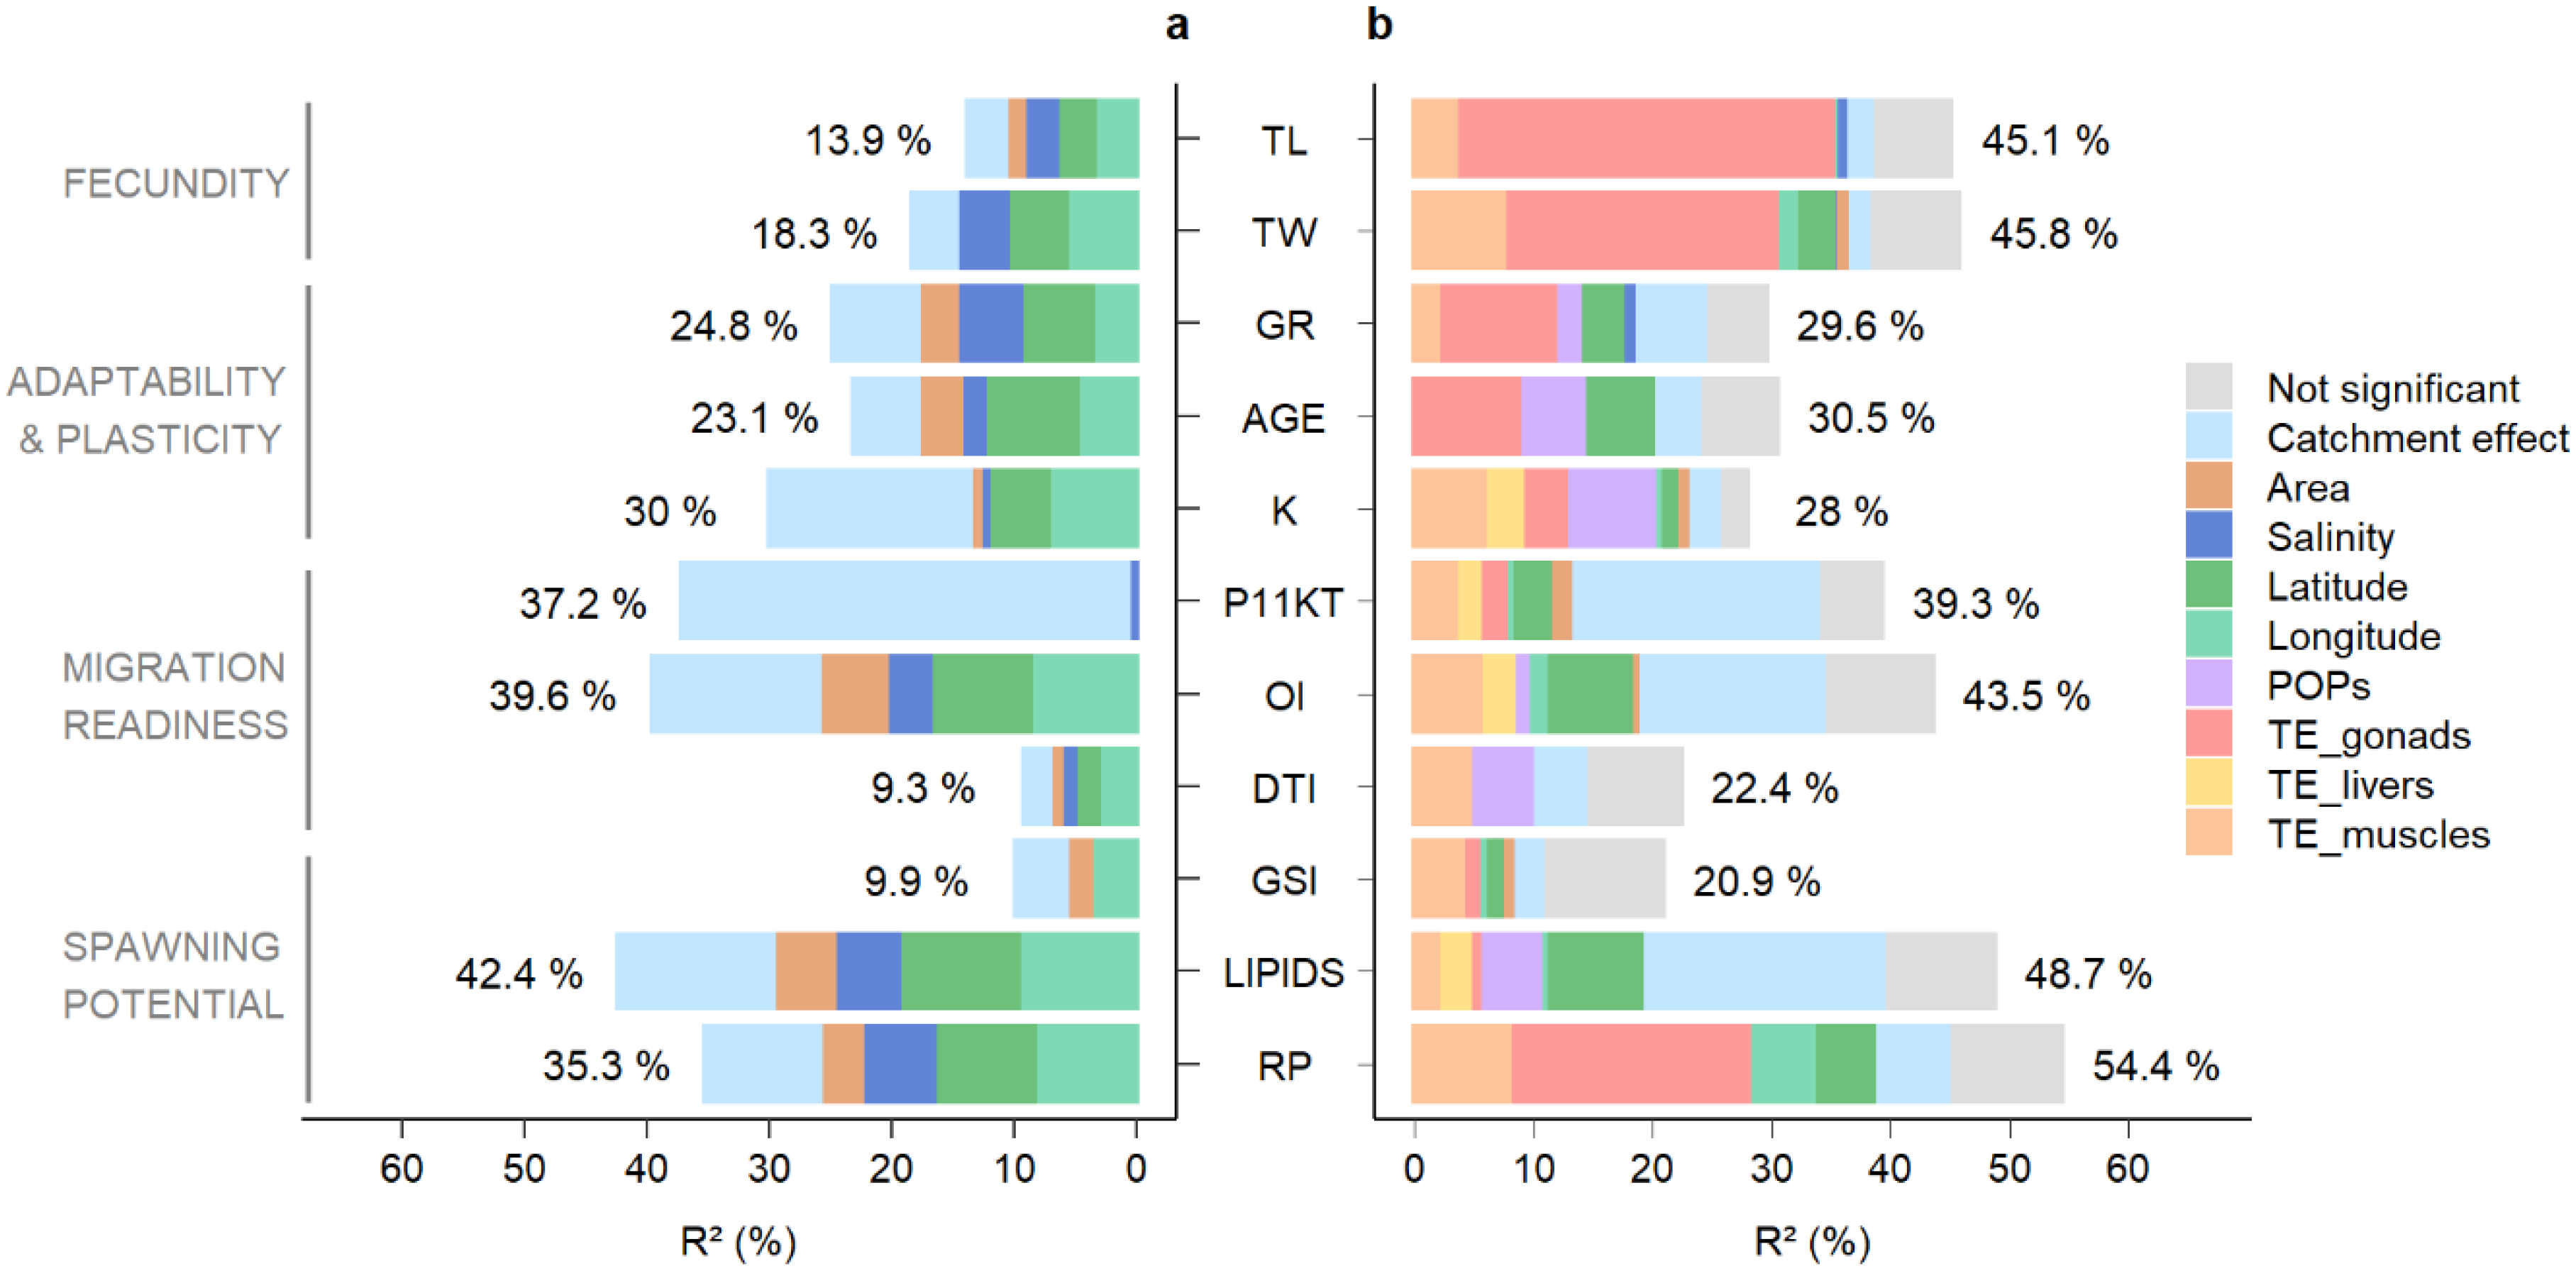
2.12. Contribution Ratios
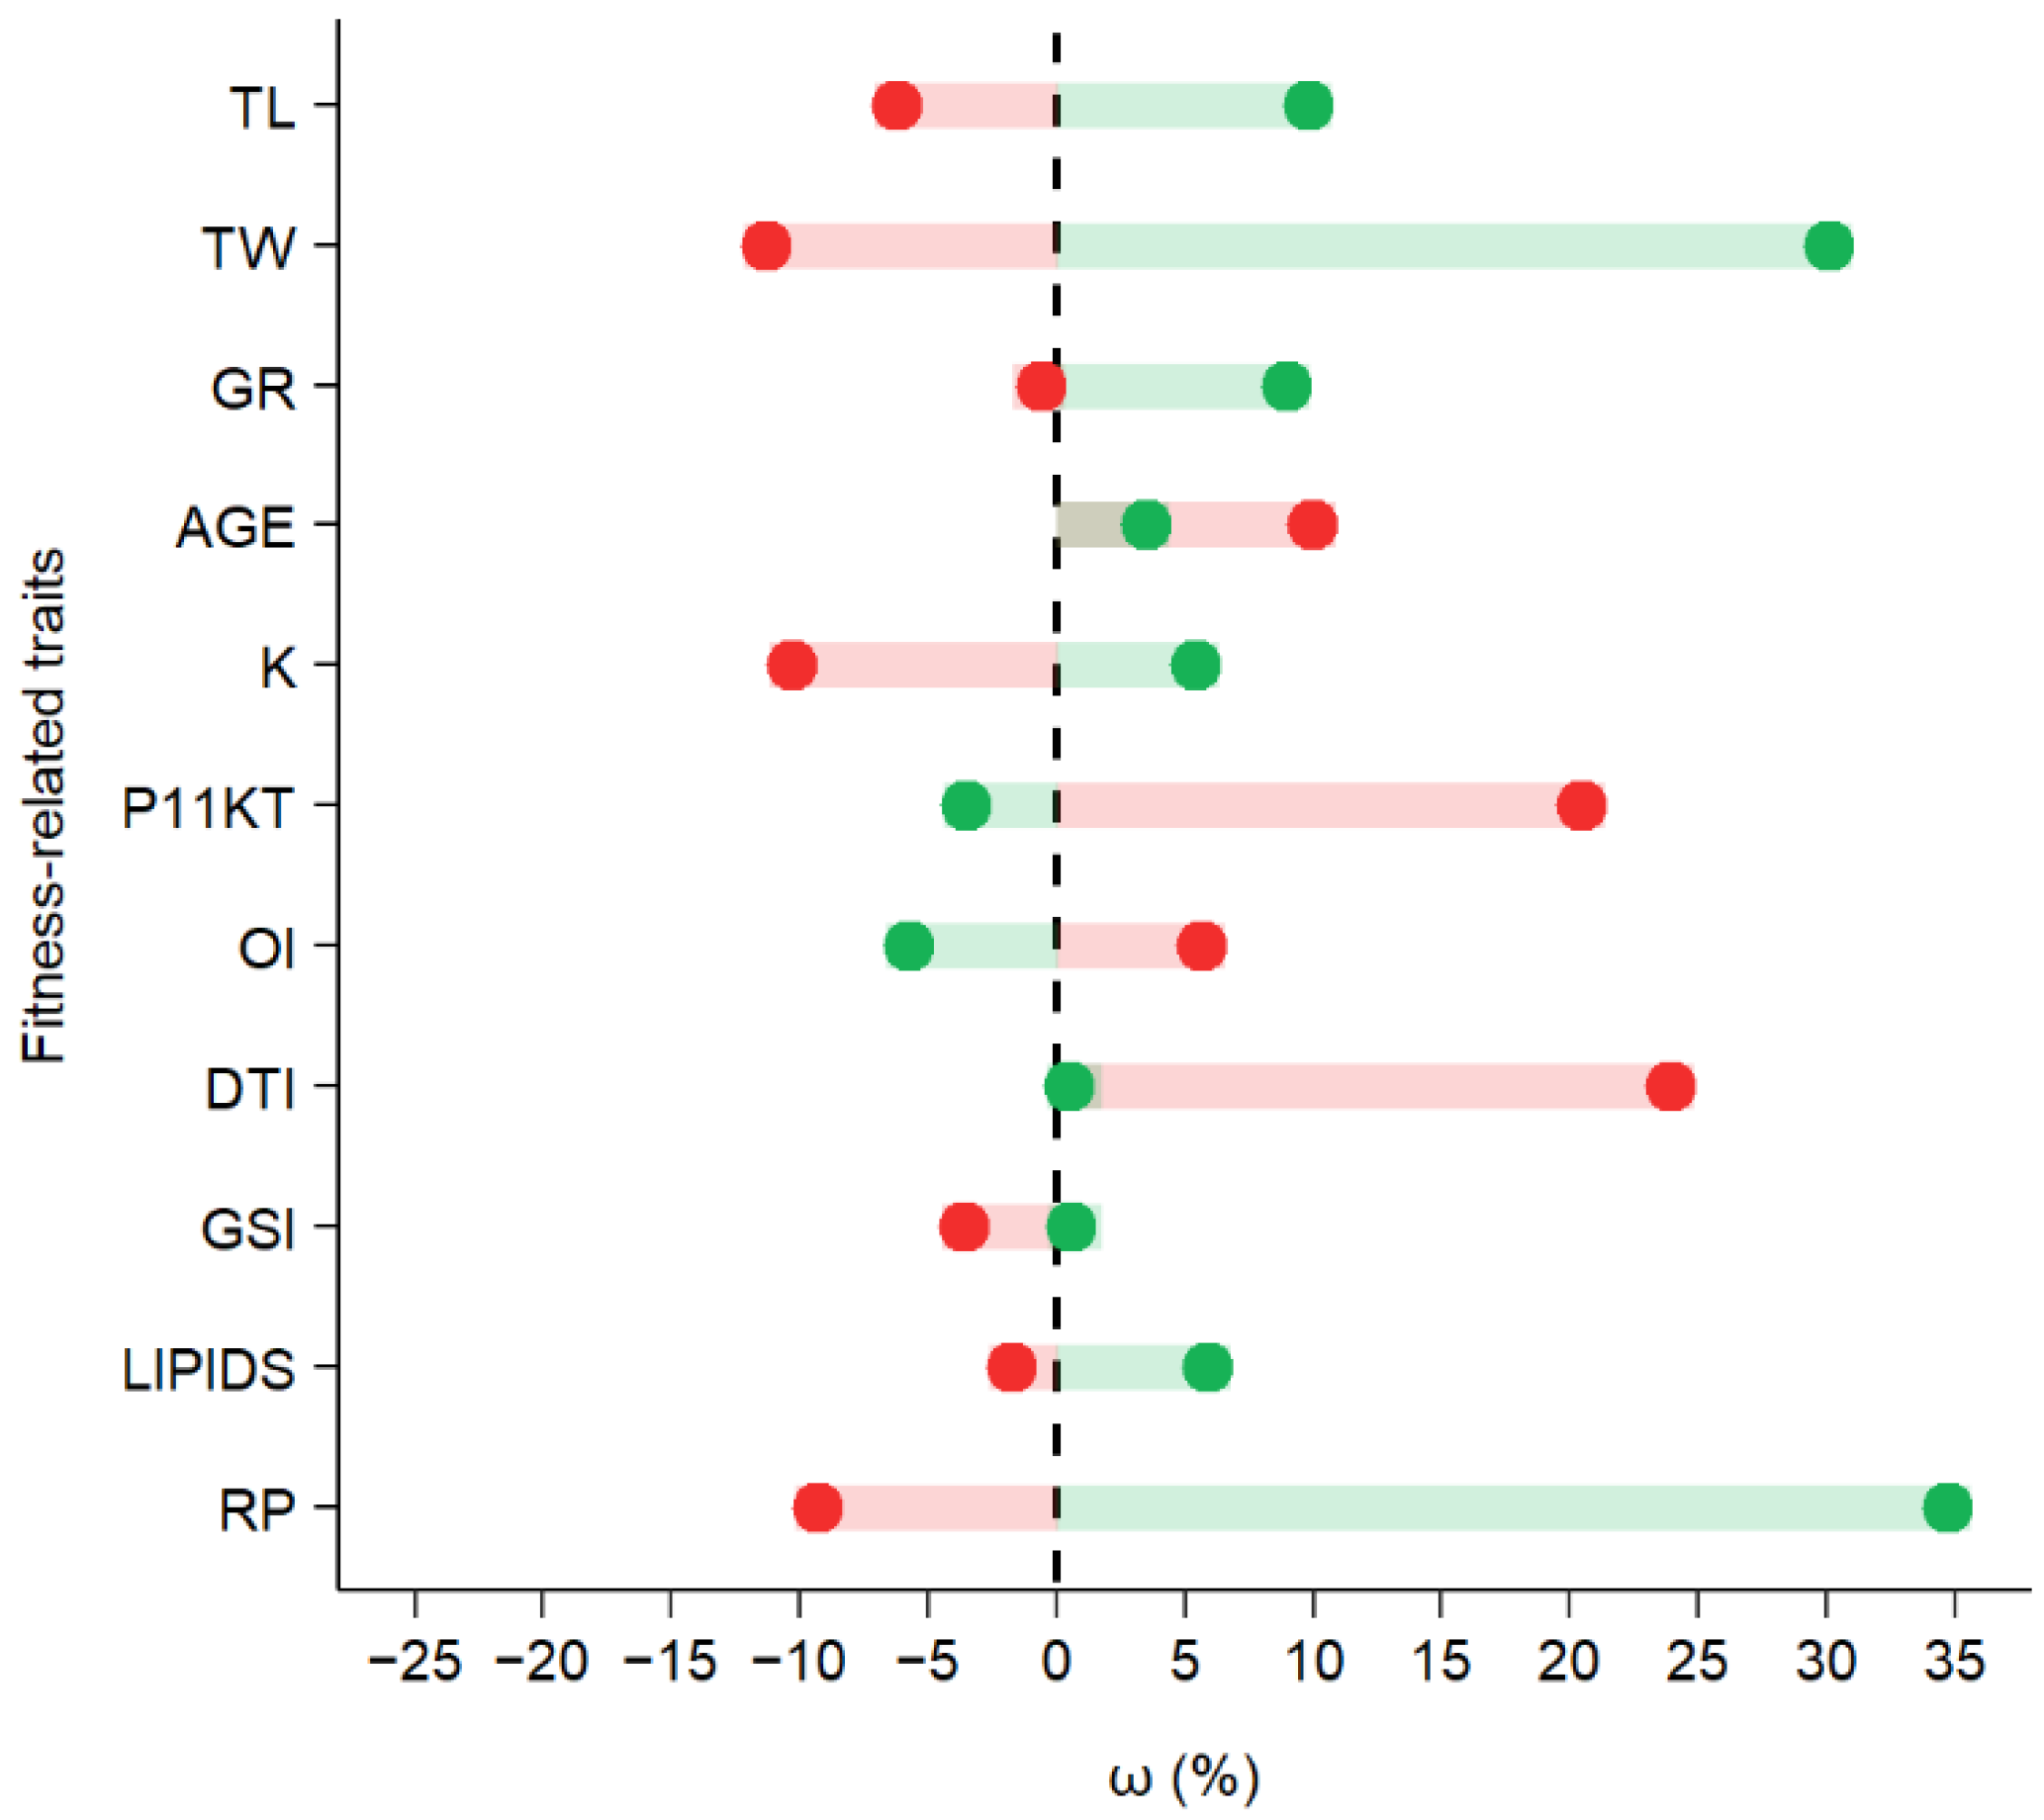
2.13. Trend Extraction
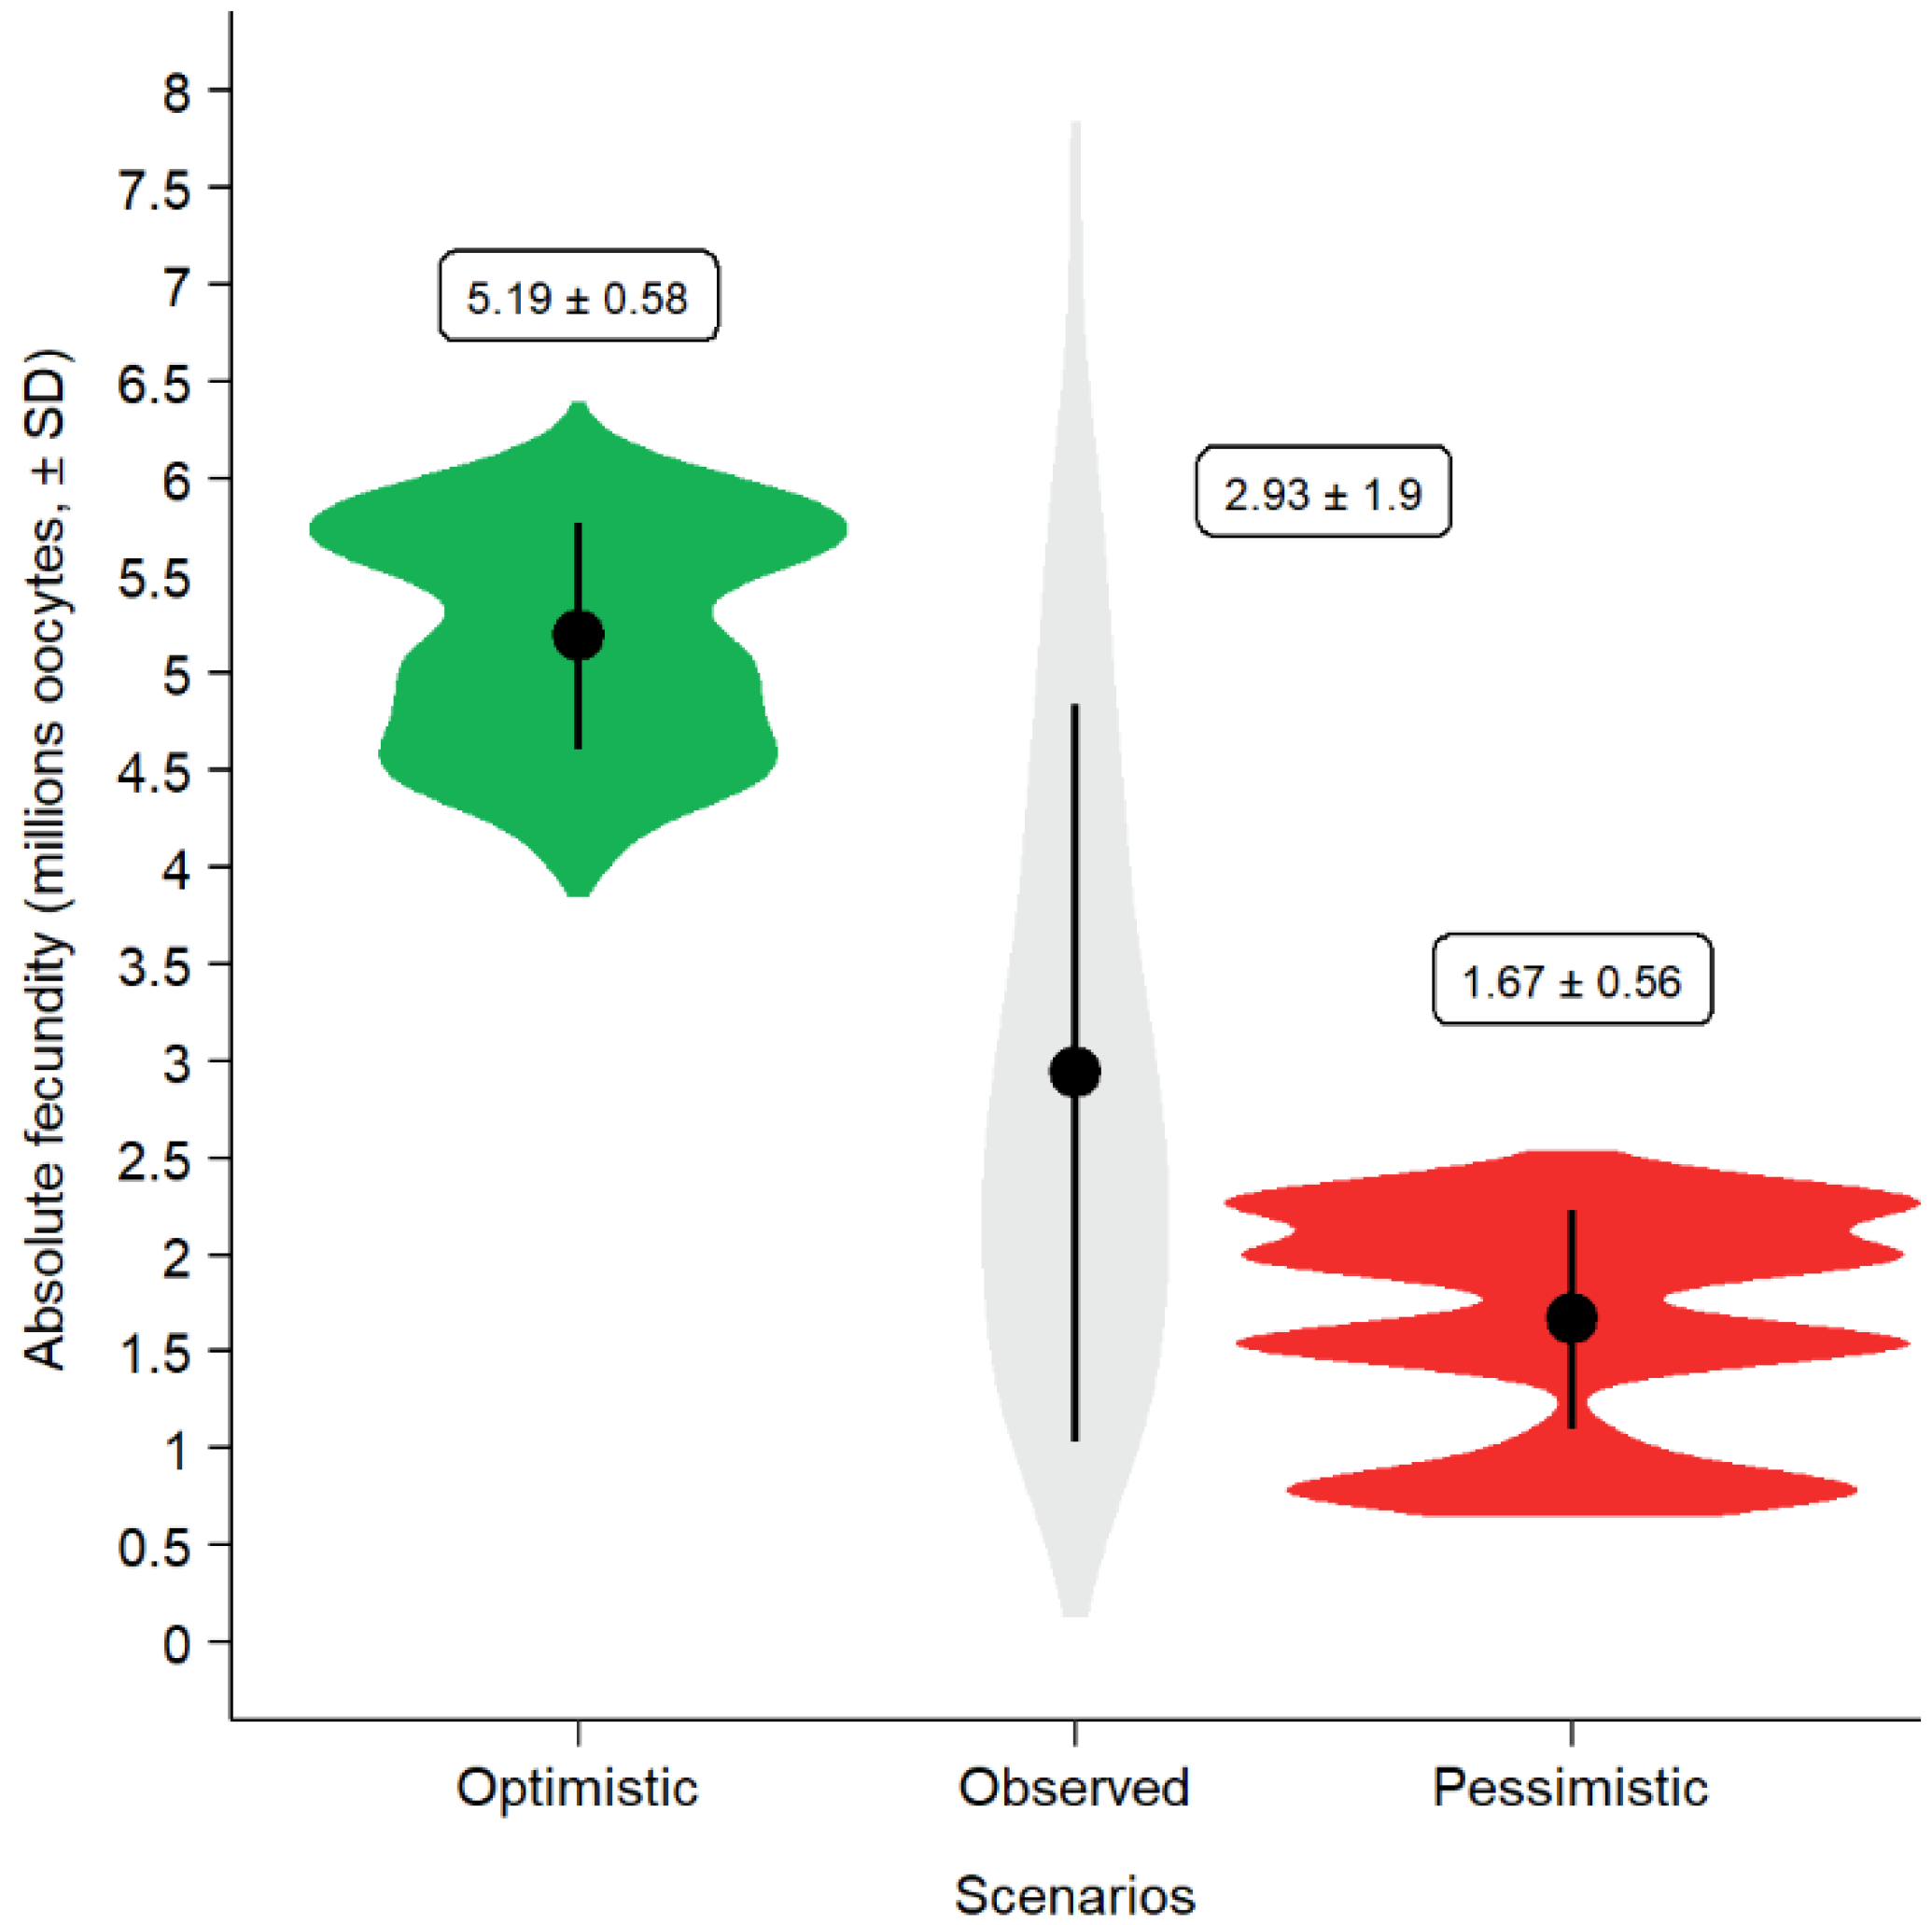
2.14. Contamination Scenarios
2.15. Prediction of Phenotypic Reaction
3. Results
4. Discussion
Supplementary Materials
Author Contributions
Funding
Institutional Review Board Statement
Data Availability Statement
Acknowledgments
Conflicts of Interest
References
- Aoyama, J.; Nishida, M.; Tsukamoto, K. Molecular Phylogeny and Evolution of the Freshwater Eel, Genus Anguilla. Mol. Phylogenet. Evol. 2001, 20, 450–459. [Google Scholar] [CrossRef] [PubMed]
- Barth, J.M.I.; Gubili, C.; Matschiner, M.; Tørresen, O.K.; Watanabe, S.; Egger, B.; Han, Y.S.; Feunteun, E.; Sommaruga, R.; Jehle, R.; et al. Stable Species Boundaries despite Ten Million Years of Hybridization in Tropical Eels. Nat. Commun. 2020, 11, 1–13. [Google Scholar] [CrossRef] [Green Version]
- Tsukamoto, K.; Kuroki, M.; Watanabe, S. Common Names for All Species and Subspecies of the Genus Anguilla. Environ. Biol. Fishes 2020, 103, 985–991. [Google Scholar] [CrossRef]
- Miller, M.J.; Bonhommeau, S.; Munk, P.; Castonguay, M.; Hanel, R.; McCleave, J.D. A Century of Research on the Larval Distributions of the Atlantic Eels: A Re-Examination of the Data. Biol. Rev. 2015, 90, 1035–1064. [Google Scholar] [CrossRef] [PubMed]
- Tesch, F.W. The Eel, 3rd ed.; Thorpe, J.E., Ed.; Wiley-Blackwell: Oxford, UK, 2003; ISBN1 9780632063895. ISBN2 9780470995389. [Google Scholar]
- Larsson, P.; Hamrin, S.; Okla, L. Fat Content as a Factor Inducing Migratory Behavior in the Eel (Anguilla anguilla L.) to the Sargasso Sea. Naturwissenschaften 1990, 77, 488–490. [Google Scholar] [CrossRef]
- Vøllestad, L.A. Geographic Variation in Age and Length at Metamorphosis of Maturing European Eel: Environmental Effects and Phenotypic Plasticity. J. Anim. Ecol. 1992, 61, 41–48. [Google Scholar] [CrossRef]
- Svedäng, H.; Neuman, E.; Wickström, H. Maturation Patterns in Female European Eel: Age and Size at the Silver Eel Stage. J. Fish Biol. 1996, 48, 342–351. [Google Scholar] [CrossRef]
- Yokouchi, K.; Daverat, F.; Miller, M.J.; Fukuda, N.; Sudo, R.; Tsukamoto, K.; Elie, P.; Poole, W.R. Growth Potential Can Affect Timing of Maturity in a Long-Lived Semelparous Fish. Biol. Lett. 2018, 14, 20180269. [Google Scholar] [CrossRef] [PubMed] [Green Version]
- Drouineau, H.; Rigaud, C.; Daverat, F.; Lambert, P. EvEel (Evolutionary Ecology-Based Model for Eel): A Model to Explore the Role of Phenotypic Plasticity as an Adaptive Response of Three Temperate Eels to Spatially Structured Environments. Can. J. Fish. Aquat. Sci. 2014, 71, 1561–1571. [Google Scholar] [CrossRef]
- Mateo, M.; Lambert, P.; Tetard, S.; Castonguay, M.; Ernande, B.; Drouineau, H. Cause or Consequence? Exploring the Role of Phenotypic Plasticity and Genetic Polymorphism in the Emergence of Phenotypic Spatial Patterns of the European Eel. Can. J. Fish. Aquat. Sci. 2017, 74, 987–999. [Google Scholar] [CrossRef]
- Righton, D.; Piper, A.; Aarestrup, K.; Amilhat, E.; Belpaire, C.; Casselman, J.; Castonguay, M.; Díaz, E.; Dörner, H.; Faliex, E.; et al. Important Questions to Progress Science and Sustainable Management of Anguillid Eels. Fish Fish. 2021, 22, 762–788. [Google Scholar] [CrossRef]
- Feunteun, E. Management and Restoration of European Eel Population (Anguilla anguilla): An Impossible Bargain. Ecol. Eng. 2002, 18, 575–591. [Google Scholar] [CrossRef]
- Miller, M.J.; Feunteun, E.; Tsukamoto, K. Did a “Perfect Storm” of Oceanic Changes and Continental Anthropogenic Impacts Cause Northern Hemisphere Anguillid Recruitment Reductions? ICES J. Mar. Sci. 2016, 73, 43–56. [Google Scholar] [CrossRef] [Green Version]
- Drouineau, H.; Durif, C.M.F.; Castonguay, M.; Mateo, M.; Rochard, E.; Verreault, G.; Yokouchi, K.; Lambert, P. Freshwater Eels: A Symbol of the Effects of Global Change. Fish Fish. 2018, 19, 903–930. [Google Scholar] [CrossRef] [Green Version]
- Arevalo, E.; Lassalle, G.; Tétard, S.; Maire, A.; Sauquet, E.; Lambert, P.; Paumier, A.; Villeneuve, B.; Drouineau, H. An Innovative Bivariate Approach to Detect Joint Temporal Trends in Environmental Conditions: Application to Large French Rivers and Diadromous Fish. Sci. Total Environ. 2020, 748, 141260. [Google Scholar] [CrossRef] [PubMed]
- Trancart, T.; Carpentier, A.; Acou, A.; Charrier, F.; Mazel, V.; Danet, V.; Feunteun, E. When “Safe” Dams Kill: Analyzing Combination of Impacts of Overflow Dams on the Migration of Silver Eels. Ecol. Eng. 2020, 145, 105741. [Google Scholar] [CrossRef]
- Geeraerts, C.; Belpaire, C. The Effects of Contaminants in European Eel: A Review. Ecotoxicology 2009, 19, 239–266. [Google Scholar] [CrossRef]
- Szekely, C.; Palstra, A.P.; Molnár, K.; van den Thillart, G.E.E.J.M. Impact of the Swimbladder Parasite on the Health and Performance of European Eels. In Spawning Migration of the European Eel; Springer: Berlin, Germany, 2009; Volume 30, pp. 201–226. [Google Scholar] [CrossRef]
- Robinet, T.; Feunteun, E. Sublethal Effects of Exposure to Chemical Compounds: A Cause for the Decline in Atlantic Eels? Ecotoxicology 2002, 11, 265–277. [Google Scholar] [CrossRef]
- Palstra, A.P.; van Ginneken, V.J.T.; Murk, A.J.; van den Thillart, G.E.E.J.M. Are Dioxin-like Contaminants Responsible for the Eel (Anguilla anguilla) Drama? Naturwissenschaften 2006, 93, 145–148. [Google Scholar] [CrossRef] [PubMed]
- Pierron, F.; Baudrimont, M.; Gonzalez, P.; Bourdineaud, J.P.; Elie, P.; Massabuau, J.C. Common Pattern of Gene Expression in Response to Hypoxia or Cadmium in the Gills of the European Glass Eel (Anguilla anguilla). Environ. Sci. Technol. 2007, 41, 3005–3011. [Google Scholar] [CrossRef]
- Pierron, F.; Baudrimont, M.; Bossy, A.; Bourdineaud, J.P.; Brèthes, D.; Elie, P.; Massabuau, J.C. Impairment of Lipid Storage by Cadmium in the European Eel (Anguilla anguilla). Aquat. Toxicol. 2007, 81, 304–311. [Google Scholar] [CrossRef] [PubMed]
- Pierron, F.; Du Colombier, S.B.; Moffett, A.; Caron, A.; Peluhet, L.; Daffe, G.; Lambert, P.; Elie, P.; Labadie, P.; Budzinski, H.; et al. Abnormal Ovarian DNA Methylation Programming during Gonad Maturation in Wild Contaminated Fish. Environ. Sci. Technol. 2014, 48, 11688–11695. [Google Scholar] [CrossRef] [PubMed]
- Oliveira, M.; Serafim, A.; Bebianno, M.J.; Pacheco, M.; Santos, M.A. European Eel (Anguilla anguilla L.) Metallothionein, Endocrine, Metabolic and Genotoxic Responses to Copper Exposure. Ecotoxicol. Environ. Saf. 2008, 70, 20–26. [Google Scholar] [CrossRef] [PubMed]
- Maes, G.E.; Raeymaekers, J.A.M.; Hellemans, B.; Geeraerts, C.; Parmentier, K.; de Temmerman, L.; Volckaert, F.A.M.; Belpaire, C. Gene Transcription Reflects Poor Health Status of Resident European Eel Chronically Exposed to Environmental Pollutants. Aquat. Toxicol. 2013, 126, 242–255. [Google Scholar] [CrossRef]
- ICES Joint EIFAAC/ICES/GFCM Working Group on Eels (WGEEL). ICES Scientific Reports; ICES: Copenhagen, Denmark, 2020; Volume 2, Available online: https://www.ices.dk/Community/Groups/Pages/WGEEL.Aspx (accessed on 15 June 2021).
- Feunteun, E.; Prouzet, P. Forty Years of Decline and 10 Years of Management Plan: Are European Eels (Anguilla anguilla) Recovering. In Evolution of Marine Coastal Ecosystems under the Pressure of Global Changes; Springer International Publishing: Cham, Switzerland, 2020; pp. 269–295. [Google Scholar]
- Belpaire, C.; Hodson, P.; Pierron, F.; Freese, M. Impact of Chemical Pollution on Atlantic Eels: Facts, Research Needs and Implications for Management. Curr. Opin. Environ. Sci. Health 2019, 11, 26–36. [Google Scholar] [CrossRef]
- Durif, C.M.F.; Dufour, S.; Elie, P. Impact of Silvering Stage, Age, Body Size and Condition on Reproductive Potential of the European Eel. Mar. Ecol. Prog. Ser. 2006, 327, 171–181. [Google Scholar] [CrossRef] [Green Version]
- Sühring, R.; Freese, M.; Schneider, M.; Schubert, S.; Pohlmann, J.D.; Alaee, M.; Wolschke, H.; Hanel, R.; Ebinghaus, R.; Marohn, L. Maternal Transfer of Emerging Brominated and Chlorinated Flame Retardants in European Eels. Sci. Total Environ. 2015, 530–531, 209–218. [Google Scholar] [CrossRef] [Green Version]
- Freese, M.; Sühring, R.; Marohn, L.; Pohlmann, J.D.; Wolschke, H.; Byer, J.D.; Alaee, M.; Ebinghaus, R.; Hanel, R. Maternal Transfer of Dioxin-like Compounds in Artificially Matured European Eels. Environ. Pollut. 2017, 227, 348–356. [Google Scholar] [CrossRef]
- Bourillon, B.; Acou, A.; Trancart, T.; Belpaire, C.; Covaci, A.; Bustamante, P.; Faliex, E.; Amilhat, E.; Malarvannan, G.; Virag, L.; et al. Assessment of the Quality of European Silver Eels and Tentative Approach to Trace the Origin of Contaminants—A European Overview. Sci. Total Environ. 2020, 743, 140675. [Google Scholar] [CrossRef] [PubMed]
- CORDIS (Community Research Service). Final Report Summary—EELIAD (European Eels in the Atlantic: Assessment of Their Decline); CORDIS: Luxembourg, Luxembourg, 2013. [Google Scholar]
- Pankhurst, N.W. Relation of Visual Changes to the Onset of Sexual Maturation in the European Eel Anguilla anguilla (L.). J. Fish Biol. 1982, 21, 127–140. [Google Scholar] [CrossRef]
- Aroua, S.; Schmitz, M.; Baloche, S.; Vidal, B.; Rousseau, K.; Dufour, S. Endocrine Evidence That Silvering, a Secondary Metamorphosis in the Eel, Is a Pubertal Rather than a Metamorphic Event. Neuroendocrinology 2005, 82, 221–232. [Google Scholar] [CrossRef] [PubMed]
- Durif, C.; Dufour, S.; Elie, P. The Silvering Process of Anguilla anguilla: A New Classification from the Yellow Resident to the Silver Migrating Stage. J. Fish Biol. 2005, 66, 1025–1043. [Google Scholar] [CrossRef]
- Belpaire, C.G.J.; Goemans, G.; Geeraerts, C.; Quataert, P.; Parmentier, K.; Hagel, P.; de Boer, J. Decreasing Eel Stocks: Survival of the Fattest? Ecol. Freshw. Fish 2009, 18, 197–214. [Google Scholar] [CrossRef]
- Sudo, R.; Tosaka, R.; Ijiri, S.; Adachi, S.; Aoyama, J.; Tsukamoto, K. 11-Ketotestosterone Synchronously Induces Oocyte Development and Silvering-Related Changes in the Japanese Eel, Anguilla Japonica. Zool. Sci. 2012, 29, 254–259. [Google Scholar] [CrossRef] [PubMed]
- MacNamara, R.; McCarthy, T.K. Size-Related Variation in Fecundity of European Eel (Anguilla anguilla). ICES J. Mar. Sci. 2012, 69, 1333–1337. [Google Scholar] [CrossRef] [Green Version]
- Sudo, R.; Tsukamoto, K. Migratory Restlessness and the Role of Androgen for Increasing Behavioral Drive in the Spawning Migration of the Japanese Eel. Sci. Rep. 2015, 5, 1–7. [Google Scholar] [CrossRef] [PubMed] [Green Version]
- Boulenger, C.; Acou, A.; Gimenez, O.; Charrier, F.; Tremblay, J.; Feunteun, E. Factors Determining Survival of European Eels in Two Unexploited Sub-Populations. Freshw. Biol. 2016, 61, 947–962. [Google Scholar] [CrossRef]
- Geffroy, B.; Bardonnet, A. Sex Differentiation and Sex Determination in Eels: Consequences for Management. Fish Fish. 2016, 17, 375–398. [Google Scholar] [CrossRef]
- MacNamara, R.; McCarthy, T.K.; Wickström, H.; Clevestam, P.D. Fecundity of Silver-Phase Eels (Anguilla anguilla) from Different Habitat Types and Geographic Locations. ICES J. Mar. Sci. 2016, 73, 135–141. [Google Scholar] [CrossRef]
- ICES Workshop on Age Reading of European and American Eel (WKAREA); ICES Scientific Reports; ICES: Copenhagen, Denmark, 2009.
- Réveillac, É. Histoires de Vie Larvaire et Dispersion Des Anguillidae: Vers Une Approche Bio-Évolutive; University of La Rochelle: La Rochelle, France, 2008. [Google Scholar]
- Fulton, T.W. The Rate of Growth of Fishes. Fish. Board Scotl. 1904, 3, 141–241. [Google Scholar]
- Mazzeo, I.; Peñaranda, D.S.; Gallego, V.; Baloche, S.; Nourizadeh-Lillabadi, R.; Tveiten, H.; Dufour, S.; Asturiano, J.F.; Weltzien, F.A.; Pérez, L. Temperature Modulates the Progression of Vitellogenesis in the European Eel. Aquaculture 2014, 434, 38–47. [Google Scholar] [CrossRef]
- ICES Report of the Joint EIFAAC/ICES Working Group on Eels (WGEEL). ICES Scientific Reports; ICES: Copenhagen, Denmark, 18–22 March 2013 in Sukarietta, Spain, 4–10 September 2013 in Copenhagen, Denmark; 2013; Available online: https://www.ices.dk/Community/Groups/Pages/WGEEL.aspx (accessed on 1 November 2020).
- QGIS Development Team QGIS Geographic Information System. Open Source Geospatial Foundation Project. 2017. Available online: http://qgis.osgeo.org (accessed on 15 December 2017).
- Righton, D.; Westerberg, H.; Feunteun, E.; Økland, F.; Gargan, P.; Amilhat, E.; Metcalfe, J.; Lobon-Cervia, J.; Sjöberg, N.; Simon, J.; et al. Empirical Observations of the Spawning Migration of European Eels: The Long and Dangerous Road to the Sargasso Sea. Sci. Adv. 2016, 2, e1501694. [Google Scholar] [CrossRef] [PubMed] [Green Version]
- Friedland, K.D.; Miller, M.J.; Knights, B. Oceanic Changes in the Sargasso Sea and Declines in Recruitment of the European Eel. ICES J. Mar. Sci. 2007, 64, 519–530. [Google Scholar] [CrossRef]
- Maes, G.E.; Raeymaekers, J.A.M.; Pampoulie, C.; Seynaeve, A.; Goemans, G.; Belpaire, C.; Volckaert, F.A.M. The Catadromous European Eel Anguilla anguilla (L.) as a Model for Freshwater Evolutionary Ecotoxicology: Relationship between Heavy Metal Bioaccumulation, Condition and Genetic Variability. Aquat. Toxicol. 2005, 73, 99–114. [Google Scholar] [CrossRef] [PubMed]
- Boulenger, C.; Crivelli, A.J.; Charrier, F.; Roussel, J.M.; Feunteun, E.; Acou, A. Difference in Factors Explaining Growth Rate Variability in European Eel Subpopulations: The Possible Role of Habitat Carrying Capacity. Ecol. Freshw. Fish 2016, 25, 281–294. [Google Scholar] [CrossRef]
- Wickham, H. Easily Install and Load the “Tidyverse”. 2019. Available online: https://tidyverse.tidyverse.org/ (accessed on 23 September 2019).
- R Core Team. R: A Language and Environment for Statistical Computing; R Foundation for Statistical Computing: Vienna, Austria, 2020; Available online: https://www.r-project.org/ (accessed on 23 September 2020).
- Vogt, J.; Soille, P.; de Jager, A.; Rimavičiūtė, E.; Mehl, W.; Foisneau, S.; Bódis, K.; Dusart, J.; Paracchini, M.L.; Haastrup, P.; et al. A Pan-European River and Catchment Database, Version 2.0 (CCM2); European Commission: Luxembourg, 2007. [Google Scholar]
- Kuhn, M.; Wing, J.; Weston, S.; Williams, A.; Keefer, C.; Engelhardt, A.; Cooper, T.; Mayer, Z.; Kenkel, B.; Benesty, M.; et al. Package “caret”; R Foundation for Statistical Computing: Vienna, Austria, 2020; pp. 1–224. [Google Scholar]
- Liaw, A.; Wiener, M. Classification and Regression by RandomForest. R News 2002, 2, 18–22. [Google Scholar]
- Biau, G.; Scornet, E. A Random Forest Guided Tour. Test 2016, 25, 197–227. [Google Scholar] [CrossRef] [Green Version]
- Breiman, L.; Friedman, J.H.; Olshen, R.A.; Stone, C.J. Classification and Regression Trees, 1st ed.; CRC Press: Boca Raton, FL, USA, 1984; ISBN 9781351460491. [Google Scholar]
- Breiman, L. Random Forests. Mach. Learn. 2001, 45, 5–32. [Google Scholar] [CrossRef] [Green Version]
- Ellis, N.; Smith, S.J.; Pitcher, C.R. Gradient Forests: Calculating Importance Gradients on Physical Predictors. Ecology 2012, 93, 156–168. [Google Scholar] [CrossRef]
- Archer, E. RfPermute: Estimate Permutation p-Values for Random Forest Importance Metrics; R Foundation for Statistical Computing: Vienna, Austria, 2020; pp. 1–22. [Google Scholar]
- Wood, S. Mixed GAM Computation Vehicle with Automatic Smoothness Estimation; R Foundation for Statistical Computing: Vienna, Austria, 2020; pp. 1–322. [Google Scholar]
- Zhang, H. Predictive Inference for Random Forests (Rfinterval); R Foundation for Statistical Computing: Vienna, Austria, 2019; pp. 1–5. [Google Scholar]
- Zhang, H.; Zimmerman, J.; Nettleton, D.; Nordman, D.J. Random Forest Prediction Intervals. Am. Stat. 2019, 74, 392–406. [Google Scholar] [CrossRef]
- Ogle, D.; Wheeler, P.; Dinno, A. FSA: Simple Fisheries Stock Assessment Methods; R Foundation for Statistical Computing: Vienna, Austria, 2020; pp. 1–203. [Google Scholar]
- Macnamara, R.; Koutrakis, E.T.; Sapounidis, A.; Lachouvaris, D.; Arapoglou, F.; Panora, D.; McCarthy, T.K. Reproductive Potential of Silver European Eels (Anguilla anguilla) Migrating from Vistonis Lake (Northern Aegean Sea, Greece). Mediterr. Mar. Sci. 2014, 15, 539–544. [Google Scholar] [CrossRef]
- Dębowska, M.; Nowosad, J.; Targońska, K.; Żarski, D.; Biłas, M.; Łuczyńska, J.; Kucharczyk, D. Fecundity of Migrating European Eel (Anguilla anguilla) from Polish Waters. Ital. J. Anim. Sci. 2015, 14, 566–570. [Google Scholar] [CrossRef] [Green Version]
- Oliveira, K. Life History Characteristics and Strategies of the American Eel, Anguilla Rostrata. Can. J. Fish. Aquat. Sci. 1999, 56, 795–802. [Google Scholar] [CrossRef]
- Jessop, B.M. Geographic Effects on American Eel (Anguilla Rostrata) Life History Characteristics and Strategies. Can. J. Fish. Aquat. Sci. 2010, 67, 326–346. [Google Scholar] [CrossRef]
- Vélez-Espino, L.A.; Koops, M.A. A Synthesis of the Ecological Processes Influencing Variation in Life History and Movement Patterns of American Eel: Towards a Global Assessment. Rev. Fish Biol. Fish 2010, 20, 163–186. [Google Scholar] [CrossRef] [Green Version]
- Wood, C.M.; Farrell, A.P.; Brauner, C.J. Homeostasis and Toxicology of Essential Metals, 1st ed.; Elsevier: Amsterdam, The Netherlands, 2011; Volume 31A, ISBN 9780123786364. [Google Scholar]
- Bornarel, V.; Lambert, P.; Briand, C.; Antunes, C.; Belpaire, C.; Ciccotti, E.; Diaz, E.; Diserud, O.; Doherty, D.; Domingos, I.; et al. Modelling the Recruitment of European Eel (Anguilla anguilla) throughout Its European Range. ICES J. Mar. Sci. 2018, 75, 541–552. [Google Scholar] [CrossRef]
- Mouneyrac, C.; Leung, P.T.; Leung, K.M. Cost of Tolerance. In Tolerance to Environmental Contaminants; CRC Press: Boca Raton, FL, USA, 2011; pp. 265–298. [Google Scholar]
- Freese, M.; Rizzo, L.Y.; Pohlmann, J.-D.; Marohn, L.; Witten, P.E.; Gremse, F.; Rütten, S.; Güvener, N.; Michael, S.; Wysujack, K.; et al. Bone Resorption and Body Reorganization during Maturation Induce Maternal Transfer of Toxic Metals in Anguillid Eels. Proc. Natl. Acad. Sci. USA 2019, 116, 201817738. [Google Scholar] [CrossRef] [Green Version]
- Pierron, F.; Baudrimont, M.; Dufour, S.; Elie, P.; Bossy, A.; Baloche, S.; Mesmer-Dudons, N.; Gonzalez, P.; Bourdineaud, J.P.; Massabuau, J.C. How Cadmium Could Compromise the Completion of the European Eel’s Reproductive Migration. Environ. Sci. Technol. 2008, 42, 4607–4612. [Google Scholar] [CrossRef]
- van Ginneken, V.J.T.; van den Thillart, G.E.E.J.M. Eel Fat Stores Are Enough to Reach the Sargasso. Nature 2000, 403, 156–157. [Google Scholar] [CrossRef]
- Kime, D.E. The Effects of Pollution on Reproduction in Fish. Rev. Fish Biol. Fish 1995, 5, 52–95. [Google Scholar] [CrossRef]
- Vos, J.G.; Dybing, E.; Greim, H.A.; Ladefoged, O.; Lambré, C.; Tarazona, J.; Brandt, I.; Vethaak, A.D. Health Effects of Endocrine-Disrupting Chemicals on Wildlife, with Special Reference to the European Situation. Crit. Rev. Toxicol. 2000, 30, 71–133. [Google Scholar] [CrossRef] [PubMed]
- Horri, K.; Alfonso, S.; Cousin, X.; Munschy, C.; Loizeau, V.; Aroua, S.; Bégout, M.L.; Ernande, B. Fish Life-History Traits Are Affected after Chronic Dietary Exposure to an Environmentally Realistic Marine Mixture of PCBs and PBDEs. Sci. Total Environ. 2018, 610–611, 531–545. [Google Scholar] [CrossRef] [Green Version]
- Bastos Gonçalves, B.; Cardoso Giaquinto, P.; dos Santos Silva, D.; de Melo e Silva Neto, C.; Alves de Lima, A.; Antonio Brito Darosci, A.; Laço Portinho, J.; Fernandes Carvalho, W.; Lopes Rocha, T. Ecotoxicology of Glyphosate-Based Herbicides on Aquatic Environment. In Biochemical Toxicology—Heavy Metals and Nanomaterials; IntechOpen: London, UK, 2019. [Google Scholar]
- Hendry, A.P.; Farrugia, T.J.; Kinnison, M.T. Human Influences on Rates of Phenotypic Change in Wild Animal Populations. Mol. Ecol. 2008, 17, 20–29. [Google Scholar] [CrossRef] [PubMed]


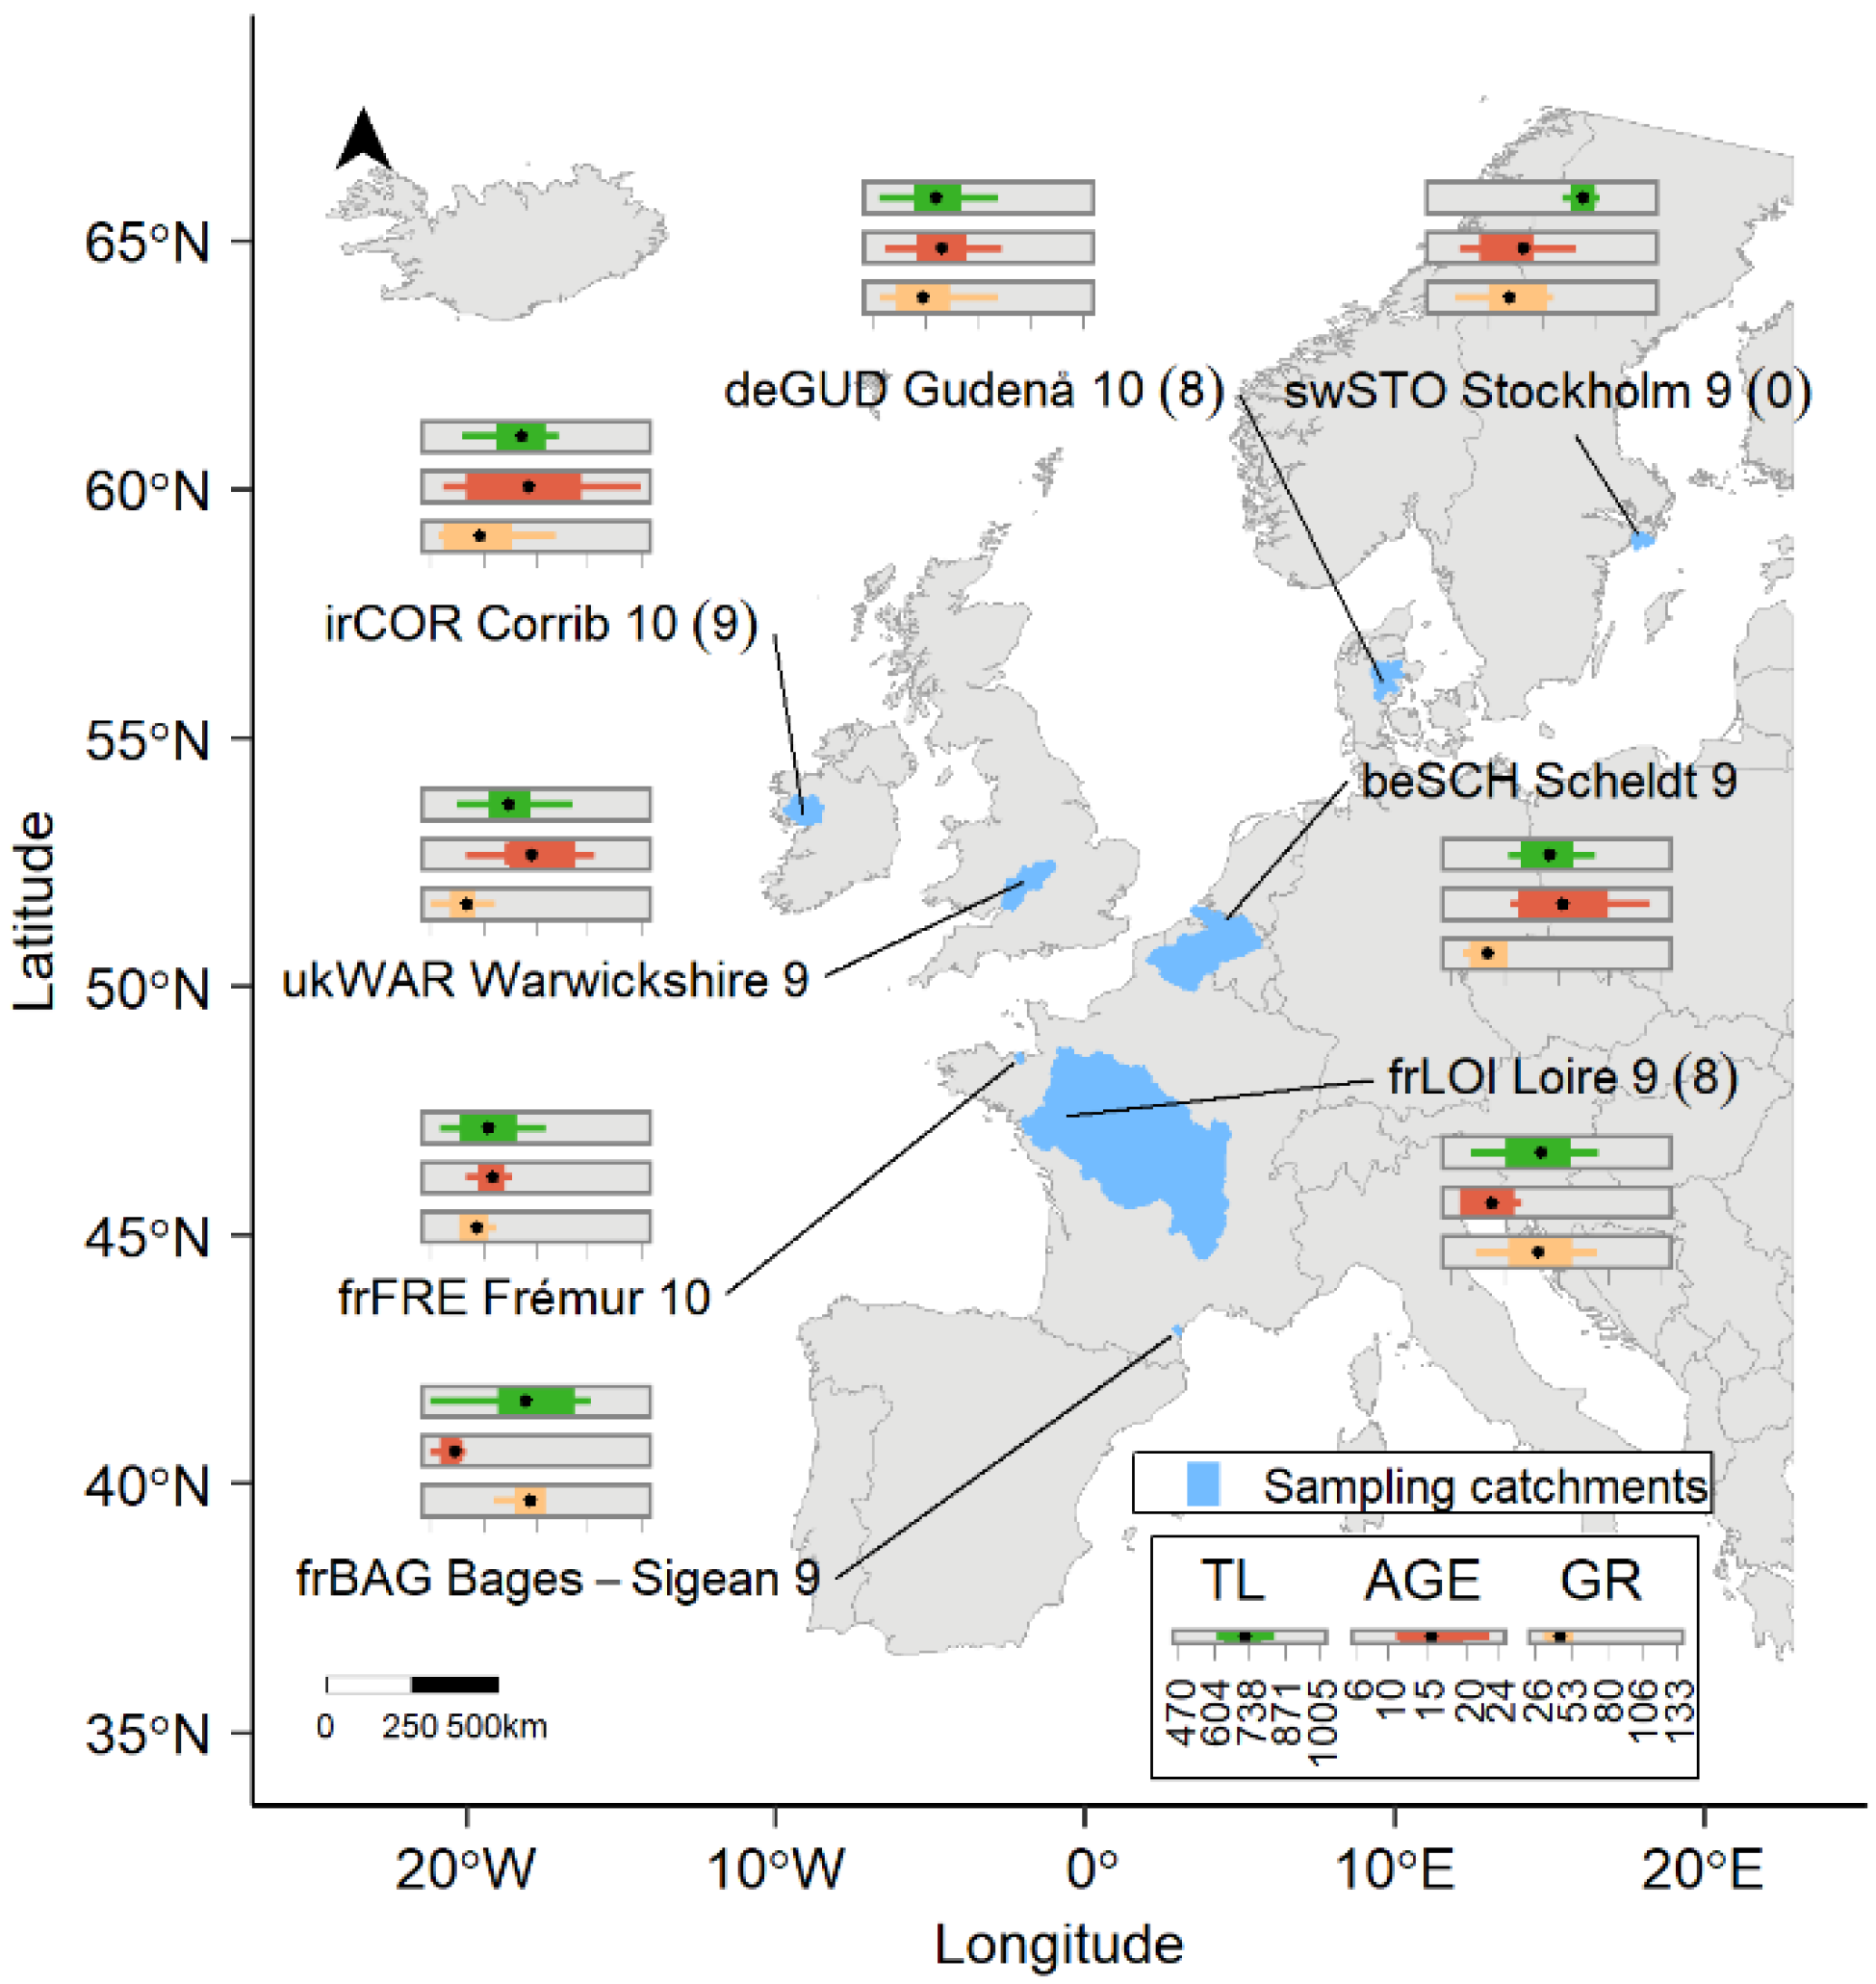
| ID | Country | Sampling Site | Latitude | Longitude | Area (km²) | Waterbody Type | Salinity | Sampling Gear | Sampling Date (m/d/y) |
|---|---|---|---|---|---|---|---|---|---|
| swSTO | Sweden | Stockholm archipelago | 58°57′30.82″ | 18°02′05.09″ | 467 | S | BW | A | 10/12/2009 |
| deGUD | Denmark | Gudenå | 55°58′01.31″ | 09°42′16.64″ | 2684 | R | FW | B | 11/12 to 12/14/2009 |
| irCOR | Ireland | Corrib | 53°16′32.05″ | 09°03′21.71″ | 3167 | Cr + L | FW | C | 11/16/2009 |
| ukWAR | U.K. | Warwickshire Avon | 52°10′00.46″ | 01°47′27.39″ | 4588 | R | FW | B | 11/05/2009 |
| beSCH | Belgium | Scheldt | 51°03′58.53″ | 04°23′19.97″ | 20,282 | R + Cp | FW | D + E | 10/19 to 10/27/2009 |
| frFRE | France | Frémur | 48°34′39.80″ | 02°06′13.1″ | 60 | Cr | FW | B | 01/19 to 03/01/2010 |
| frLOI | France | Loire | 47°22′59.80″ | 00°50′07.1″ | 116,962 | R | FW | F | 12/09 to 12/26/2009 |
| frBAG | France | Bages-Sigean | 43°03′39.61″ | 02°59′38.06″ | 411 | Lg | BW | D | 11/08 to 12/16/2009 |
| Traits Groups | Traits | Catchments | |||||||
|---|---|---|---|---|---|---|---|---|---|
| swSTO | deGUD | irCOR | ukWAR | beSCH | frFRE | frLOI | frBAG | ||
| n = 9 (0) | n = 10 (8) | n = 10 (9) | n = 9 | n = 9 | n = 10 | n = 9 (8) | n = 9 | ||
| Fecundity | TL | 843.6 (51.1) | 628.2 (91.4) | 700.9 (133.9) | 667.0 (94.5) | 719.1 (75.9) | 614.8 (88.4) | 698.3 (150.9) | 710.4 (137.5) |
| 754.0–929.0 | 486.0–787.0 | 482.0–970.0 | 538.0–833.0 | 616.0–837.0 | 495.0–763.0 | 522.0–1005.0 | 470.0–875.0 | ||
| TW | 1221.6 (167.4) | 488.0 (193.4) | 689.1 (401.9) | 575.6 (290.7) | 533.6 (169.0) | 437.0 (217.9) | 736.0 (686.0) | 712.4 (438.2) | |
| 1001.8–1541.2 | 222.0–849 | 174.0–1627.0 | 279.8–1204.3 | 343.2–924.7 | 208.9–929.2 | 195.0–2420.0 | 164.8–1381.7 | ||
| Adaptability and plasticity | GR | 62.7 (16.9) | 51.2 (19.4) | 50.6 (20.4) | 43.9 (13.5) | 44.3 (8.3) | 49.1 (9.4) | 69.6 (20.2) | 82.9 (22.5) |
| 36.1–86.1 | 30.0–89.4 | 30.4–89.7 | 26.3–69.1 | 32.0–54.3 | 40.9–69.8 | 38.1–99.6 | 57.9–133.2 | ||
| AGE | 13.4 (4.4) | 11.9 (3.0) | 14.4 (6.1) | 14.6 (3.8) | 15.4 (4.4) | 11.3 (1.3) | 9.4 (1.9) | 8.0 (1.8) | |
| 8.0–22.0 | 7.0–17.0 | 7.0–24.0 | 9.0–20.0 | 11.0–23.0 | 9.0–13.0 | 7.0–12.0 | 6.0–12.0 | ||
| K | 0.2 (0.02) | 0.2 (0.0) | 0.2 (0.0) | 0.2 (0.0) | 0.1 (0.0) | 0.2 (0.0) | 0.2 (0.0) | 0.2 (0.0) | |
| 0.2–0.2 | 0.2–0.2 | 0.2–0.2 | 0.2–0.2 | 0.1–0.2 | 0.2–0.2 | 0.1–0.2 | 0.1–0.2 | ||
| Migratory readiness | P11KT | - | 79.0 (24.3) | 203.8 (82.0) | 71.5 (46.7) | 74.7 (35.0) | 74.0 (38.3) | 218.2 (62.9) | 190.0 (130.0) |
| - | 47.0–114.1 | 82.6–318.0 | 13.1–157.4 | 16.1–123.5 | 20.3–157.4 | 157.6–364.7 | 46.6–353.6 | ||
| OI | 7.3 (0.8) | 9.0 (1.2) | 6.4 (1.2) | 9.1 (1.0) | 9.3 (2.2) | 10.0 (1.3) | 10.4 (1.5) | 11.1 (2.2) | |
| 6.4–8.2 | 7.1–10.9 | 5.2–8.9 | 7.9–10.4 | 6.1–12.6 | 8.2–12.4 | 8.6–12.7 | 6.1–13.8 | ||
| DTI | 1.7 (0.3) | 1.5 (0.4) | 1.0 (0.2) | 1.4 (0.4) | 2.0 (1.2) | 1.5 (0.5) | 1.4 (0.3) | 1.0 (0.2) | |
| 1.3–2.2 | 0.6–2.1 | 0.7–1.4 | 0.9–1.9 | 0.9–4.6 | 0.9–2.5 | 1.1–2.0 | 0.9–1.4 | ||
| Spawning potential | GSI | 1.7 (0.3) | 1.7 (0.2) | 2.0 (0.2) | 1.8 (0.2) | 1.5 (0.3) | 1.9 (0.2) | 1.7 (0.1) | 1.9 (0.2) |
| 1.4–2.1 | 1.4–2.0 | 1.6–2.4 | 1.6–2.0 | 1.1–2.1 | 1.7–2.2 | 1.4–1.9 | 1.4–2.1 | ||
| LIPIDS | 26.2 (4.0) | 17.8 (2.6) | 20.3 (2.6) | 25.2 (4.3) | 18.1 (5.8) | 16.3 (1.5) | 16.6 (2.8) | 16.5 (3.2) | |
| 20.2–31.8 | 13.3–21.7 | 16.7–24.6 | 19.0–31.1 | 12.5–28.6 | 14.0–19.3 | 11.1–21.0 | 12.5–22.4 | ||
| RP | 321.5 (78.1) | 84.0 (28.4) | 145.9 (103.3) | 148.2 (85.4) | 100.3 (59.3) | 70.8 (35.0) | 127.5 (129.7) | 119.3 (83.9) | |
| 241.0–490.1 | 48.0–122.4 | 29.1–400.2 | 60.7–338.1 | 55.2–234.8 | 31.6–151.7 | 26.9–445.9 | 36.9–257.6 | ||
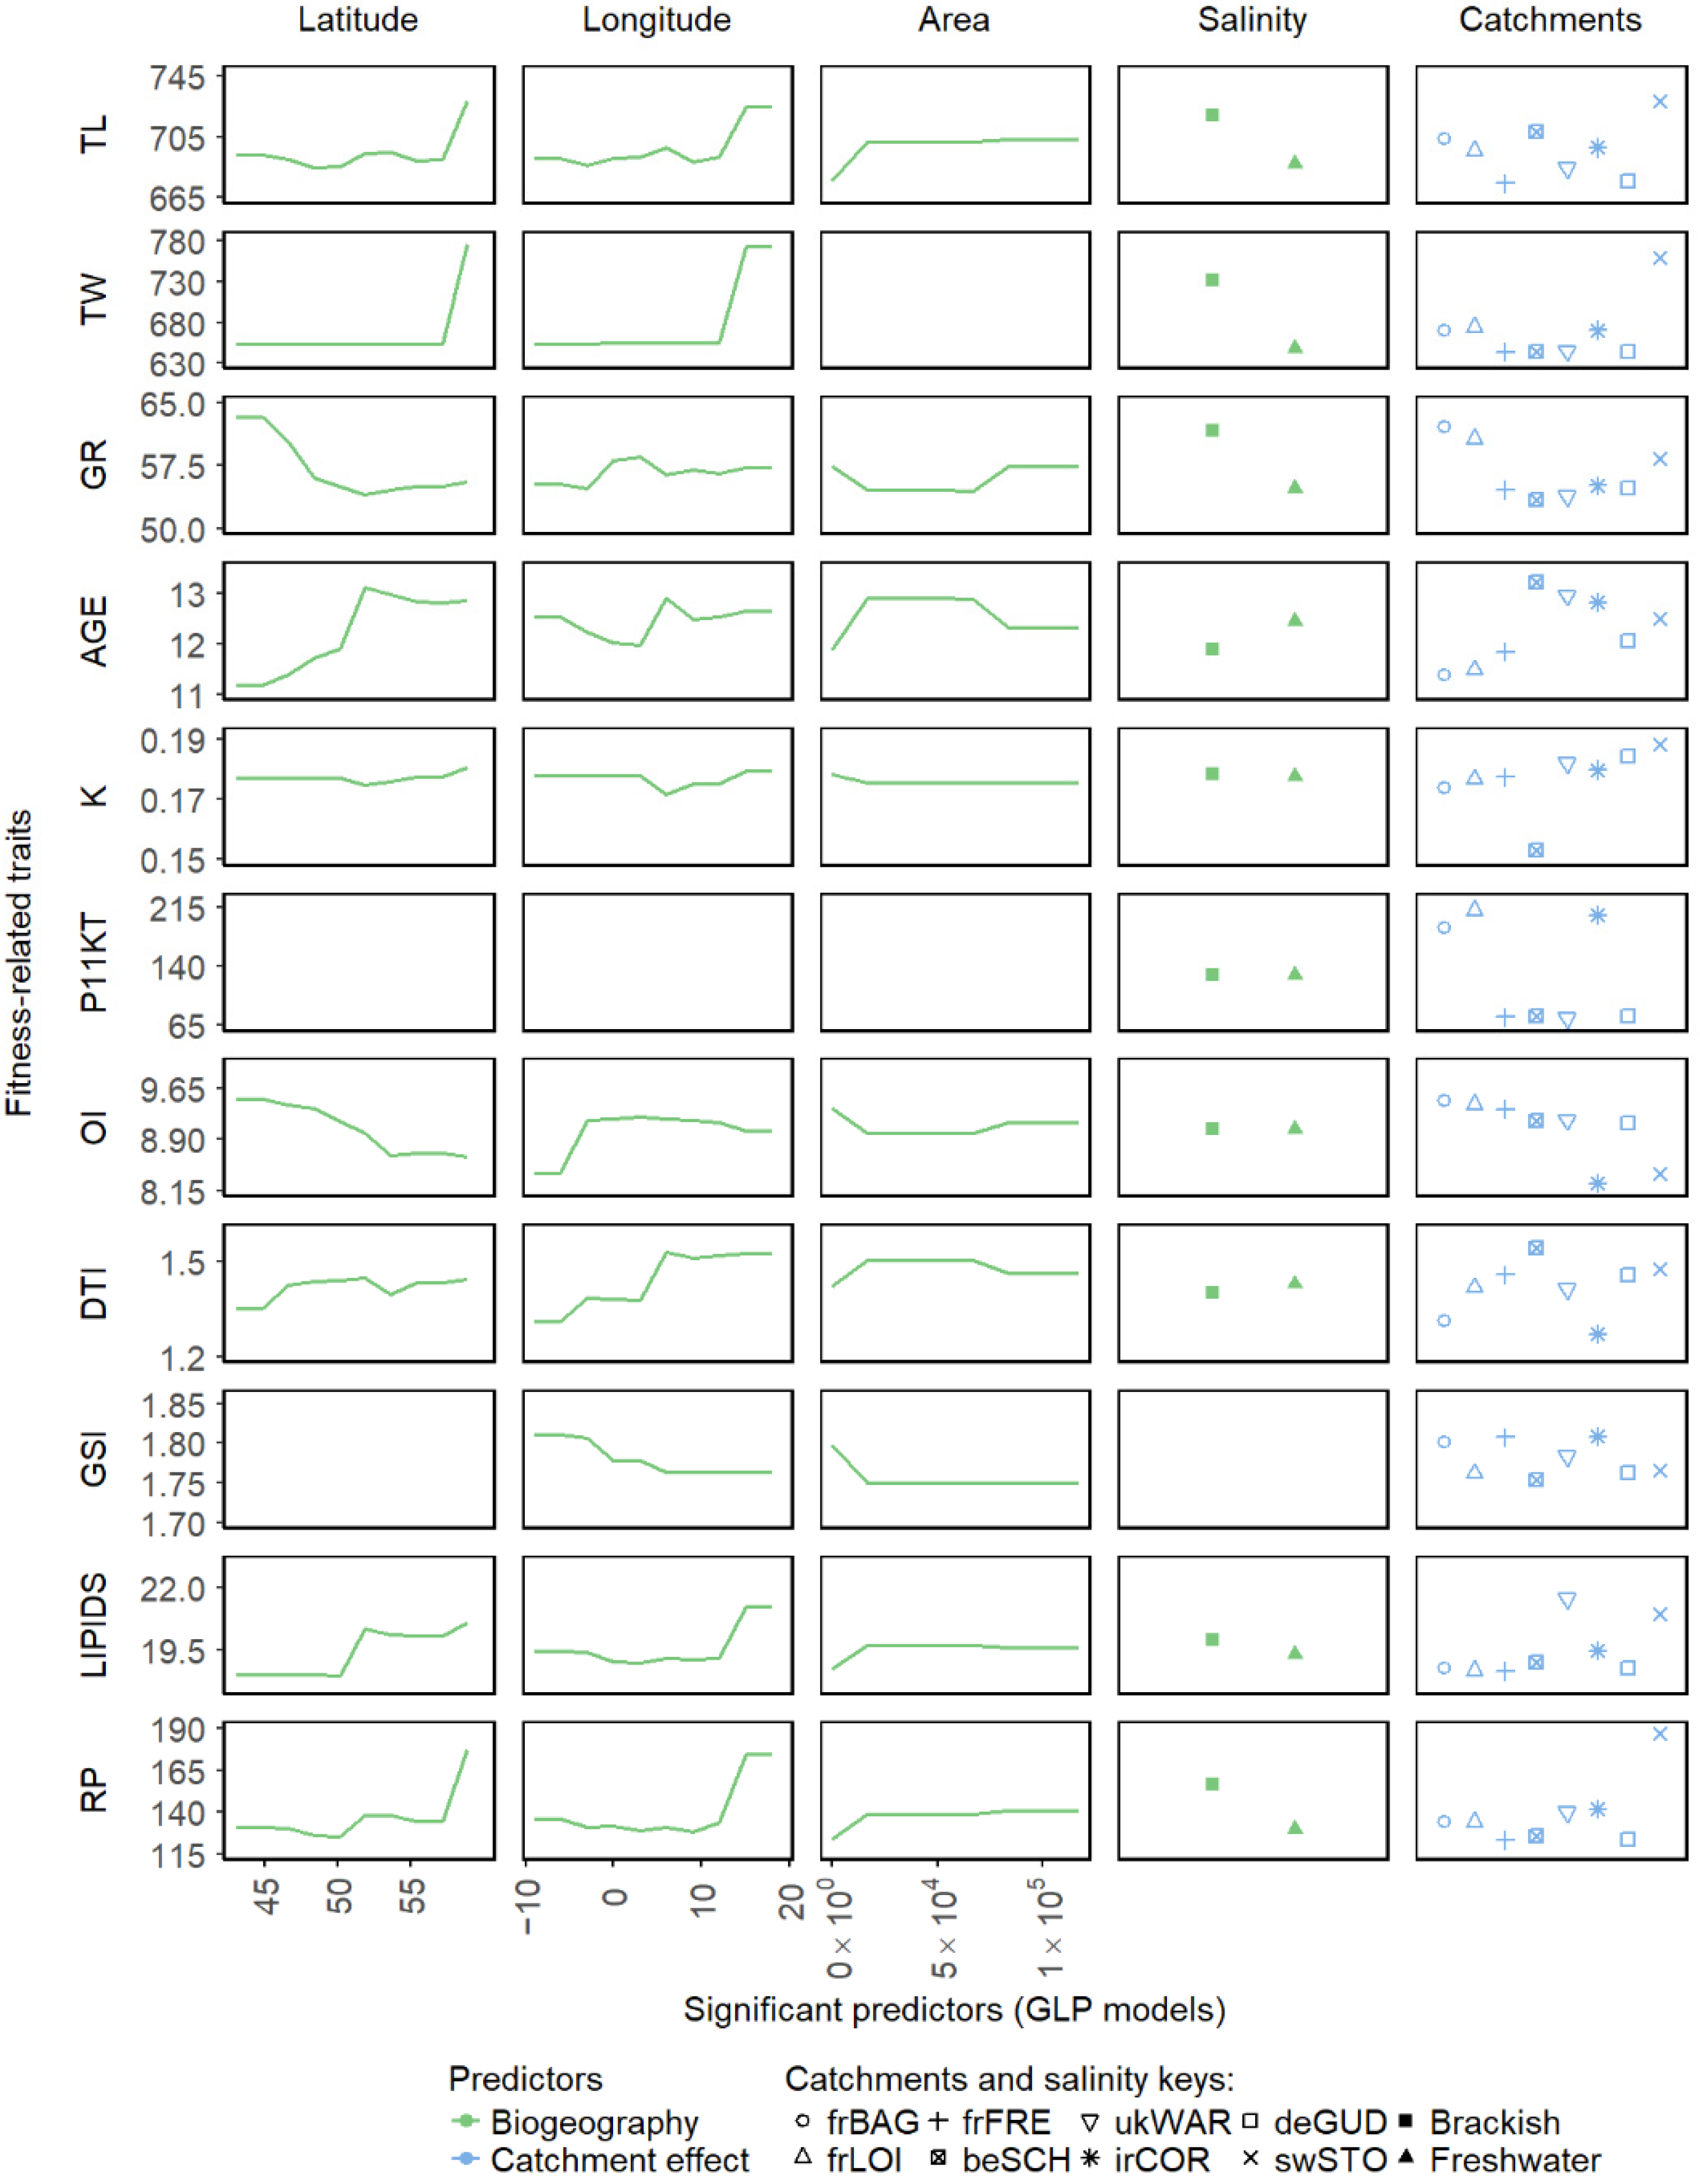
| Geographic Predictors (G) | Ca | Ratio (%) | ||||||
|---|---|---|---|---|---|---|---|---|
| Traits | Total | Area | Lat | Long | Sal | Total G | Ca/G | |
| TL | 13.9 | 1.9 ( ) ) | 3.5 () | 3.0 () | 2.3 ( ) ) | 10.7 | 3.2 | 23.0 |
| TW | 18.3 | 5.3 () | 5.3 () | 3.7 () | 14.3 | 4.0 | 21.9 | |
| GR | 24.8 | 3.5 () | 6.3 () | 3.2 () | 4.8 () | 17.9 | 7.0 | 28.1 |
| AGE | 23.1 | 4.0 () | 8.1 () | 4.4 () | 1.4 () | 17.9 | 5.2 | 22.5 |
| K | 30.0 | 1.2 () | 5.4 () | 6.7 () | 0.3 () | 13.6 | 16.4 | 54.7 |
| P11KT | 37.2 | 0.2 () | 0.2 | 36.9 | 99.5 | |||
| OI | 39.6 | 6.0 () | 8.7 () | 8.2 () | 3.2 () | 26 | 13.6 | 34.3 |
| DTI | 9.3 | 1.4 () | 2.3 () | 2.7 () | 0.7 () | 7.1 | 2.2 | 23.7 |
| GSI | 9.9 | 2.5 () | 3.3 () | 5.8 | 4.1 | 41.4 | ||
| LIPIDS | 42.4 | 5.4 () | 10.2 () | 9.3 () | 4.7 () | 29.7 | 12.7 | 30.0 |
| RP | 35.3 | 3.8 () | 8.6 () | 7.9 () | 5.5 () | 25.8 | 9.5 | 26.9 |
| Geographic Predictors (G) | Ca | Contamination Predictors (C) | Ratio (%) | ||||||||||||||||
|---|---|---|---|---|---|---|---|---|---|---|---|---|---|---|---|---|---|---|---|
| Trace Elements | Persistent Organic Pollutants | Total C | C/G | TEs/POPs | TE_Gon/TEs | ||||||||||||||
| Traits | Total | Area | Lat | Long | Sal | Total | TE_Gon | TE_Liv | TE_Musc | Total | DDTs | HCB | PCBs | Total | |||||
| TL | 39 | 0.7 () | 0.3 () | 1.0 | 2.6 | 32.0 | 3.5 | 35.0 | 35.0 | 97 | 100 | 90 | |||||||
| TW | 39 | 0.6 () | 2.7 () | 2.1 () | 0.6 () | 5.9 | 2.3 | 23.0 | 7.5 | 30.0 | 30.0 | 84 | 100 | 75 | |||||
| GR | 25 | 3.6 () | 0.9 () | 4.5 | 6.4 | 10.0 | 1.9 | 12.0 | 1.7 | 1.7 | 14.0 | 76 | 88 | 84 | |||||
| AGE | 24 | 5.8 () | 5.8 | 4.5 | 9.3 | 9.3.0 | 4.9 | 4.9 | 14.0 | 71 | 65 | 100 | |||||||
| K | 26 | 0.9 () | 0.9 () | 0.9 () | 2.7 | 3.1 | 4.1 | 2.7 | 6.4 | 13.0 | 1.1 | 1.3 | 4.4 | 6.9 | 20.0 | 88 | 66 | 31 | |
| P11KT | 34 | 1.8 () | 2.7 () | 1.0 () | 5.5 | 21 | 2.1 | 1.5 | 4.0 | 7.6 | 7.6 | 58 | 100 | 28 | |||||
| OI | 35 | 0.6 () | 6.7 () | 2.0 () | 9.3 | 16 | 2.3 | 6.0 | 8.3 | 1.2 | 1.2 | 9.5 | 51 | 88 | 0 | ||||
| DTI | 15 | 0 | 5.0 | 5.0 | 5.0 | 1.3 | 3.5 | 4.8 | 9.8 | 100 | 51 | 0 | |||||||
| GSI | 11 | 0.9 () | 1.0 () | 1.0 () | 3.0 | 3.0 | 1.3 | 4.0 | 5.3 | 5.3 | 64 | 100 | 25 | ||||||
| LIPIDS | 40 | 7.6 () | 0.9 () | 8.5 | 21 | 1.3 | 2.1 | 2.5 | 5.9 | 4.6 | 4.6 | 11.0 | 55 | 56 | 22 | ||||
| RP | 45 | 4.6 () | 5.9 () | 11.0 | 6.7 | 20.0 | 7.9 | 28.0 | 28.0 | 73 | 100 | 72 | |||||||
Publisher’s Note: MDPI stays neutral with regard to jurisdictional claims in published maps and institutional affiliations. |
© 2022 by the authors. Licensee MDPI, Basel, Switzerland. This article is an open access article distributed under the terms and conditions of the Creative Commons Attribution (CC BY) license (https://creativecommons.org/licenses/by/4.0/).
Share and Cite
Bourillon, B.; Feunteun, E.; Acou, A.; Trancart, T.; Teichert, N.; Belpaire, C.; Dufour, S.; Bustamante, P.; Aarestrup, K.; Walker, A.; et al. Anthropogenic Contaminants Shape the Fitness of the Endangered European Eel: A Machine Learning Approach. Fishes 2022, 7, 274. https://doi.org/10.3390/fishes7050274
Bourillon B, Feunteun E, Acou A, Trancart T, Teichert N, Belpaire C, Dufour S, Bustamante P, Aarestrup K, Walker A, et al. Anthropogenic Contaminants Shape the Fitness of the Endangered European Eel: A Machine Learning Approach. Fishes. 2022; 7(5):274. https://doi.org/10.3390/fishes7050274
Chicago/Turabian StyleBourillon, Bastien, Eric Feunteun, Anthony Acou, Thomas Trancart, Nils Teichert, Claude Belpaire, Sylvie Dufour, Paco Bustamante, Kim Aarestrup, Alan Walker, and et al. 2022. "Anthropogenic Contaminants Shape the Fitness of the Endangered European Eel: A Machine Learning Approach" Fishes 7, no. 5: 274. https://doi.org/10.3390/fishes7050274