1. Introduction
The analysis of length–weight relationships (LWRs) and condition factors are common tools in studies of fish biology, ecology, and physiology, and they have been extensively used in fishery research and management [
1,
2,
3,
4]. LWRs enable the picturing of a specific population, irrespective of individual variation giving an idea of the condition [
5] and fitness of the population [
4]. They are also essential for stock biomass assessment [
5,
6], studies on population dynamics, and fish stock assessment and monitoring [
7]. Furthermore, LWRs allow analyses of life histories, growth patterns, and comparative morphology of different fish species, or populations, from different habitats and/or regions and environmental conditions [
2]. In fact, estimates for the same species in different regions can be modified by environmental conditions or the developmental state of the fish [
5], becoming a tool to evaluate fish condition. Condition indices, such as Fulton’s condition factor (
Ki), LeCren’s relative condition factor (
Kn), and others, have been derived from LWR, and have been powerful instruments in fisheries science [
1,
4]. Thanks to these features, within the framework of long-term studies, we hypothesized that changes in the LWR slope and condition indices reflect changes of fish condition, the potential causes of which have their origin in alterations on the ecosystem and/or the ichthyologic community. Despite the usefulness of LWRs, their availability is incomplete and frequently limited to the most common and more studied fish species [
8]. Moreover, LWRs are rarely used as a dynamic concept, as if describing factors remain unaltered over time and are characteristic of an ecosystem. However, LWR variation could be a useful tool to evaluate the effects of ecosystem changes on a fish community. Therefore, a significant lack of knowledge of the ecological responses of fish communities to the intrinsic dynamics of restored ecosystems still exists, and research is necessary to better understand, model, and manage this kind of process.
LWRs and condition indices of exotic species are essential tools within management and fish community monitoring contexts, and they allow for the evaluation of the state of the populations. Nonetheless, there are no cases of using LWRs to evaluate and monitor fish communities within the context of a recently restored ecosystem during long-term monitoring. To fill these gaps and contribute to the science and management of exotic fish communities in these ecosystems, we investigated the status of fish communities in a restored shallow lake in the NE Iberian Peninsula by analyzing the variation of LWRs over time and their differences between seasons.
The Estany d’Ivars i Vila-sana is an endorreic ecosystem that was artificially dried in 1951 and converted to agricultural land. Restoration started in 2005, and the lake reached its current water level in 2008, using water from the Urgell irrigation channel (Canal d’Urgell). Due to the lack of hydrological connection with any river, natural recolonization was unexpected. However, the presence of introduced fishes was detected in 2007, just one and a half years after restoration. One year later, in 2008, monitoring of fish stocks began.
Here, we estimated the LWRs—in our case, the fork length (FL)—and an analysis of their variation, and four condition indices for four of the most common exotic species in the Estany d’Ivars i Vila-sana, a restored shallow lake in NE Iberian Peninsula. As part of a long-term monitoring program, this information could be useful for future management policies of these species and to evaluate and monitor the status of fish populations. Moreover, for the first time, we report information about the community of exotic fishes in a restored shallow lake as a result of a long-term monitoring and temporal variation of LWRs.
2. Results
Fish sampling led to the capture of 4619 individuals of nine different fish species. We only report the LWRs of pikeperch, roach, and common carp, since all other species were caught in low numbers (less than 100 individuals). Although only 21 individuals of bleak were captured, the LWR of this species was analyzed because of the interest in it as a common exotic species and the lack of data for lentic-introduced populations for this species. Furthermore, a new maximum total weight record was detected for bleak.
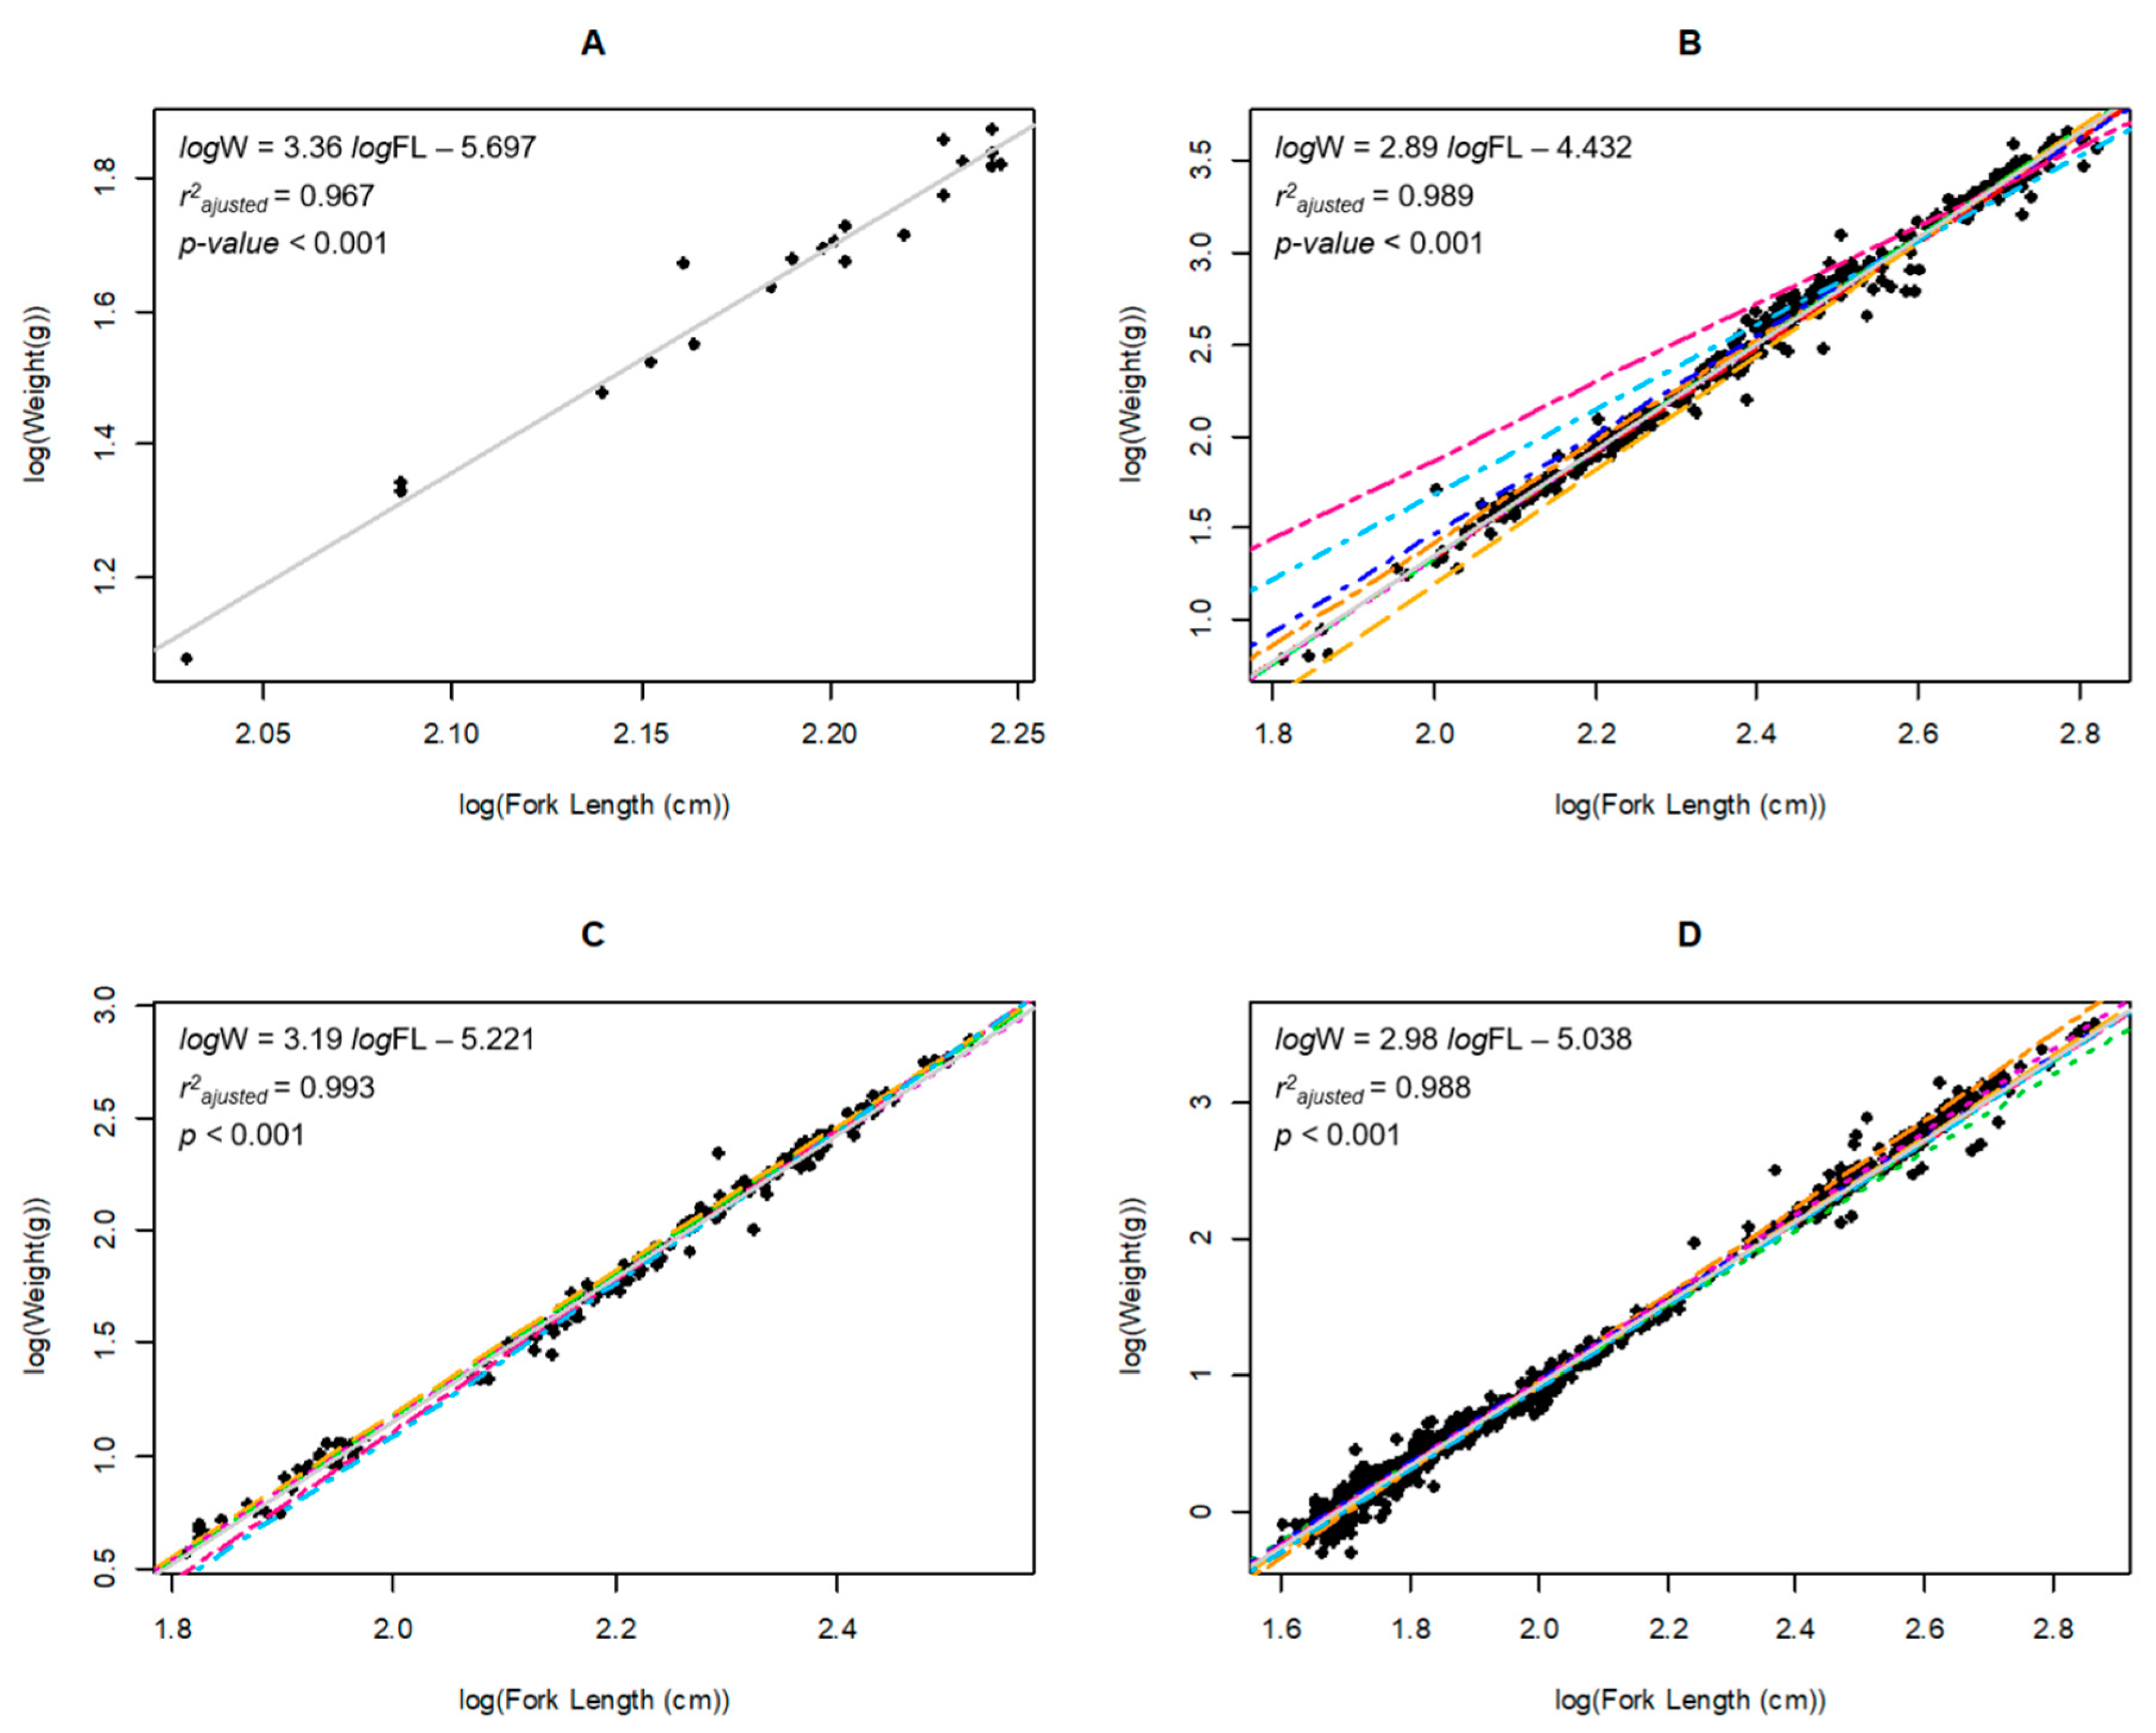
In total, 4557 fishes belonging to four species corresponding to two families (Cyprinidae and Percidae) were analyzed. All LWRs were highly significant (
p < 0.001) and had a high coefficient of determination (
r2 > 0.96) (
Table 1). In the four cases, the growth type was allometric (positive or negative), according to the confidence interval (
b CI
95%) (
Table 1). Factor condition was calculated by using the four indexes for the four species (
Table 2).
Analyses of covariances (ANCOVAs) revealed there were no significant annual differences in regression slopes for common carp (F
1, 405 = 0.094,
p = 0.759) or roach (F
1, 179 = 2.366,
p = 0.126) but significant differences for pikeperch (F
1, 3937 = 110.50,
p < 0.001). However, as expected, there were significant differences between the slopes for spring and summer fish (common carp: F
2, 405 = 5.042,
p = 0.0069; roach: F
1, 179 = 9.307,
p = 0.003; pikeperch: F
1, 3937 = 47.086,
p < 0.001) (
Figure 1). Young-of-the-year (YOY) individuals were removed from analyses because they are not expected to be fully affected by environmental conditions. In consequence, after removing YOY individuals, the ANCOVA results did not change meaningfully so that we could obtain significant annual differences for pikeperch (ANCOVA common carp: F
1, 376 = 0.745,
p = 0.389; roach: F
1, 136 = 0.752,
p = 0.387; pikeperch: F
1, 741 = 10.966,
p = 0.001).
In most of our cases, condition-factor data did not fit to normal distribution (p < 0.001), and they did not show homogeneity of variances (p < 0.001), so Welch’s tests were used to analyzed seasonal and annual differences on condition factors. In all cases, significant differences were detected (p < 0.001), so there are significant seasonal and annual differences. According to the post hoc test, condition factor was significantly worse at the end of the sampling period and in autumn. However, roach did not show seasonal differences.
3. Discussion
This study should help facilitate fishery biologists to derive weight estimates for un–weighed but measured fish and assist them in estimating the biomass of captured fish species. Moreover, our results could help to evaluate the variation of exotic fish communities and the effects of control programs and management policies on similar communities and ecosystems.
We consider our results to be adequate estimations of LWRs for all species, since a minimum of 100 organisms were used to estimate these parameters; this number is considered an adequate sample size [
9], except in the case of bleak, for which the results of might be considered with caution. Moreover, the
b values in all cases fell within the expected range of 2.5 <
b < 3.5 [
1] (
b ranged from 2.889 to 3.360) (
Table 1). Our results were compared with the FishBase database (
https://www.fishbase.se/search.php) as of September 2019 [
10]. In all cases,
b varied in the range of
b values for native populations (bleak: 2.700–3.430; common carp: 2.267–3.567; roach: 2.775–3.610; and pikeperch: 2.980–3.435) [
10], and regression parameters
a and
b for these four species were within the range of Bayesian LWR predictions [
3,
10].
Conceptually, our results can be considered to be mean annual values for the species in our study, because fish samples were obtained during spring/summer and autumn, throughout the sampling period (2008–2016). As a consequence, these results are neither representative of a particular season nor a measure of seasonal growth.
Fish of a large range of lengths were caught with multi-mesh gillnets, obtaining a representative sample of all ages (
Table 1). Still, it must be taken into consideration that the equations should be used with caution outside of the indicated length ranges.
According to FishBase [
10], a bleak individual captured in 2008 provided new global maxima for total weight (74.1 g;
Table 1). This new record might be considered with caution, because it could be registered within an optimal habitat for this alien species, from an ecosystem without significant predation pressures. In fact, this record belongs to a single individual captured in 2008, and only one more bleak was captured two years later. This record and the changes in fish community composition from the Estany d’Ivars i Vila-sana can be explained by a modification of physicochemical characteristics to suboptimal conditions characterized by seasonal variations with increment of water temperature (up to 28.5 °C in summer at 0.5–1 m depth) and a reduction of dissolved oxygen (down to 1.05 mg·L
−1 and 11.5% oxygen saturation at 1.5 m depth) in spring and early summer and a gradual but constant increment of predators such as pikeperch (authors, unpublished results).
Our results showed significant changes in LWR between early summer and autumn (early summer’s slope < autumn’s slope). These results are explained by the differences in food availability and environmental conditions. In fact, for pikeperch, roach, and common perch, b values were higher in autumn than in early summer. This is explained by LWR values that were determined by the availability of trophic resources and the feeding period during the summer season. In fact, factor condition analyses confirmed these differences between seasons and the consequences of winter food restrictions.
Apparently, environmental changes do not have a clear effect on fish conditions, since no significant annual differences were found in LWR slopes, according to the ANCOVA results (
p > 0.05 for common carp and roach), but in all cases, their condition factors showed a significant reduction in 2014 and 2016. For pikeperch, the most numerous species in the lake, significant annual differences (
p < 0.05) were found, and the lowest slopes happened in 2010 and 2011. During these years, a decrease in pikeperch catch-per-unit-effort (CPUE) and biomass-per-unit-effort (BPUE) was also detected (unpublished data). As it was expected, due to the fact that condition factors are highly correlated with LWR (except LWresid), a similar pattern was detecting by analyzing differences in factor condition indexes, showing, in general terms, a better condition in early stages (2008–2010) and worse conditions at the end of this study (2014 and 2016). This populational dynamic follows bust-and-boom populational dynamics [
11,
12] widely detected in other ichthyological communities of alien species. Although we did not obtain significant results for common carp, in 2010 and 2011, low slopes were detected, but the lowest slope took place in 2013. However, in this case, the lowest slopes were related to the highest CPUE and BPUE values. This is because captures in 2013 were limited to adults, the size range of which was from 440 to 664 mm. In fact, no juveniles were captured in 2013. In global terms, these results might be explained by a complex junction of unknown variations on lacustrine physicochemical conditions, as well as ecosystem and trophic interaction between species. After removing YOY individuals, ANCOVAs were repeated for all the species obtaining similar results.
According to the obtained results, this study provides a useful tool for the stakeholders involved in the management of the Estany d’Ivars i Vila-sana, novel information about the community of exotic fish in a restored shallow lake, and a contribution to the available LWRs for these exotic species, within the context of a Mediterranean restored shallow lake during a long-term period. These results encompass the effects and consequences of the ecological processes within an ecosystem where the ichthyologic community is being established and is evolving in concordance with the ecosystem conditions.
4. Materials and Methods
The Estany d’Ivars i Vila-sana is a shallow lake with an area of 131.3 ha, and mean and maximum depths of 1.9 and 3.8 m, respectively, in which the water temperature ranges from 3 to 5 °C in winter, and from 26 °C to 28 °C in summer [
13]. We sampled fish twice a year (spring/early summer and autumn) between 2008 and 2016 by using between three and five multi-mesh nylon gillnets that were 48 × 1.5 m in length and height, respectively, according to European standardized methods [
14]. Each gillnet consisted of a series of 16 panels (3 m width and 1.5 m height) of different mesh sizes, ranging from 6.25 to 135.00 mm bar length. All nets were set up simultaneously, in the late afternoon, at 0–2 m depth, and lifted the next morning, averaging a soak time of 12 h. All captured fish specimens were weighed to the nearest gram and identified at species level, and their FL was measured to the nearest millimeter. Captured specimens were weighed and measured immediately after being released from the gillnets at lakeside.
Nine different fish species were detected in the lake during the last nine years. Seven of those species are exotic in the Iberian Peninsula: bleak, Alburnus alburnus (Linnaeus, 1758); Carassius sp. (Linnaeus, 1758); common carp, Cyprinus carpio Linnaeus, 1758; roach, Rutilus rutilus (Linnaeus, 1758); pikeperch, Sander lucioperca (Linnaeus, 1758); rudd, Scardinius erythrophthalmus (Linnaeus, 1758); and Iberian gudgeon, Gobio lozanoi Doadrio and Madeira, 2004, which is allochthonous in the Ebro basin. Only two native species were caught: ebro barbel, Luciobarbus graellsii (Steindachner, 1866) and catalan chub, Squalius laietanus Doadrio, Kottelat, and Sostoa 2007.
The LWRs of the captured fish species were established by using a linear regression analysis based on the least squares method [
15]. LWRs are usually described through a potential function (
W =
a·
Lb) [
5,
16] that becomes linear after a logarithmic transformation of length–weight data. We thus represented LWRs as follows:
where
W is weight (g) and
L is fork length (cm). Parameter
a is the intercept, and parameter
b (slope) indicates the growth type (when
b = 3, then isometric growth; if
b ≠ 3, then allometric growth) [
1,
5,
16]. Parameters
a and
b were determined via least-squares linear regression [
15]. Before performing the regression analysis, we inspected length–weight and log–log plots, to detect and remove outliers [
1]. The 95% confidence interval for
b (95% CI) was computed by using the following equation:
where
SE is the standard error of
b, which was calculated to determine if the hypothetical value of isometry fell within these limits [
1]. The same process was used for
a. Additionally, the determination coefficient (adjusted
r2) was estimated.
4.1. Fish Condition
Fish condition has been calculated by using four different condition metrics. First, Fulton’s condition factor (
Ki) that assumes isometric growth, son
b is 3, where the shape of the fish does not change with increasing length [
17], and it was calculated for an individual fish by using the following formula [
18]:
where
Li and
Wi are the observed length (fork length in mm) and (weight in g) for the
ith fish, and the constant is a scaling factor equal to 100,000 if metric units. However, most of populations of fish do not exhibit isometric growth [
1], so
Ki depends on the length of the fish [
17] and is specific for a population under determined conditions. Thus, comparisons of Fulton’s condition factor are restricted to fish of similar lengths within the population [
17,
18,
19]. Fulton’s condition factor is seldom used in modern studies because of this limitation.
Then, a modification of
Ki was calculated (
Km) according to the following formula [
20,
21] and using the exponent
b derived from the length–weight relationship for each species (
Table 1), described by formula:
We have also used residuals from the weight–length relationship to measure fish conditions [
18,
19], and they were calculated as the difference between the observed log weight and the expected log weight, according to (log) weight–length regression.
The LeCren’s relative condition factor (
Kni) [
5] for the
ith fish was calculated as follows [
18]:
where
Wi is the observed weight (in g) and
Wpred is the predicted mean weight, given the fish’s observed length for the population of fish under investigation [
22]. In consequence, the value of
Kni does not depend on length within the population being investigated [
23].
4.2. Statistics
To analyze the variation of the LWR for each species, we conducted ANCOVAs, looking for significant differences in slopes by comparing the slopes of annual and seasonal LWRs. Thus, year or season was included as a factor, log-transformed fork length (logFL) as a covariate, and log-transformed weight (logW) as a dependent variable in theses ANCOVAs. Morphology underlies interactions with other organisms, conspecific individuals, and the environment. However, as YOY individuals (0+ or age 0 individuals) are not expected to have total morphological expression of environmental factors, but, at the same time, due to the huge number of captured individuals, they were removed, to avoid the bias they can cause, and the analyses of covariance were repeated. ANCOVA could not be performed for bleak, because only 21 individuals were captured (
Table 1)—20 of them in 2008.
Analysis of variance and Tukey’s post hoc tests were used to analyze annual and seasonal differences on condition factor. All data were tested for homogeneity of variance by the Levene test and for normality by the Shapiro test. If conditions for ANOVA were not fulfilled, the Welch’s test was used.
Finally, the standard lengths and total weights observed were compared with the information provided by FishBase [
10]. All statistical analyses were carried out by using R version 3.5.1 [
24], except when specified otherwise.
Sampling events have been authorized by the Department of Territory and Sustainability of the Government of Catalonia. Annual special authorizations for scientific captures are available, if required. The approval of an ethics committee is not compulsory in Spain.
Author Contributions
Conceptualization, F.C.; methodology, J.R.S.-G. and F.C.; validation, F.C., A.A. and J.R.S.-G.; formal analysis, A.A. and J.R.S.-G.; investigation, J.R.S.-G. and F.C.; data curation, A.A.; writing—Original draft preparation, J.R.S.-G.; writing—Review and editing, F.C., A.A. and J.R.S.-G.; supervision, F.C.; project administration, F.C.; funding acquisition, F.C. All authors have read and agreed to the published version of the manuscript.
Funding
This research received no external funding.
Acknowledgments
We want to thank Nuno Caiola, Claudi Gallardo, David Margalejo, Eduardo Montejano, Anna Ñaco, Daniel Roque, and David Sebastià for field assistance. This research was partially funded by the Consorci de l’Estany d’Ivars i Vila-sana and the Fundació Catalunya La Pedrera and supported by the Government of Catalonia (CERCA Programme).
Conflicts of Interest
The authors declare no conflicts of interest. The funders had no role in the design of the study; in the collection, analyses, or interpretation of data; in the writing of the manuscript; or in the decision to publish the results.
References
- Froese, R. Cube law, condition factor and weight-length relationships: History, meta-analysis and recommendations. J. Appl. Ichthyol. 2006, 22, 241–253. [Google Scholar] [CrossRef]
- Vicentin, W.; dos Costa, F.E.S.; Súarez, Y.R. Length-weight relationships and length at first maturity for fish species in the upper Miranda River, southern Pantanal wetland, Brazil. J. Appl. Ichthyol. 2012, 28, 143–145. [Google Scholar] [CrossRef]
- Froese, R.; Thorson, J.T.; Reyes, R.B. A Bayesian approach for estimating length-weight relationships in fishes. J. Appl. Ichthyol. 2014, 30, 78–85. [Google Scholar] [CrossRef] [Green Version]
- Verreycken, H.; Van Thuyne, G.; Belpaire, C. Length-weight relationships of 40 freshwater fish species from two decades of monitoring in Flanders (Belgium). J. Appl. Ichthyol. 2011, 27, 1416–1421. [Google Scholar] [CrossRef]
- LeCren, E.D. The Length-Weight Relationship and Seasonal Cycle in Gonad Weight and Condition in the Perch (Perca fluviatilis). J. Anim. Ecol. 1951, 20, 201–219. [Google Scholar]
- Wennhage, H.; Pihl, L. Fish feeding guilds in shallow rocky and soft bottom areas on the Swedish west coast. J. Fish Biol. 2002, 61, 207–228. [Google Scholar] [CrossRef]
- Froese, R.; Pauly, D. FishBase 2000: Concepts, Designs and Data Source. WorldFish; ICLARM: Los Baños, Laguna, Philippines, 2000; ISBN 971-971-8709-99-1. [Google Scholar]
- Teixeira, E.C.; Silva, V.E.L.; Fabré, N.N.; Batista, V.S. Length-weight relationships for four stingray species from the tropical Atlantic Ocean. J. Appl. Ichthyol. 2017, 33, 594–596. [Google Scholar] [CrossRef]
- Aguirre, H.; Amezcua, F.; Madrid-Vera, J.; Soto, C. Length-weight relationship for 21 fish species from a coastal lagoon in the southwestern Gulf of California. J. Appl. Ichthyol. 2008, 24, 91–92. [Google Scholar] [CrossRef]
- FishBase. World Wide Web Electronic Publication. Available online: www.fishbase.org (accessed on 11 September 2019).
- Simberloff, D.; Gibbons, L. Now you see them, now you don’t!—Population crashes of established introduced species. Biol. Invasions 2004, 6, 161–172. [Google Scholar] [CrossRef]
- Strayer, D.L.; D’Antonio, C.M.; Essl, F.; Fowler, M.S.; Geist, J.; Hilt, S.; Jarić, I.; Jöhnk, K.; Jones, C.G.; Lambin, X.; et al. Boom-bust dynamics in biological invasions: Towards an improved application of the concept. Ecol. Lett. 2017, 20, 1337–1350. [Google Scholar] [CrossRef] [PubMed]
- Alonso, M.; Palau, A.; Pedrocchi, V.; Pau, R.; Palau-Nadal, A. Islas de Agua en Tierras de Sed: Lagos Esteparios; Endesa.: Madrid, Spain, 2015; p. 107. [Google Scholar]
- European Committee for Standardization. European Standard EN 14 757, Water Quality—Sampling of Fish with Multimesh Gillnets; European Committee for Standardization: Brussels, Belgium, 2005; p. 34. [Google Scholar]
- Dobson, A.J. Introduction to Generalized Linear Models, 2nd ed.; Chapman & Hall/CRC: New York, NY, USA, 2000; ISBN 1584881704. [Google Scholar]
- Ricker, W.E. Linear regressions in fisheries research. J. Fish. Res. Board Can. 1973, 30, 409–434. [Google Scholar] [CrossRef]
- Lloret, J.; Shulman, G.; Love, R.M. Condition and Health Indicators of Exploited Marine Fishes; Wiley Blackwell: West Sussex, UK, 2014; ISBN 047067024X. [Google Scholar]
- Ogle, D.H. Introductory Fisheries Analysis with R; CRC Press, Taylor & Francis Group, Chapman & Hall Book: Boca Raton, FL, USA, 2015; ISBN 148223520X. [Google Scholar]
- Pope, K.L.; Kruse, C.G. Condition. In Analysis and Interpretation of Freshwater Fisheries Data; Guy, C.S., Brown, M.L., Eds.; American Fisheries Society: Bethesda, MD, USA, 2007; p. 423. [Google Scholar]
- Bagenal, T.B.; Tesch, F.W. Age and growth. In Methods for Assessment of Fish Production in Freshwater; Bagenal, T.B., Ed.; Blackwell Scientific Publication: Oxford, UK, 1978; pp. 101–136. [Google Scholar]
- Nielsen, L.A.; Johnson, D.L. Fisheries Techniques; American Fisheries Society: Bethesda, MD, USA, 1983. [Google Scholar]
- Blackwell, B.G.; Brown, M.L.; Willis, D.W. Relative weight (Wr) status and current use in fisheries assessment and management. Rev. Fish. Sci. 2000, 8, 1–44. [Google Scholar] [CrossRef]
- Neumann, R.M.; Guy, C.S.; Willis, D.W. Length, weight, and associated indices. In Fisheries Techniques; Zale, A.V., Parrish, D.L., Sutton, T.M., Eds.; American Fisheries Society: Bethesda, MD, USA, 2012; pp. 637–676. [Google Scholar]
- R Development Core Team. R: A Language and Environment for Statistical Computing. R version 3.6.1.—“Action of the Toes”. 2019. Available online: https://www.r-project.org/ (accessed on 7 August 2019).
© 2020 by the authors. Licensee MDPI, Basel, Switzerland. This article is an open access article distributed under the terms and conditions of the Creative Commons Attribution (CC BY) license (http://creativecommons.org/licenses/by/4.0/).


