Article

Improved Growth Estimates for Lethrinus harak: Measuring Increments, Adjusting Ages, and Fitting Flexible Growth Models

1
Department of Oceanography and Coastal Sciences, Louisiana State University, Baton Rouge, LA 70803, USA
2
National Oceanic and Atmospheric Administration, Southeast Fisheries Science Center, Beaufort, NC 28516, USA
3
Sea Sense, 324/D Msasani Village, Dar es Salaam, Tanzania
*
Author to whom correspondence should be addressed.
Fishes 2018, 3(3), 31; https://doi.org/10.3390/fishes3030031
Submission received: 15 June 2018 / Revised: 23 July 2018 / Accepted: 1 August 2018 / Published: 14 August 2018

Abstract

:
Thumbprint emperor (Lethrinus harak) are a widely distributed, tropical species ranging throughout the Indo-Pacific region. In coastal Tanzania, overfishing is likely occurring and thumbprint emperor are commonly represented in catches. The goal of this study was to estimate age and growth to provide basic life history information that may help inform future management. We sampled a total of n = 55 thumbprint emperors from both fishery-dependent and fishery-independent sources. Annular age estimates were improved with measurements of otolith markings. Fish ages ranged from zero to five years. We also evaluated the addition of otolith edge size (a proxy for fractional age) to age estimation, and fit two von Bertalanffy growth models—one for the whole ages and one for the fractional ages—using a flexible Bayesian framework. Growth parameters were similar between the two models, and ultimately, L (maximum asymptotic size parameter) estimates were comparable to other published values for the species, although our estimates of K (growth coefficient parameter) were smaller. Robust aging techniques for tropical fishes can provide a foundation for basic fishery management, which would help to sustain the future of this widely distributed fish.

1. Introduction

Coastal fisheries in Tanzania, East Africa are primarily artisanal, but still harvest a large amount of fish from near-shore populations. Few recent studies have been able to characterize fish catches from non-industrial fish activities [1]; however, overfishing is likely taking place [2]. In addition to destructive fishing practices, such as dynamite fishing, the recent widespread use of mosquito nets for fishing [3] suggests a targeting of both smaller and juvenile fishes which could lead to overfishing. Given the high exploitation rates of nearshore fishes and the lack of resource management infrastructure, any management of fish needs to begin with basic biological and life history data, which can be used to guide sustainable resource use [4].
The thumbprint emperor (Lethrinus harak) is a common marine species across the Indo-Pacific region occupying a range of habitats, including mangroves, seagrasses, and reefs. Lethrinids constitute an economically important marine fish throughout their range [5], and L. harak is considered one of the most abundant species in the genus. In addition to economic importance, coastal Tanzanian fishing communities rely on fish as a primary source of protein [6], and sustained harvest of common species also lessens the pressure on rare species. Although abundance and fishing pressure have not been measured for this species, relatively high abundance and relatively high harvest underscore the need to understand the species life history and factors driving growth.
Several studies have investigated different aspects of L. harak life history and biology throughout its range. Age, growth, reproduction, and diet have been investigated in Fiji [7]; age, growth, and maturity have been investigated in the Ryukyu Islands, Japan [8]; and spatial dynamics (e.g., home range) have been investigated in Okinawa, Japan [9]. To date, the most complete investigation into L. harak has taken place in Saipan, where extensive life history analyses have been developed into stock status [10]. Only one study [11] of L. harak has been reported in East Africa, focusing on patterns of maturity. Several other studies through the species range have studied life history. In particular, many studies have looked at reproductive biology and concluded that size at maturity for females is typically 20–25 cm, with the largest gonadosomatic indices (GSIs) reported in later summer [7,10,12,13]. Given the wide range over which this species is distributed, it is reasonable that basic biology may be regionally-specific, or at least responding to changes in factors such as temperature and fishing pressure. Ultimately, efforts toward local management goals need to be informed by local life histories [10].
Our objective was to sample for basic biological information, specifically to describe the age and growth relationship of L. harak in coastal Tanzania. The regionally-variable biology of this species suggests that assumptions from distant populations may be inaccurate and potentially misleading if used to develop any regulations. Furthermore, in the absence of any species management, information on growth is among the most important biological information that can be collected [14]. Growth is a basic function that integrates genetics with input from the environment, and it is related to other important life history parameters, such as natural mortality and reproduction.

2. Results

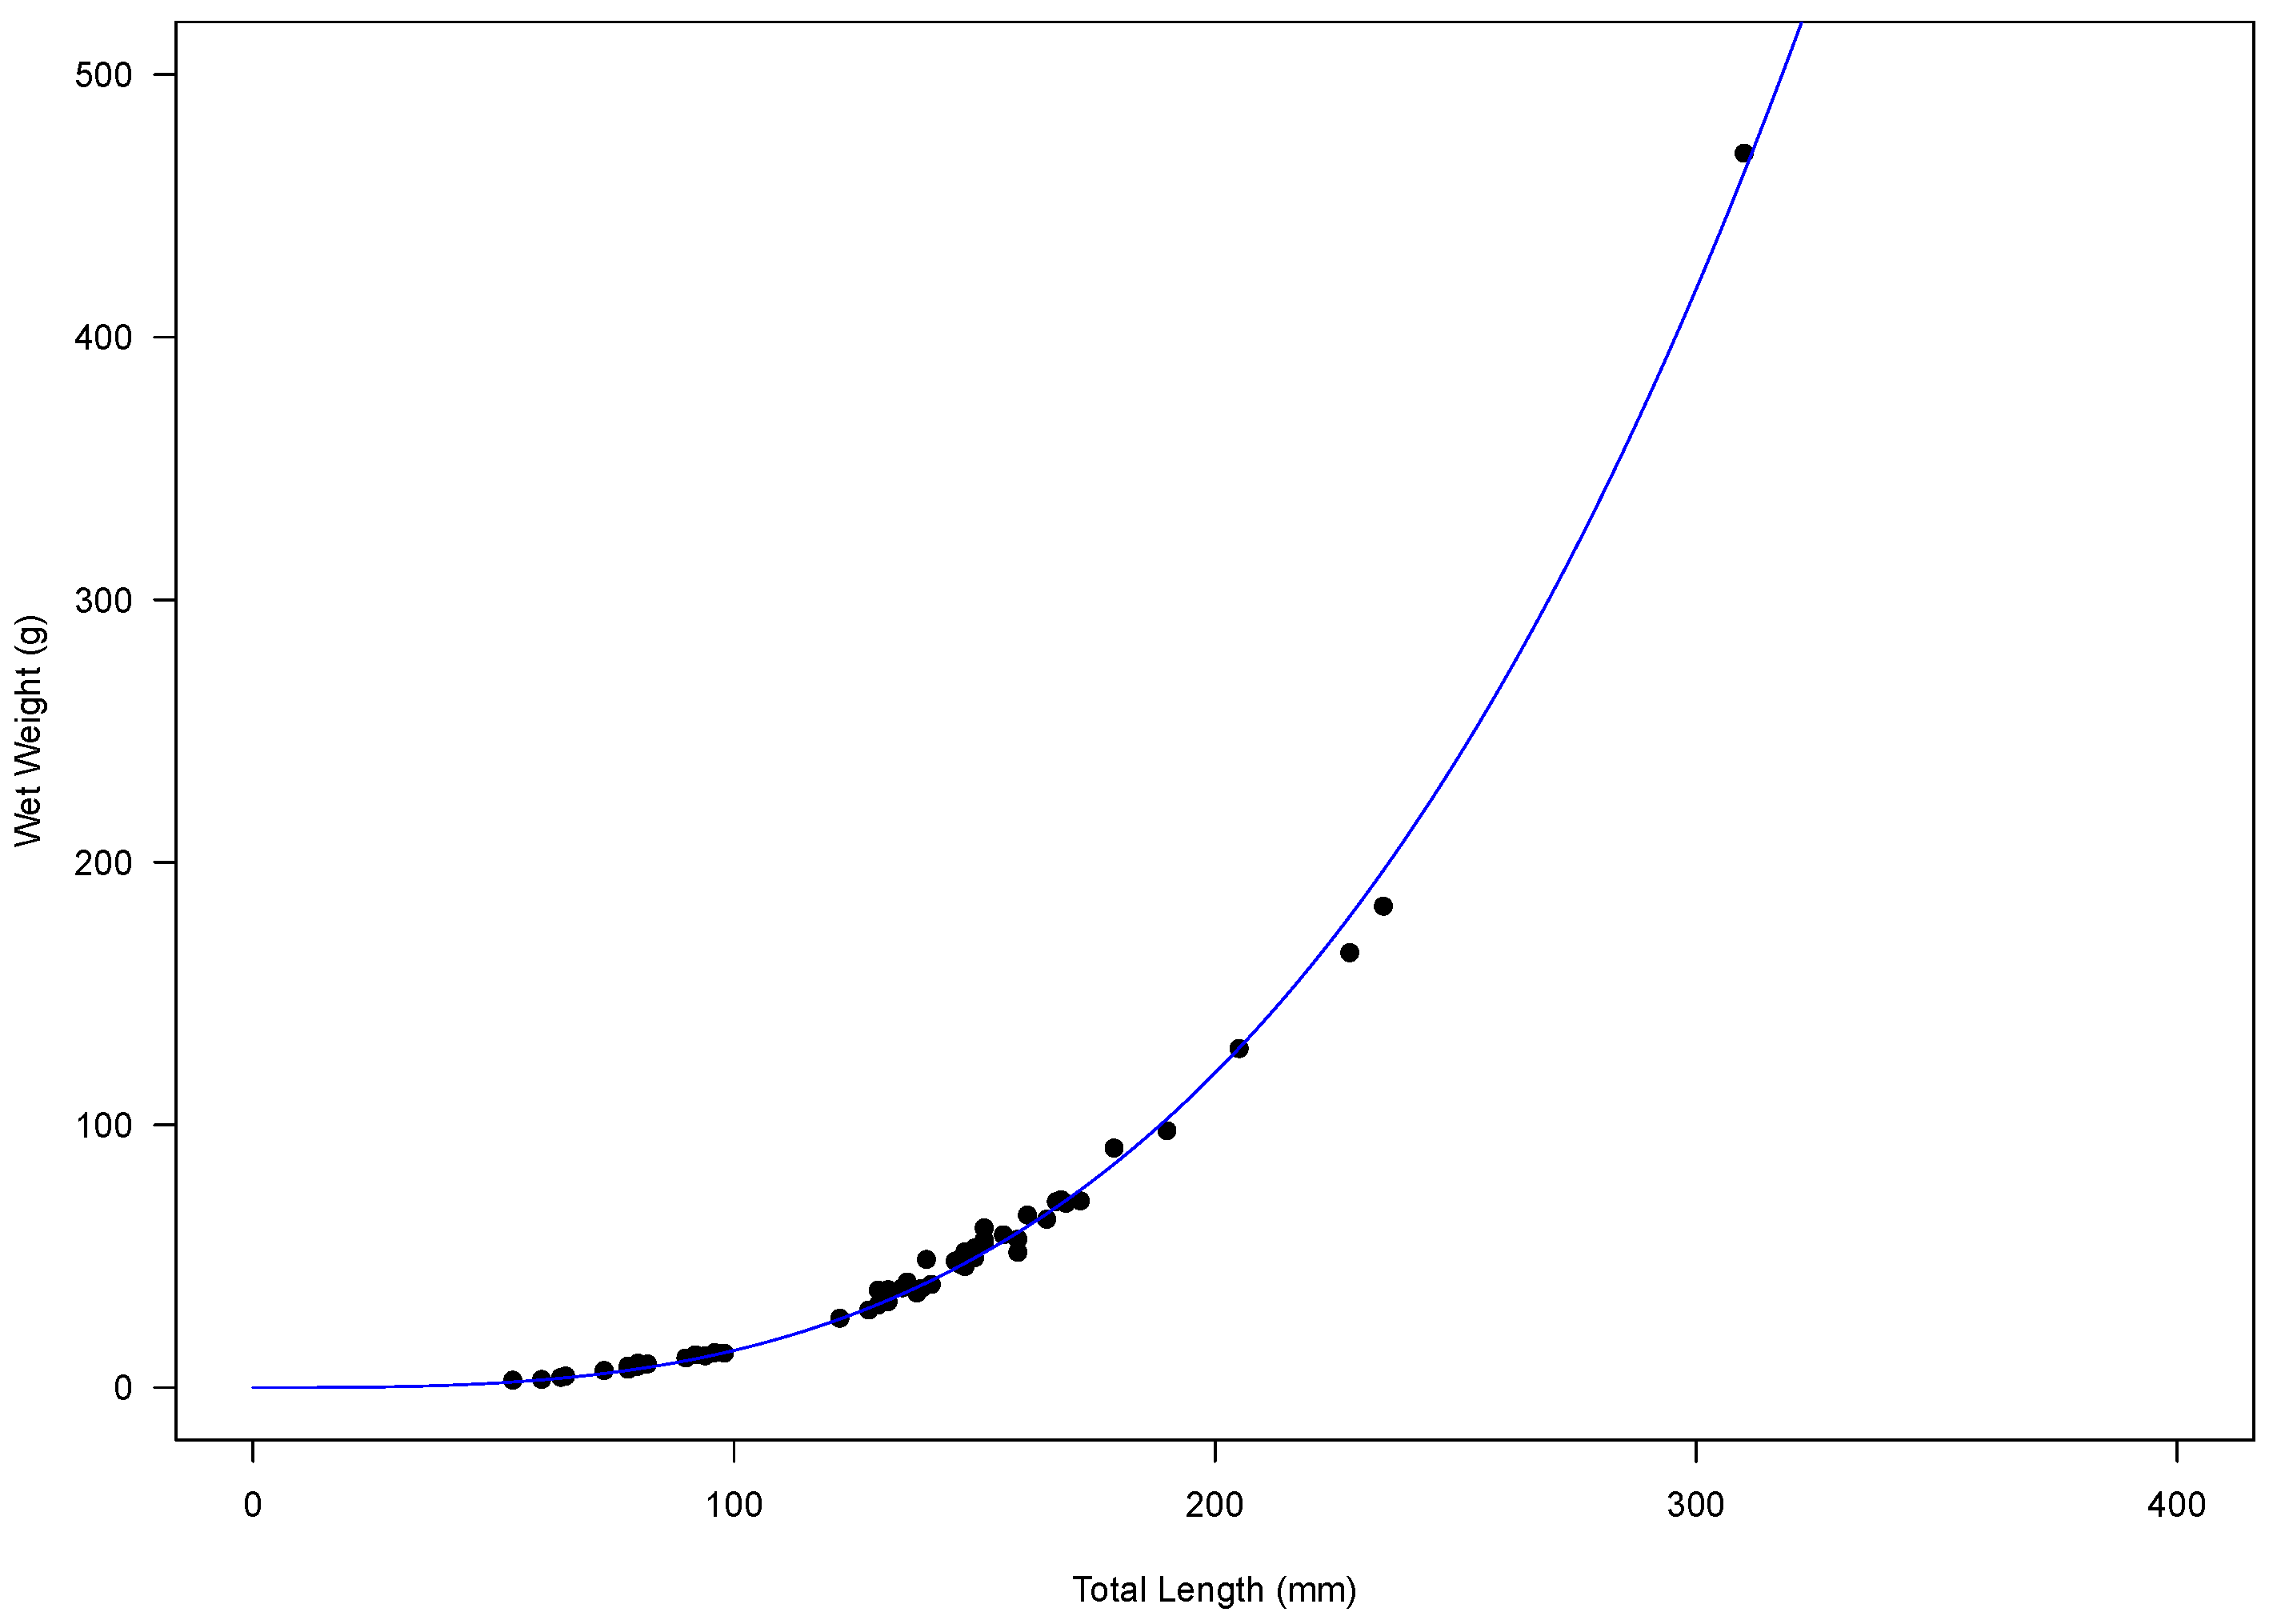
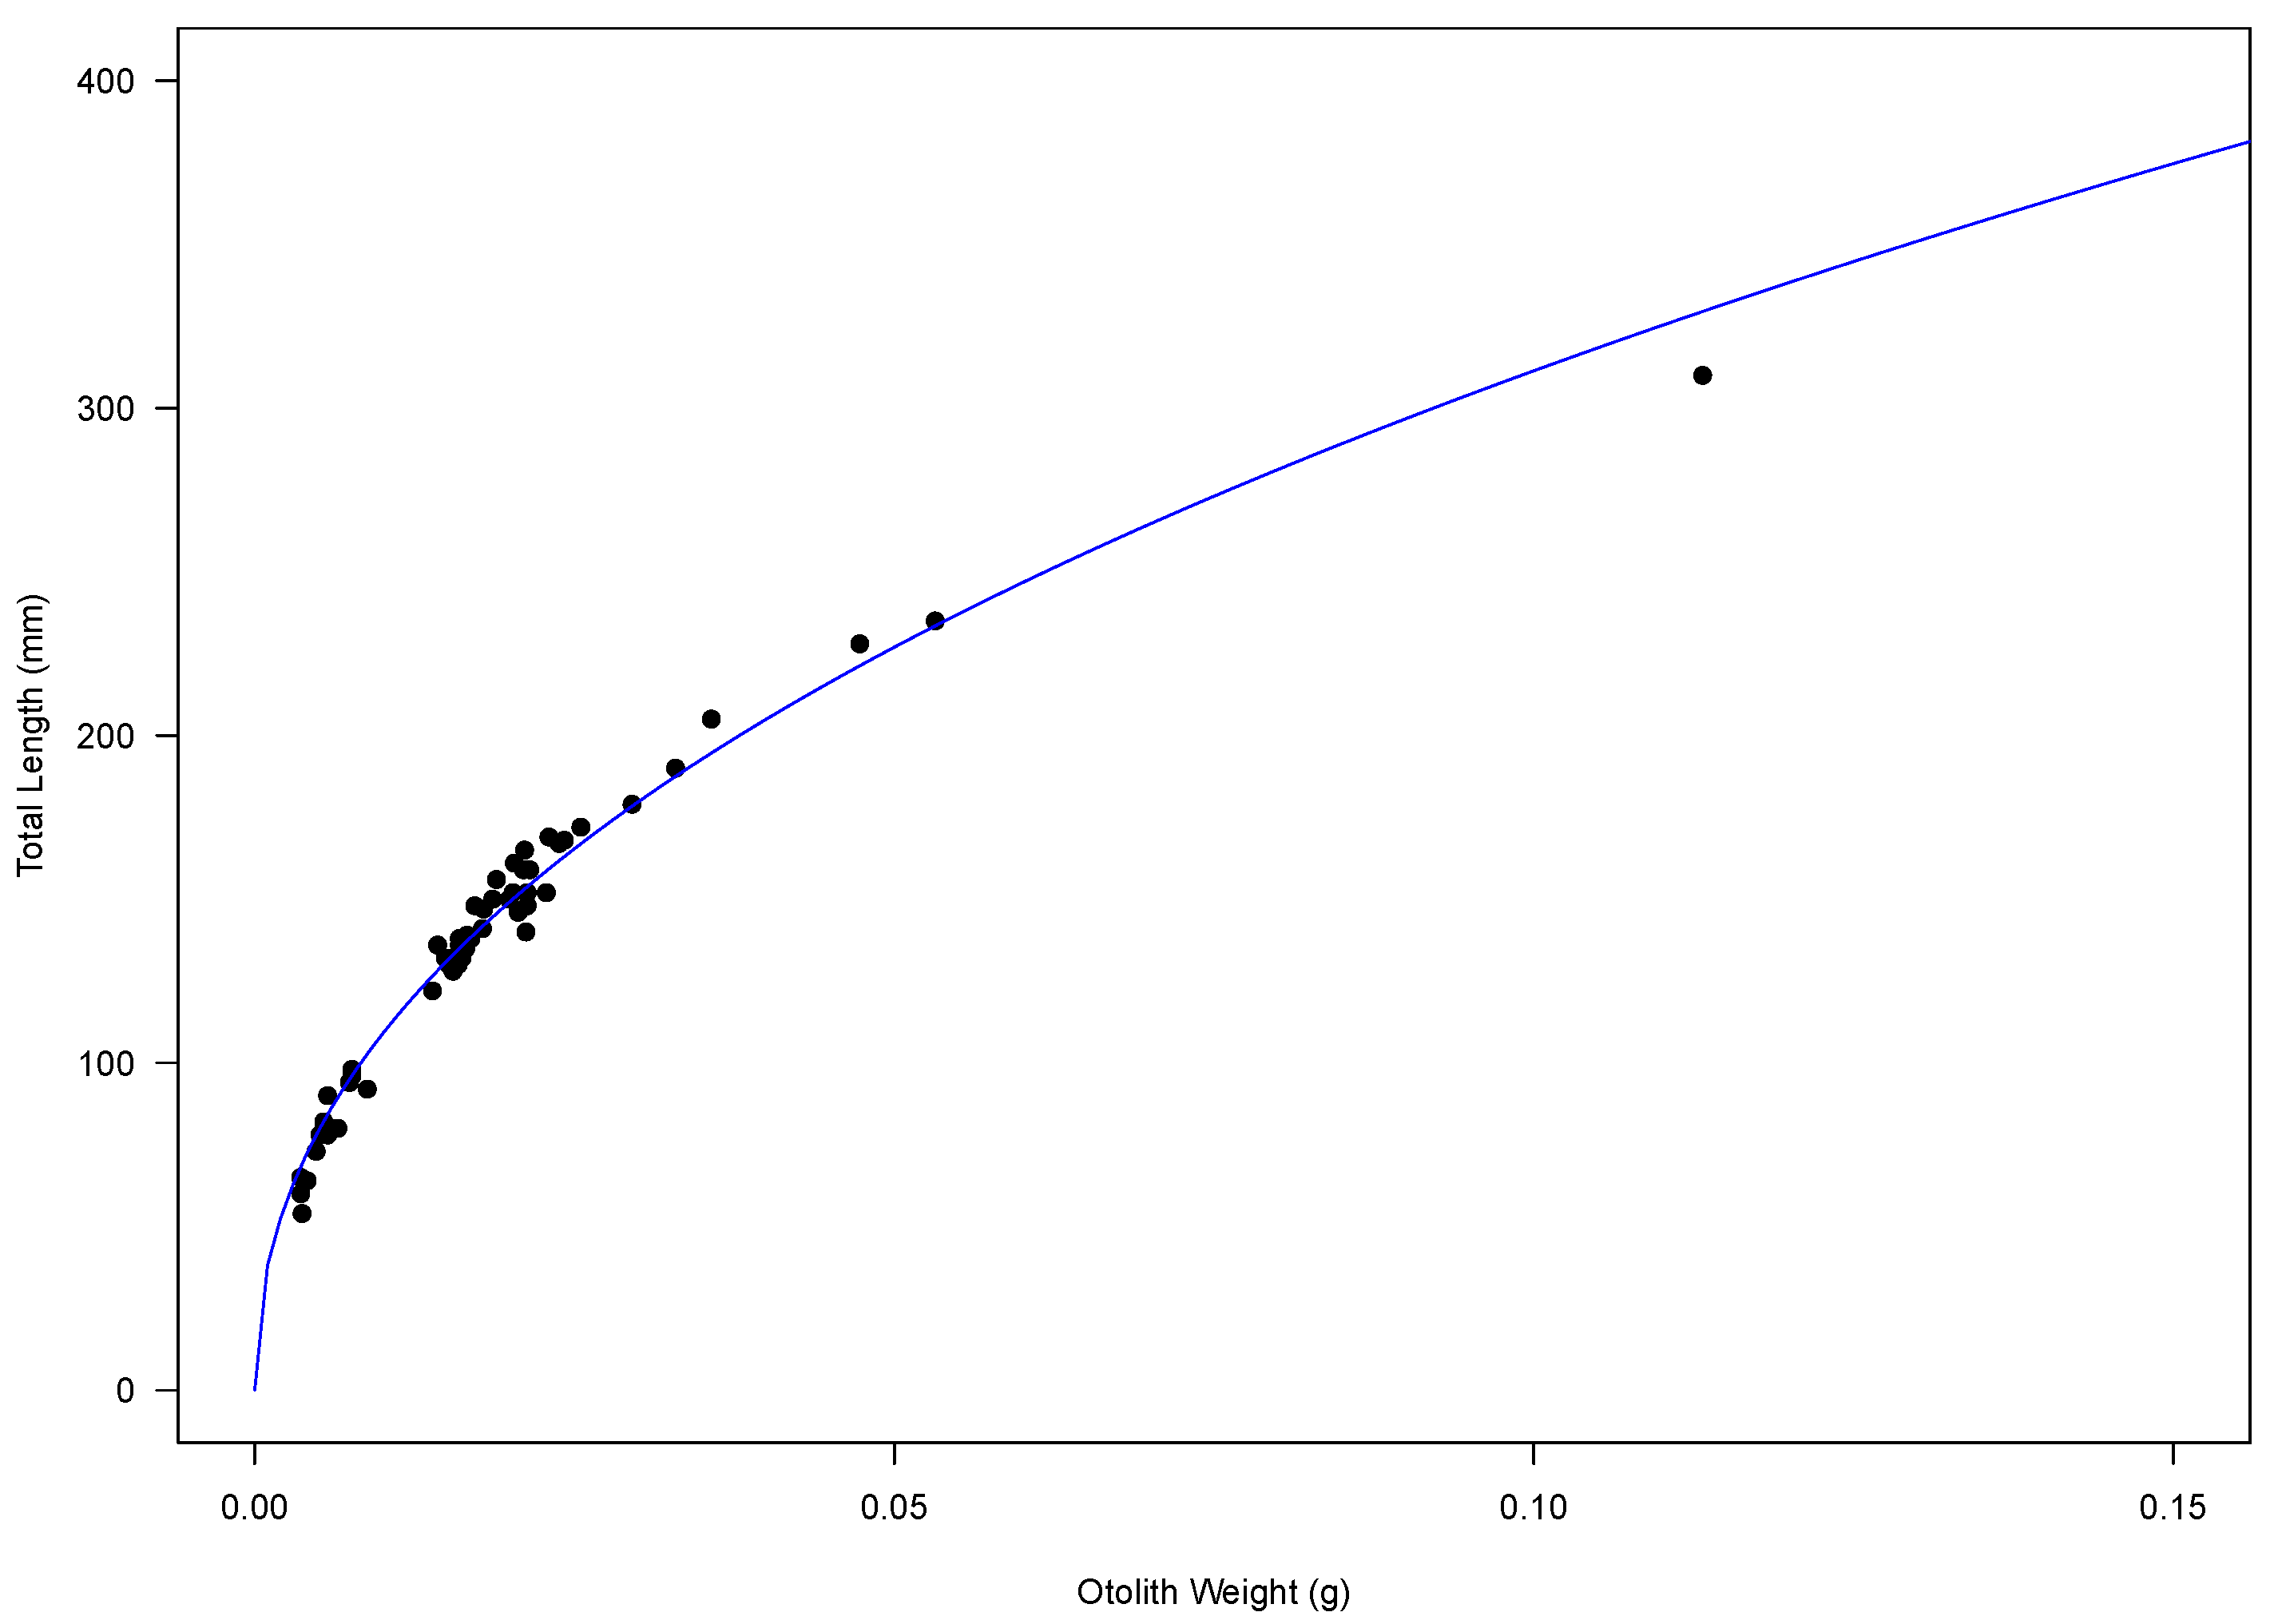
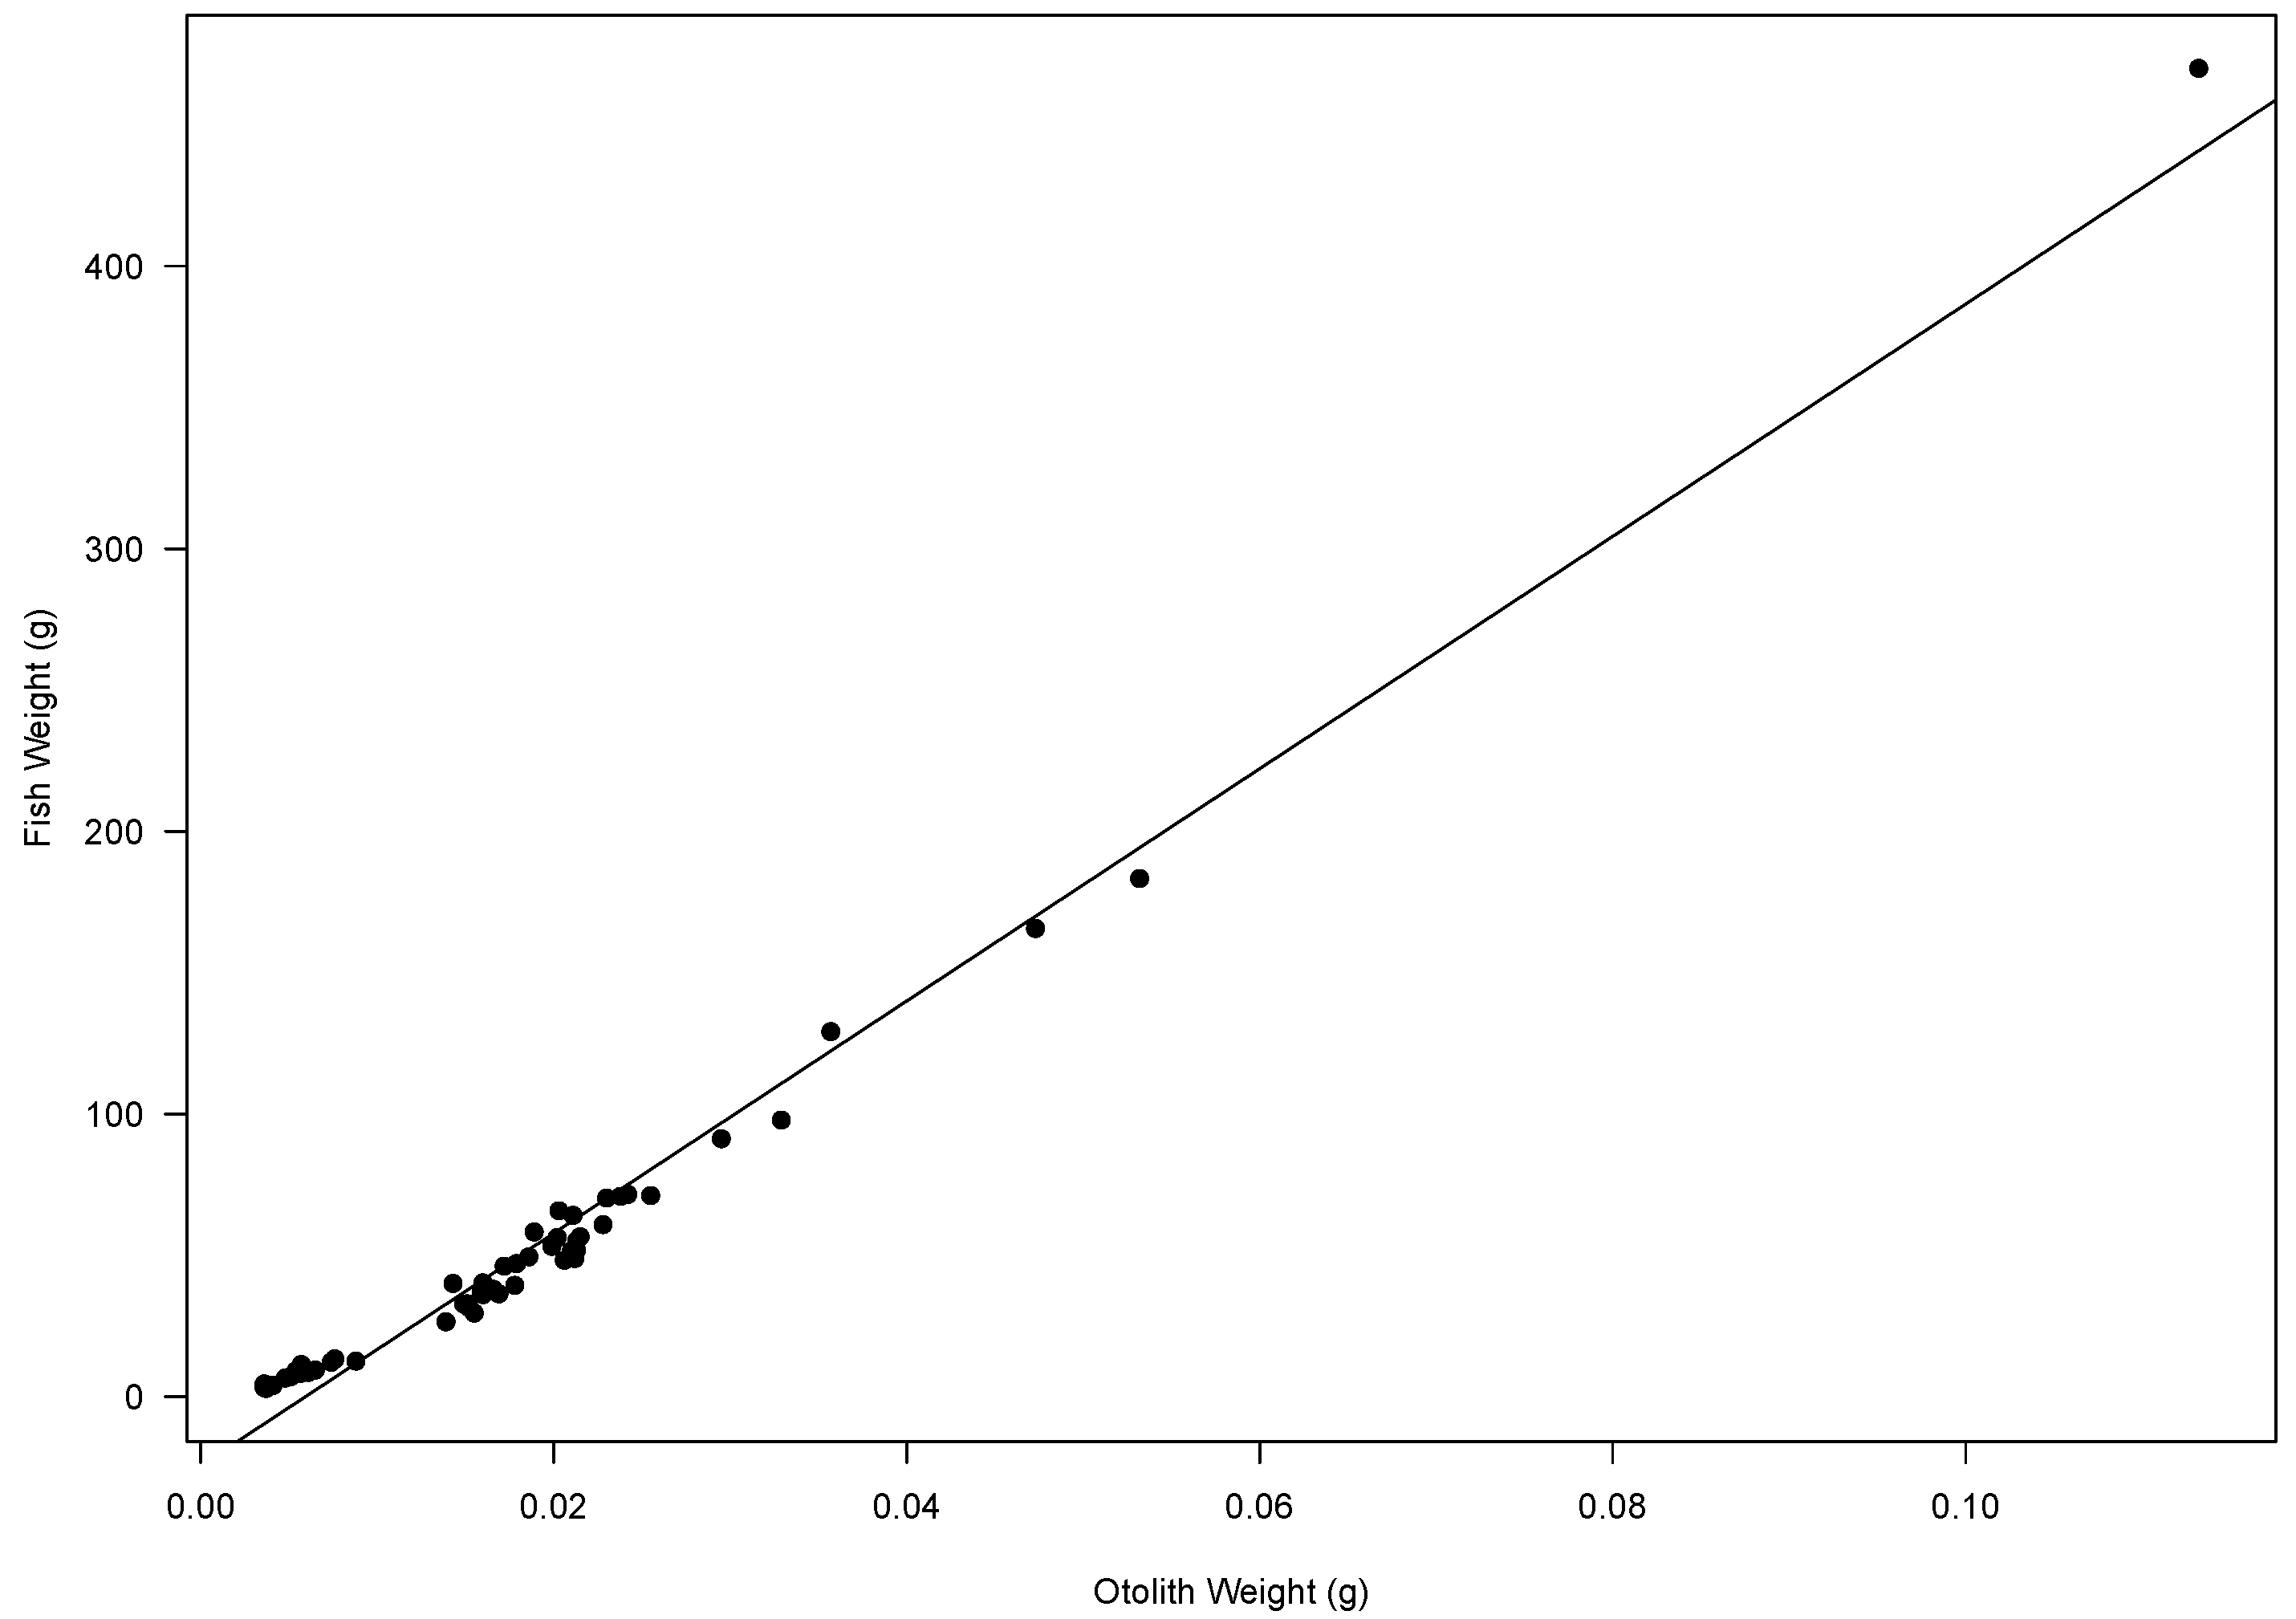
2.1. Age Estimation and Otolith Relationships
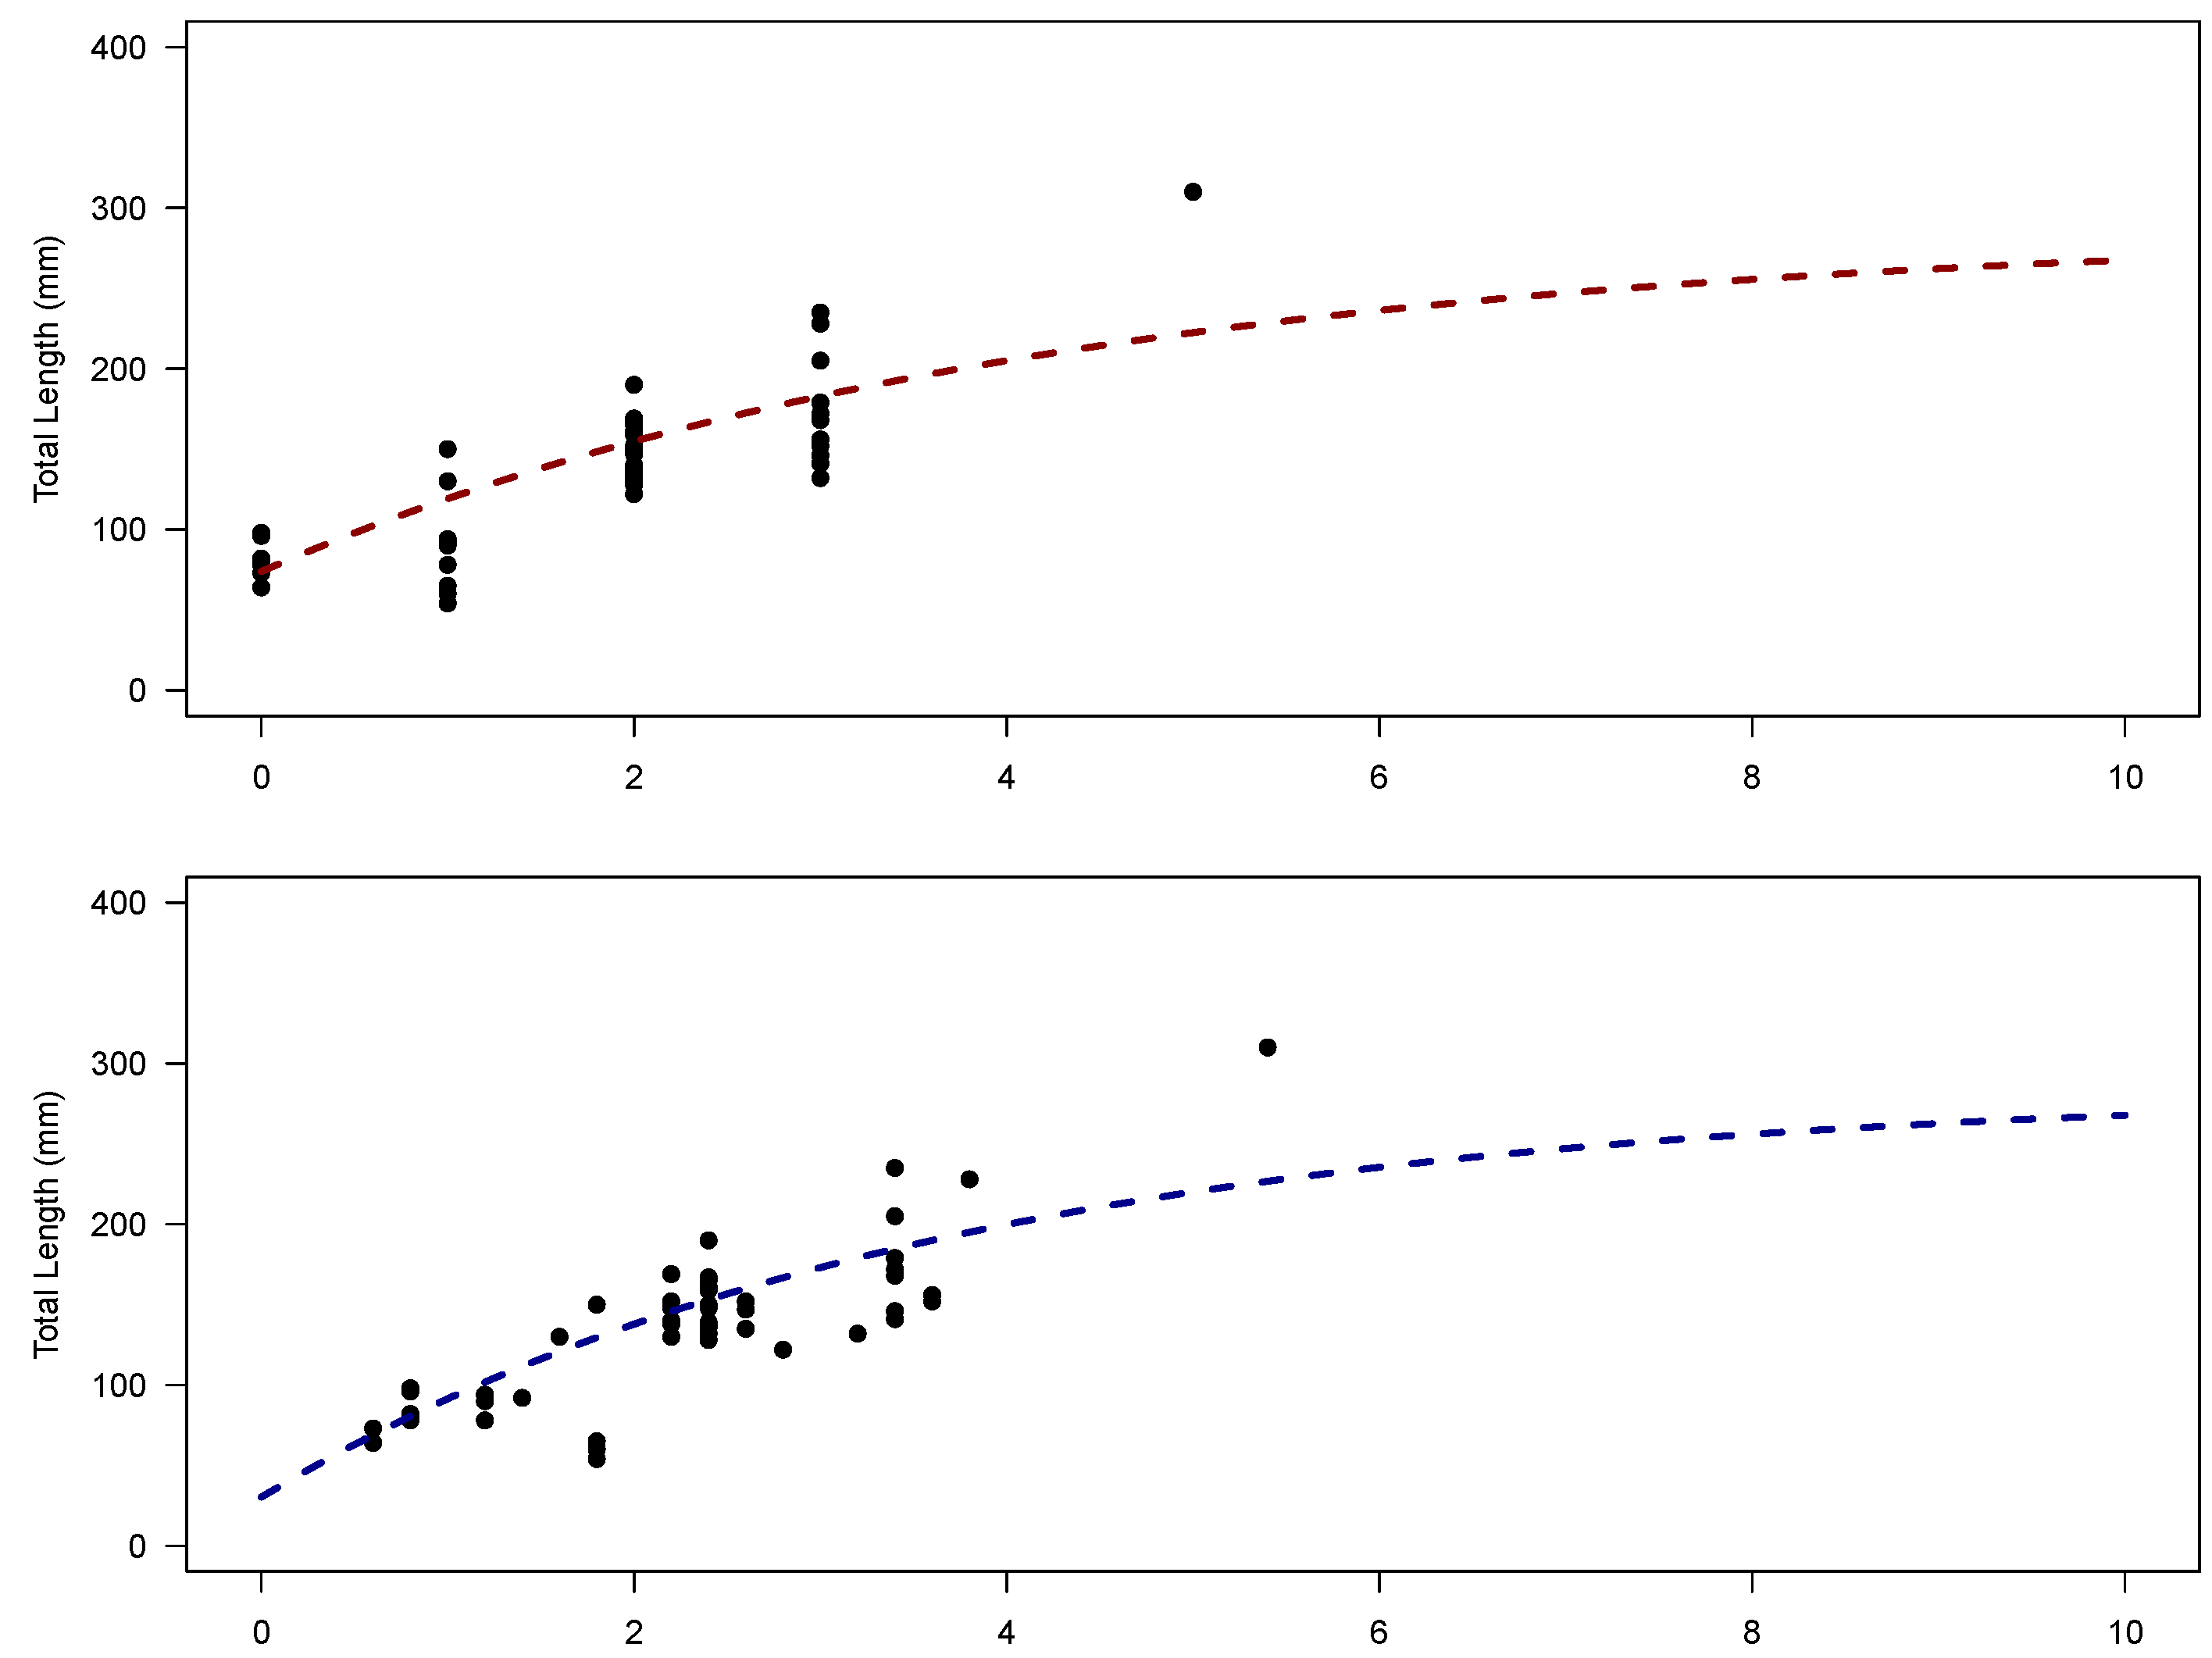
We aged a total of 55 L. harak using otoliths. Individual fish ranged from 54 mm to 310 mm TL (total length) and 2.80 g to 470 g whole weight. Both Age 0 and Age 1 included 9 individuals, Age 2 included 25 individuals, Age 3 included 11 individuals, and Age 5 one fish. We intended to identify the sex of the fish as well, but gonadal tissue was either hard to identify in very small fish or of indeterminate sex for larger fish and therefore could not be reliably evaluated. The otolith markings (annuli) were sometimes hard to identify, but we used methods described in Lasi [7] as guidance. In addition to this reference, we supplemented annuli identification by measuring all distances between all bands within an individual fish to ensure that increment distances were at least comparable among fish (i.e., to make sure we were not aging based on a feature that was far away from where an annulus was expected to be). Based on all fish that were Age 1 or older, the mean length from the core to the first annulus was 0.97 mm (Standard Deviation (SD) = 0.15; Table 1). This distribution of values included no outliers (as measured by ( 1.5 × I Q R ) + upper or lower quartile, where I Q R = the interquartile range).
The maximum likelihood estimates for the length–weight model parameters were a = 9.614 e 06 ( S E (standard error) = 1.242 e 06 ) and b = 3.084 ( S E = 2.344 e 02 ) (Figure 1). The relationship between fish length and otolith mass produced the estimates a = 890.4 ( S E = 29.72 ) and b = 0.456 ( S E = 0.009 ) (Figure 2). The fish weight–otolith weight relationship appeared linear (Figure 3), and, as such, we used least squares estimation to fit a linear model with intercept a = 24.52 ( S E = 1.85 ) and slope b = 4110.93 ( S E = 74.83 ). Residuals for all models appeared homoscedastic.

2.2. Growth

A von Bertlanffy growth model was fit to two separate sets of age data (both the full dataset, but with ages estimated differently). The first set was the raw ages as estimated from the sectioned otoliths. This was fit because this is the common method of estimating and fitting age data (Table 2). However, because of the high proportion of smaller (younger) fish in our dataset, we wanted to improve the data resolution by approximating fractional ages. This was done by inferring growth from the otolith edge (as described above). Additionally, adding estimated fractional age data improved the modelling of Age 0 fish, which are otherwise biasing the intercept estimate. Although the datasets are visually distinguishable (Figure 4), the parameter estimates were largely similar. This was particularly true for L (maximum asymptotic size) which was 291 mm for the unadjusted ages and 278 mm for the adjusted ages. K (growth coefficient) estimates were also similar, although a substantial difference in t 0 was found, which was expected (Table 2), suggesting that the fractional ages did not meaningfully change how the model parameters K and L could be interpreted.

3. Discussion

Overall, we estimated very similar growth parameters regardless of whether we used whole ages or adjusted ages. Although adjusted ages are not perfectly accurate, we report on these estimates here, because of the biological realism they provide to Age 0 individuals. Our von Bertalanffy growth parameters based on adjusted ages were comparable to growth estimates from fish sampled in southern Japan. Ebisawa and Ozawa [8] estimated L to be 284 mm and K to be 0.51. Bothestimates are comparable to our estimates, although we estimated a lower value of K. Greater differences in growth were found when compared to Fijian fish. Lasi [7] constrained the data to settlement sizes (due to questionable fits from biases due to a lack of young, small fish), which resulted in an L (285 mm) similar to our estimate, but to a much higher estimate of K (0.90) than we found. Although Lasi [7] attempted to deal with this known bias, it is likely that our dataset included enough small, young fish to accurately estimate K, and thus we are confident in our estimate. To summarize age and growth, we present evidence of asymptotic length that is strengthened by agreement with other studies of L. harak. Our estimate of early age growth (K) is also likely more reliable due to our inclusion of many small and young fish.
Initially, we felt limited by not being able to characterize gonadal tissue, and therefore sex. However, other growth work on this species has found no evidence of sexually dimorphic growth in this species [7,8]. Additionally, most of the fish we sampled were smaller than estimated L 50 (length at 50% maturity) of the species, and it stands to reason that even if growth were sexually dimorphic, it would likely be reflected in the asymptote and not the initial growth rate. Although our maximum age (5) was somewhat smaller than reported in other studies in the Western Indian Ocean (maximum ages of 8 [15]), we attribute this difference to our sampling of fish in nearshore habitats and the possibility of overfishing making larger individuals relatively rare. Estimates of L 50 exist for fish from Fiji [7] and Kenya [11], with L 50 ’s estimated close to the values for L . Due to our lack of sampling large, old individuals, we likely did not have many samples at sizes where the probability of maturity was high. Lethrinus harak in Kenya were estimated to have their lowest GSIs in July [11], which is very close to our sampling time, suggesting that, even if we sampled fish that may have been mature, they may likely have had regressed gonads making it hard to identify and characterize. If long-term (but not year-round) spawning takes place, an asynchronous, batch spawning reproductive strategy may be likely. Such a strategy would also suggest that older fish and high-resolution temporal sampling are needed to truly understand spawning patterns.

Strengths and Limitations

As with any study, our approach has strengths and limitations. We were limited by an inability to sample across seasons and particularly in our inability to sample large, presumably old, fish. Including both fishery-dependent and -independent sources was an attempt to get around any size selectivity, but it could be that larger individuals are rare if fishing mortality is high. Our study was strengthened by the data for smaller-size fish, which improved the certainty in our estimate of K. Estimates of K can be used to derive natural mortality information. Therefore, improvements in estimating K can lead to improved estimates of important life-history information. Our ability to measure otolith markings (e.g., the first annulus) and characterize distances also improved our confidence in assigning ages to our samples. We also gained confidence in our overall von Bertalanffy estimates when we ran both our estimated ages and adjusted ages and saw little difference in parameter estimates. Finally, perhaps the greatest strength of our study was that we were able to generate reliable growth estimates (based on previous work) from a small sample size. Although sampling more than 55 fish would have been more desirable, the Bayesian modeling framework that we applied to our data produced estimates in agreement with other work on the species, and ultimately Bayesian approaches show great promise for application on a large number of species in locations where sampling and other constraints limit sample size.
The use of otolith measurements between annuli and on total otolith weight allowed for additional confidence in our ageing estimates (although we recognize that we still have not yet validated the ages). Pilling et al. [16] found that otolith increments in an Indian Ocean population of Lethrinus mahseen, a congener to Lethrinus harak, were deposited annually. Furthermore, previous studies have noted an exponential decrease in the distance between annuli with age [16,17], which matches our findings here, giving us confidence in both our supposition of annual deposition and in our age calculations. Additionally, otolith weight, when combined with fish length, has been used to infer age for many species, including some Lethrinids [18], because otoliths continue to deposit material with age while somatic growth tends to decline [19]. Our otolith measurements for Age 0 fish are likely our most confident, due to the small total length of fish, otolith weight (similar to [7], and measurement of the distance from the core to the first annulus. Together, these measurements allow for a reduction in the number of potential outliers for Age 0 fish, thereby providing guidance for less certain older fish age determinations.

4. Materials and Methods

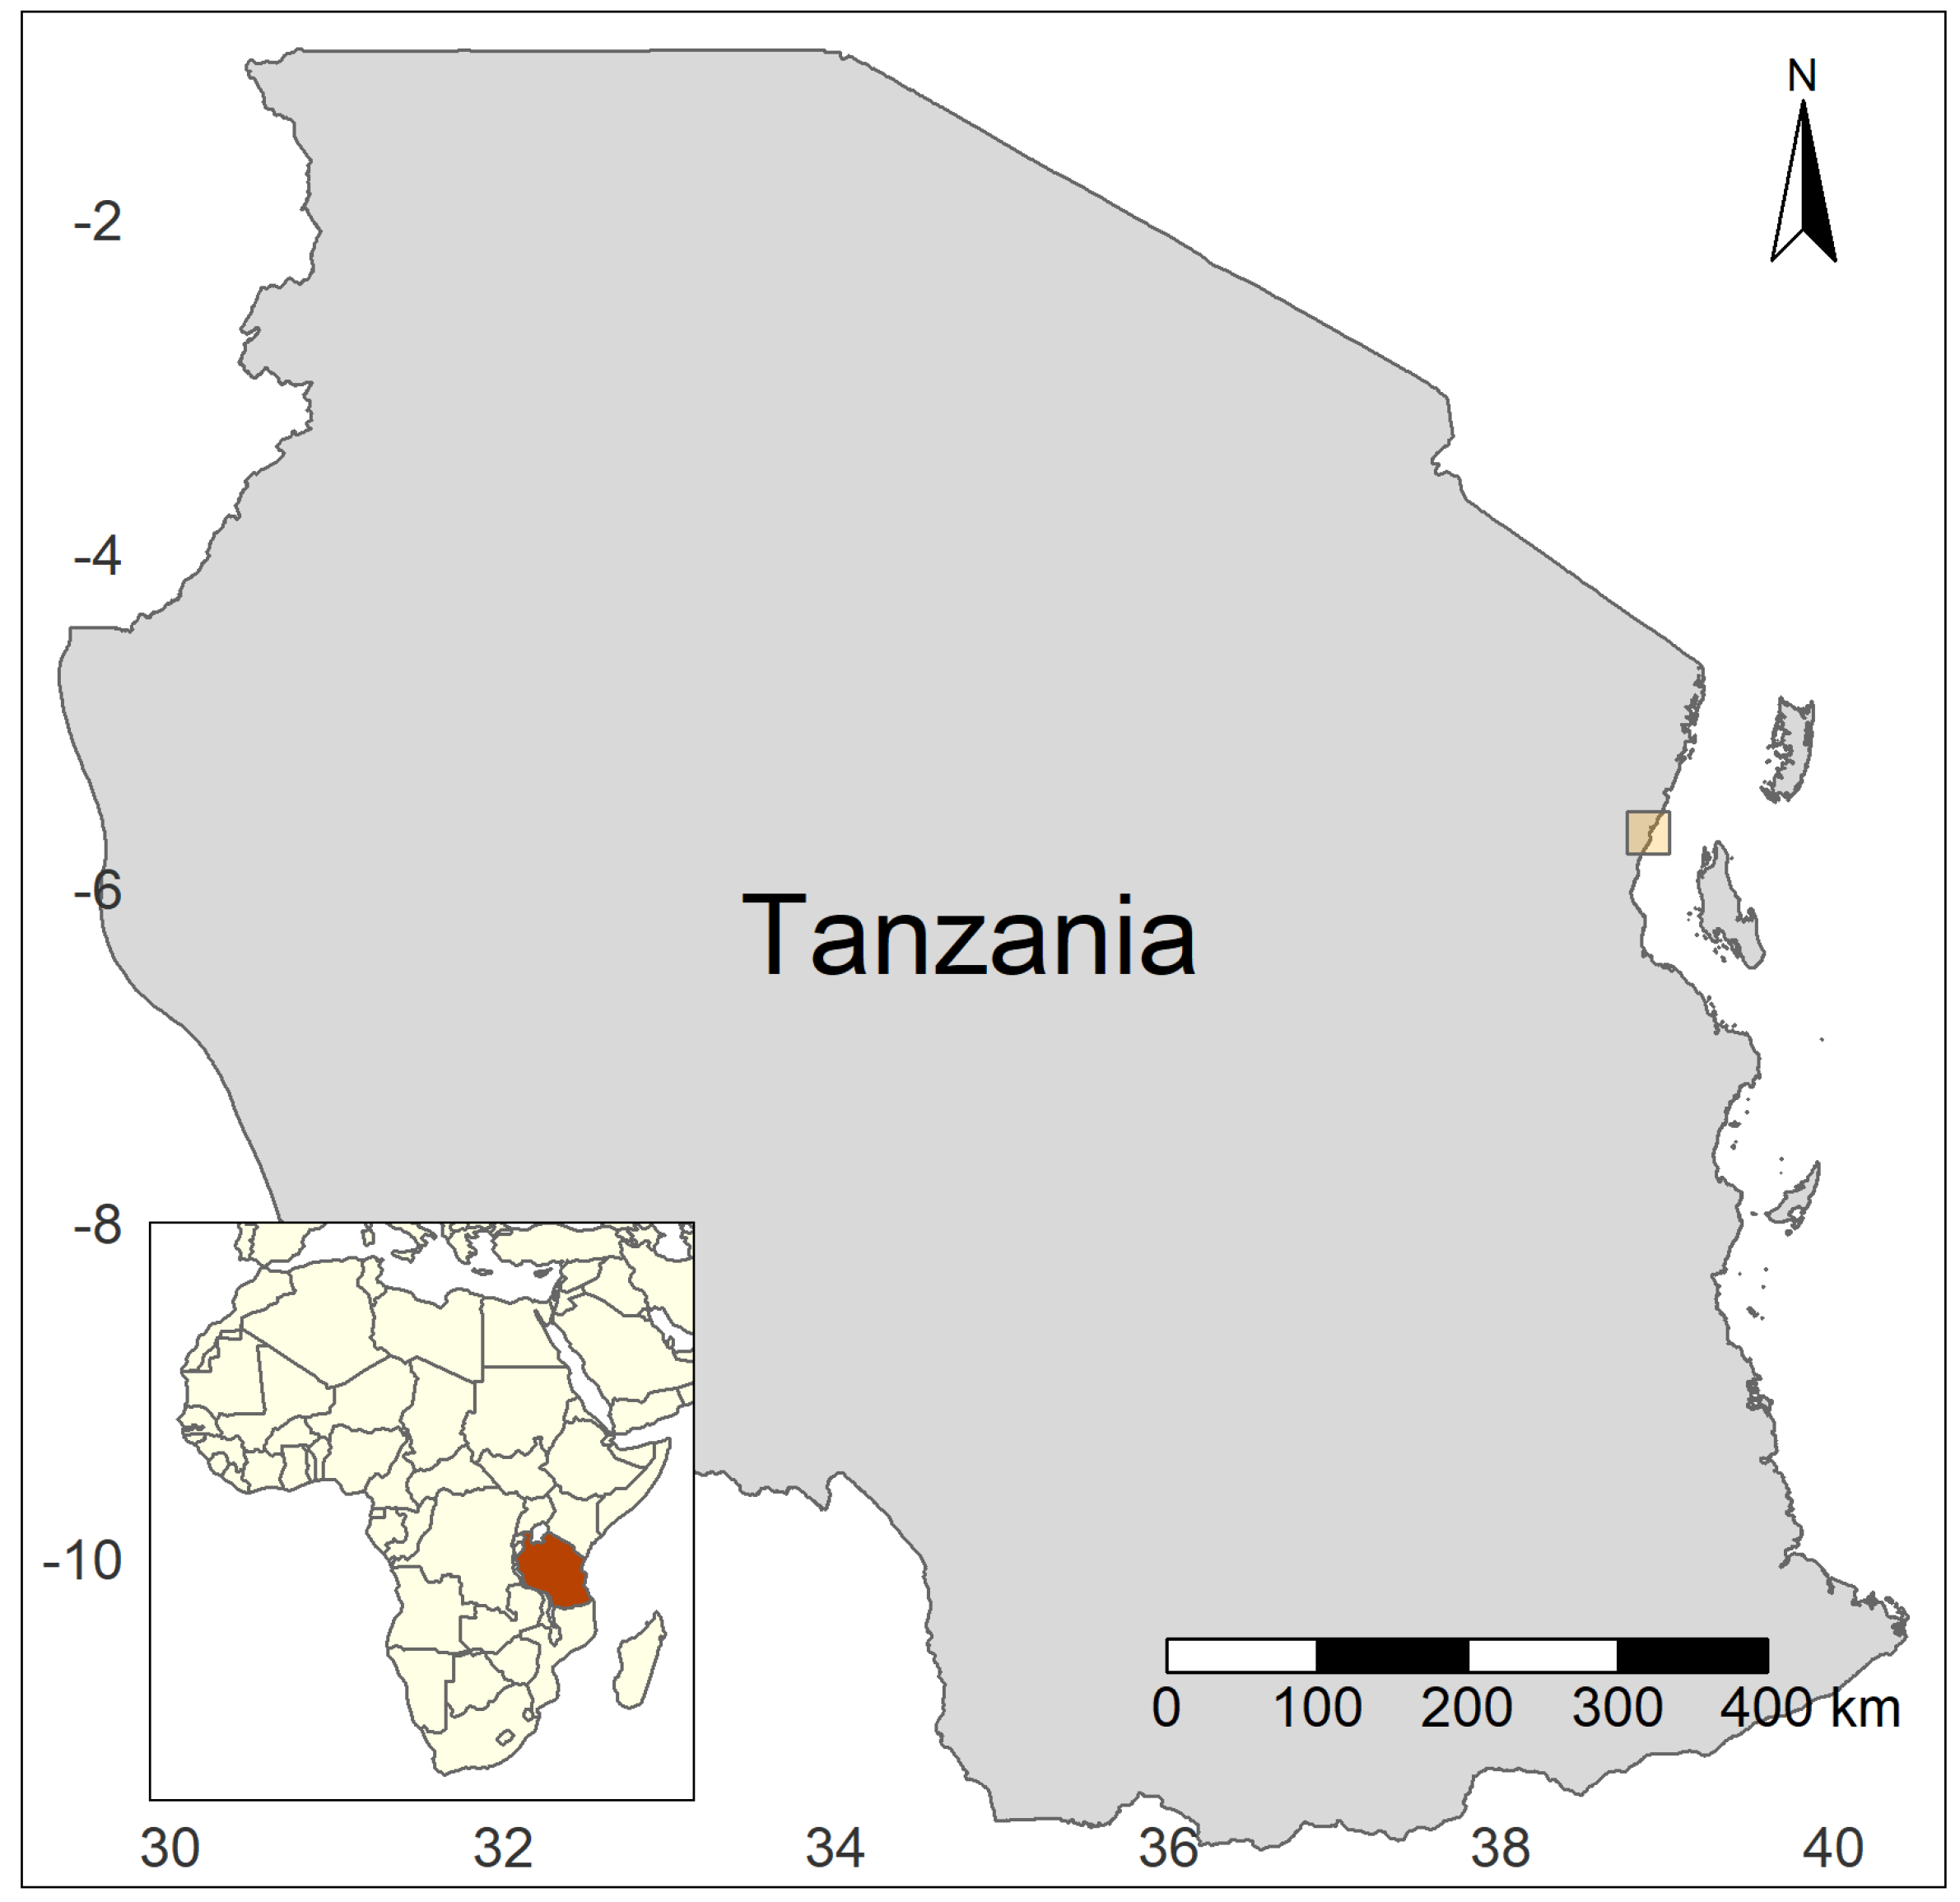
4.1. Collection of Samples

Lethrinus harak were sampled from a variety of fishery-dependent and -independent sources near Kipumbwi, Tanzania (Figure 5). Fishery independent samples were captured using a 10-m fine-mesh seine over seagrass and mudflat habitats (approximately 100 m 2 of each habitat), using multiple sweeps in an effort to sample the entire habitat. Fishery dependent samples came from direct purchase from fishermen at the Kipumbwi fish market where samples were purchased from a variety of fishers who anecdotally reported fishing on a nearshore reef. All sampling took place during 3–5 August 2016. The study was conducted in accordance with all IACUC (Institutional Animal Care and Use Committee) protocols (IACUC protocol number: 15-064).
After capture or acquisition, fish were worked up within 24 h of capture. Total wet weight (W; g) and total length (TL; mm) were measured. Fish were eviscerated for examination of gonadal tissue, and both right and left sagittal otoliths were extracted, cleaned, and saved for later processing. All subsequent otolith analysis took place at the National Oceanic and Atmospheric Administration’s Fisheries Southeast Fisheries Science Center, Beaufort, NC, USA.

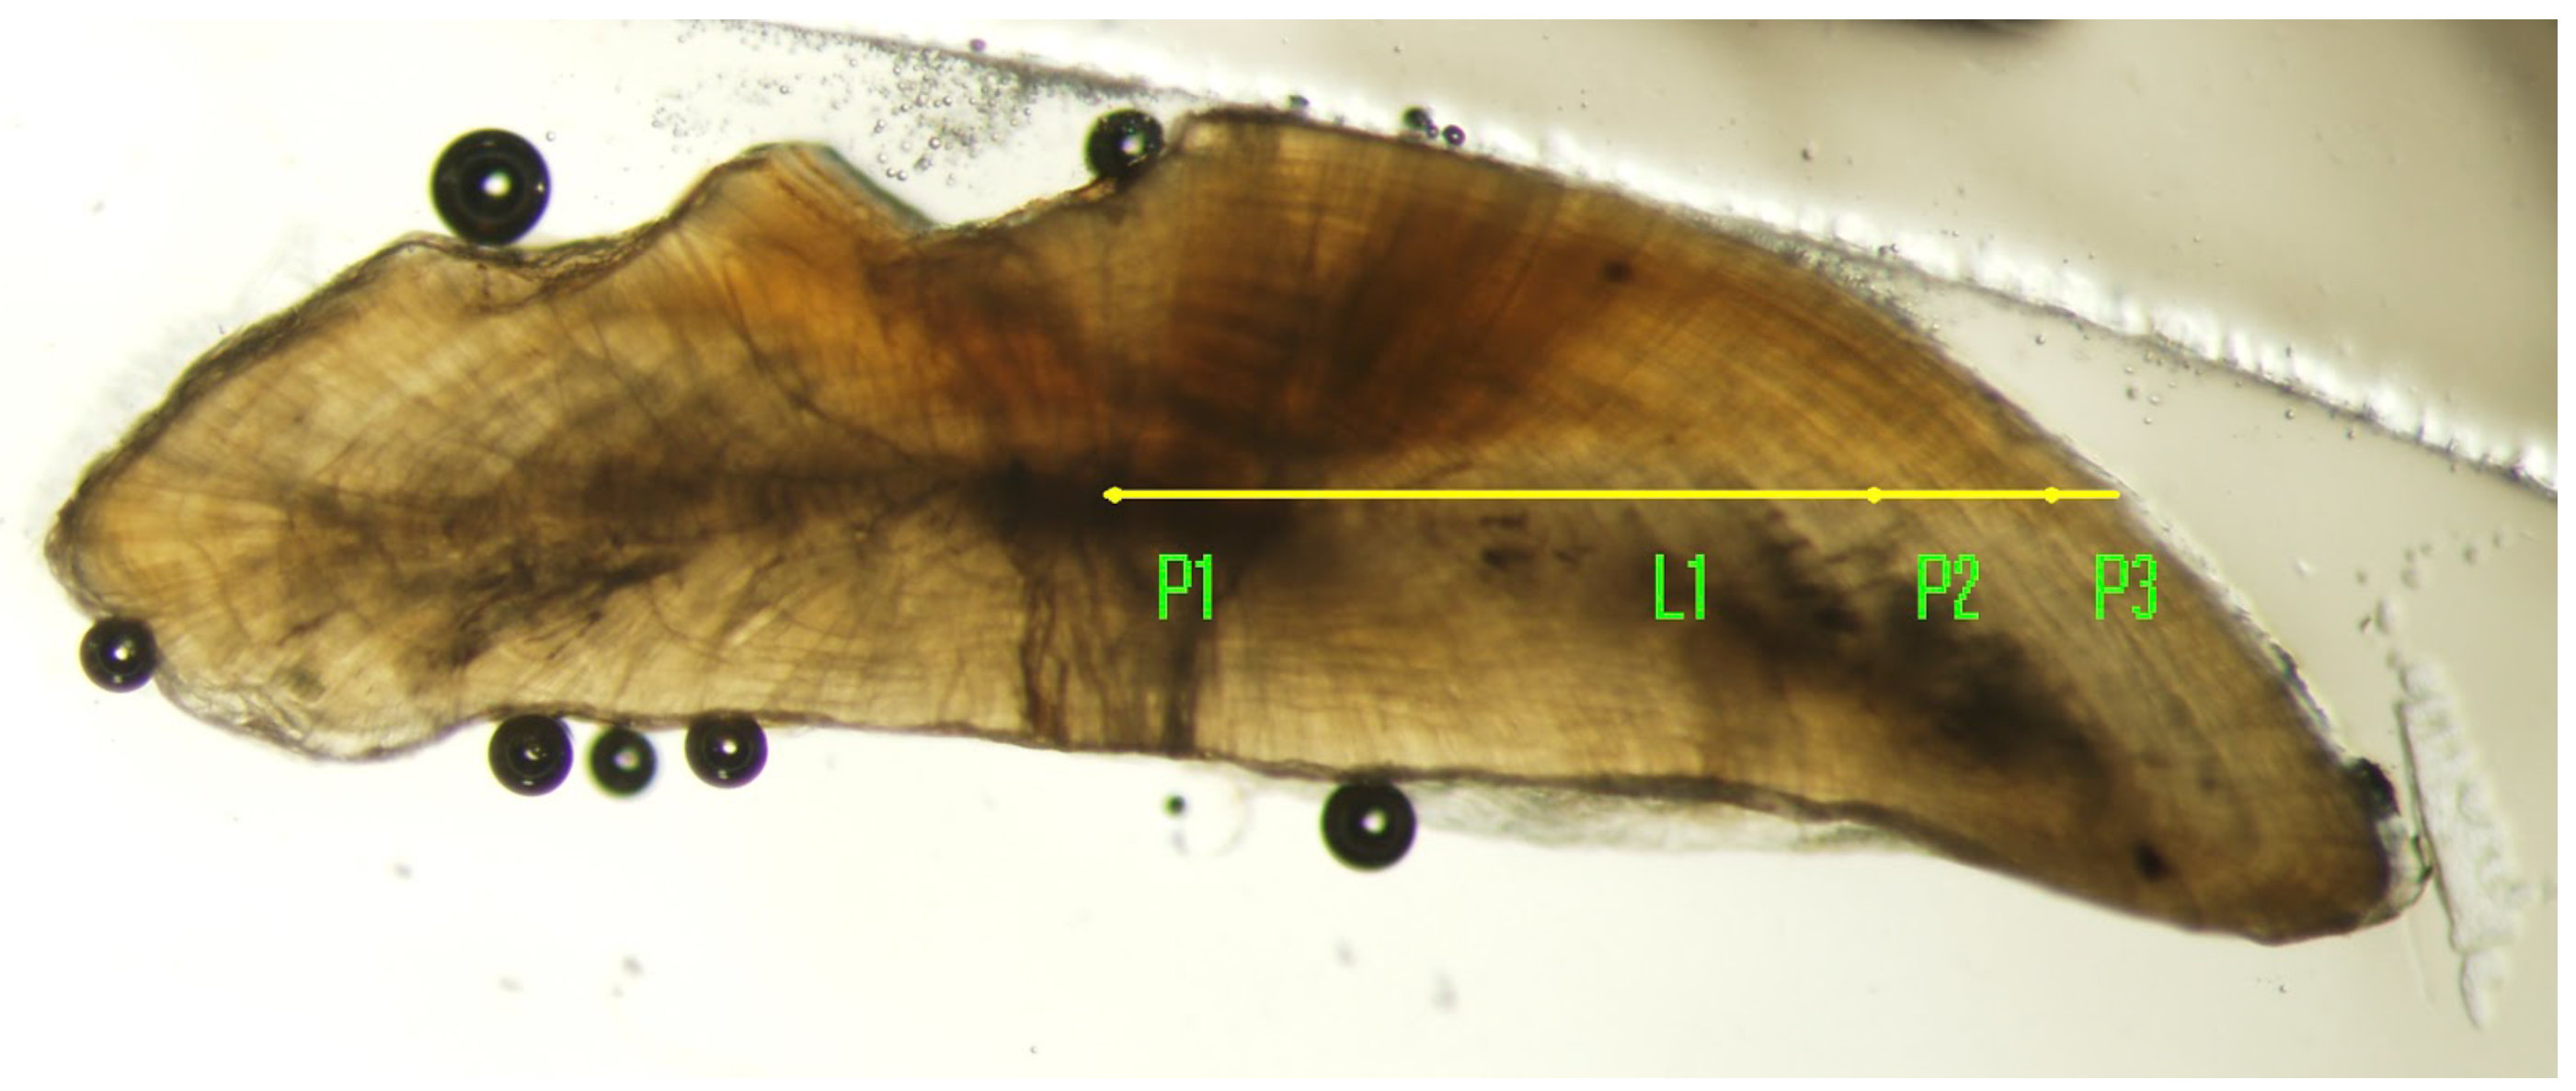
4.2. Otolith Analyses

Prior to sectioning, otoliths were weighed in a microbalance to the nearest 0.0001 g. Otoliths were imaged whole and then baked in an oven at 275 C for five minutes, in an effort to enhance the contrast of any annuli [20]. After baking, otoliths were imaged whole again, embedded in a two-part resin (Buehler) and set overnight in Bullet molds. After the resin was set, the core was labeled for sectioning and affixed to a cutting slide with Crystal Bond 509 (Electron Microscopy Sciences, Hatfield, PA, USA). Otoliths were then sectioned on a Isomet low speed saw (Buehler, Lake Bluff, IL, USA) where they were cut on both sides of the labeled core, which resulted in a single section. Sections were examined under a dissecting microscope to identify the higher-quality side for mounting. Samples were affixed with Crystalbond and liquid cover-slipped (DePex Mounting Medium, Electron Microscopy Sciences, Hatfield, PA, USA) for reading.
Pre- and post-bake whole otoliths were not used to estimate ages due to a lack of annuli identification. Otolith sections were aged using an Olympus SZX9 (Olympus, Center Valley, PA, USA), with a 1.5 ocular and 18.8– 24 × total magnification. The first annulus was identified on ventral side of otolith by following out a darker, continuous smear (Figure 6). Once there was a break in that smear, the next band was identified as the first annuli. This annulus was often followed around through the sulcal groove to the dorsal side of the otolith. Other annuli were identified as bands that could be similarly followed to the distal side of the otolith. Concurrent to annuli identification, sections were imaged using Image Pro Plus software (version 7, Media Cybernetics, Rockville, MD, USA). A line was overlaid, originating at the core and run horizontally on the ventral side to the otolith edge. Along the line, annuli were marked with points, and lengths between multiple annuli were digitally measured (mm).
Otolith edges were classified based on the amount of space between the last opaque zone (annulus) and the edge [21]. Because emperor may spawn year-round [7], edge analysis was evaluated as a way to estimate a fractional age and provide more detail in aging a species that cannot be assigned a common birth date. Fish estimated to be Age 0 were excluded from edge analysis; however, they were given adjusted (approximately fractional) ages based on their size, where fish <75 mm were assigned an additional 0.6 years and fish >75 mm were assigned an additional 0.8 years. This was done for three reasons. First, estimating all Age 0 fish to be mathematically zero suggest they have not aged at all (i.e., no fractional age implies they were just hatched), which is biologically false and which biases the intercept of any growth model parameters. Secondly, our gear sampled small individuals, but did not capture larval or very small juvenile fish, further supporting the fact that Age 0 fish were not early Age 0. Third, many Age 1 fish had lengths of 75–100 mm, suggesting that an Age 0 fish of that length had lived through at least half of Age 0. (Our adoption of 0.6 and 0.8 years was simply in accordance with the optional values from the edge analysis.)

4.3. Statistical Analysis

We were interested in a number of biological relationships that are unknown for L. harak in Tanzania. We used a standard power function to model the relationship between fish weight as a function of length.
W = a L b
where W is fish weight (grams) and L is fish TL (mm). Both a and b are parameters estimated by the length–weight model, where a is a scaling coefficient and b is the shape parameter.
We also used a power function to model fish length as a function of otolith weight.
L = a O b
where L is fish TL (mm) and O is otolith weight (g). Both a and b are parameters estimated by the model as described in the length-weight model above.
A linear model was used to examine the relationship between fish weight and otolith weight
W = α + β O
where W is fish weight (g) and O is otolith weight (g). α and β are the intercept and slope parameters, respectively, and are estimated by the model. The above three equations assumed additive errors (supported by visual inspections), that were independent and normally distributed with a mean of zero.
Von Bertalanffy growth functions (vBGF) were calculated to model the relationship between fish length and age. The vBGF is a common length–age relationship used in fisheries science that not only provides biologically interpretable parameters, but due to its common application, allows for meaningful parameter comparisons among studies. However, because the vBGF can sometimes be difficult to fit (i.e., parameter estimates can be difficult to converge) in situations where the size and/or age structure lacks contrast, we opted to use Bayesian estimation (see [22]). Although our sample size was not particularly low, given the range of sizes and ages in our sample, we recognize a lack of large, old fish compared to other studies. Additionally, preliminary model fitting with a maximum likelihood approach would not converge, suggesting that traditional maximum likelihood methods would not be an option for fitting a reasonable model to our dataset.
L = L ( 1 e ( K ( a t 0 ) )
where L is the TL (mm) and a is the estimated fish age. L , K, and t 0 are the model parameters representing the mean asymptotic length, the growth coefficient (growth at young ages), and the length at time zero, or the intercept, respectively.
We estimated the vBGF twice—once with the sectioned age (i.e., integer annuli count) and once with the sectioned age plus the edge type, which can be interpreted as a fractional age. In both model runs, we used non-informative normal priors for all probability distributions and three MCMC (Markov chain Monte Carlo) chains that were each run for 50,000 iterations. Chains were subset by removing 40,000 iterations of burn in and subsequent thinning by keeping every third iteration. Final posterior distributions were assessed for convergence both visually as well as with the Brooks–Gelman–Rubin statistic, R ^ , with values <1.1 indicating convergence (although no values >1.01 were recorded). JAGS (Version 3.4.0) analyses were run using the rjags package [23], run from within Team [24].

5. Conclusions

Growth is a fundamental biological function and core life history trait that can provide important information about a species—particularly one that is subject to harvest. Basic growth information is required for fisheries management, from complex stock assessment models all the way down to basic life history approaches [4]. Growth can also help inform other important life history attributes, such as reproductive effort [25,26] and natural mortality [27]. Such a basic, bottom-up approach to data collection is not only the most logistically feasible approach to data collection in Tanzania and East Africa, but it represents a robust, biologically-based method on which future management can be built. East African fishery resources are generally over-harvested, and any recovery and future sustainable resource use will require region-specific biological information.

Author Contributions

S.R.M., L.W. and M.H. conceived and designed the study and collected the data; A.O. analyzed the otoliths; S.R.M., M.H., and M.D.R. analyzed the data; S.R.M. wrote the paper.

Funding

This research was funded by The National Science Foundation CNH-S Grant #1518471.

Acknowledgments

We thank Jennifer Potts for guidance in sectioning and interpreting the otoliths. Humphry Tillya and Ezra Katete provided invaluable field support and worked long shifts, while the Kijongo Bay managers were very obliging in creating work space for much of the fish work-up. Finally, we thank Mike Polito for his efforts in sampling fish and logistical help.

Conflicts of Interest

The authors declare no conflict of interest. The founding sponsors had no role in the design of the study; in the collection, analyses, or interpretation of data; in the writing of the manuscript, and in the decision to publish the results. Mention of trade names or commercial companies is for identification purposes only and does not imply endorsement by the National Marine Fisheries Service, NOAA.

References

  1. Jacquet, J.; Fox, H.; Motta, H.; Ngusaru, A.; Zeller, D. Few data but many fish: Marine small-scale fisheries catches for Mozambique and Tanzania. Afr. J. Mar. Sci. 2010, 32, 197–206. [Google Scholar] [CrossRef]
  2. Jiddawi, N.; Öhman, M. Marine fisheries in Tanzania. J. Hum. Environ. 2002, 31, 518–527. [Google Scholar] [CrossRef]
  3. Bush, E.R.; Short, R.E.; Milner-Gulland, E.J.; Lennox, K.; Samoilys, M.; Hill, N. Mosquito net use in an artisanal East African fishery. Conserv. Lett. 2016, 10, 451–459. [Google Scholar] [CrossRef]
  4. King, J.; McFarlane, G. Marine fish life history strategies: Applications to fishery management. Fish. Manag. Ecol. 2003, 10, 249–264. [Google Scholar] [CrossRef]
  5. Carpenter, K. Lethrinidae: Emperor (emperor snappers). In The Living Marine Resources of the Western Central Pacific; Carpenter, K., Niems, V., Eds.; Bony fishes, part 3 (Menidae to Pomacentridae); FAO: Rome, Italy, 2001; Volume 5, pp. 3004–3050. [Google Scholar]
  6. Sobo, F. Community participation in fisheries management in Tanzania. In Proceedings of the IIFET 2012 Tanzania Proceedings, Dar es Salaam, Tanzania, 16–20 July 2012. [Google Scholar]
  7. Lasi, F. Age, Growth, Mortality Rates and Reproductive Biology of Three Fijian Emperor Fishes (Pisces: Lethrinidae) Lethrinus harak. Master’s Thesis, University of the South Pacific, Suva, Fiji, 2003. [Google Scholar]
  8. Ebisawa, A.; Ozawa, T. Life-history traits of eight Lethrinus species from two local populations in waters off the Ryukyu Islands. Fish. Sci. 2009, 75, 553–566. [Google Scholar] [CrossRef]
  9. Nanami, A.; Yamada, H. Site fidelity, size, and spatial arrangement of daytime home range of thumbprint emperor Lethrinus harak (Lethrinidae). Fish. Sci. 2009, 75, 1109–1116. [Google Scholar] [CrossRef]
  10. Trianni, M.S. Life history characteristics and stock status of the thumbprint emperor (Lethrinus harak) in Saipan Lagoon. Fish. Bull. 2016, 114, 409–425. [Google Scholar] [CrossRef]
  11. Kulmiye, A.; Ntiba, M.; Kisia, S. Some aspects of the reproductive biology of the thumbprint emperor, Lethrinus harak (Forsskål, 1775), in Kenyan coastal waters. West. Indian Ocean J. Mar. Sci. 2002, 1, 135–144. [Google Scholar]
  12. Hilomen, V.V. Inter- and Intra-habitat Movement Patterns and Population Dynamics of Small Reef Fishes of Commercial and Recreational Significance. Ph.D. Dissertation, James Cook University, Townsville, Australia, 1997. [Google Scholar]
  13. Ebisawa, A. Reproductive and sexual characteristics in five Lethrinus species in waters off the Ryukyu Islands. Ichthyol. Res. 2006, 53, 269–280. [Google Scholar] [CrossRef]
  14. Ricker, W.E. Computation and interpretation of biological statistics of fish populations. Bull. Fish. Res. Board Can. 1975, 191, 382. [Google Scholar]
  15. Kimirei, I.; Nagelkerken, I.; Slooter, N.; Gonzalez, E.; Huijbers, C.; Mgaya, Y.; Rypel, A. Demography of fish populations reveals new challenges in appraising juvenile habitat values. Mar. Ecol. Prog. Ser. 2015, 518, 225–237. [Google Scholar] [CrossRef] [Green Version]
  16. Pilling, G.M.; Millner, R.S.; Easey, M.W.; Mees, C.C.; Rathacharen, S.; Azemia, R. Validation of annual growth increments in the otoliths of the lethrinid Lethrinus mahsena and the lutjanid Aprion virescens from sites in the tropical Indian Ocean, with notes on the nature of growth increments in Pristipomoides filamentosus. Fish. Bull. 2000, 98, 600. [Google Scholar]
  17. Fowler, A.J. Validation of annual growth increments in the otoliths of a small, tropical coral reef fish. Mar. Ecol. Prog. Ser. 1990, 64, 25–38. [Google Scholar] [CrossRef]
  18. Pilling, G.; Grandcourt, E.; Kirkwood, G. The utility of otolith weight as a predictor of age in the emperor Lethrinus mahsena and other tropical fish species. Fish. Res. 2003, 60, 493–506. [Google Scholar] [CrossRef]
  19. Francis, R.C.; Campana, S.E. Inferring age from otolith measurements: A review and a new approach. Can. J. Fish. Aquat. Sci. 2004, 61, 1269–1284. [Google Scholar] [CrossRef]
  20. Pentilla, J. Age Determination Methods for Northwest Atlantic Species: Technical Report 72. Atlantic Cod, Gadus morhua; Pentilla, J., Dery, L., Eds.; National Oceanic and Atmospheric Administration: Silver Spring, MA, USA, 1988; pp. 31–36.
  21. Harris, P.J.; Wyanski, D.M.; White, D.B.; Mikell, P.P.; Eyo, P.B. Age, growth, and reproduction of greater amberjack off the southeastern US Atlantic coast. Trans. Am. Fish. Soc. 2007, 136, 1534–1545. [Google Scholar] [CrossRef]
  22. Midway, S.R.; Wagner, T.; Arnott, S.A.; Biondo, P.; Martinez-Andrade, F.; Wadsworth, T.F. Spatial and temporal variability in growth of southern Flounder (Paralichthys lethostigma). Fish. Res. 2015, 167, 323–332. [Google Scholar] [CrossRef]
  23. Plummer, M. rjags: Bayesian Graphical Models using MCMC; CRAN: Vienna, Austria, 2016. [Google Scholar]
  24. Team, R.C. R: A Language and Environment for Statistical Computing; R Foundation for Statistical Computing: Vienna, Austria, 2017. [Google Scholar]
  25. Charnov, E.L. Fish growth: Bertalanffy k is proportional to reproductive effort. Environ. Biol. Fishes 2008, 83, 185–187. [Google Scholar] [CrossRef]
  26. Prince, J.; Hordyk, A.; Valencia, S.R.; Loneragan, N.; Sainsbury, K. Revisiting the concept of Beverton–Holt life-history invariants with the aim of informing data-poor fisheries assessment. ICES J. Mar. Sci. 2014, 72, 194–203. [Google Scholar] [CrossRef]
  27. Pauly, D. On the interrelationships between natural mortality, growth parameters, and mean environmental temperature in 175 fish stocks. ICES J. Mar. Sci. 1980, 39, 175–192. [Google Scholar] [CrossRef]
Figure 1. Relationship of Lethrinus. harak total length (mm) to fish weight (g). Data are represented by the black dots and the line represents the model W = 9.614 e 06 L 3.084 , where W and L represent individual weight and length, respectively.
Fishes 03 00031 g001
Figure 2. Relationship of L. harak otolith weight (g) to fish total length (mm). Data are represented by the black dots and the line represents the model L = 890.4 O 0.456 , where L and O represent individual length and otolith mass, respectively.
Fishes 03 00031 g002
Figure 3. Relationship of L. harak otolith mass (g) to fish weight (g). Data are represented by the black dots and the line represents the model W = 24.52 + 4110.93 O , where W and O represent individual weight and otolith mass, respectively.
Fishes 03 00031 g003
Figure 4. Von Bertalanffy model fits to L. harak age and growth data. The top panel represents individual fish aged with whole ages, and the bottom panel represents a fractional age based on amount of growth between the final increment (annuli) and margin. Both Von Bertalanffy models were estimated with similar parameter estimates.
Fishes 03 00031 g004
Figure 5. Map of Tanzania with inset of Africa. The study site of Kipumbwi is denoted by the box on the northern coast.
Fishes 03 00031 g005
Figure 6. Image of sectioned otolith with features indicating the core (P1), first annulus (P2) and second annulus (P3). The line feature (L1) was used to ensure consistent placement of markers for measurements between annuli.
Fishes 03 00031 g006
Table 1. Measurements of distances from core to annuli. All measurements are presented in mm. Standard deviation could not be calculated for the fourth and fifth annulus measurements because the sample size was 1.
Measure1st Annulus Length2nd Annulus Length3rd Annulus Length4th Annulus Length5th Annulus Length
Mean0.971.401.572.122.38
Standard deviation0.150.120.13
Minimum0.631.161.472.122.38
Maximum1.281.651.902.122.38
n46371211
Table 2. Von Bertalanffy parameter estimates from this study and other studies of L. harak. Estimates of uncertainty for this study are 95% credible intervals in parentheses. Other studies did not evaluate uncertainty. See Lasi [7] for details on the constrained and unconstrained models. L = maximum asymptotic size, K = growth coefficient, and t 0 is the age when the average length was 0.
Study L (mm)K t 0 Location
Unadjusted ages (this study)291 (210, 395)0.23 (0.13, 0.41) 1.3 ( 2.0 , 0.7 )Tanzania
Adjusted ages (this study)278 (200, 383)0.29 (0.15, 0.53) 0.4 ( 1.0 , 0.1)Tanzania
Ebisawa and Ozawa (2009)2840.509 0.83 Japan
Lasi (2003), constrained2850.90 0.11 Fiji
Lasi (2003), unconstrained3250.27 0.24 Fiji
Trianni (2016), combined sexes3010.259 1.65 Saipan

