Increasing Abundance of Silky Sharks in the Eastern Indian Ocean: Good News or a Reason to be Cautious?


Abstract
:1. Introduction
2. Result
2.1. Fishing Catches and Trips
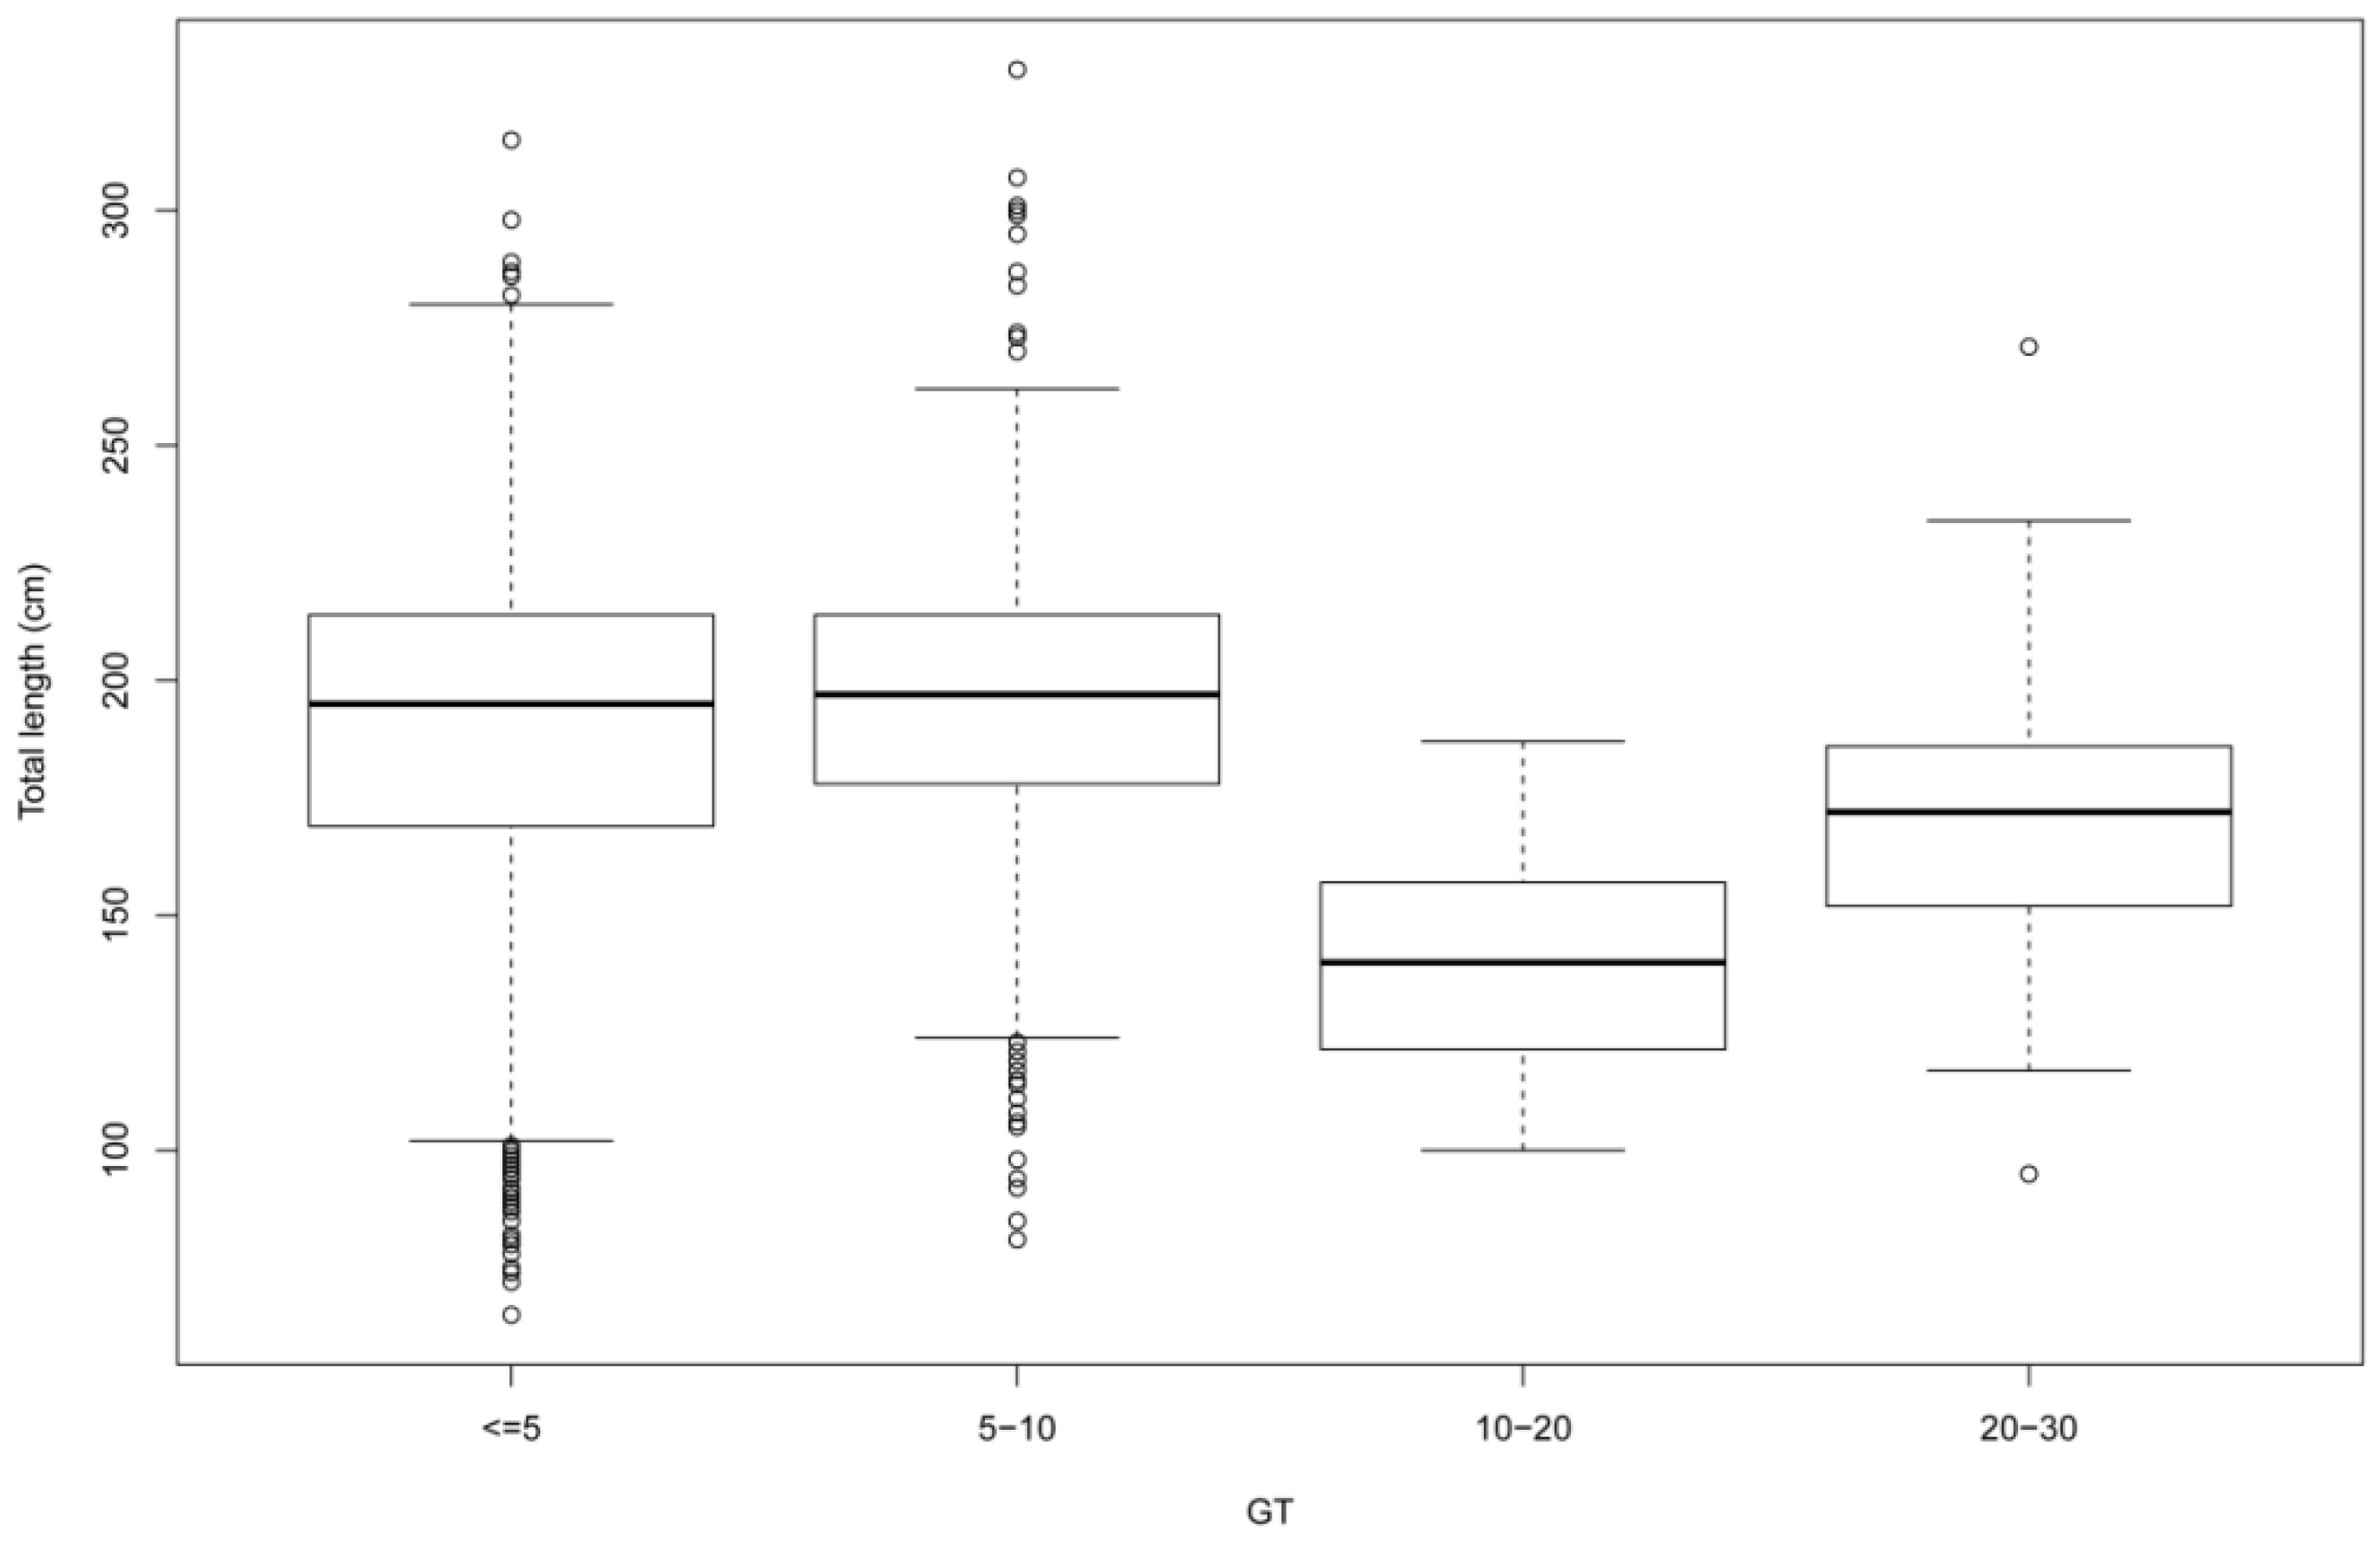
2.2. Catches’ Composition and Size
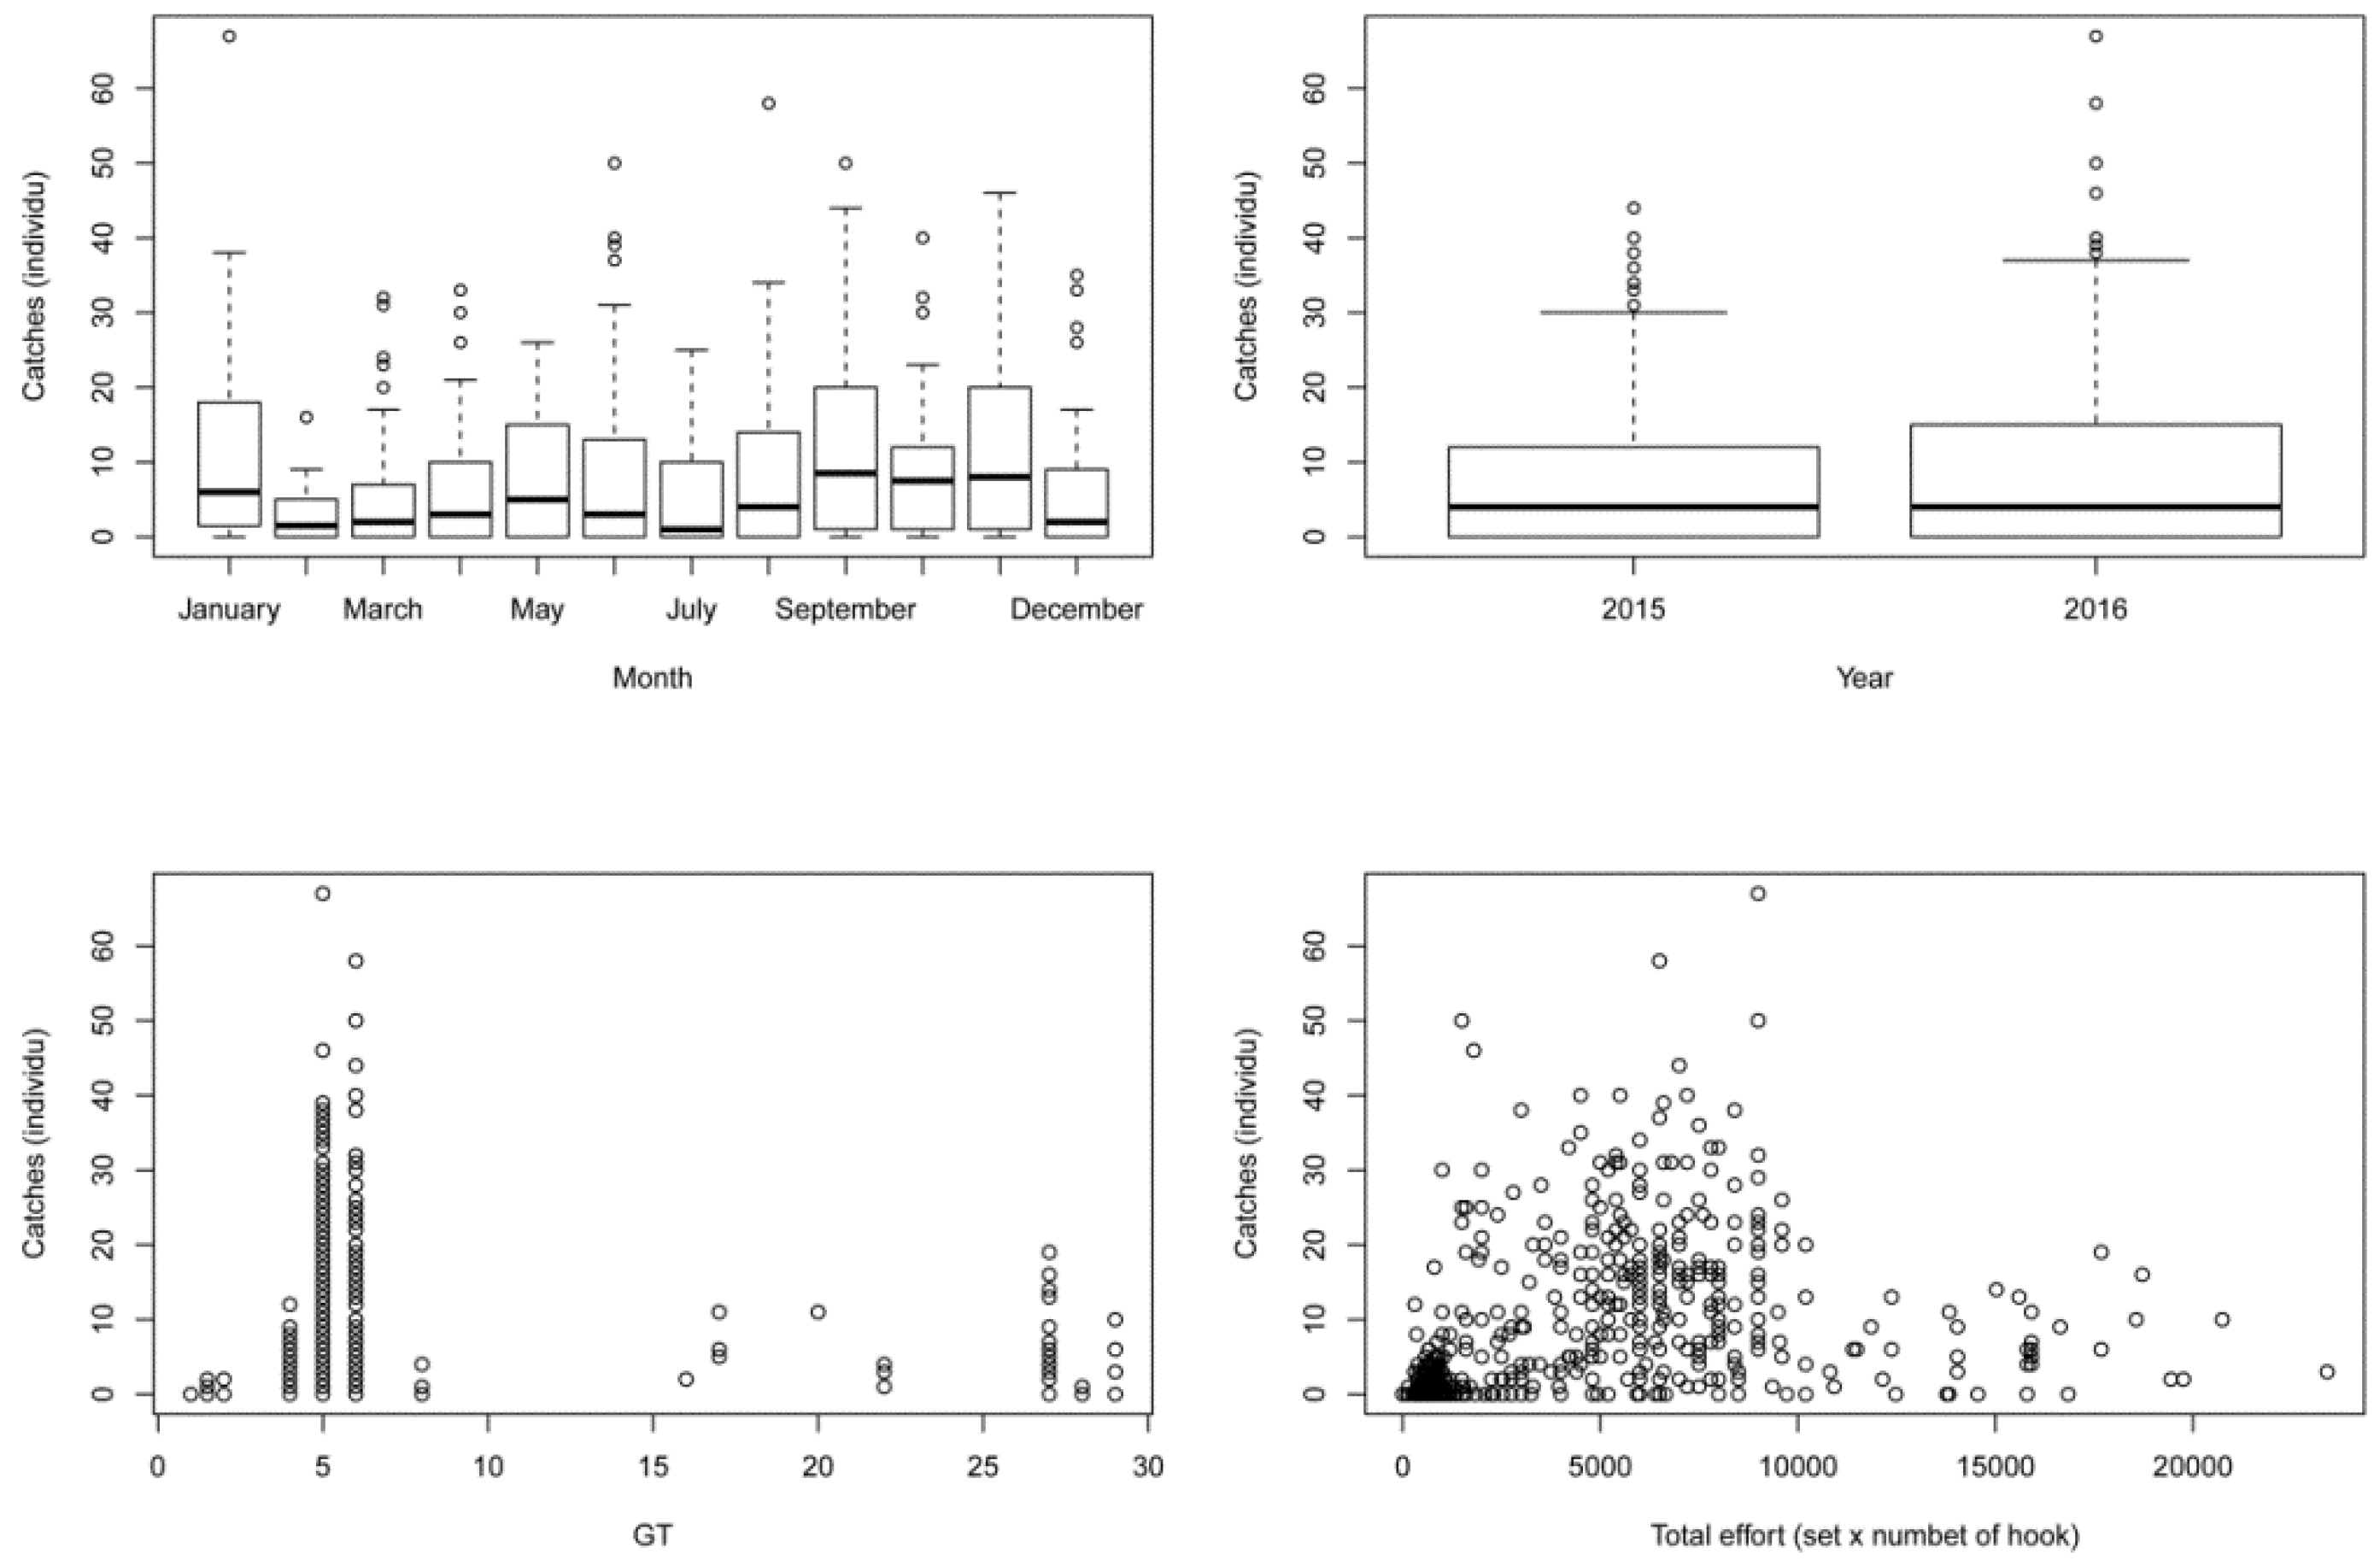
2.3. Factors Affecting Fishing Catches
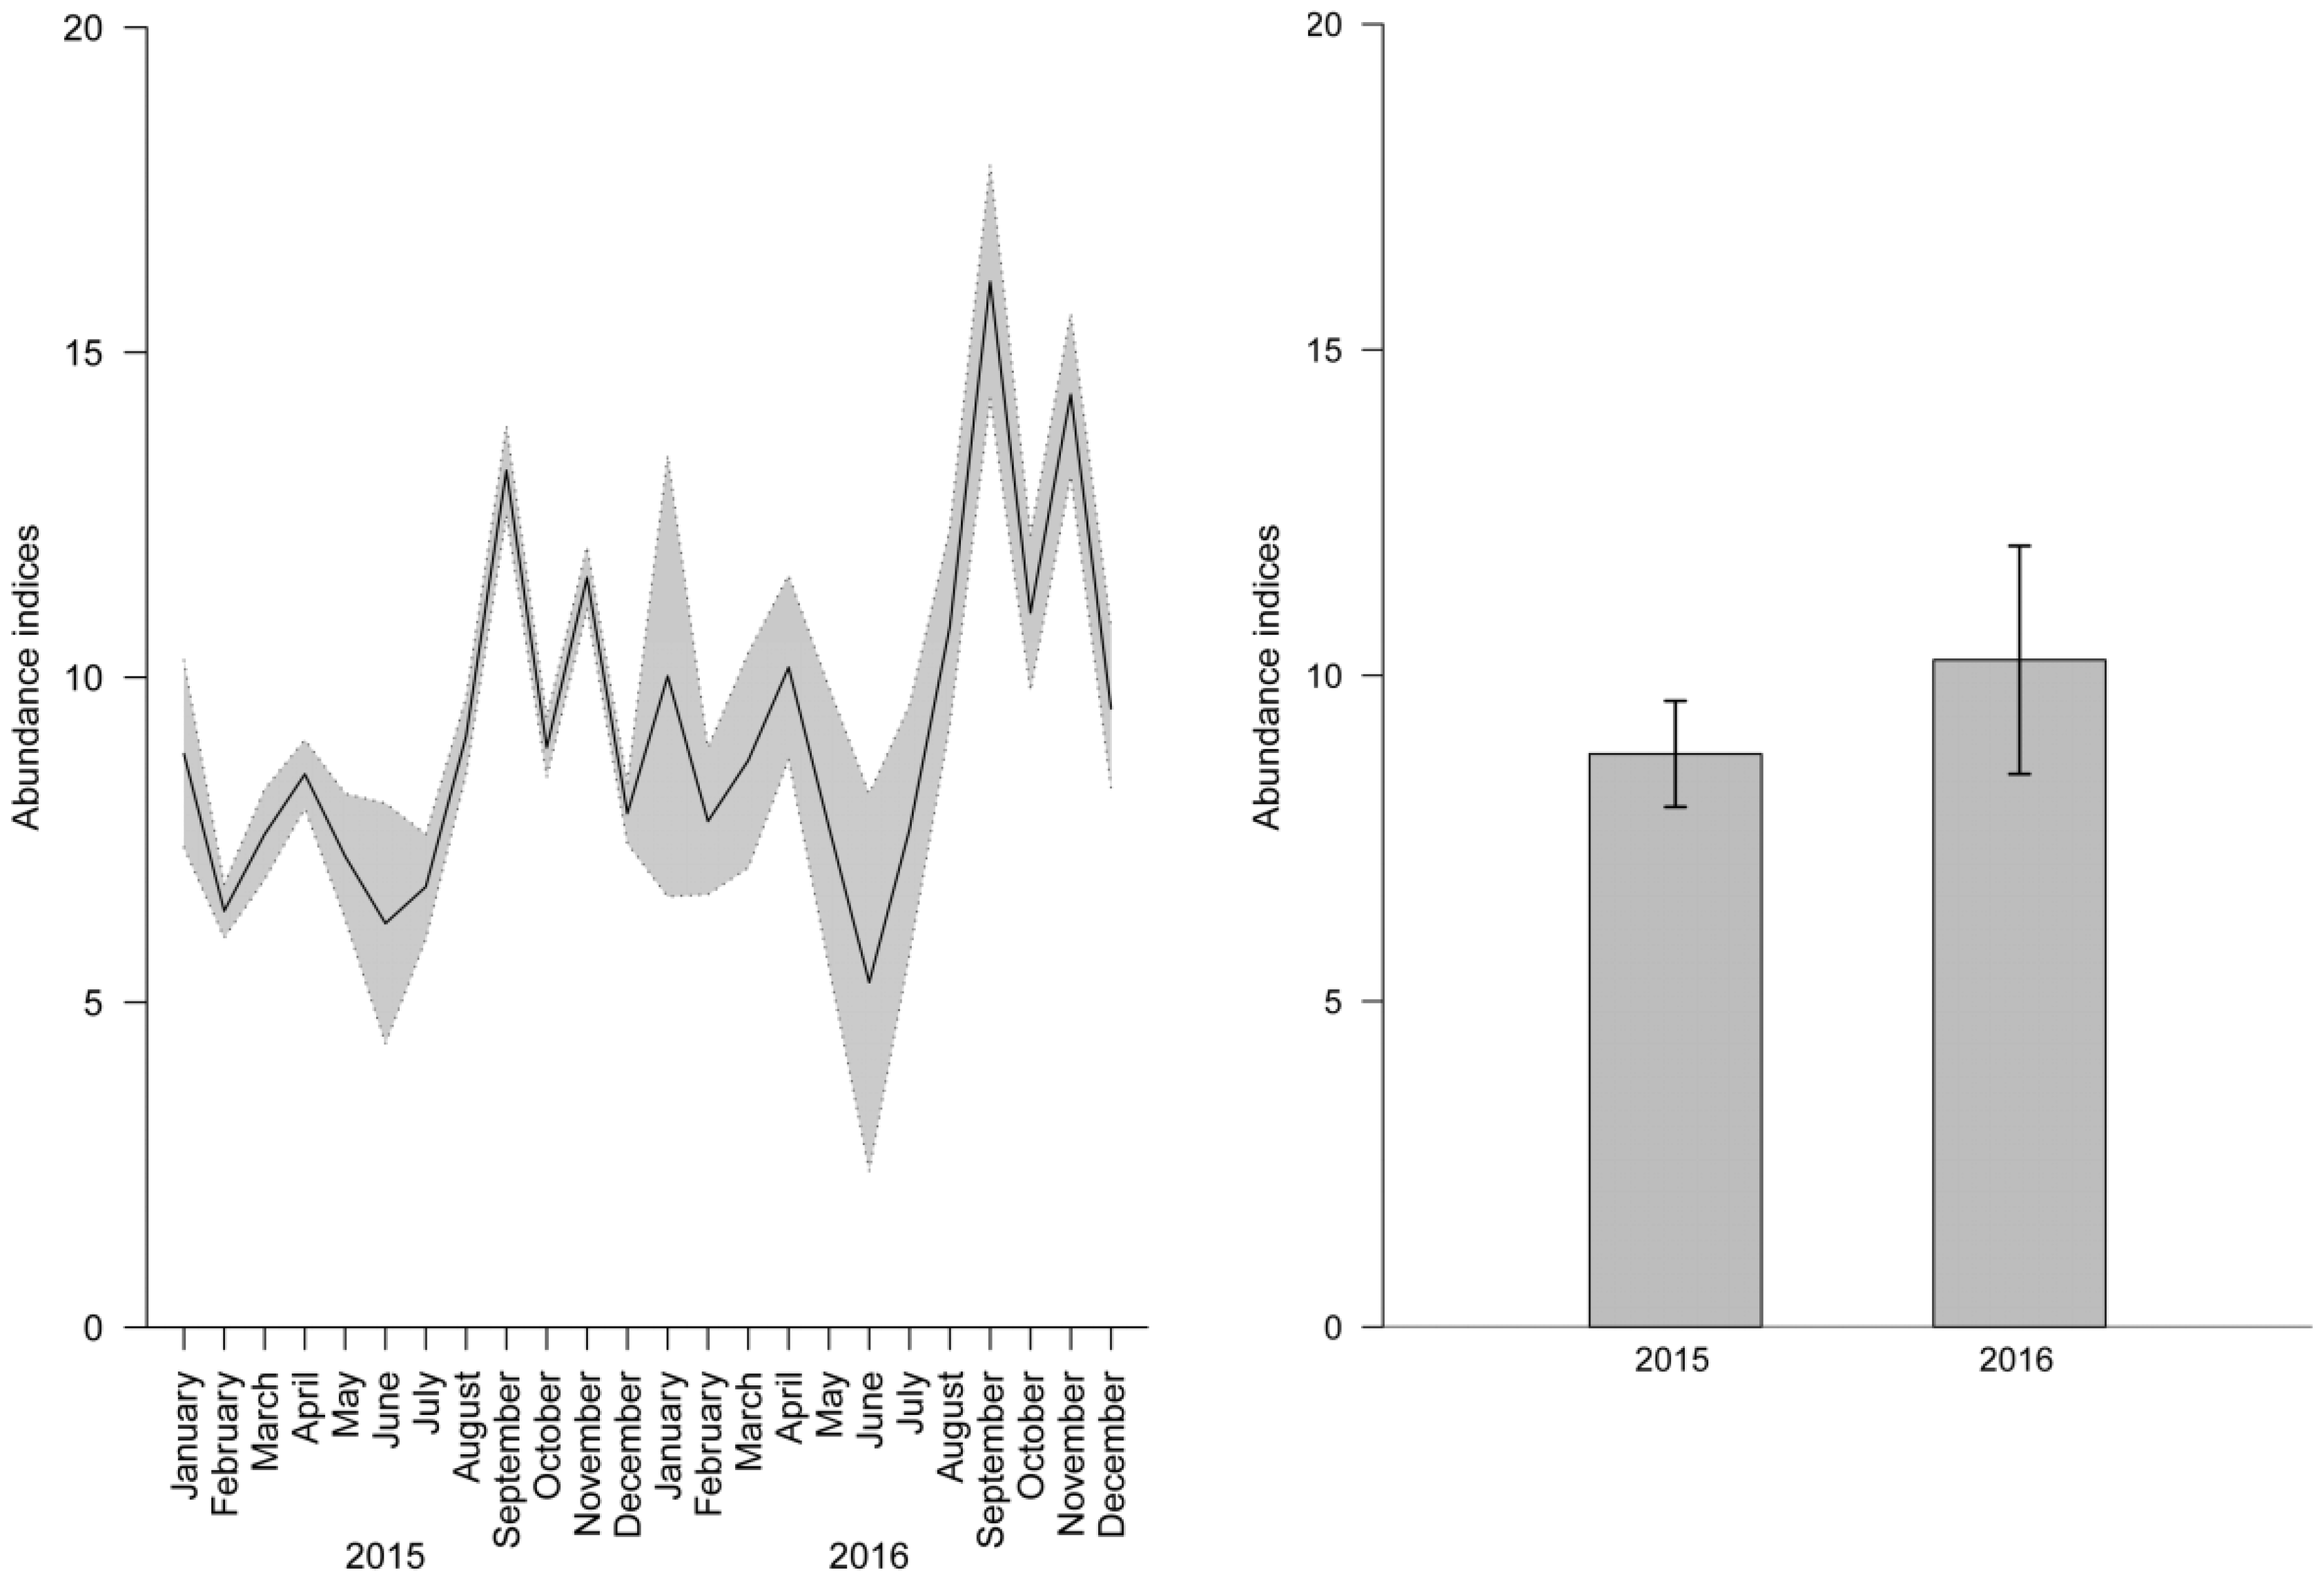
2.4. Abundance Indices
3. Discussion
4. Methods
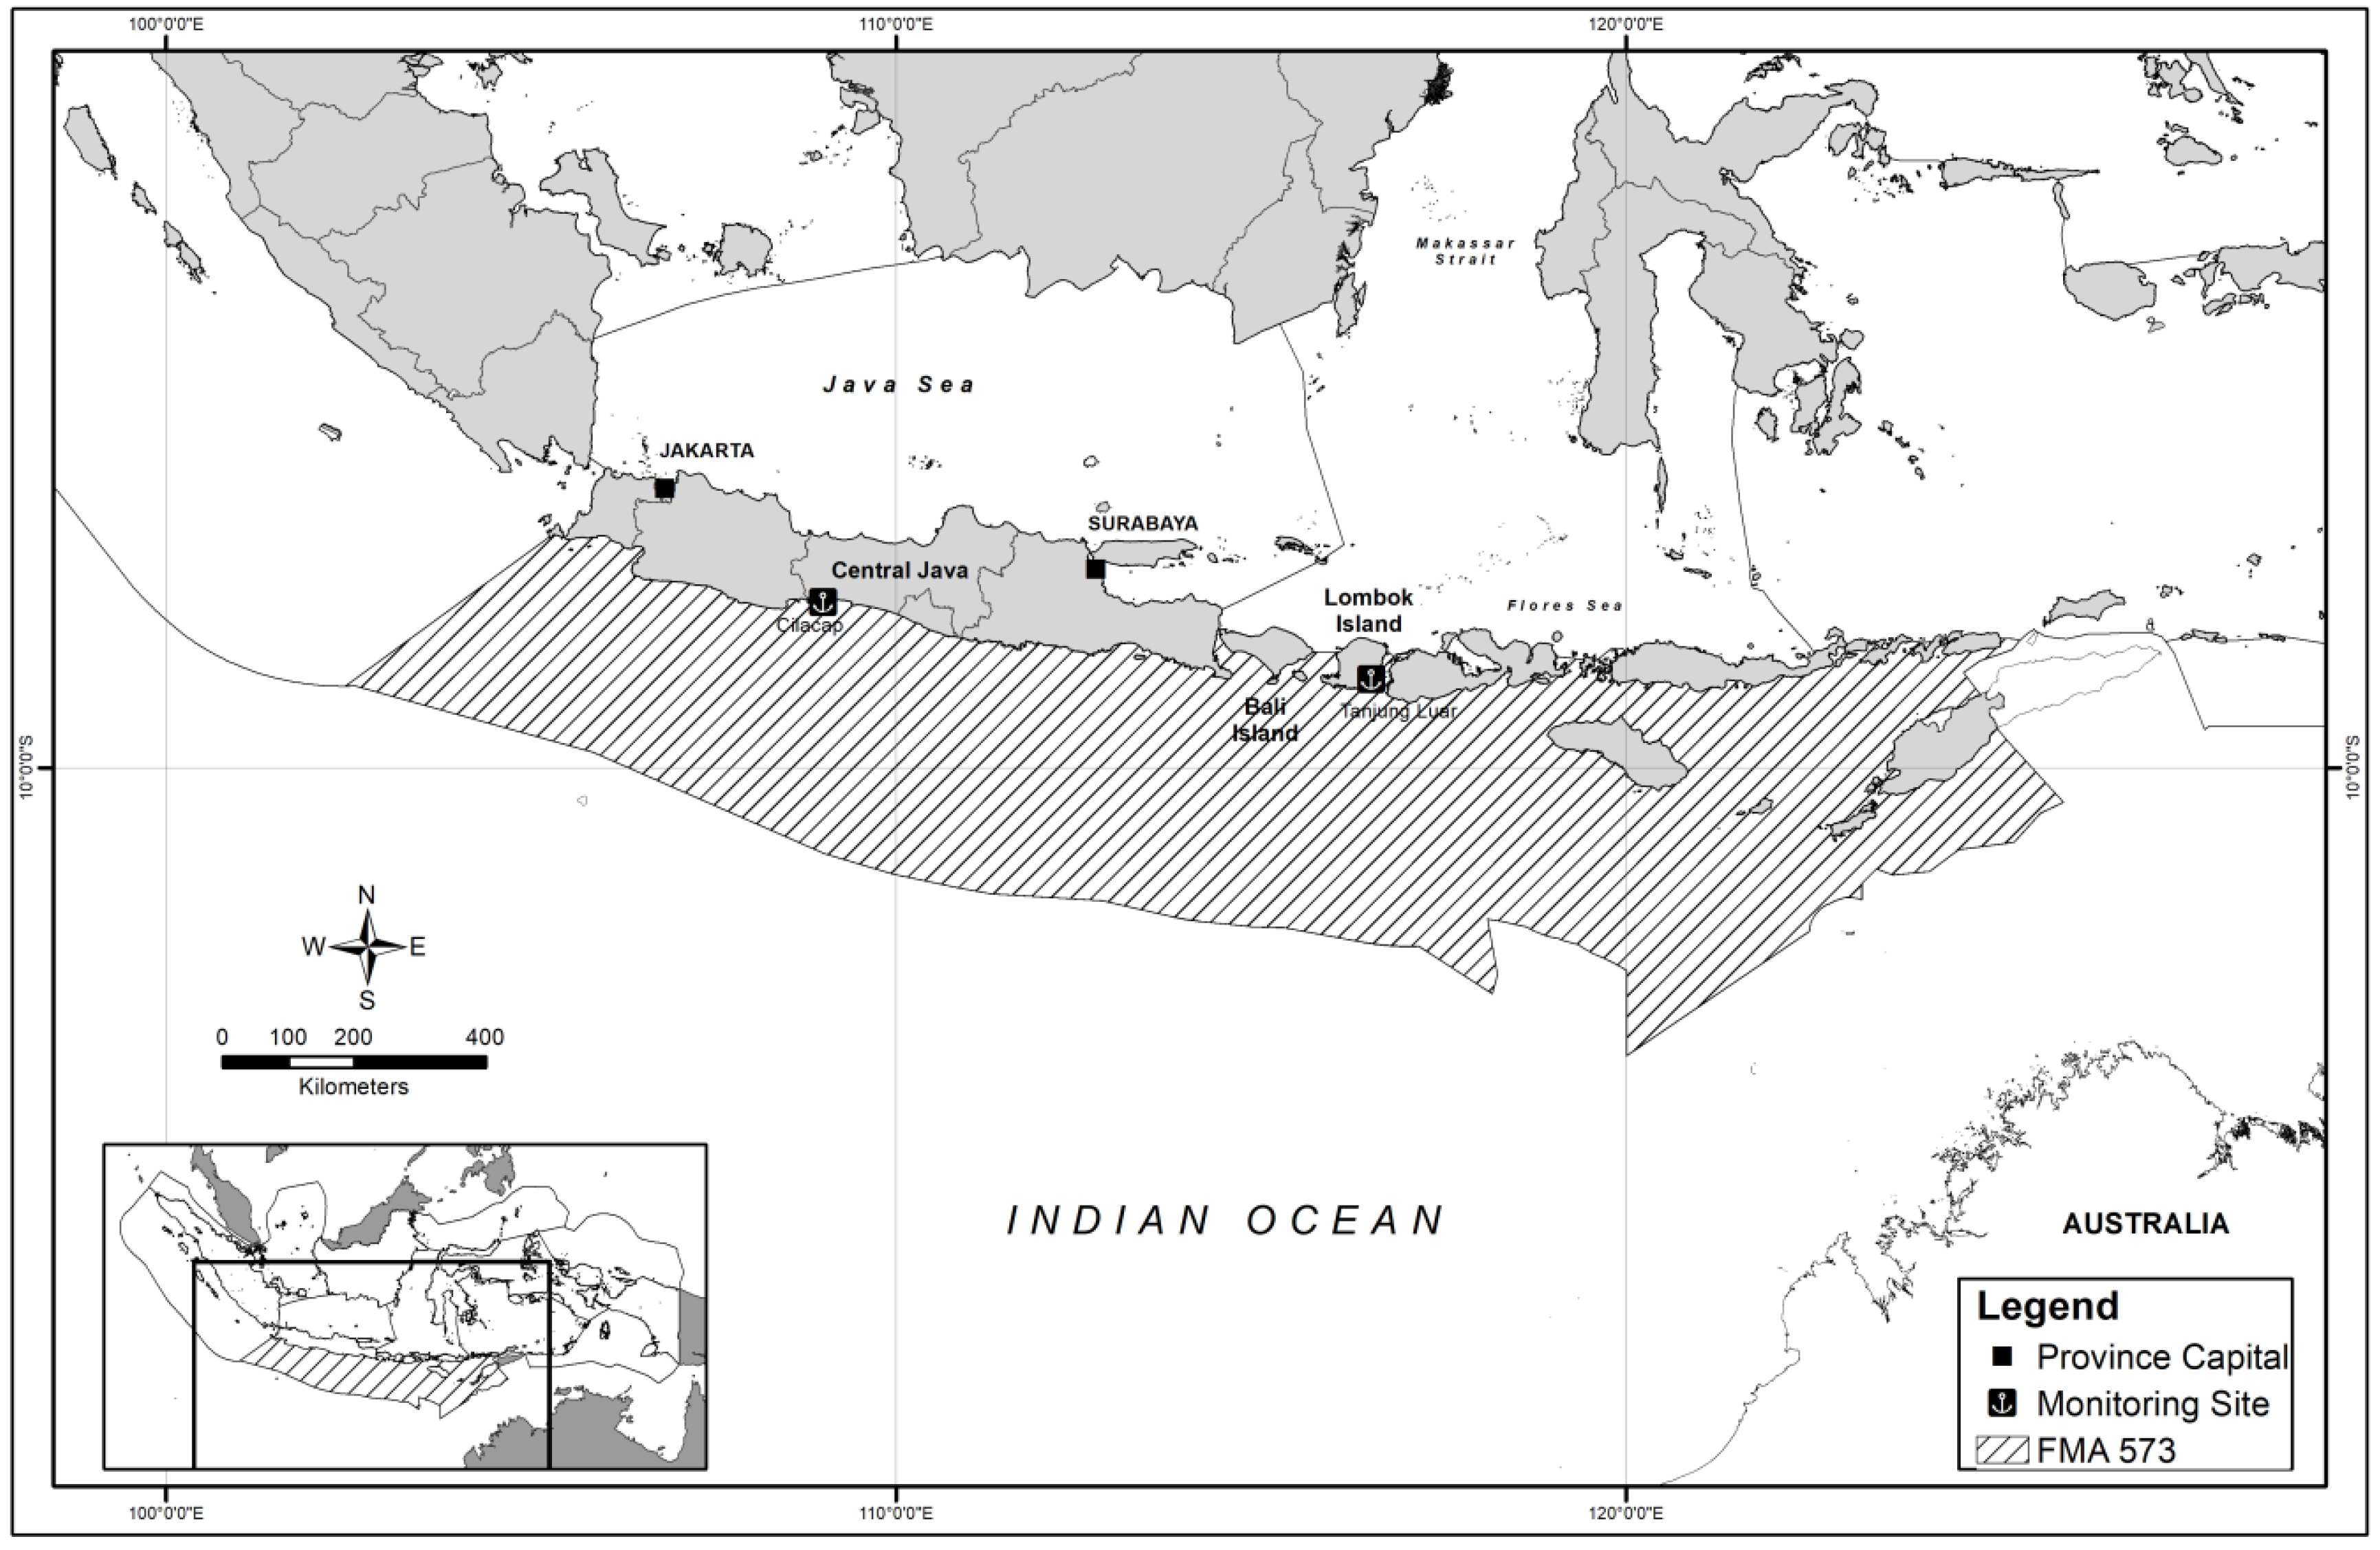
4.1. Site
4.2. Data Collection
4.3. Analysis
Author Contributions
Funding
Acknowledgments
Conflicts of Interest
References
- Stevens, J.D.; Bonfil, R.; Dulvy, N.K.; Walker, P.A. The effects of fishing on sharks, rays and chimaeras (chondrichthyans) and implications for marine ecosystems. ICES J. Mar. Sci. 2000, 57, 476–494. [Google Scholar] [CrossRef]
- Myers, R.A.; Baum, J.K.; Shepherd, T.D.; Powers, S.P.; Peterson, C.H. Cascading effects of the loss of apex predatory sharks from a coastal. Science 2007, 315, 1846–1850. [Google Scholar] [CrossRef] [PubMed]
- Ferretti, F.; Worm, B.; Britten, G.L.; Heithaus, M.R.; Lotze, H. Patterns and ecosystem consequences of shark declines in the ocean. Ecol. Lett. 2010, 13, 1055–1071. [Google Scholar] [CrossRef] [PubMed]
- Bornatowski, H.; Braga, R.R.; Bilhoa, V.; Correa, M.F. Feeding ecology and trophic comparisons of six shark species in a coastal ecosystem off southern Brazil. J. Fish Biol. 2014, 85, 246–263. [Google Scholar] [CrossRef] [PubMed]
- Hutchings, J.A. Collapse and recovery of marine fishes. Nature 2000, 406, 882–885. [Google Scholar] [CrossRef] [PubMed]
- Simpfendorfer, C.A.; Hueter, R.E.; Bergman, U.; Connett, S.M.H. Results of a fishery-independent survey for pelagic sharks in the western North Atlantic, 1977–1994. Fish. Res. 2002, 55, 175–192. [Google Scholar] [CrossRef]
- Dudley, S.F.J.; Simpfendorfer, C.A. Population status of 14 shark species caught in the protective gillnets off KwaZulu-Natal beaches, South Africa, 1978–2003. Mar. Freshw. Res. 2006, 57, 225–240. [Google Scholar] [CrossRef]
- Dulvy, N.K.; Fowler, S.L.; Musick, J.A.; Cavanagh, R.D.; Kyne, P.M.; Harrison, L.R.; Carlson, J.K.; Davidson, L.N.K.; Fordham, S.V.; Francis, M.P.; et al. Extinction risk and conservation of the world’s sharks and rays. eLife 2014, 3, e00590. [Google Scholar] [CrossRef] [PubMed]
- Compagno, L.J.V. FAO Species Catalogue. Sharks of the World; Food and Agriculture Organization of the United Nations: Rome, Italy, 1984; Volume 4. [Google Scholar]
- Rigby, C.L.; Sherman, C.S.; Chin, A.; Simpfendorfer, C. Carcharhinus falciformis, Silky Shark. IUCN Red List Threat. Spec. 2017, e.T39370A117721799. [Google Scholar] [CrossRef]
- Rice, J.; Harley, S. Updated stock assessment of silky sharks in the western and central pacific ocean. In Proceedings of the Scientific Committee Ninth Regular Session, Pohmpei, Federated States of Micronesia, 6–14 August 2013. WCPFC-SC9-2013/SA-WP-03. [Google Scholar]
- Food and Agriculture Organization of the United Nations. Available online: http://www.fao.org/fishery/species/2021/en (accessed on 20 April 2017).
- CITES. Proposal for amendment of Appendices I and II. In Seventeenth meeting of the Conference of the Parties, Johannesburg, South Africa), 24 September–October 2016; CoP17 Prop 42. Available online: https://cites.org/sites/default/files/eng/cop/17/prop/060216/E-CoP17-Prop-42.pdf (accessed on 8 June 2018).
- Ministry of Marine Affairs and Fisheries. Fisheries Statistics Data; MMAF: Jakarta, Indonesia, 2015.
- Fahmi; Dharmadi. Pelagic shark fisheries of Indonesia’s Eastern Indian ocean fisheries management region. Afr. J. Mar. Sci. 2015, 37, 259–265. [Google Scholar] [CrossRef]
- Simeon, B.M.; Agustina, S.; Muttaqin, E.; Ichsan, M.; Yulianto, I. Technical Report Sharks and Rays Fisheries in West Nusa Tenggara; Wildlife Conservation Society: Bogor, Indonesia, 2017. [Google Scholar]
- Sentosa, A.A.; Dharmadi, D. Lombok catch and relative abundance of some sharks landing in Tanjung Luar. Widyariset 2017, 3, 131–142. [Google Scholar] [CrossRef]
- IOTC. Status of the Indian Ocean Silky Shark (FAL: Carcharhinus Falciformis); IOTC: Victoria Mahé, Seychelles, 2016. [Google Scholar]
- Poisson, F.; Filmalter, J.D.; Vernet, A.L.; Dagorn, L. Mortality rate of silky sharks (Carcharhinus falciformis) caught in the tropical tuna purse seine fishery in the Indian Ocean. Can. J. Fish. Aquat. Sci. 2014, 71, 795–798. [Google Scholar] [CrossRef]
- Maunder, M.N.; Starr, P.J. Fitting fisheries models to standardised CPUE abundance indices. Fish. Res. 2003, 63, 43–50. [Google Scholar] [CrossRef]
- Campbell, R.A. CPUE Standardisation and the construction of indices of stock abundance in a spatially varying fishery using general linear models. Fish. Res. 2004, 70, 209–227. [Google Scholar] [CrossRef]
- Campbell, R.A. Constructing stock abundance indices from catch and effort data: Some nuts and bolts. Fish. Res. 2015, 161, 109–130. [Google Scholar] [CrossRef]
- Baum, J.K.; Myers, R.A. Shifting baselines and the decline of pelagic sharks in the Gulf of Mexico. Ecol. Lett. 2004, 7, 135–145. [Google Scholar] [CrossRef]
- Ministry of Marine Affairs and Fisheries. Fisheries Statistics Data; Directorate General of Capture Fisheries of MMAF: Jakarta, Indonesia, 2016; 325p.
- Anderson, R.C.; Juaharee, R. Opinions Count: Declines in Abundance of Silky Sharks in the Central Indian Ocean Reported by Maldivian Fishermen. Indian Ocean Tuna Commission. 2009. IOTC2009-WPEB-08(2009). Available online: http://iotc.org/sites/default/files/documents/proceedings/2009/wpeb/IOTC2009-WPEB-08.pdf (accessed on 27 February 2018).
- Peterson, C.D.; Parsons, K.T.; Bethea, D.M.; William, B.D., III; Latour, R.J. Community interactions and density dependence in the southeast United States coastal shark complex. Mar. Ecol. Prog. Ser. 2017, 579, 81–96. [Google Scholar] [CrossRef]
- Curtis, T.H.; McCandless, C.T.; Carlson, J.K.; Skomal, G.B.; Kohler, N.E.; Natanson, L.J.; George, H.B.; Hoey, J.J.; Pratt, H.L., Jr. Seasonal distribution and historic trends in abundance of white sharks, Carcharodon carcharias, in the western north Atlantic Ocean. PLoS ONE 2014, 9, e99240. [Google Scholar] [CrossRef] [PubMed]
- Simeon, B.M. Kondisi dan Dampak Penangkapan Hiu Kejen. (Carcharhinus falciformis) Terhadap Ekosistem: Kasus Perikanan hiu di Muncar. Master Thesis, Graduated School, Bogor Agricultural University, Bogor, Indonesia, 30 June 2016. [Google Scholar]
- Cadena-Cardenas, L. Biologia Reproductiva de Carcharhinus falciformis (Chondrichtyes: Carcharhiniformes: Carcharhinidae), en el Golfo de California. Bachelor’s Thesis, Departemento de Biologia Marina, Universidad Autonoma de Baja California Sur, La Paz, Mexico, 2001. [Google Scholar]
- Bonfil, R. The Biology and Ecology of the Silky Shark, Carcharhinus falciformis. In Sharks of the Open Ocean: Biology, Fisheries and Conservation; Blackwell Publishing: Oxford, UK, 2008. [Google Scholar] [CrossRef]
- Simeon, B.M.; Muttaqin, E.; Ichsan, M.; Tarigan, S.; Hernawati; Yulianto, I. Technical Report: Critical Habitat of Sharks and Rays in Lunyuk, Sumbawa, West Nusa Tenggara Province; Wildlife Conservation Society-Indonesia Program: Bogor, Indonesia, 2018. [Google Scholar]
- Filmalter, J.D.; Dagorn, L.; Cowley, P.D.; Taquet, M. First descriptions of the behavior of silky sharks, Carcharhinus falciformis, around drifting fish aggregating devices in the Indian Ocean, using acoustic telemetry. Bull. Mar. Sci. 2011, 87, 325–337. [Google Scholar] [CrossRef]
- Last, P.R.; Stevens, J.D. Sharks and Rays of Australia; CSIRO: Victoria, Australia, 1984. [Google Scholar]
- Bonfil, R.; Mena, R.; de Anda, D. Biological Parameters of Commercially Exploited Silky Sharks, Carcharhinus Falciformis, from the Campeche Bank, Mexico; NOAA Technical Report NMFS; National Marine Fisheries Service: Silver Spring, MD, USA, 1993.
- Henderson, A.C.; Mcllwain, J.L.; Al-Oufi, H.S.; Al-Sheile, S.; Al-Abri, N. Size distributions and sex ratios of sharks caught by Oman’s artisanal fishery. Afr. J. Mar. Sci. 2009, 31, 233–239. [Google Scholar] [CrossRef]
- Cabral, R.B.; Mayorga, J.; Clemence, M.; Lynham, J.; Koeshendrajana, S.; Muawanah, U.; Nugroho, D.; Anna, Z.; Ghofar, A.; Zulbainarni, N.; et al. Rapid and lasting gains from solving illegal fishing. Nat. Ecol. Evol. 2018, 2, 650–658. [Google Scholar] [CrossRef] [PubMed]
- Nurlaili, R.M.; Hikmayani, Y. Policy impact moratorium on business fisheries sector in Bitung. J. Kebijak. Sosek Kelaut. Perikan. 2016, 6, 145–152. [Google Scholar] [CrossRef]
- Rahmayanti, A.Z.; Cahyono, B.D.; Nadjib, M. Implikasi kebijakan moratorium terhadap sektor perikanan di Bitung. J. Ekon. Pembang. 2017, 25, 1–14. [Google Scholar] [CrossRef]
- Hikmayani, Y.; Rahadian, R.; Nurlaili, N.; Muhartono, R. Efektivitas pemberlakuan kebijakan moratorium kapal eks asing dan transhipment terhadap kinerja usaha penangkapan ikan. J. Kebijak. Sos. Ekon. Kelaut. Perikan. 2015, 5, 101–112. [Google Scholar] [CrossRef]
- Barker, M.J.; Schluessel, V. Managing global shark fisheries: Suggestions for prioritizing management strategies. Aquat. Conserv. Mar. Freshwat. Ecosyst. 2005, 15, 325–347. [Google Scholar] [CrossRef]
- Romanov, E.V. Bycatch in the tuna purse-seine fisheries of the western Indian Ocean. Fish. Bull. 2002, 100, 90–105. [Google Scholar]
- Beerkircher, L.; Shivji, M.; Cortes, E. A Monte Carlo demographic analysis of silky shark (Carcharhinus falciformis): Implication of gear selectivity. Fish. Bull. 2002, 101, 168–174. [Google Scholar]
- Hutchinson, M.R.; Itano, D.G.; Muir, J.A.; Holland, K.N. Post-release survival of juvenile silky sharks captured in a tropical tuna purse seine fishery. Mar. Ecol. Prog. Ser. 2015, 521, 143–154. [Google Scholar] [CrossRef] [Green Version]
- Dharmadi; Fahmi; Satria, F. Fisheries management and conservation of sharks in Indonesia. Afr. J. Mar. Sci. 2015, 37, 249–258. [Google Scholar] [CrossRef]
- Lack, M.; Sant, G. Trends in World Shark Catch, Production and Trade, 1990–2003. Australian Government Department of the Environment and Heritage and TRAFFIC Oceania. 2006. Available online: http://www.traffic.org/fish/ (accessed on 13 March 2015).
- Purwanto, J. Status and management of the Java Sea fisheries. In Assessment Management and Future Directions for Coastal Fisheries in Asian Countries; Silvestre, G., Garces, L., Stobutzki, I., Eds.; World Fish Conference Proceeding; World Fish Center: Penang, Malaysia, 2003; Volume 67, pp. 1–120. [Google Scholar]
- White, W.T.; Last, P.R.; Stevens, J.D.; Yearsley, G.K.; Fahmi; Dharmadi. Economically Important Sharks & Rays of Indonesia; Australian Centre for International Agricultural Research: Canberra, Australia, 2006. [Google Scholar]
- Pinheiro, J.; Bates, D.; DebRoy, S.; Sarkar, D.; R Core Team. Nlme: Linear and Nonlinear Mixed Effects Models. R Package Version 3.1-131. 2017. Available online: https://CRAN.R-project.org/package=nlme> (accessed on 3 November 2017).
- Venables, W.N.; Ripley, B.D. Modern Applied Statistics with S, 4th ed.; Springer: New York, NY, USA, 2002; ISBN 0-387-95457-0. [Google Scholar]
- Pratama, M.A.D.; Hapsari, T.D.; Triarso, I. Factors affecting the production of purse seine unit in fishing base Muncar fishing port Banyuwangi, East Java. J. Saintek Perikan. 2016, 11, 120–128. [Google Scholar]
- Lenth, R.V. Least-Squares Means: The R Package lsmeans. J. Stat. Softw. 2016, 69, 1–33. [Google Scholar] [CrossRef]
- Shono, H. Confidence interval estimation of CPUE year trend in delta-type two-step model. Fish. Sci. 2008, 74, 712–717. [Google Scholar] [CrossRef] [Green Version]
- R Core Team. R: A Language and Environment for Statistical Computing; R Foundation for Statistical Computing: Vienna, Austria, 2017; Available online: https://www.R-project.org/ (accessed on 3 November 2017).


| Covariates | Df Deviance | Residuals | Df Residuals | Deviance | p-Value |
|---|---|---|---|---|---|
| NULL | 420 | 649.87 | |||
| Year | 1 | 38.849 | 419 | 611.02 | 4.58 × 10⁻¹⁰ |
| Month | 11 | 65.416 | 408 | 545.61 | 9 × 10⁻¹⁰ |
| GT | 1 | 41.188 | 407 | 504.42 | 1.38 × 10⁻¹⁰ |
| Gear | 1 | 77.787 | 406 | 426.63 | <2.2 × 10⁻¹⁶ |
| Item | Measured Variable | Type of Data | Description |
|---|---|---|---|
| Fishing techniques | Year | Categorical | Year of trip (2015–2016) |
| Month | Categorical | Month of trip (January–December) | |
| Date | Categorical | ||
| Gross tonnage | Numeric | Ship’s overall internal volume | |
| Fishing gear | Categorical | Fishing gear used | |
| Deployment days | Numeric | Number of times primary fishing gear was deployed | |
| Number of hook | Numeric | Number of hook which used in longline | |
| Catch composition | Length | Numeric | Total length |
| Sex | Categorical | Female and male | |
| Species | Categorical | Referring to White et al. [47] |
| No | Models | Family | Model | AIC |
|---|---|---|---|---|
| 1 | Linear Model | N/A | Catch ~ Month + GT + Year + total effort | 3036 |
| 2 | Generalized Least Squares | N/A | Catch ~ Month + GT + Year + total effort | 3022 |
| 3 | Generalized Least Squares | N/A | Catch ~ Month + GT + Year + total effort, varIdent(form = ~ 1 | Month) | 2989 |
| 4 | Generalized Least Squares | N/A | Catch ~ Month + GT + Year + total effort, varIdent(form = ~ 1 | Year) | 2998 |
| 5 | Generalized Linear Model | Poisson | Catch ~ Month + Year + GT + total effort | 3605 |
| 6 | Generalized Linear Model | Poisson with overdispersal | Catch ~ Month + Year + GT + total effort | N/A |
| 7 | Generalized Linear Model | Negative-Binomial | Count ~ Month + Year + total effort | 2873 |
| 8 | Generalized Linear Model | Negative-Binomial | Catch ~ Month + Year + GT + total effort | 2801.579 |
| 9 | Generalized Linear Model | Negative-Binomial | Catch ~ Year + Month + GT + Gear + offset(log10(total effort)) | 2687.649 |
© 2018 by the authors. Licensee MDPI, Basel, Switzerland. This article is an open access article distributed under the terms and conditions of the Creative Commons Attribution (CC BY) license (http://creativecommons.org/licenses/by/4.0/).
Share and Cite
Simeon, B.M.; Muttaqin, E.; Mardhiah, U.; Ichsan, M.; Dharmadi; Prasetyo, A.P.; Fahmi; Yulianto, I. Increasing Abundance of Silky Sharks in the Eastern Indian Ocean: Good News or a Reason to be Cautious? Fishes 2018, 3, 29. https://doi.org/10.3390/fishes3030029
Simeon BM, Muttaqin E, Mardhiah U, Ichsan M, Dharmadi, Prasetyo AP, Fahmi, Yulianto I. Increasing Abundance of Silky Sharks in the Eastern Indian Ocean: Good News or a Reason to be Cautious? Fishes. 2018; 3(3):29. https://doi.org/10.3390/fishes3030029
Chicago/Turabian StyleSimeon, Benaya Meitasari, Efin Muttaqin, Ulfah Mardhiah, Muhammad Ichsan, Dharmadi, Andhika Prima Prasetyo, Fahmi, and Irfan Yulianto. 2018. "Increasing Abundance of Silky Sharks in the Eastern Indian Ocean: Good News or a Reason to be Cautious?" Fishes 3, no. 3: 29. https://doi.org/10.3390/fishes3030029
APA StyleSimeon, B. M., Muttaqin, E., Mardhiah, U., Ichsan, M., Dharmadi, Prasetyo, A. P., Fahmi, & Yulianto, I. (2018). Increasing Abundance of Silky Sharks in the Eastern Indian Ocean: Good News or a Reason to be Cautious? Fishes, 3(3), 29. https://doi.org/10.3390/fishes3030029