Article

Shifts in Eastern Mediterranean Fish Communities: Abundance Changes, Trait Overlap, and Possible Competition between Native and Non-Native Species

1
Department 1, Anhalt University of Applied Sciences, D-06406 Bernburg, Germany
2
School of Zoology, George S. Wise Faculty of Life Sciences, Tel Aviv University, Tel Aviv 69978, Israel
3
National Institute of Oceanography, Tel-Shikmona, Haifa 31080, Israel
4
Department of Fisheries and Aquaculture, Ministry of Agriculture and Rural Development, Beit-Dagan 50250, Israel
5
The Steinhardt Museum of Natural History, Tel Aviv University, Tel Aviv 69978, Israel
*
Author to whom correspondence should be addressed.
Fishes 2018, 3(2), 19; https://doi.org/10.3390/fishes3020019
Submission received: 22 December 2017 / Revised: 8 April 2018 / Accepted: 13 April 2018 / Published: 20 April 2018

Abstract

:
During the last few decades the fish community has changed substantially along the Eastern Mediterranean continental shelf, which is a hotspot of invasion by species that had migrated via the Suez Canal. Trawl data from the Israeli coast spanning two periods (1990–1994 and 2008–2011) were compared to identify species with substantial variation in their relative abundance between the two periods. The aim of this study was to examine if certain ecological traits characterize fish species showing an increase or decrease in relative abundance, and if non-indigenous fishes with strongly increasing populations may have caused the decline of native species with similar habitats and diets. We found that the main predictors of population trends were species length, habitat affinity, and maximum depth, with larger and soft bottom species displaying decreasing abundances. Comparing native and non-indigenous fishes with similar habitat and diet, we found a potential for competitive impact of the Indo-Pacific Plotosus lineatus and two Upeneus spp. on the native Mullus species. However, competition with non-indigenous fishes could not generally explain the dramatic decline of many other native species between the two study periods. Alternative causes, such as fishery pressure and increasing water temperature, are discussed.

1. Introduction

Changes in marine fish communities, i.e., shifts in species composition or a decrease in abundance, have been a main focus of study over the last few decades. Profound changes were observed in a wide range of marine regions from subarctic to tropical zones [1,2,3,4]. These have mainly been attributed to climate change [5,6,7], fishery pressure [8,9,10,11], and habitat degradation or loss [12,13,14]. Fishery pressure and habitat degradation often operate in tandem [14,15], as do climate change and habitat degradation [6,16,17].
One region where considerable changes in fish communities has occurred is the Eastern Mediterranean Sea. Indo-Pacific fishes immigrated to the Levantine basin and increased the total number of Mediterranean fishes significantly [18,19,20,21,22], currently including as much as 90% of total fish biomass in some habitats of the Eastern Mediterranean [18,23,24]. Though Indo-Pacific fishes may arrive at the Levantine basin in a number of ways, immigration via the Suez Cannel (so-called Lessepsian invasion) is the most likely path. The Suez Canal was opened in 1869 and since the first report of Indo-Pacific fishes from the vicinity of Port Said by Tillier [25], the number of immigrants increased progressively [20,26].
The Mediterranean continental shelf and upper slope of the Israeli coast is part of the region where a profound change in the fish community has been observed [27]. Edelist et al. [27] compared earlier (1990–1994) and more recent (2008–2011) trawl surveys and found an increasing proportion of Lessepsian fishes, i.e., non-indigenous fish species that had migrated via the Suez Canal. Whereas only six non-indigenous species, totaling of 25% of individuals were found to be among the 20 most common benthic and benthopelagic fishes in the first study period, their proportion had increased to 11 species totaling 49.2% of individuals 15 years later. During the same period, proportions of many native and some non-indigenous species declined [28].
While the change in the fish community of the Eastern Mediterranean is well documented, the causes and driving forces for the observed shifts seem to be less understood. For example, a strong impact of non-indigenous marine fishes on native fish species was often suggested, but rarely tested (see Golani [29] for a summary). The impact of predators may be significant, as shown in the case of the lionfish (Pterois spp.) in the Caribbean Sea [30,31,32]. However, in the examined habitats off the Israeli coast predation is unlikely to be the cause of fish decline, as none of the abundant Lessepsian species in the latter period are known as voracious fish predators with the ability to cause the collapse of native populations. Another possible reason for the shift in relative abundance between the periods 1990–1994 and 2008–2011 is that of the competitive exclusion of native fishes by immigrating non-indigenous fishes. Competitive displacement of native Mediterranean species was suggested, e.g., in the case of Merluccius merluccius by Saurida lessepsianus [33], native goatfishes (Mullus spp.) by non-native con-familiars [34], and Sarpa salpa by rabbitfishes (Siganus spp.) [35,36]. Competition between newly-appearing and native species may be possible if fishes co-occur spatio-temporally and simultaneously overlap in diet and habitat use. A strong overlap would imply competition between non-indigenous and native species, which could represent a possible reason for the decline of several native species. In a recent study, Givan et al. [28] compared the impact of three major anthropogenic drivers on fish abundances. They showed that, for shallow-water species, the most important driver of population size changes is sensitivity to climate change rather than competition with non-indigenous species. However, Givan et al. used a macro-ecological approach looking across the entire community and, hence, did not examine specific cases in which competition may have taken place. Thus, we are missing a more refined analysis that considers the development of the entire community on one side, but allows the identification of specific cases of competitive exclusion on the other side.
In this study, we combine first time trawl survey data between two periods [27] and trait data to address the following questions: (i) Which species showed an increase or decrease in relative abundance between 1990–1994 and 2008–2011? (ii) Can certain ecological traits be linked to species with increasing or decreasing populations? (iii) Do decreases in native species abundances coincide with increases in non-indigenous species with overlapping diet and habitat? The answers to these questions are of crucial importance for understanding the reasons underlying the population changes along the Israeli coast, and may be useful for predicting changes in soft-bottom communities in other parts of the Mediterranean Sea.

2. Results

The 45 considered fish species comprised 30 benthic and demersal and 15 pelagic fishes (Table 1). In the 1990–1994 period, Upeneus moluccensis constituted the most common trawled fish, and only six non-indigenous species belonged to the 25 most common trawled fishes. Thus, although non-indigenous species did not represent a new phenomenon in the period 2008–2011, their number has since doubled among the 25 most commonly trawled fishes.
Between the first and second trawl period, the proportion of 16 species increased by a factor of 2 or more. The proportions of ten species, all of them Red Sea immigrants, increased by a factor of 7 or higher. In contrast, the proportions of 14 species decreased between the two study periods by a factor of 2 or more, including 10 native and two non-indigenous fishes (Table 1). The strongest declines were observed in M. merluccius (6.7 fold), Mullus barbatus (7.7 fold), and a greater than one magnitude decline in Trigla lyra, Mullus surmuletus, Uranoscopus scaber, Trachurus picturatus, and Trachinus draco. T. picturatus is the only species with a proportion of >0.25% during the period 1990–1994 but which had disappeared completely by 2008–2011.

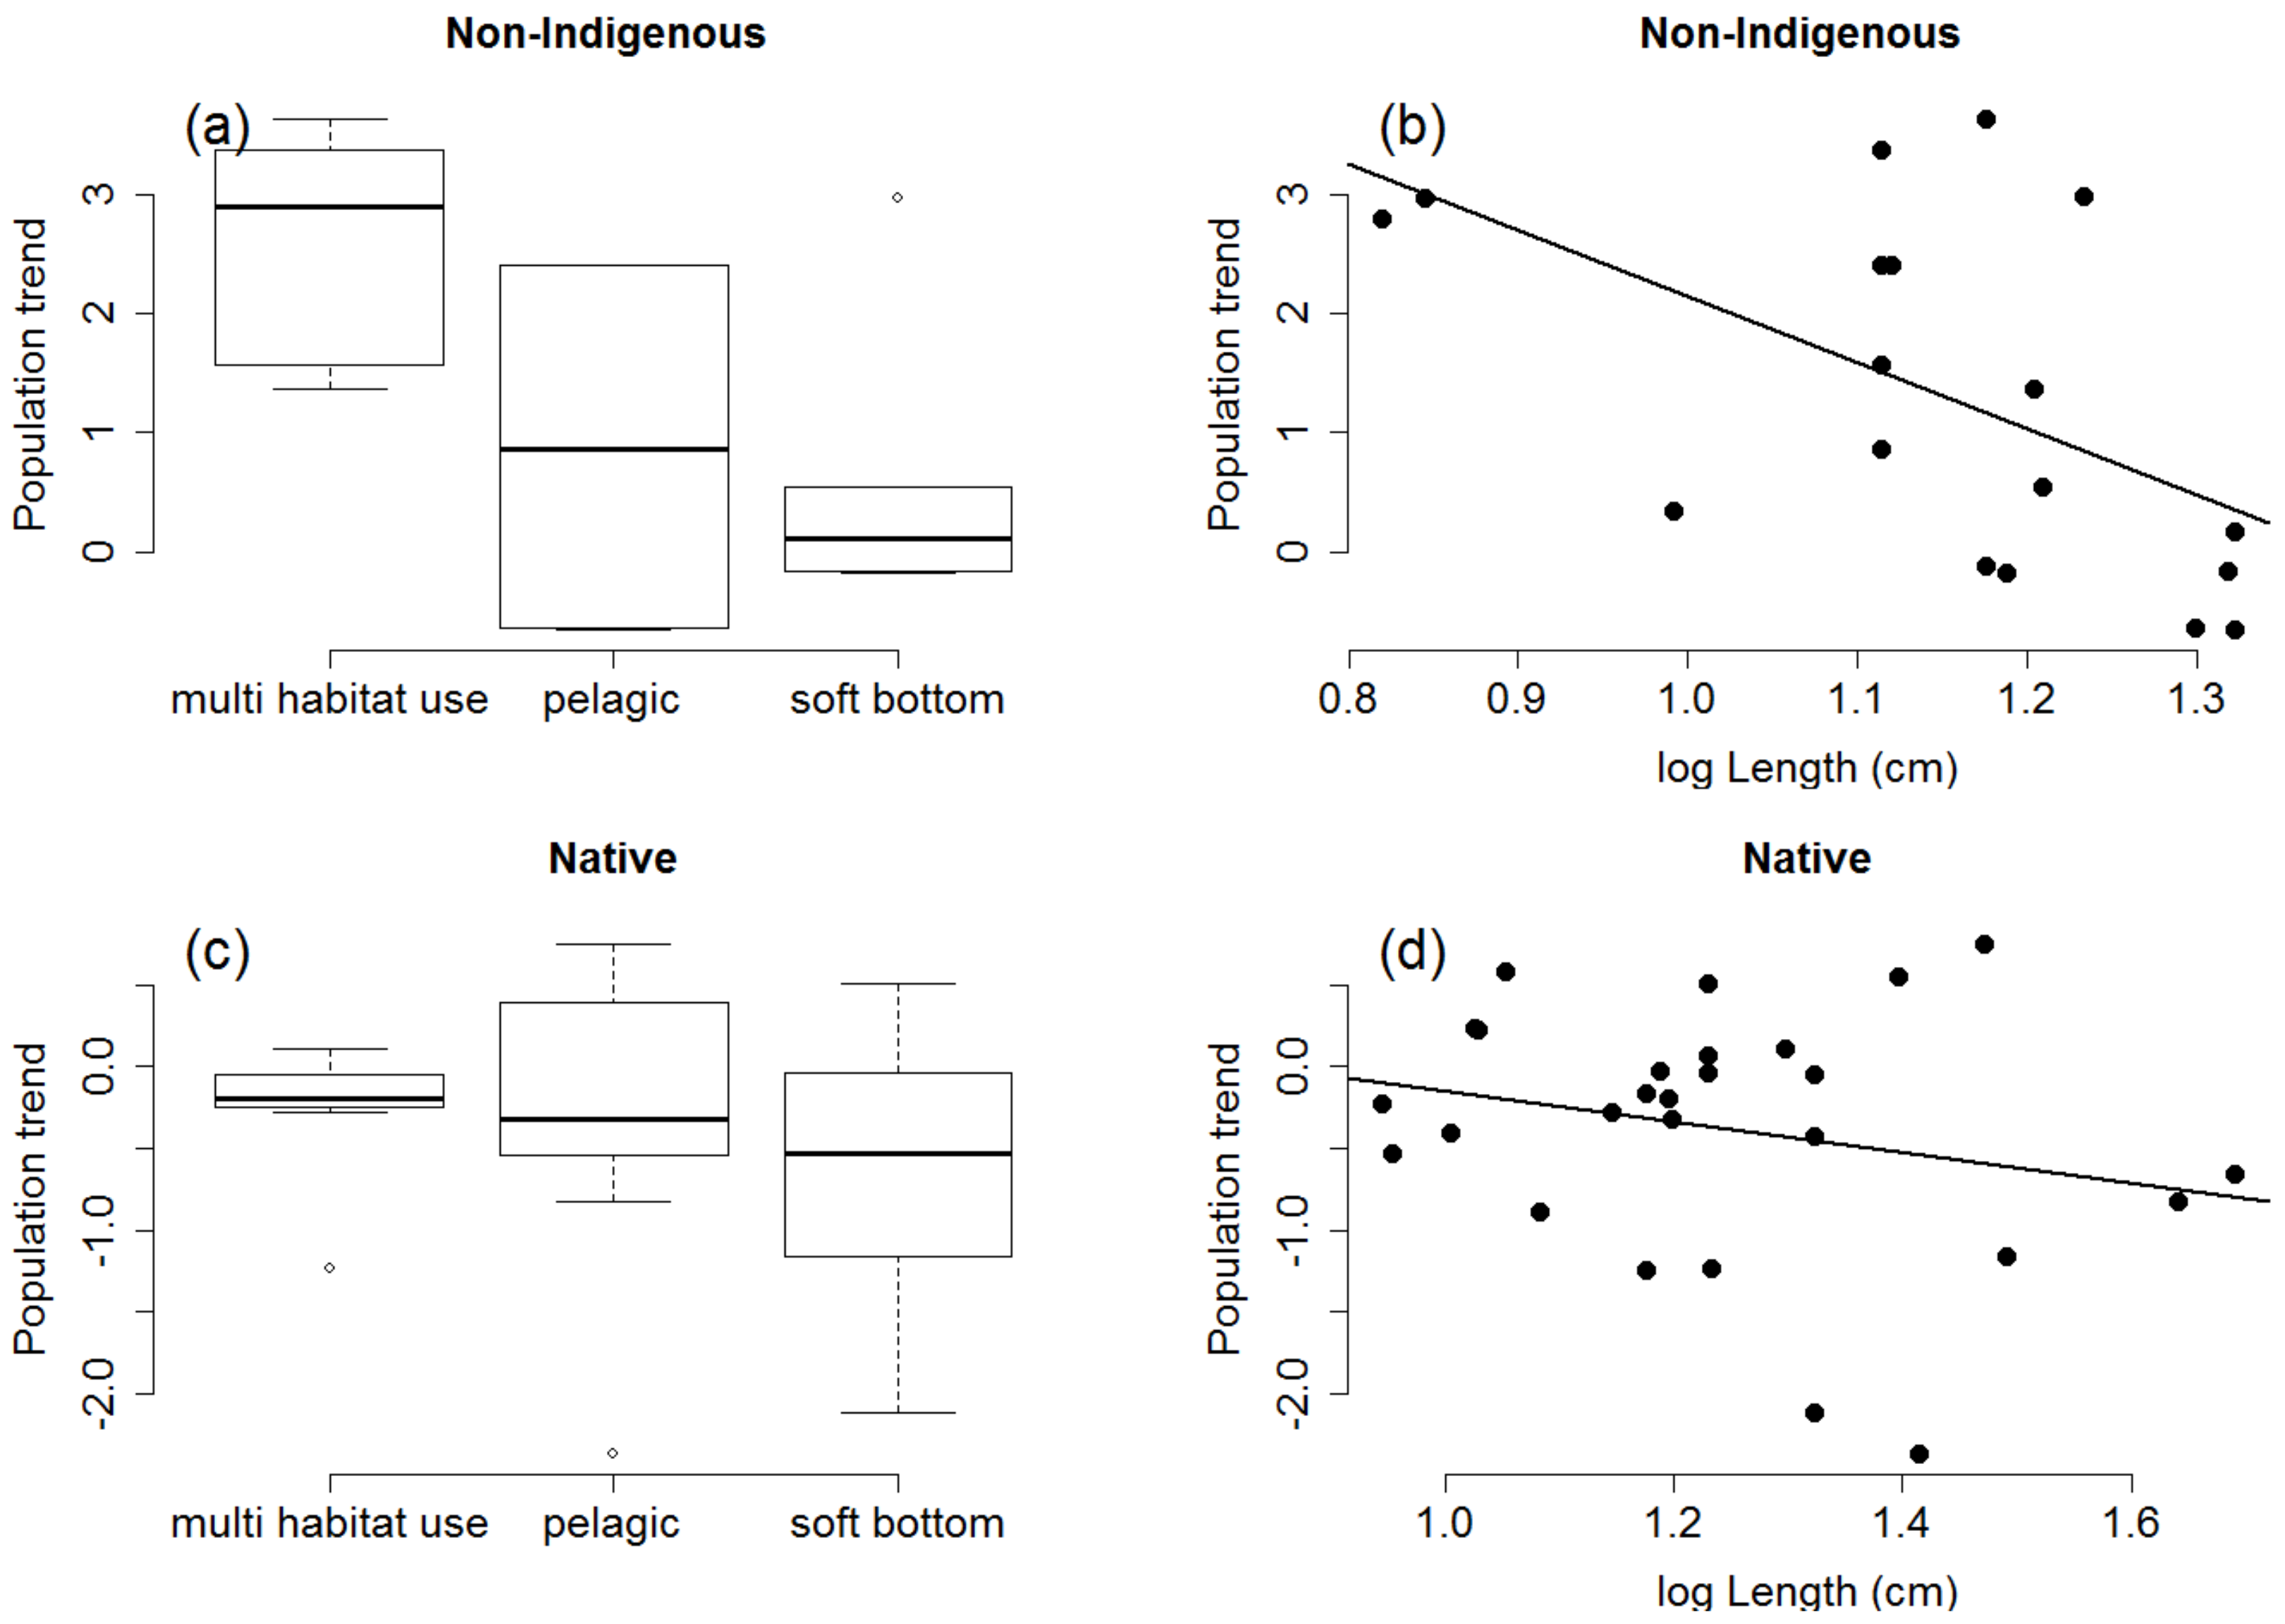
2.1. Species Traits Linked to Population Trends

When examining all species together, we find that all highly-supported models distinguished between native and non-indigenous species (Table 2). Hence, non-indigenous species population trends are higher than that of natives (Figure 1). Species length appeared as a predictor in almost all highly-supported models, with larger species showing more negative population trends. Maximum depth and habitat type (Table 2; Figure 1) were also well supported in the analyses of all species. Species at shallower depth and species using multiple habitats display more positive population trends. Other predictors appeared less strongly supported. For analyses containing native species only, we find that the best model contained the intercept only (Table 2), meaning that no predictor strongly explains their population trends.

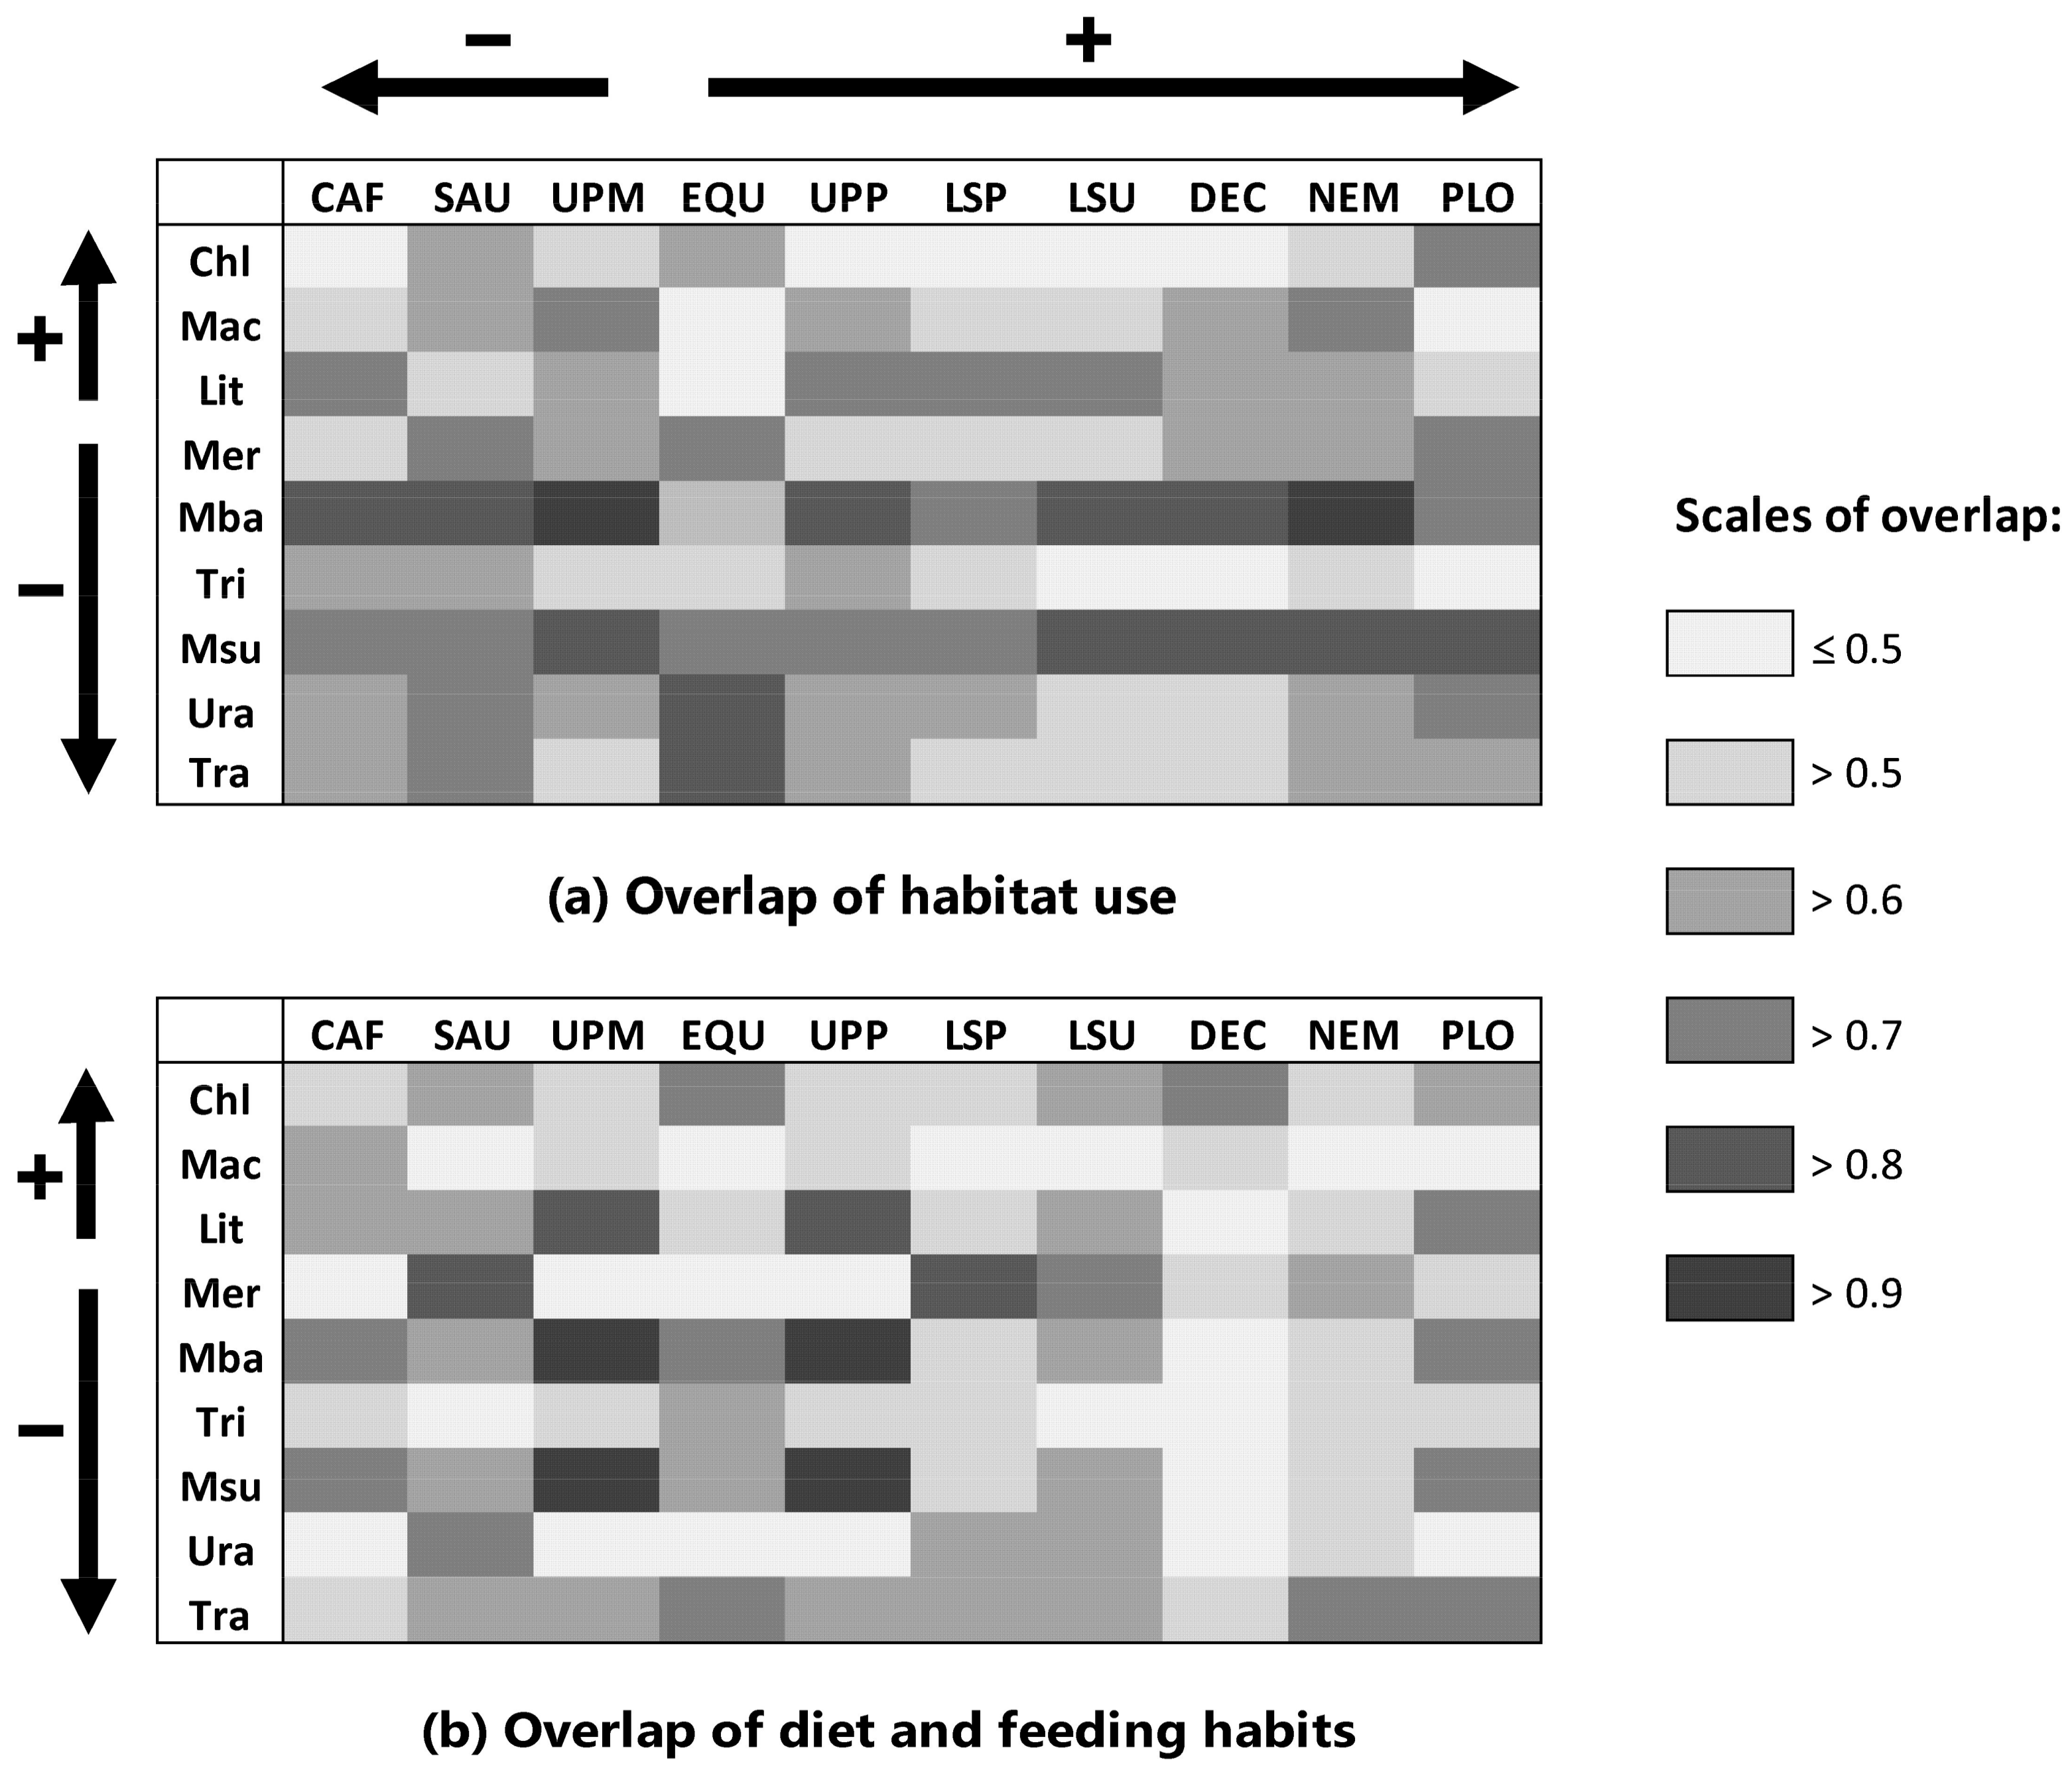
2.2. Estimation of Competition: Overlap in Habitat Use and Diet

The potential for competition was estimated by the overlap of habitat use and diet related traits in benthic and demersal fishes. Figure 2 shows the relations between six native species suffering the strongest declines between 1994 and 2008 and the co-occurring Indo-Pacific fishes. We found a high overlap in co-occurrence and traits between native M. barbatus and M. surmuletus and a group of non-indigenous species. The similarity indices imply an overlap >0.6 in both diet and habitat use between Upeneus spp. and Plotosus lineatus and the two native Mullus species (Figure 2) indicating possible competition. Additionally, all these species show a similar foraging strategy. The non-indigenous Equulites klunzingeri, Nemipterus randalli, and Lagocephalus spp. also have similar habitat requirements (i.e., depth range distribution) and overlap partially in diet with the native Mullus species. These fishes could possibly represent an additional disturbance of the native mullets.
The non-indigenous species exhibiting increasing populations do not overlap markedly with the declining M. merluccius, T. draco, T. lyra, U. scaber, or Pagellus erythrinus. At least in one group of traits (i.e., habitat use or diet related traits) the overlap is not higher than 0.56 in P. erythrinus and less than 0.5 in the other four species. Therefore, a strong competition between these native fishes and newcomers, e.g., P. lineatus or N. randalli, is not likely to have been the cause of the natives’ decline.

3. Discussion

3.1. Competitive Displacement of Native Species by Non-Indigenous Fishes

Strong competitive impacts of non-indigenous fishes on native species have been shown in freshwater systems [37,38,39,40,41,42,43]. However, in marine habitats such direct links between invasion and competitive exclusion are rarely evident. In parts of the Baltic and North Seas the euryhaline Ponto-Caspian Neogobius melanostomus competes for space, nesting sites and food resources with many co-inhabiting native benthic fish, e.g., Platichthys flesus, Pomatoschistus spp., and Gobius niger [44,45,46]. In subtropical and tropical brackish water habitats the Mayan cichlid Cichlasoma urophthalmus represents a strong competitor in the invaded habitat. Populations of Cyprinodon variegatus, Fundulus confluentus, and Gambusia holbrooki strongly decline in the presence of the Mayan cichlid [47].
The impact of the Lessepsian fishes has repeatedly been hypothesized to be linked to competitive displacement by native Mediterranean species [18,33,34,48]. However, Golani [29] questioned competition as a driver of population decline reasoning that scientific evidence is rare, the depth range distribution of native species prior to colonization of Lessepsian immigrants is often not thoroughly documented, and conclusions on impact are “speculative at best”. Invasive herbivorous rabbitfishes (Siganus luridus, S. rivulatus) profoundly alter their Mediterranean habitats by transforming rocks initially densely covered by erect algae into bare surfaces [49]. Thus, although their impact on macroalgal assemblages and, via habitat change, on the fish community is significant, direct competition with native fishes seems to be limited to S. salpa [35,36,50]. Elleouet et al. [51] proposed a trait-based approach for assessing and mapping potential niche overlap between native and exotic species at large spatial scales in the Mediterranean Sea. They studied the distribution of species, but not real species communities, and concluded that the examination of a specific area or species in terms of exotic threats needs more in-depth studies [51]. Our study started precisely at this point.
Contrary to our expectations, population declines of native species were not primarily associated with an increase in invasive species possessing similar traits. Rather, our examination of the dataset revealed that the number of declines associated with competition is probably very limited. We found that competitive exclusion is only possible in the case of the native mullets M. barbatus and M. surmuletus, caused by a group of non-indigenous fishes comprising Upeneus spp. and P. lineatus. Edelist et al. [27,52] suggested that the decrease of the Mediterranean T. draco might be due to the competition with the non-indigenous P. lineatus. However, this was not confirmed in our analysis. Neither the decline in T. draco nor that in M. merluccius, U. scaber, or P. erythrinus can be explained by increasing relative abundance of Red Sea species. The populations of the native fishes had already collapsed before the immigrants appeared (as evidenced by trawl data from 2000; Edelist [53] and their overlap in depth-range distribution, diet and habitat use is not high (see Figure 2). Thus, overall, we found only one well-established case in which declines can be reasonably associated with Red Sea immigrants.
Even though the Eastern Mediterranean Sea is a hotspot of species invasion, where nonindigenous fishes may reach more than 50% of fish biomass [54,55,56], the presence of a distinct link between Lessepsian invasion and native species decline is difficult to establish. This might imply that high impact invasive fishes are rare in marine systems or difficult to detect. Regarding the Eastern Mediterranean, the reason for the low impact might be that Indo-Pacific species tend to occupy unutilized ecological niches [57,58], thus reducing their direct impact on natives. Ecosystem engineering species, such as the above-mentioned rabbitfishes (Siganus spp.), may indirectly affect native species by modifying the seascape and, thus, could represent an exception to this widespread observation.

3.2. Alternative Causes for Species Decline

If competitive displacement does not explain the decrease in most native fishes, the question arises as to whether climate change or fishery pressure may better explain the community shift along the Israeli coast.
The length at first maturity (Lm) is significantly (p < 0.05) lower in the ten strongest increasing species, all of which are invasive (mean + standard deviation: 11.7 + 3.4 cm), compared to the 10 most decreasing fishes (24.6 + 12.2 cm), eight of which are native. This may suggest that fishing pressure has contributed to the decline in slow-growing species and thus indirectly benefitted fast-growing, mostly non-indigenous, species. Species with high growth rates and smaller size have a higher resilience to fishing [59,60,61]. Shifts in species composition were also described by Jennings et al. [10] and Daan et al. [11] in heavily exploited fish stocks of the North Sea. These shifts are often linked to a long-term change in trophic level (TL) due to ‘fishing down the marine food web’ [8,62]. However, there was no change in TL observed in the trawls off the Israeli coast between the periods 1990–1994 and 2008–2011 ([27]; confirmed by our analysis). Nevertheless, TLs do not necessarily change and may even increase in exploited areas (e.g., in the Western Mediterranean area [63,64]). Thus, whether fishing pressure has contributed to the decline of species during the study period or to the destabilization of the ecosystem, hence promoting the increase of fast-growing species, must currently remain an open question.
The Mediterranean Sea has been facing increasing sea surface temperatures (SST) over the last few decades, which could represent a driving force in the observed shifts of fish communities. Regarding native species, a northwards extension of native species distribution ranges due to increasing SST was observed for few species [65,66] and predicted for more species using species distribution models [67,68]. Furthermore, new evidence suggested that this northwards extension could be combined with a decline in abundance of some species in the southern part of their range [28]. A warming Mediterranean Sea may cause the migration of non-indigenous fishes of tropical origin [21,66,69,70], though a higher SST is not necessarily an important predictor for introduction or establishment success [26,71,72]. Along the Israeli coast, the abundance of several native species, e.g., T. draco and M. merluccius, had already declined along the Israeli coast between 1990–1994 and 2000 (Edelist) [53], in a period before the Indo-Pacific P. lineatus, N. randalli, or D. russelli were first recorded. Therefore, it is most likely that populations of several native species declined due to increasing SST, along with, or as part of, a synergic effect with other factors.

3.3. Caveats

With only two time periods available for examination, it is difficult to assess whether the observed ecological trends represent continuous long-term shifts in community composition. Nevertheless, we feel that the long duration of each sampling period (three to four years), as well as the large spatial and temporal scales (i.e., all seasons, trawling during the day and at night), make each sampling period sufficient to represent the community composition at the time they were performed. We acknowledge that our relative abundance data do not enable detection of changes in absolute abundance. Thus, strong fishing pressure, for example, may cause a decline in the absolute abundance of many species but reveal little detectable patterns in terms of relative abundance changes. This is a caveat to keep in mind when interpreting the recorded trawl data.

4. Materials and Methods

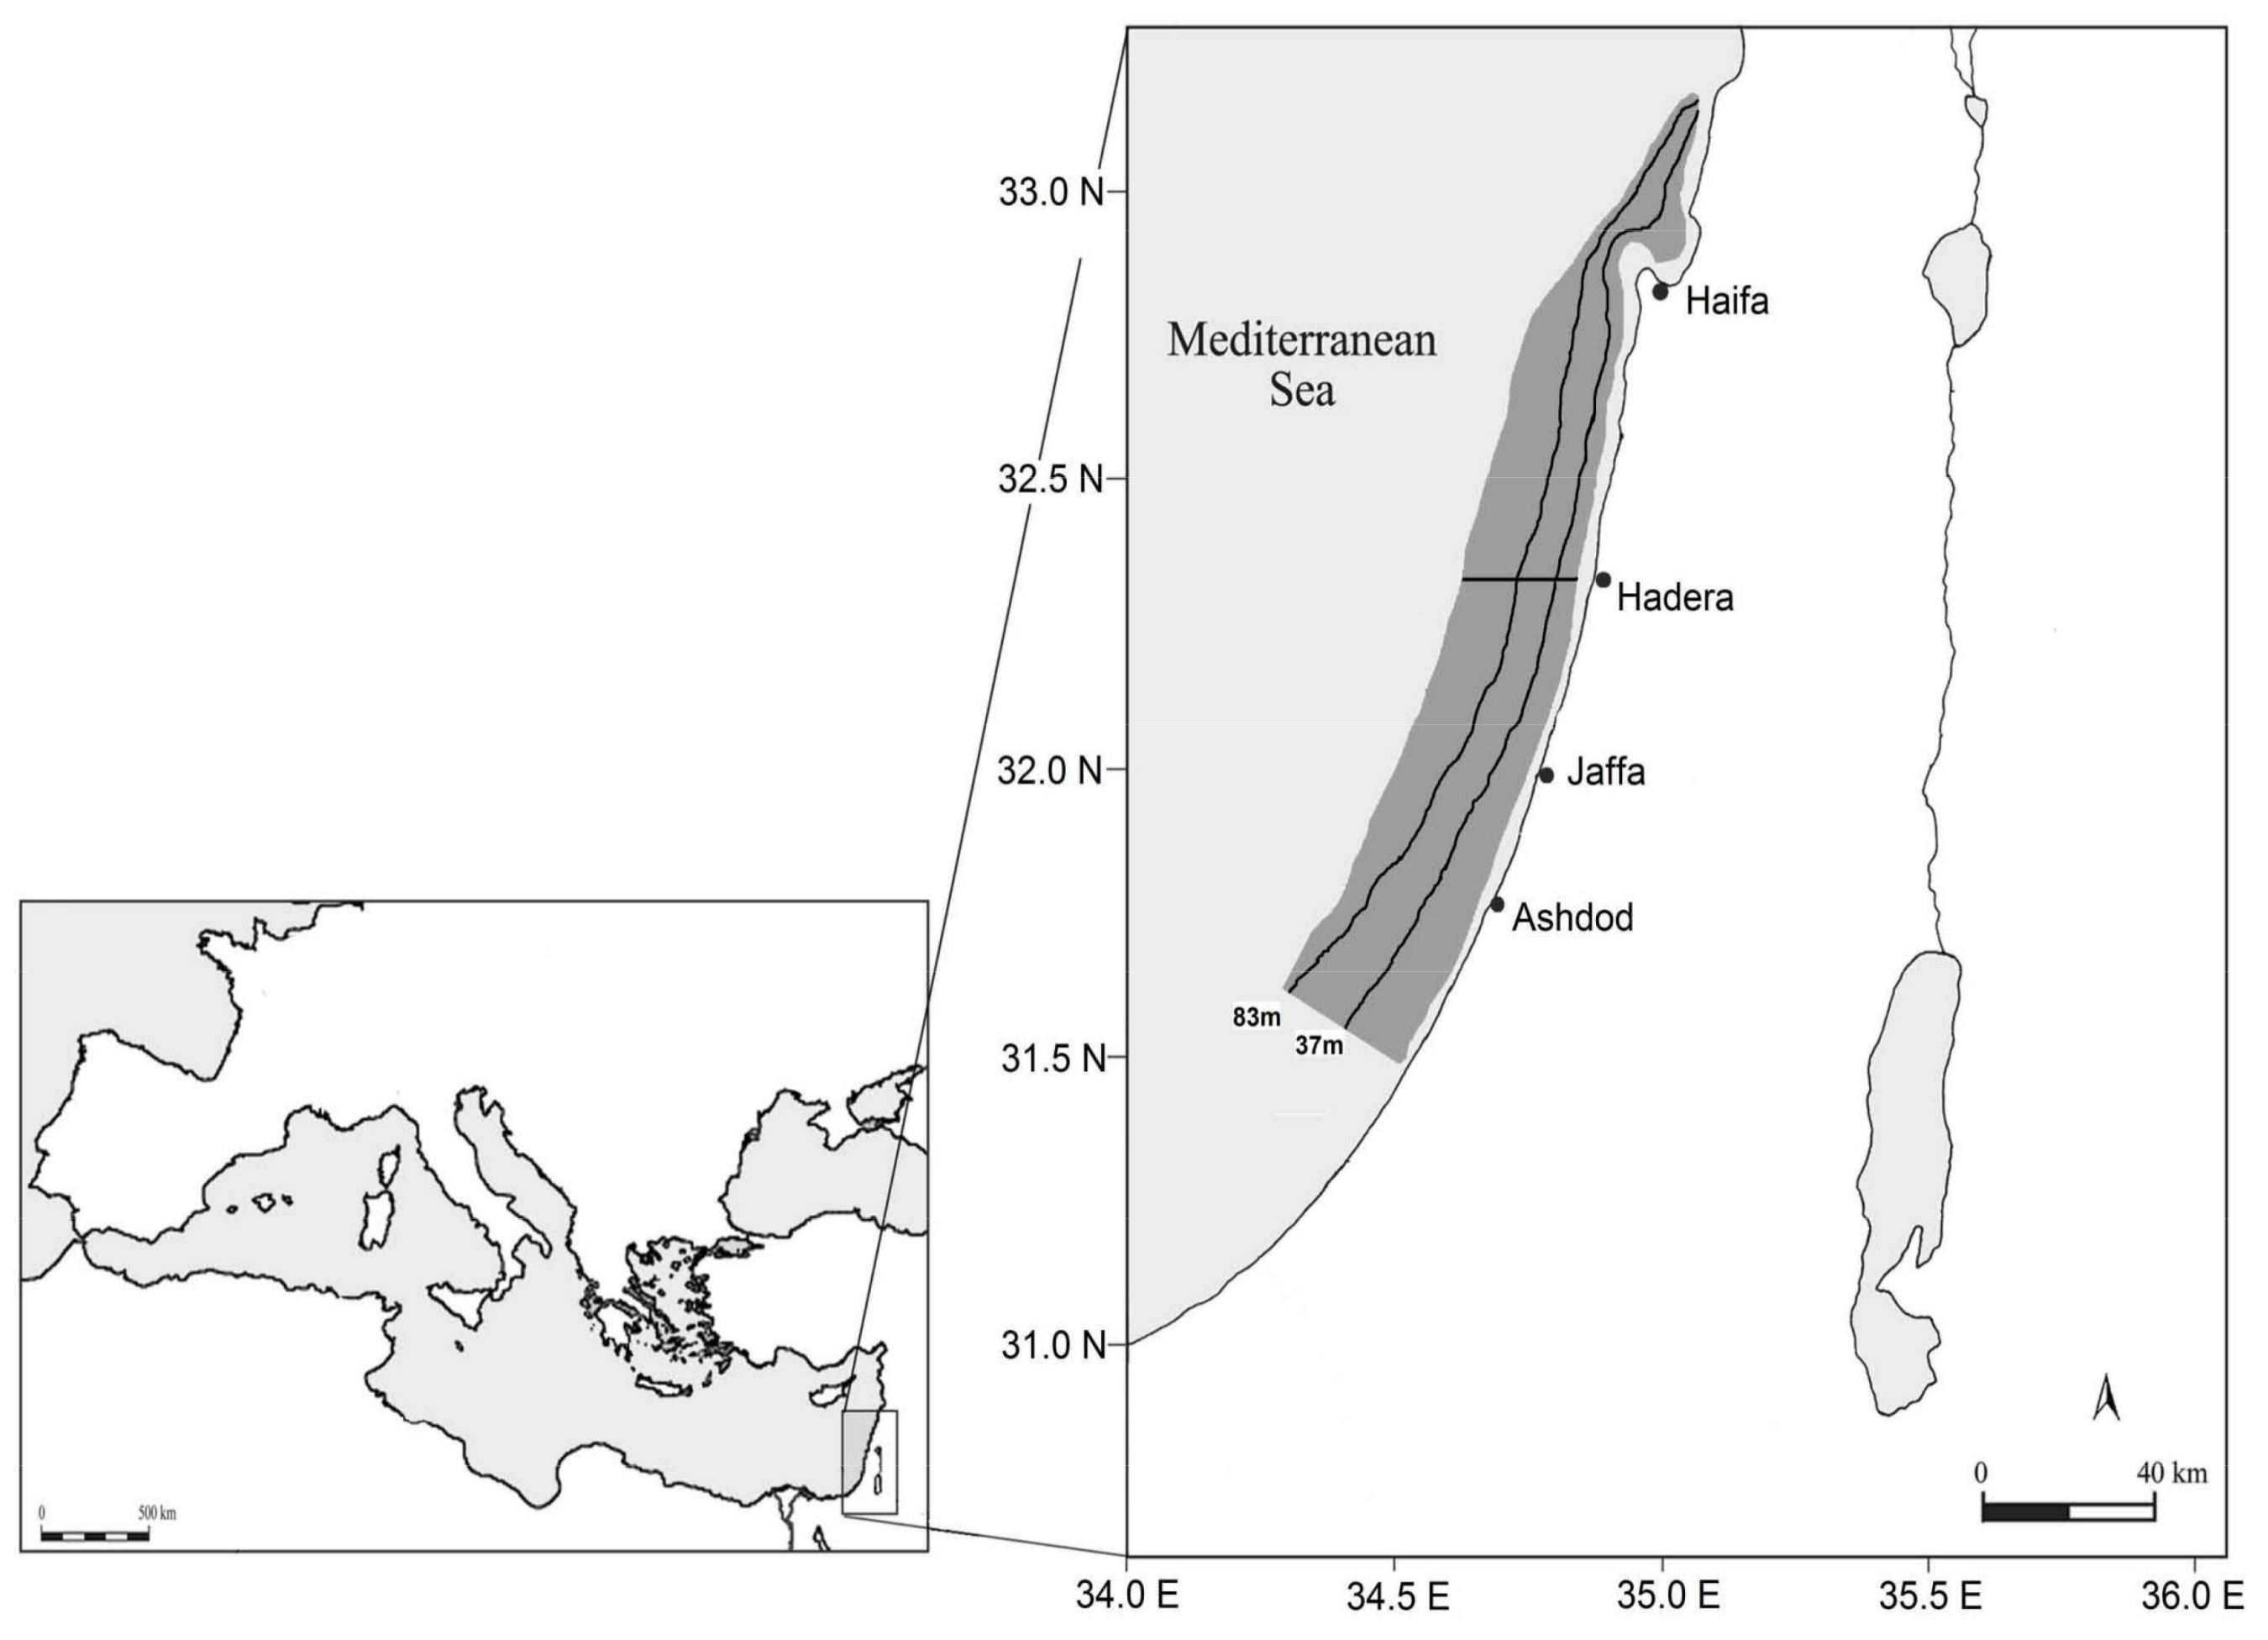
4.1. Study Area and Sampling Data

The trawl data were acquired from along the Israeli continental shelf and upper slope, between latitudes 31°20′ N and 33°05′ E by the Israel Fishery Department (Figure 3). Data were collected from commercial trawl hauls during the periods April 1990 to December 1994 (267 hauls) and between October 2008 and March 2011 (183 hauls). In both periods, trawling depths ranged between 15 and 300 m, and three different depth ranges were assessed: shallow (15–37 m), medium (38–82 m), and deep (83–300 m). Hauls were carried out by 15–22 m length overall (LOA) stern trawlers dragging 40 mm diamond mesh nets with sweeps. The towing speed remained constant at three knots. The horizontal opening of the gear (distance between trawl doors) increased from 55–65 m in 1990–1994 to 60–80 m in 2008–2011. Moreover, the vertical reach of the nets also increased from 1.2–1.5 m, to 1.5–1.8 m at the headline midpoint.
The same sampling protocol was used in both periods: a representative sub-sample of one box from the total catch was obtained from the fish pile onboard with no specific preference given to any direction on deck to assure randomness. As the same sample size was used in each trawl, the data represent only relative and not absolute abundance. All fishes in samples were taxonomically identified at the species level and measured to the nearest 0.5 cm [27].

4.2. Statistical Analyses

4.2.1. Analyses of Traits Linked to Population Trends

The log-ratio of abundance in 2008–2011 to abundance in 1990–1994 (hereafter ‘population trend’) was employed as response variable. A total of 179 fish taxa were recorded. Species representing ≥0.25% of the total numbers in at least one of the study periods (1991–1994, 2008–2011) were included in the analyses. A total of 45 species met this criterion (Table 1). The remaining species, comprising 114 native and 20 non-indigenous fishes, were excluded from the analyses because they were not abundant enough to allow conclusions about increasing or decreasing populations, and many of them had been recorded only once or twice. Since a division by zero is not possible and seven non-indigenous species were not recorded in the period 1990–1994, one individual was added to the recorded numbers of all species for both periods. The traits used are species-level attributes that do not accommodate intraspecific variation in trait values which is likely to be low relative to interspecific differences. Moreover, in practical terms, the data currently available for these traits is not sufficient to allow estimates of interspecific variation over so many species.
Description of independent predictors: We related population trends to the following independent predictors: growth rate, length at first maturity, trophic level, depth, habitat use, and the schooling level. We selected these traits because they represent general growth, diet, and habitat-related parameters regarding the ecological roles played by species within a community. These traits have often been speculated to be associated with invasion success and susceptibility to anthropogenic disturbance [28,71]. Parameters, such as schooling level and depth range distribution, were also attributed to the success of Red Sea migrants into the Mediterranean Sea [26,29,71].
Growth rate (K): The increase in weight of a fish per year, divided by the initial weight [73]. The growth rate was not available for seven species; K values from next-related species were used in these cases.
Length: The length of a fish is related to its average fecundity, maximum lifespan, and dispersal ability [74,75]. For example, fishes with small adult size are characterized by rapid growth, early maturity, and high fecundity [60]. The length at first maturity was used in the analysis. The Lm is the mean length at which fish of a given population develop ripe gonads for the first time [73]. The Lm in cm was log10 transformed for the model. Lm was not available for seven species; estimated values adapted from related species were used in these cases.
Trophic level (TL): Position in the food chain, determined by the number of energy-transfer steps to that level [73].
Depth range of species: The shallowest and deepest depths at which a species was observed (in m) were included as two separate predictors. The data were log10 transformed.
Habitat type and use: The following options were treated as nominal parameters: (i) Pelagic; (ii) hard bottom, rocks, caves, crevices; (iii) soft bottom; (iv) vegetated bottom including seagrass meadows and algal forests; and (v) multihabitat use.
Schooling level: Schooling behavior was examined as it may indirectly reflect resource use and vulnerability to fishing [60,76]. The schooling level represents one of the following four ordinal categories: 1—solitary individuals; 2—occurring mostly in pairs; 3—usually forming small groups (3–50 individuals); and 4—usually in large schools (>50 individuals).
The predictors (K, Lm, TL, shallowest and deepest depth) were not correlated (the maximal value of the correlation was 0.47).
We used generalized linear models to relate the changes in species abundance (population trend) with traits. For this we employed a model selection approach in which the model receiving the largest support from the data was selected using corrected Akaike’s information criterion (AICc) [77], where minimal AICc is the model that receives the largest support. Three models were examined: one for native species only, one for non-indigenous species only, and one with both types of species along with a predictor indicating whether the species are native or non-indigenous. The latter model allowed to test whether the determinants of population size change differ between native and non-indigenous species. Analyses were performed in R (R Foundation for Statistical Computing, Vienna, Austria) [78].

4.2.2. Estimation of Competitive Displacement of Native Fishes

Newly-appearing non-indigenous species may compete with species already present in a community if they co-occur spatio-temporally and overlap in diet. Therefore, we compared habitat use, including the depth range distribution, and the diet components of non-indigenous fishes increasing between 1994 and 2011 with those of native fishes decreasing in the same period. A strong overlap between species with increasing and decreasing populations would imply potential competition and, therefore, could be a possible reason for the decline of the native fishes.
For this purpose similarity indices were used to calculate the overlap. The 30 most abundant benthic and bentho-pelagic fishes were included in this analysis allowing a direct comparison to the results provided by Edelist et al. [27].
The Bray-Curtis similarity index was calculated to quantify the amount of overlap in the depth-range distribution and habitat use. Bray-Curtis is a quantitative and asymmetrical similarity measure and widely used to show overlap of species along ecological gradients [79,80]. We selected the Morisita-Horn index to determine the diet overlap as this index is well established for the estimation of diet overlap in fish ecology [81,82,83]. Both indices are mathematically related [80] and range from 0 (no overlap) to 1 (complete overlap). Values above 0.6 are regarded an ecologically significant overlap in diet [81] (Supplementary Materials).
The indices were calculated using PAST [84]. The following parameters were included in the calculation:
  • Habitat-related traits:
Depth-range distribution: Species can compete only if they co-occur spatially. Therefore, an overlap in depth-range distribution between species with decreasing and increasing populations would be necessary to indicate competition between them. The depth-range distribution in the trawls from 1990–1994 was used for fishes with decreasing proportions, but that of 2008–2011 for increasing species. Data from three depth ranges (shallow, medium, deep) were available and log10 transformed for the calculation.
Habitat types: (1) Pelagic; (2) hard bottom, rocks, caves, crevices; (3) soft bottom; and (4) vegetated bottom, including seagrass meadows and algal forests. All four parameters are ordinal values (0—absent from the habitat type; 1—partly using the habitat type; 2—main habitat type).
Diel activity: Diel activity patterns in fishes may be strongly determined by activity patterns of their prey, thus, differences in activity indicate niche separation or represent avoidance of competition, while coinciding feeding activity among species may result in strong competition [85,86,87]. We used two variables representing the main activity period, diurnal and nocturnal (0—no; 1—yes, for each).
  • Diet-related traits:
Diet: Major diet components (10 components for juveniles and 12 for adult fishes): Seagrass and algae (juv./adult), zooplankton (juv./adult), Echinodermata (juv./adult), Hydrozoa (juv./adult), Porifera (juv./adult), worms (juv./adult), mollusks (juv.), Gastropoda (adult), Bivalvia (adult), Cephalopoda (adult), Peracarida (juv./adult), Decapoda (juv./adult), fish (juv./adult). All diet components were classified according to four ordinal categories: 0—less than 1% of total food; 1—1 to 10% of total food; 2—>10 to 40% of total food; and 3—more than 40%. These categories refer to food weight proportions for juvenile or adult stages of a certain fish species. If two or more studies revealed differences in the weight proportions of a certain species between seasons or locations, the data were averaged. Stergiou and Karpouzi [88], and several additional published data, were used to determine the categories of diet components and most diet analyses, even from non-indigenous species, were conducted in the Mediterranean Sea. If weight proportions were not given in these references, the Index of Relative Importance [89] was used instead.

5. Conclusions

Spatio-temporal shifts in fish communities may be caused by complex and long-term processes. Obvious culprits such as invasive species are easy to pinpoint, but here we found the direct link with native species decline to be weak. More detailed studies on non-indigenous marine fish species are needed to verify or refute their impact on native species. Studies should include an assessment of fishery data, field observations (monitoring), and experimental studies on predation, competition, alteration of habitat, and interruption of food webs. Experimental studies verifying the ecological impact of invasive fishes have already been carried out for Pterois spp. in the Greater Caribbean [30,31,90,91] and N. melanostomus in the Baltic Sea [44]. However, in the Mediterranean Sea an impact of invasive species on native ecosystems or species was demonstrated experimentally only for Siganus spp. [49]. Fisheries data may also constitute an under-utilized source of information, because they are widely available and recorded over long periods. Regardless of the direct impact of non-indigenous fishes on native species, a transformation of the Eastern Mediterranean Sea to an ichthyological extension of the Red Sea may have multiple indirect consequences for ecosystem structure and function that are currently not well understood.

Supplementary Materials

The following tables are available online at https://www.mdpi.com/2410-3888/3/2/19/s1; Table S1: Data used in the calculation of GLM to relate the changes in species abundance (population trend) with traits, Table S2: Data used in the calculation of the Bray-Curtis index (overlap of habitat-related traits), Table S3: Data used in the calculation of the Morisita-Horn index (overlap of diet-related parameters).

Acknowledgments

Erik Arndt thanks Jana Schlaugat who assisted with the preparation of the databank. We are grateful to two anonymous reviewers for their valuable suggestions and to Naomi Paz for linguistic editing. This research was partially supported by a Marie Curie Integration grant number 614352 to Jonathan Belmaker.

Author Contributions

Erik Arndt designed the concept of the study, calculated the similarity indices, and wrote the Materials and Methods, and parts of the Results and Discussion. Or Givan processed the raw data and wrote the Introduction and parts of the Discussion. Dor Edelist and Oren Sonin collected the trawl data (in three periods between 1994 and 2011) and described the study area and the collection of fish. Jonathan Belmaker calculated the GLM and wrote parts of the Results.

Conflicts of Interest

The authors declare no conflict of interest.

References

  1. Myers, R.A.; Worm, B. Rapid worldwide depletion of predatory fish communities. Nature 2003, 423, 280–283. [Google Scholar] [CrossRef] [PubMed]
  2. Worm, B.; Lotze, H.K.; Myers, R.A. Ecosystem effects of fishing and whaling in the North Pacific and Atlantic Ocean. In Whales, Whaling and Ocean Ecosystems; Estes, J.A., DeMaster, D.P., Doak, D.F., Williams, T.M., Brownell, R.L., Eds.; University of California Press: Berkley, CA, USA, 2007; pp. 333–341. [Google Scholar]
  3. Baum, J.K.; Worm, B. Cascading top-down effects of changing oceanic predator abundances. J. Anim. Ecol. 2009, 78, 699–714. [Google Scholar] [CrossRef] [PubMed]
  4. Christensen, V.; Coll, M.; Piroddi, C.; Buszowski, J.; Steenbeek, J.; Pauly, D. Fish biomass in the world ocean: A century of decline. Mar. Ecol. Prog. Ser. 2014, 512, 155–166. [Google Scholar] [CrossRef]
  5. Genner, M.J.; Sims, D.W.; Wearmouth, V.J.; Southall, E.J.; Southward, A.J.; Henderson, P.A.; Hawkins, S.J. Regional climate warming drives long-term community changes of British marine fish. Proc. R. Soc. Lond. Biol. 2004, 271, 655–661. [Google Scholar] [CrossRef] [PubMed]
  6. Munday, P.L.; Jones, G.P.; Pratchett, M.S.; Williams, A.J. Climate change and the future for coral reef fishes. Fish Fish. 2008, 9, 261–285. [Google Scholar] [CrossRef]
  7. Simpson, S.D.; Jennings, S.; Johnson, M.P.; Blanchard, J.L.; Schon, P.J.; Sims, D.W.; Genner, M.J. Continental shelf-wide response of a fish assemblage to rapid warming of the sea. Curr. Biol. 2011, 21, 1565–1570. [Google Scholar] [CrossRef] [PubMed]
  8. Pauly, D.; Christensen, V.; Dalsgaard, J.; Froese, R.; Torres, F., Jr. Fishing down the marine food web. Science 1998, 279, 860–863. [Google Scholar] [CrossRef] [PubMed]
  9. Greenstreet, S.P.R.; Spence, F.E.; McMillan, J.A. Fishing effects in northeast Atlantic shelf seas: Patterns in fishing effort, diversity and community structure. V. Changes in structure of the North Sea groundfish species assemblage between 1925 and 1996. Fish. Res. 1999, 40, 153–183. [Google Scholar] [CrossRef]
  10. Jennings, S.; Greenstreet, S.P.R.; Reynolds, J.D. Structural change in an exploited fish community: A consequence of differential fishing effects on species with contrasting life histories. J. Anim. Ecol. 1999, 68, 617–627. [Google Scholar] [CrossRef]
  11. Daan, N.; Gislason, H.; Pope, J.G.; Rice, J.C. Changes in the North Sea fish community: Evidence of indirect effects of fishing? ICES J. Mar. Sci. 2005, 62, 177–188. [Google Scholar] [CrossRef]
  12. Jones, G.P.; McCormick, M.I.; Srinivasan, M.; Eagle, J.V. Coral decline threatens fish biodiversity in marine reserves. Proc. Natl. Acad. Sci. USA 2004, 101, 8251–8253. [Google Scholar] [CrossRef] [PubMed]
  13. Airoldi, L.; Balata, D.; Beck, M.W. The Gray Zone: Relationships between habitat loss and marine diversity and their applications in conservation. J. Exp. Mar. Biol. Ecol. 2008, 366, 8–15. [Google Scholar] [CrossRef]
  14. Wilson, S.K.; Fisher, R.; Pratchett, M.S.; Graham, N.A.J.; Dulvy, N.K.; Turner, R.A.; Cakacaka, A.; Polunin, N.V.C.; Rushton, S.P. Exploitation and habitat degradation as agents of change within coral reef fish communities. Glob. Chang. Biol. 2008, 14, 2796–2809. [Google Scholar] [CrossRef]
  15. Turner, S.J.; Thrush, S.F.; Hewitt, J.E.; Cummings, V.J.; Funnel, G. Fishing impacts and the degradation or loss of habitat structure. Fish. Manag. Ecol. 1999, 6, 401–420. [Google Scholar] [CrossRef]
  16. Pratchett, M.S.; Munday, P.L.; Wilson, S.K.; Graham, N.A.J.; Cinner, J.E.; Bellwood, D.R.; Jones, G.P.; Polunin, N.V.C.; McClanahan, T.R. Effects of climate-induced coral bleaching on coral-reef fishes: Ecological and economic consequences. In Oceanography and Marine Biology: Annual Review; Gibson, R.N., Atkinson, R.J.A., Gordon, J.D.M., Eds.; CRC Press: Boca Raton, FL, USA, 2008; Volume 46, pp. 251–296. [Google Scholar]
  17. Nilsson, G.E.; Crawley, N.; Lunde, I.G.; Munday, P.L. Elevated temperature reduces the respiratory scope of coral reef fishes. Glob. Chang. Biol. 2009, 15, 1405–1412. [Google Scholar] [CrossRef]
  18. Goren, M.; Galil, B.S. A review of changes in the fish assemblages of Levantine inland and marine ecosystems following the introduction of non-native fishes. J. Appl. Ichthyol. 2005, 21, 364–370. [Google Scholar] [CrossRef]
  19. Harmelin-Vivien, M.L.; Bitar, G.; Harmelin, J.G.; Monestiez, P. The littoral fish community of the Lebanese rocky coast (eastern Mediterranean Sea) with emphasis on Red Sea immigrants. Biol. Invasions 2005, 7, 625–637. [Google Scholar] [CrossRef]
  20. Golani, D.; Appelbaum-Golani, B. (Eds.) Fish Invasions of the Mediterranean Sea: Change and Renewal; Pensoft Publishers: Sofia, Bulgaria, 2010. [Google Scholar]
  21. Raitsos, D.E.; Beaugrand, G.; Georgopoulos, D.; Zenetos, A.; Pancucci-Papadopoulou, A.M.; Theocharis, A.; Papathanassiou, E. Global climate change amplifies the entry of tropical species into the eastern Mediterranean Sea. Limnol. Oceanogr. 2010, 55, 1478–1484. [Google Scholar] [CrossRef]
  22. Kalogirou, S.; Azzurro, E.; Bariche, M. The Ongoing Shift of Mediterranean Coastal Fish Assemblages and the Spread of Non-Indigenous Species. In Environmental Sciences—Biodiversity Enrichment in a Diverse World; Lameed, G.L., Ed.; InTech: New York, NY, USA; 2012; pp. 263–280. [Google Scholar]
  23. Çınar, M.E.; Bilecenoğlu, M.; Öztürk, B.; Katagan, T.; Yokeş, M.B.; Aysel, V.; Dağlı, E.; Açık, Ş.; Özcan, T.; Erdoğan, H. An updated review of alien species on the coasts of Turkey. Med. Mar. Sci. 2011, 12, 257–315. [Google Scholar] [CrossRef]
  24. Edelist, D.; Sonin, O.; Golani, D.; Rilov, G.; Spanier, E. Spatiotemporal patterns of catch and discards of the Israeli Mediterranean trawl fishery in the early 1990s: Ecological and conservation perspectives. Sci. Mar. 2011, 75, 641–652. [Google Scholar] [CrossRef]
  25. Tillier, J.B. Le Canal de Suez et sa fauna ichthyologique. Mém. Soc. Zool. 1902, 15, 279–318. [Google Scholar]
  26. Arndt, E.; Schembri, P.S. Common traits associated with establishment and spread of Lessepsian fishes in the Mediterranean Sea. Mar. Biol. 2015, 162, 2141–2153. [Google Scholar] [CrossRef]
  27. Edelist, D.; Rilov, G.; Golani, D.; Carlton, J.T.; Spanier, E. Restructuring the Sea: profound shifts in the world’s most invaded marine ecosystem. Divers. Distrib. 2013, 19, 69–77. [Google Scholar] [CrossRef]
  28. Givan, O.; Edelist, D.; Sonin, O.; Belmaker, J. Thermal affinity as the dominant factor changing Mediterranean fish abundances. Glob. Chang. Biol. 2017, 24, E80–E89. [Google Scholar] [CrossRef] [PubMed]
  29. Golani, D. Colonization of the Mediterranean by Red Sea fishes via the Suez Canal—Lessepsian migration. In Fish Invasions of the Mediterranean Sea: Change and Renewal; Golani, D., Appelbaum-Golani, B., Eds.; Pensoft Publishers: Sofia, Bulgaria, 2010; pp. 145–188. [Google Scholar]
  30. Albins, M.; Hixon, M. Worst case scenario: Potential long-term effects of invasive predatory lionfish (Pterois volitans) on Atlantic and Caribbean coral-reef communities. Environ. Biol. Fish. 2011, 96, 1–7. [Google Scholar] [CrossRef]
  31. Albins, M. Effects of invasive Pacific red lionfish, Pterois volitans, versus a native predator on Bahamian coral-reef fish communities. Biol. Invasions 2013, 15, 29–43. [Google Scholar] [CrossRef]
  32. Green, S.J.; Akins, J.L.; Maljković, A.; Côté, I.M. Invasive Lionfish Drive Atlantic Coral Reef Fish Declines. PLoS ONE 2012, 7, e32596. [Google Scholar] [CrossRef] [PubMed]
  33. Ben-Yami, M.; Glaser, T. The invasion of Saurida undosquamis (Richardson) into the Levant basin—An example of biological effect of interoceanic canals. Fish B-NOAA 1974, 72, 359–373. [Google Scholar]
  34. Fishelson, L. Marine animal assemblages along the littoral of the Israeli Mediterranean seashore: The Red-Med communities of species. Italian J. Zool. 2000, 67, 393–415. [Google Scholar] [CrossRef]
  35. Bariche, M.; Letourneur, Y.; Harmelin-Vivien, M. Temporal fluctuations and settlement patterns of native and Lessepsian herbivorous fishes on the Lebanese coast (Eastern Mediterranean). Environ. Biol. Fish. 2004, 70, 81–90. [Google Scholar] [CrossRef]
  36. Giakoumi, S. Distribution patterns of the invasive herbivore Siganus luridus (Rüppell, 1829) and its relation to native benthic communities in the central Aegean Sea, Northeastern Mediterranean. Mar. Ecol. 2014, 35, 96–105. [Google Scholar] [CrossRef]
  37. Dubs, D.O.L.; Corkum, L.D. Behavioral interactions between round gobies (Neogobius melanostomus) and mottled sculpins (Cottus bairdi). J. Great Lakes Res. 1996, 22, 838–844. [Google Scholar] [CrossRef]
  38. Hrabik, T.R.; Magnuson, J.J.; McLain, A.S. Predicting the effects of rainbow smelt on native fishes in small lakes: Evidence from long-term research on two lakes. Can. J. Fish. Aquat. Sci. 1998, 55, 1364–1371. [Google Scholar] [CrossRef]
  39. Alcaraz, C.; Bisazza, A.; García-Berthou, E. Salinity mediates the competitive interactions between invasive mosquitofish and an endangered fish. Oecologia 2008, 155, 205–213. [Google Scholar] [CrossRef] [PubMed]
  40. Leunda, P.M. Impacts of non-native fishes on Iberian freshwater ichthyofauna: Current knowledge and gaps. Aquat. Invasions 2010, 5, 239–262. [Google Scholar] [CrossRef]
  41. Cucherousset, J.; Olden, J.D. Ecological Impact of Non-native Freshwater Fishes. Fisheries 2011, 36, 215–230. [Google Scholar] [CrossRef]
  42. Musil, M.; Novotná, K.; Potužák, J.; Hůda, J.; Pechar, L. Impact of topmouth gudgeon (Pseudorasbora parva) on production of common carp (Cyprinus carpio)—Question of natural food structure. Biología 2014, 69, 1757–1769. [Google Scholar] [CrossRef]
  43. Grabowska, J.; Przybylski, M. Life-history traits of non-native freshwater fish invaders differentiate them from natives in the Central European bioregion. Rev. Fish. Biol. Fish. 2015, 25, 165–178. [Google Scholar] [CrossRef]
  44. Karlson, A.M.L.; Almqvist, G.; Skóra, K.E.; Appelberg, M. Indications of competition between non-indigenous round goby and native flounder in the Baltic Sea. ICES J. Mar. Sci. 2007, 64, 479–486. [Google Scholar] [CrossRef]
  45. Järv, L.; Kotta, J.; Kotta, I.; Raid, T. Linking the structure of benthic invertebrate communities and the diet of native and invasive fish species in a brackish water ecosystem. Ann. Zool. Fennici 2011, 48, 129–141. [Google Scholar] [CrossRef]
  46. Rakauskas, V.; Pūtys, Ž.; Dainys, J.; Lesutienė, J.; Ložys, L.; Arbačiauskas, K. Increasing population of the invader round goby, Neogobius melanostomus (Actinopterygii: Perciformes: Gobiidae), and its trophic role in the Curonian Lagoon, SE Baltic Sea. Acta Ichthyol. Piscat. 2013, 43, 95–108. [Google Scholar] [CrossRef]
  47. Harrison, E.; Lorenz, J.J.; Trexler, J.C. Per capita effects of non-native Mayan Cichlids (Cichlasoma urophthalmus Günther) on native fish in the estuarine southern Everglades. Copeia 2013, 80–96. [Google Scholar] [CrossRef]
  48. Goren, M.; Galil, B.S.; Diamant, A.; Stern, N.; Levitt-Barmats, Y. Invading up the food web? Invasive fish in the southeastern Mediterranean Sea. Mar. Biol. 2016, 163, 180. [Google Scholar] [CrossRef]
  49. Elleouet, J.; Albouy, C.; Ben Rais Lasram, F.; Mouillot, D.; Leprieur, F. A trait-based approach for assessing and mapping niche overlap between native and exotic species: The Mediterranean coastal fish fauna as a case study. Divers. Distrib. 2014, 20, 1333–1344. [Google Scholar] [CrossRef]
  50. Sala, E.; Kizilkaya, Z.; Yildirim, D.; Ballesteros, E. Alien Marine Fishes Deplete Algal Biomass in the Eastern Mediterranean. PLoS ONE 2011, 6, e17356. [Google Scholar] [CrossRef] [PubMed] [Green Version]
  51. Vergés, A.; Tomas, F.; Cebrian, E.; Ballesteros, E.; Kizilkaya, Z.; Dendrinos, P.; Karamanlidis, A.A.; Spiegel, D.; Sala, E. Tropical rabbitfish and the deforestation of a warming temperate sea. J. Ecol. 2014, 102, 1518–1527. [Google Scholar] [CrossRef]
  52. Edelist, D.; Golani, D.; Rilov, G.; Spanier, E. The invasive venomous striped eel catfish Plotosus lineatus in the Levant: Possible mechanisms facilitating its rapid invasional success. Mar. Biol. 2012, 159, 283–290. [Google Scholar] [CrossRef]
  53. Edelist, D. (National Institute of Oceanography, Tel-Shikmona, Haifa, Israel). Personal communication, 2017. [Google Scholar]
  54. Gücü, A.C.; Bingal, F. Trawlable species assemblages on the continental shelf of the Northeastern Levant Sea (Mediterranean) with an emphasis on Lessepsian migration. Acta Adriat. 1994, 35, 83–100. [Google Scholar]
  55. Golani, D.; Ben-Tuvia, A. Lessepsian migration and the Mediterranean fisheries of Israel. In Condition of the World’s Aquatic Habitats, Proceedings of the World Fisheries Congress 1992, Theme 1; Athens, Greece; Armantrout, N.B., Wolotira, R.J., Jr., Eds.; Oxford & IBH Publishing Company: Delhi, India, 1995; pp. 279–289. [Google Scholar]
  56. Carpentieri, P.; Lelli, S.; Colloca, F.; Mohanna, C.; Bartolino, V.; Moubayed, S.; Ardizzone, G.D. Incidence of lessepsian migrants on landings of the artisanal fishery of south Lebanon. Mar. Biodivers. Rec. 2009, 2, e71. [Google Scholar] [CrossRef]
  57. Azzurro, E.; Tuset, V.M.; Lombarte, A.; Maynou, F.; Simberloff, D.; Rodríguez-Pérez, A.; Solé, R.V. External morphology explains the success of biological invasions. Ecol. Lett. 2014, 17, 1455–1463. [Google Scholar] [CrossRef] [PubMed]
  58. Givan, O.; Parravicini, V.; Kulbicki, M.; Belmaker, J. Trait structure reveals the processes underlying fish establishment in the Mediterranean. Glob. Ecol. Biogeogr. 2017, 26, 142–153. [Google Scholar] [CrossRef]
  59. Bianchi, G.; Gislason, H.; Graham, K.; Hill, L.; Jin, X.; Koranteng, K.; Manickchand-Heileman, S.; Payá, I.; Sainsbury, K.; Sanchez, F.; et al. Impact of fishing on size composition and diversity of demersal fish communities. ICES J. Mar. Sci. 2000, 57, 558–571. [Google Scholar] [CrossRef]
  60. Jennings, S.; Kaiser, M.J.; Reynolds, J.D. Marine Fisheries Ecology; Blackwell Science: Oxford, UK, 2001. [Google Scholar]
  61. Reynolds, J.D.; Dulvy, N.K.; Goodwin, N.B.; Hutchings, J.A. Biology of extinction risk in marine fishes. Proc. Biol. Sci. 2005, 272, 2337–2344. [Google Scholar] [CrossRef] [PubMed]
  62. Tittensor, D.P.; Myers, R.A.; Worm, B. Macroecology of exploited marine systems. In Marine Macroecology; Witman, J., Roy, K., Eds.; University of Chicago Press: Chicago, IL, USA, 2009; pp. 310–340. [Google Scholar]
  63. Pinnegar, J.K.; Polunin, N.V.C.; Badalamenti, F. Long-term changes in the trophic level of western Mediterranean fishery and aquaculture landings. Can. J. Fish. Aquat. Sci. 2003, 60, 222–235. [Google Scholar] [CrossRef]
  64. Coll, M.; Shannon, L.J.; Moloney, C.L.; Palomera, I.; Tudela, S. Comparing trophic flows and fishing impacts of a NW Mediterranean ecosystem with coastal upwelling systems by means of standardized models and indicators. Ecol. Model. 2006, 198, 53–70. [Google Scholar] [CrossRef]
  65. Azzurro, E. The advance of thermophilic fishes in the Mediterranean Sea: Overview and methodological questions. In Climate Warming and Related Changes in Mediterranean Marine Biota; Briand, F., Ed.; Workshop Monographs No. 35; CIESM: Villa Girasole, Monaco, 2008; pp. 39–45. [Google Scholar]
  66. Despalatović, M.; Grubelić, I.; Nikolić, V.; Dragičević, B.; Dulčić, J.; Žuljević, A.; Cvitković, I.; Antoli, B. Climate Warming and Related Changes in Mediterranean Marine Biota; Briand, F., Ed.; Workshop Monographs No. 35; CIESM: Villa Girasole, Monaco, 2008; pp. 51–57. [Google Scholar]
  67. Albouy, C.; Guilhaumon, F.; Araujo, M.B.; Mouillot, D.; Leprieur, F. Combining projected changes in species richness and composition reveals climate change impacts on coastal Mediterranean fish assemblages. Glob. Chang. Biol. 2012, 18, 2995–3003. [Google Scholar] [CrossRef] [PubMed]
  68. Albouy, C.; Guilhaumon, F.; Leprieur, F.; Ben Rais Lasram, F.; Somot, S.; Aznar, R.; Velez, L.; Le Loc’h, F.; Mouillot, D. Projected climate change and the changing biogeography of coastal Mediterranean fishes. J. Biogeogr. 2013, 40, 534–547. [Google Scholar] [CrossRef]
  69. Ben-Tuvia, A.; Golani, D. Temperature as the main factor influencing Lessepsian migration. In The Mediterranean Sea in the 21th Century: Who for? Mediterranean: Climatic Variability, Environment and Biodiversity; Benhamida, S., Le Goff, F., Eds.; Maison de l’environnement: Montpellier, France, 1996; pp. 159–162. [Google Scholar]
  70. Ben Rais Lasram, F.; Mouillot, D. Increasing southern invasion enhances congruence between endemic and exotic Mediterranean fish fauna. Biol. Invasions 2009, 11, 697–711. [Google Scholar] [CrossRef]
  71. Belmaker, J.; Parravicini, V.; Kulbicki, M. Ecological traits and environmental affinity explain Red Sea fish introduction into the Mediterranean. Glob. Chang. Biol. 2013, 19, 1373–1382. [Google Scholar] [CrossRef] [PubMed]
  72. Parravicini, V.; Azzurro, E.; Kulbicki, M.; Belmaker, J. Niche shift can impair the ability to predict invasion risk in the marine realm: An illustration using Mediterranean fish invaders. Ecol. Lett. 2015, 18, 246–253. [Google Scholar] [CrossRef] [PubMed]
  73. Froese, R.; Pauly, D. (Eds.) FishBase. Available online: http://www.fishbase.org (accessed on 23 September 2017).
  74. Kolar, C.S.; Lodge, D.M. Ecological predictions and risk assessment for alien fishes in North America. Science 2002, 298, 1233–1236. [Google Scholar] [CrossRef] [PubMed]
  75. Marchetti, M.P.; Moyle, P.B.; Levine, R. Invasive species profiling? Exploring the characteristics of non-native fishes across invasion stages in California. Freshw. Biol. 2004, 49, 646–661. [Google Scholar] [CrossRef]
  76. Helfman, G.S.; Collette, B.B.; Facey, D.E.; Bowen, B.W. The Diversity of Fishes, 2nd ed.; Wiley-Blackwell: Chichester, UK, 2009. [Google Scholar]
  77. Akaike, H. Factor-Analysis and Aic. Psychometrika 1987, 52, 317–332. [Google Scholar] [CrossRef]
  78. R Core Team, R: A Language and Environment for Statistical Computing. R Foundation for Statistical Computing, Vienna, Austria. Available online: http://www.R-project.org/ (accessed on 20 June 2017).
  79. Schmidt, T.S.B.; Rodrigues, J.F.M.; von Mering, C.A. Family of Interaction-Adjusted Indices of Community Similarity. ISME J. 2017, 11, 791–807. [Google Scholar] [CrossRef] [PubMed]
  80. Leyer, I.; Wesche, K. Multivariate Statistik in der Ökologie; Springer: Berlin/Heidelberg, Germany; New York, NY, USA, 2007. [Google Scholar]
  81. Zaret, T.; Rand, S. Competition in tropical stream fishes: Support for the competitive exclusion principle. Ecology 1971, 52, 336–342. [Google Scholar] [CrossRef]
  82. Labropoulou, M.; Eleftheriou, A. The foraging ecology of two pairs of congeneric demersal fish species: Importance of morphological characteristics in prey selection. J. Fish Biol. 1997, 50, 324–340. [Google Scholar] [CrossRef]
  83. Kalogianni, E.; Giakoumi, S.; Andriopoulou, A.; Chatzinikolaou, Y. Prey utilisation and trophic overlap between the non native mosquitofish and a native fish in two Mediterranean rivers. Mediterr. Mar. Sci. 2014, 15, 287–301. [Google Scholar] [CrossRef]
  84. Hammer, Ø.; Harper, D.A.T.; Ryan, P.D. PAST: Paleontological Statistics Software Package for Education and Data Analysis. Palaeontol. Electron. 2001, 4, 1–9. [Google Scholar]
  85. Helfman, G.S. Fish behaviour by day, night, and twilight. In Behaviour of Teleost Fishes, 2nd ed.; Chapman and Hall: London, UK, 1993; pp. 479–512. ISBN 0-412-42930-6. [Google Scholar]
  86. Hixon, M.A. Competition. In The Ecology of Marine Fishes: California and Adjacent Waters; Allen, L.G., Pondella, D.J., II., Horn, M.H., Eds.; University of California Press: Berkeley, CA, USA, 2006; pp. 449–465. ISBN 0-520-24653-5. [Google Scholar]
  87. Colmenero, A.I.; Aguzzi, J.; Lombarte, A.; Bozzano, A. Sensory constraints in temporal segregation in two species of anglerfish, Lophius budegassa and L. piscatorius. Mar. Ecol. Prog. Ser. 2010, 416, 255–265. [Google Scholar] [CrossRef]
  88. Stergiou, K.I.; Karpouzi, V.S. Feeding habits and trophic levels of Mediterranean fish. Rev. Fish. Biol. Fish. 2002, 11, 217–254. [Google Scholar] [CrossRef]
  89. Pinkas, L.; Oliphant, M.S.; Iverson, I.L.K. Food habits of albacore, bluefin tuna and bonito in California waters. Fish. Bull. 1971, 152, 1–105. [Google Scholar]
  90. Cerino, D.; Overton, A.S.; Rice, J.A.; Morris, J.A. Bioenergetics and trophic impacts of the invasive Indo-Pacific lionfish. Trans. Am. Fish. Soc. 2013, 142, 1522–1534. [Google Scholar] [CrossRef]
  91. Benkwitt, C.E. Non-linear effects of invasive lionfish density on native coral-reef fish communities. Biol. Invasions 2015, 17, 1383–1395. [Google Scholar] [CrossRef]
Figure 1. Relationship between population trends and the major identified traits for non-indigenous (top) and native (bottom) species. Left panels (a,c) show the relationship with habitat affinity and right panels (b,d) the relationship with length at first maturity. Lines in the right panel indicate ordinary least squares regression results.
Fishes 03 00019 g001
Figure 2. Overlap in habitat use and diet related traits between native and non-indigenous species. Only benthic and bentho-pelagic fishes are included. (a) Habitat use including the depth-range distribution based on the Bray-Curtis index; (b) diet-related traits based on the Morisita-Horn index. Abbreviations (capitals are used for non-indigenous species): CAF, Callionymus filamentosus; Chl, Chlorophthalmus agassizi; DEC, Decapterus russelli; EQU, Equulites klunzingeri; Lit, Lithognathus mormyrus; LSP, Lagocephalus spadiceus; LSU, Lagocephalus suezensis; Mac, Macroramphosus scolopax; Mer, Merluccius merluccius; Mba, Mullus barbatus; Msu, Mullus surmuletus; NEM, Nemipterus randalli; PLO, Plotosus lineatus; SAU, Saurida lessepsianus; Tra, Trachinus draco; Tri, Trigla lyra; UPM, Upeneus moluccensis; UPP, Upeneus pori; Ura, Uranoscopus scaber. Arrows and +/− indicate increasing positive/negative population trends of species.
Fishes 03 00019 g002
Figure 3. Map of the study site off the Israeli coast (Eastern Mediterranean Sea). N, North; E, East.
Fishes 03 00019 g003
Table 1. Recorded fish species with proportions of ≥0.0025 during at least one of the trawl periods. Species are listed from largest relative increase to the largest decline of trawl proportions between 1990–1994 and 2008–2011.
SpeciesProportion 1990–1994Proportion 2008–2011Log-Ratio of Proportional Change
Plotosus lineatus (Thunberg, 1787)<0.00010.09003.6302
Nemipterus randalli Russell, 1986<0.00010.04933.3685
Decapterus russelli (Rüppell, 1830)<0.00010.02032.9839
Jaydia smithi Kotthaus, 1970<0.00010.01962.9680
Ostorhinchus fasciatus (White, 1790)<0.00010.01332.8007
* Etrumeus golanii Dibattista et al., 2012<0.00010.01072.4060
* Trachurus indicus Nekrasov, 1966<0.00010.00532.4034
Lagocephalus suezensis Clark & Gohar, 1953<0.00070.02381.5610
Lagocephalus spadiceus (Richardson, 1845)<0.00020.00441.3681
* Dussumieria elopsoides Bleeker, 1849<0.00080.00550.8622
* Scomber colias Gmelin, 17890.00330.01840.7480
* Spicara maena (Linnaeus, 1758)0.01000.03820.5835
* Trachurus trachurus (Linnaeus, 1758)0.00560.01990.5511
Upeneus pori Ben-Tuvia & Golani, 19890.00380.01330.5454
Chlorophthalmus agassizi Bonaparte, 18400.00120.00380.5046
Equulites klunzingeri (Steindachner, 1898)0.05950.12930.3371
Macroramphosus scolopax (Linnaeus, 1758)0.00890.01540.2367
* Engraulis encrasicolus (Linnaeus, 1758)0.03000.05050.2269
Stephanolepis diaspros Fraser-Brunner, 19400.00340.00500.1631
Lithognathus mormyrus (Linnaeus, 1758)0.00260.00340.1083
Pagellus acarne (Risso, 1827)0.04250.04890.0613
* Sardinella aurita Valenciennes, 18470.00630.0059−0.0292
Bothus podas (Delaroche, 1809)0.00500.0046−0.0353
Citharus linguatula (Linnaeus, 1758)0.01460.0130−0.0508
Upeneus moluccensis (Bleeker, 1855)0.12670.0951−0.1246
Dentex macrophthalmus (Bloch, 1791)0.03690.0252−0.1651
Saurida lessepsianus Russell et al., 20150.03270.0223−0.1661
Callionymus filamentosus Valenciennes, 18370.02380.0159−0.1748
Pagellus erythrinus (Linnaeus, 1758)0.10650.0678−0.1958
Serranus hepatus (Linnaeus, 1758)0.01220.0072−0.2298
Boops boops (Linnaeus, 1758)0.08990.0476−0.2762
* Sardina pilchardus (Walbaum, 1792)0.01530.0074−0.3173
* Spicara smaris (Linnaeus, 1758)0.04730.0187−0.4033
* Trachurus mediterraneus (Steindachner, 1868)0.03280.0123−0.4238
Lepidotrigla cavillone (Lacépède, 1801)0.03320.0097−0.5351
* Alepes djedaba (Forsskål, 1775)0.00600.0014−0.6349
* Sphyraena pinguis Günther, 18740.00930.0021−0.6542
* Sphyraena sphyraena (Linnaeus, 1758)0.00520.0011−0.6596
Merluccius merluccius (Linnaeus, 1758)0.01890.0028−0.8221
Mullus barbatus Linnaeus, 17580.08720.0113−0.8878
Trigla lyra Linnaeus, 17580.00270.0002−1.1608
Mullus surmuletus Linnaeus, 17580.07040.0041−1.2345
Uranoscopus scaber (Linnaeus, 1758)0.00270.0002−1.2475
Trachinus draco Linnaeus, 17580.00660.0001−2.1136
* Trachurus picturatus (Bowdich, 1825)0.0030<0.0001−2.3690
Non-indigenous species are marked in bold. * Pelagic species, excluded from multivariate trait analyses but included in the generalized linear models.
Table 2. Results of the generalized linear models, relating population trends (log ratio of relative population size between time periods) to species traits. Separate analyses were conducted for all species, non-indigenous species (NIS), and native species. The five models with the lowest Akaike’s information criterion (AICc) are shown. For continuous predictors, numbers in the table represent their regression coefficient.
CategoryNISGrowth rateHabitatLength log (cm)Max. Depth log (m)Min. Depth log (m)Trophic LevelAICc∆AICcWeight
All species2.17 +−2.141.33 131.460.000.27
2.19 +−2.011.310.22 133.542.080.09
1.960.87+−1.791.29 133.602.140.09
2.12 +−2.401.30 0.26134.102.630.07
1.891.63+ 1.22 134.783.320.05
NIS +−5.621.80 64.050.000.29
−5.54 65.381.320.15
+−4.96 65.681.630.13
−5.671.17 67.113.060.06
1.18 −4.96 68.214.160.04
Natives 65.450.000.15
1.48 65.880.430.12
−0.93 66.461.010.09
0.31 67.552.100.05
−0.0967.922.470.04
Blank cells indicate that the predictor was not included in the specific model.

