Engineering and Production of the Light-Driven Proton Pump Bacteriorhodopsin in 2D Crystals for Basic Research and Applied Technologies

 , , , and
Abstract
:1. Introduction
2. Experimental Design
2.1. Materials
- Phusion High-Fidelity PCR Kit (Thermo Fisher, Reinach, Switzerland; cat. no. F553L)
- 5′-pUC-BamHI-BR (forward primer): AAA AGG ATC CGA CGT GAA GAT GGG GC (Microsynth AG, Balgach, Switzerland; custom synthesis)
- 3′-BR-C-His10-HindIII (reverse primer): AAA AAA GCT TGA TTC AGT GGT GAT GAT GGT GAT GAT GGT GGT GAT GTC CGT CGC TGG TCG CGG CCG CGC (Microsynth AG, Balgach, Switzerland; custom synthesis)
- Primer for D96N mutation in BR-C-His10: CCG CTG TTG TTG TTA AAC CTC GCG TTG CTC GTT G (Microsynth AG, Balgach, Switzerland; custom synthesis)
- The plasmid pUC18-bop, i.e., the promotor and the gene of BR (bop) inserted into the commercially available pUC18 vector (New England BioLabs, Allschwil, Switzerland; cat. no. N3041)
- Gel extraction/PCR purification kit (NucleoSpin Gel and PCR Clean-up Kit, Macherey-Nagel, Oensingen, Switzerland; cat. no. 740609)
- DNA Ligation Kit (Thermo Fisher, Reinach, Switzerland; cat. no. K1423)
- E.Z.N.A. Plasmid Mini Kit I (VWR, Dietikon, Switzerland; cat. no. D6943-02)
- BamHI-HF (New England BioLabs, Allschwil, Switzerland; cat. no. R3136S)
- HindIII-HF (New England BioLabs, Allschwil, Switzerland; cat. no. R3104S)
- CutSmart buffer 10X (New England BioLabs, Allschwil, Switzerland; cat. no. B7204S)
- DH5α competent cells (Thermo Fisher, Reinach, Switzerland; cat. no. 18265017)
- plasmid pHS blue (shuttle vector: E. coli and H. salinarum) [39]. See Supplementary Information for nucleotide sequence (Material S1) and vector map (Figure S1)
- Agarose (Sigma-Aldrich, Buchs, Switzerland; cat. no. A9539)
- Tris (AppliChem, Bioswisstec, Schaffhausen, Switzerland; cat. no. A1430)
- Acetic acid (Sigma-Aldrich, Buchs, Switzerland; cat. no. 695092)
- Ethylenediaminetetraacetic acid (EDTA; Sigma-Aldrich, Buchs, Switzerland; cat. no. EDS)
- Luria-Bertani (LB) broth (VWR, Dietikon, Switzerland; cat. no. J106)
- Kanamycin sulfate (AppliChem, Bioswisstec, Schaffhausen, Switzerland; cat. no. 1493)
- Bacto™ Agar (BD, Allschwil, Switzerland; cat. no. 214010)
- E.Z.N.A. Plasmid Midi Kit (VWR, Dietikon, Switzerland; cat. no. D6904-03)
- Sodium chloride Ph.Eur/USP (NaCl; Schweizer Salinen, Pratteln, Switzerland; www.salz.ch, cat. no. 7731)
- Magnesium sulfate (MgSO4; Sigma-Aldrich, Buchs, Switzerland; cat. no. M2643)
- Trisodium citrate dihydrate (Merck, Zug, Switzerland; cat. no. 106448)
- Potassium chloride (KCl; Sigma-Aldrich, Buchs, Switzerland; cat. no. 60310)
- Bacteriological peptone (OXOID, Pratteln, Switzerland; cat. no. LP0037)
![Mps 03 00051 i001]() CRITICAL Other peptone products might not work optimally.
CRITICAL Other peptone products might not work optimally. - Sodium hydroxide (NaOH; Sigma-Aldrich, Buchs, Switzerland; cat. no. S8045)
- Milli-Q ultrapure water (from Millipore water system)
- Deionized water from in-house system
- H. salinarum strain S9 [65]
- Novobiocin sodium salt (Sigma-Aldrich, Buchs, Switzerland; cat. no. N1628)
- Hydrochloric acid (HCl) fuming, ≥37% (Sigma-Aldrich, Buchs, Switzerland; cat. no. 30721) ‘CAUTION’ Highly corrosive. Work in a fume hood and wear goggles and protective clothing.
- Polyethylene glycol 600 (PEG600; Sigma-Aldrich, Buchs, Switzerland; cat. no. 87333)
- Sucrose (Sigma-Aldrich, Buchs, Switzerland; cat. no. S7903)
- Calcium chloride dihydrate (CaCl2; Merck, Zug, Switzerland; cat. no. 102382)
- Deoxyribonuclease I from bovine pancreas (DNase; Sigma-Aldrich, Buchs, Switzerland; cat. no. DN25)
- Sodium azide (NaN3; AppliChem, Bioswisstec, Schaffhausen, Switzerland; cat. no. A1430) ‘CAUTION’ Highly toxic substance. Needs special handling and waste disposal.
- Coomassie Brilliant blue R-250 (AppliChem, Bioswisstec, Schaffhausen, Switzerland; cat. no. A1092)
- Immobilon-P polyvinylidene difluoride (PVDF) transfer membrane (Merck Millipore Ltd., Zug, Switzerland; cat. no. IPVH00010)
- Albumin from bovine serum (BSA, Sigma-Aldrich, Buchs, Switzerland; cat. no. A3912)
- Tween 20 (AppliChem, Bioswisstec, Schaffhausen, Switzerland; cat. no. A4974)
- Anti-penta-His mouse primary antibody (Qiagen, Hombrechtikon, Switzerland; cat. no. 34660)
- Goat anti-mouse horseradish peroxidase (HRP)-conjugated secondary antibody (Bio-Rad, Cressier, Switzerland; cat. no. 172-1011)
- Amersham ECL Western Blotting Detection Reagents (GE Healthcare, Opfikon, Switzerland; cat. no. RPN2209)
- Super RX-N Fuji Medical X-ray film (Fujifilm, Dielsdorf, Switzerland; cat. no. 47,410 19284)
- Glycerol (Sigma-Aldrich, Buchs, Switzerland; cat. no. 49770)
- 1,2-dioleoyl-sn-glycero-3-phosphocholine (DOPC) dissolved in chloroform (Avanti Polar Lipids, Alabaster, AL, USA; cat. no. 850375)
- Nitrogen (or any other inert) gas
- n-octyl-β-D-glucopyranoside (OG, Glycon Biochemicals, Luckenwalde, Germany; cat. no. D97001)
- Potassium phosphate monobasic (KH2PO4, Sigma-Aldrich, Buchs, Switzerland; cat. no. P5655)
- Potassium phosphate dibasic (K2HPO4, Sigma-Aldrich, Buchs, Switzerland; cat. no. P3786)
- Uranyl formate (Thomas Scientific, cat. no. C993L42). ‘CAUTION’ Highly toxic substance. Needs special handling and waste disposal according to radioactivity regulations.

2.2. Equipment
- PCR cycler: we use a SensoQuest Labcycler
- Agarose gel electrophoresis apparatus
- pH meter: we use a Seven Compact pH meter (Mettler Toledo, cat. no. 30019028)
- Filters for media sterilization: we use Jet Biofil Filter Upper Cups 0.22 µm (Axonlab, cat. no. FPE-214-000)
- Incubator for liquid cultures: we use an Infors HT Multitron Standard incubator
- Spectrophotometer for liquid cultures: we use a Pharmacia Biotech Ultraspec 3000 UV-visible spectrophotometer
- Light microscope: we use a Leitz Laborlux 11 light microscope
- Incubator for agar plates: we use a Memmert TNB400 incubator
- Centrifuge for 15 mL and 50 mL conical vials: we use a Beckman Coulter Allegra X-15R centrifuge
- Centrifuge for 1.5 mL and 2 mL test tubes: we use an Eppendorf Centrifuge 5424R
- Ultracentrifuge for 1 mL tubes: we use a Beckman Coulter OptimaTM MAX-XP ultracentrifuge
- For membrane homogenization we use a glass homogenizer size 19 (1 mL) from Kontes Glass Co
- For chromophore-based protein quantification we use a NanoDrop 1000 spectrophotometer (Thermo Fisher, Reinach, Switzerland)
- SDS-PAGE apparatus: we use a Bio-Rad Mini-PROTEAN Tetra System
- Blotting apparatus for Western blot: we use a Bio-Rad TransBlot SD Semi-Dry Transfer Cell
- Centrifuge for 1 L bottles: we use a Herolab HiCen XL centrifuge
- Ultracentrifuge for 94 mL tubes: we use a Beckman Coulter OptimaTM L-90K ultracentrifuge
- 10 mL round bottom flasks with glass stoppers and suitable holder
- Desiccator equipped with a vacuum pump: we use a Nalgene plastic desiccator (Thermo Fisher, Reinach, Switzerland)
- Thermoshaker for 1–2 mL sample tubes: we use an Eppendorf ThermoMixer C
- Extruder with heating block and two gas tight syringes: we use an Avanti Mini-Extruder (Avanti cat. no. 610000) and two 1 mL gas tight syringes (Avanti, cat. no. 610017)
- Membranes for extruder: we use polycarbonate membranes with pore size 0.2 μm (Avanti, cat. no. 610006)
- Filter supports for extruder: we use 10 mm filter supports (Avanti, cat. no. 610014)
- Dialysis tubing: we use 10 mm Membra-Cel dialysis tubing with molecular weight cut-off 14 kDa (Membra-Cel, Roth, cat no. 1780.1)
- Plastic clips: we use Spectrum Dialysis Tubing Closures (Spectra/Por, cat. no. 888-11614)
- 2 L beaker or Erlenmeyer flask
- Unautoclaved 2 mL sample tubes
- Magnetic stirrer and magnetic stir bar
- Temperature regulated water bath with connective tubing and a glass cooling cell: we use a Julabo F10 ultrapure water bath (Gemini, cat. no. 01819) and a SONOPULS KG 3 (Faust, cat. no. 9.650 235) glass cooling cell with water jacket
- Micro pH electrode with integrated temperature sensor: we use an InLab Micro Pro-ISM electrode (Mettler Toledo, cat. no. 51344163)
- Computer with LabX direct pH 2.3 software (Mettler Toledo)
- Warm white LED lamp: we use a JANSÖ LED lamp (IKEA, cat. no. 903.860.12)
- Laboratory film: we use Parafilm M sealing film
- Syringe and filter: we use disposable 10 mL syringes ONCE/CODAN (HUBERLAB, cat. no. 3.7410.06) and single use hydrophilic 0.2 μm Sartorius Minisart syringe filters (fisher scientific, cat. no. 10730792)
- Carbon-coated copper electron microscopy grids: we use 400 mesh copper grids with a thin carbon film (Gridtech, cat. no. Cu-400CN)
- Microscope slide
- Glow discharge system including a high voltage power supply and a vacuum chamber: we use a custom build but any commercially available system works
- Precision forceps: we use 0.1 × 0.06 mm Dumont Dumoxel Tweezers #5 (World Precision Instruments, cat. no. 14098)
- Blotting paper for microscope slides: we use Macherey-Nagel MN 224 blotting paper for microscope slides
- Electron microscopy grid storage box: we use a grid storage box for 100 grids from Electron Microscopy Sciences
- Transmission electron microscope: we use a FEI Tecnai Spirit transmission electron microscope (Thermo Fisher, Reinach, Switzerland) equipped with an FEI Eagle CCD camera
3. Procedure
3.1. Site-Directed Mutagenesis of Bop in pUC18 (0.5 Day)
- Introduce a C-terminal His10-tag into the bop gene, which encodes wild-type BR (BR-wt), by PCR with pUC18-bop as a template, 5′-pUC-BamHI-BR as a forward primer and 3′-BR-C-His10-HindIII as a reverse primer (see Section 2.1). You can use a PCR kit of your choice, we use the Phusion High-Fidelity PCR kit. Prepare the following PCR master mix (Table 1) on ice or follow the manufacturer’s instructions for your preferred kit:
- Run the PCR reaction using the following program (Table 2):
- Purify your PCR product (bop-C-His10) using a PCR purification kit (see Section 2.1) and follow the manufacturer’s instructions. We use an elution volume of 32 µL.
3.2. Insertion of Bop-C-His10 into pHS Blue (0.5 Day)
- Digest the purified PCR product with BamHI-HF and HindIII-HF. Prepare the following reaction mixture (Table 3) and incubate for 1.5 h at 37 °C.
- In parallel, digest the pHS blue plasmid with BamHI-HF and HindIII-HF as well. Prepare the following reaction mixture (Table 4) and incubate for 1.5 h at 37 °C.
- Load the digested insert and the digested pHS blue plasmid on a 1% (w/v) agarose gel prepared with TAE buffer and let it run.
- Cut out the resulting bands for the insert and the plasmid and purify them using a gel extraction kit (see Section 2.1). Elute with a volume of 20 µL.
- Ligate the plasmid and the insert using a DNA ligation kit of your choice (see Section 2.1). Prepare the following ligation reaction mixture (Table 5) and incubate it for 45 min at RT.
3.3. Amplification of pHS Blue-Bop-C-His10 in E. coli DH5α (1 Week)
- Let 50 µL of E. coli DH5α competent cells thaw on ice.
- Add 5 µL of the ligation product (pHS blue plasmid with bop-C-His10 insert) to the competent cells. Incubate on ice for 20 min.
- Incubate for 60 s at 42 °C.
- Incubate for 2 min on ice.
- Add 900 µL of LB and incubate at 700 rpm for 30 min at 37 °C in an Eppendorf tube shaker.
- Centrifuge at 14,000 rpm for 2 min at RT.
- Remove 880 µL of the supernatant.
- Resuspend the pellet in the remaining supernatant.
- Spread out the transformed cells on an LB-agar plate supplemented with 25 µg/mL kanamycin. Incubate overnight at 37 °C.
- Pick 4 colonies from the LB-agar plate and, with each, inoculate 10 mL of LB medium supplemented with 25 µg/mL kanamycin. Incubate at 180 rpm overnight at 37 °C.
- Use 5 mL of the overnight cultures to prepare glycerol stocks for each colony at a final concentration of 20% glycerol.
- Isolate the pHS blue-bop-C-His10 plasmid from the remaining 5 mL of the overnight cultures of each colony using a plasmid DNA isolation kit of your choice. We use an E.Z.N.A. Plasmid DNA Mini Kit I with an elution volume of 60 µL.
- Measure the concentration of the isolated pHS blue plasmid by UV-Vis spectroscopy at 260 nm. The OD260/OD280 ratio should be between 1.8 and 2.0, indicating pure DNA.
- Digest the isolated plasmids with BamHI-HF and HindIII-HF. Prepare the following reaction mixture (Table 6) and incubate for 1.5 h at 37 °C.
- Load the digested plasmid on a 0.8% (w/v) agarose gel prepared with TAE buffer and run the gel.
- The gel should show two bands, one for the vector (~10.7 kb) and one for the insert (~1.2 kb). If that is the case, let the DNA of bacteriorhodopsin in the pHS blue-bop-C-His10 construct be sequenced by a service company and check for your desired modification/mutation, and possible random mutations. If the sequence of a clone is correct, inoculate 50 mL LB supplemented with 25 µg/mL kanamycin with 5 µL glycerol stock of the corresponding clone and incubate at 180 rpm overnight at 37 °C.
- Isolate the pHS blue-bop-C-His10 plasmid from the overnight culture using a plasmid DNA isolation kit of your choice. We use an E.Z.N.A. Plasmid DNA Midi Kit I with an elution volume of 500 µL. Measure the DNA concentration as described above.
 PAUSE STEP pHS blue-bop-C-His10 plasmids can be stored at −20 °C for years.
3.4. Preparation of H. salinarum L33 Cells for Transformation (2–3 Days)
- Inoculate 10 mL L37 medium in a 50 mL conical tube with 10 µL H. salinarum L33 from a glycerol stock. This suffices for four transformations.
- Incubate the culture at 170 rpm and 40 °C until the OD600 is between 0.6 and 0.8, typically reached after 2–3 days.
3.5. Preparation of Plasmid for Transformation (10 Min)
- Place a volume containing 3 µg of the pHS blue-bop-C-His10 plasmid at the bottom of a 15 mL conical vial, add 5 M NaCl to the drop to reach a final concentration of 2 M (e.g., 3 µL plasmid (1 µg/µL) + 2 µL 5 M NaCl) and mix the resulting drop with a pipette. Close the tube to avoid evaporation and store at room temperature until it is used for transformation.
3.6. Transformation of H. salinarum L33 (2 H)
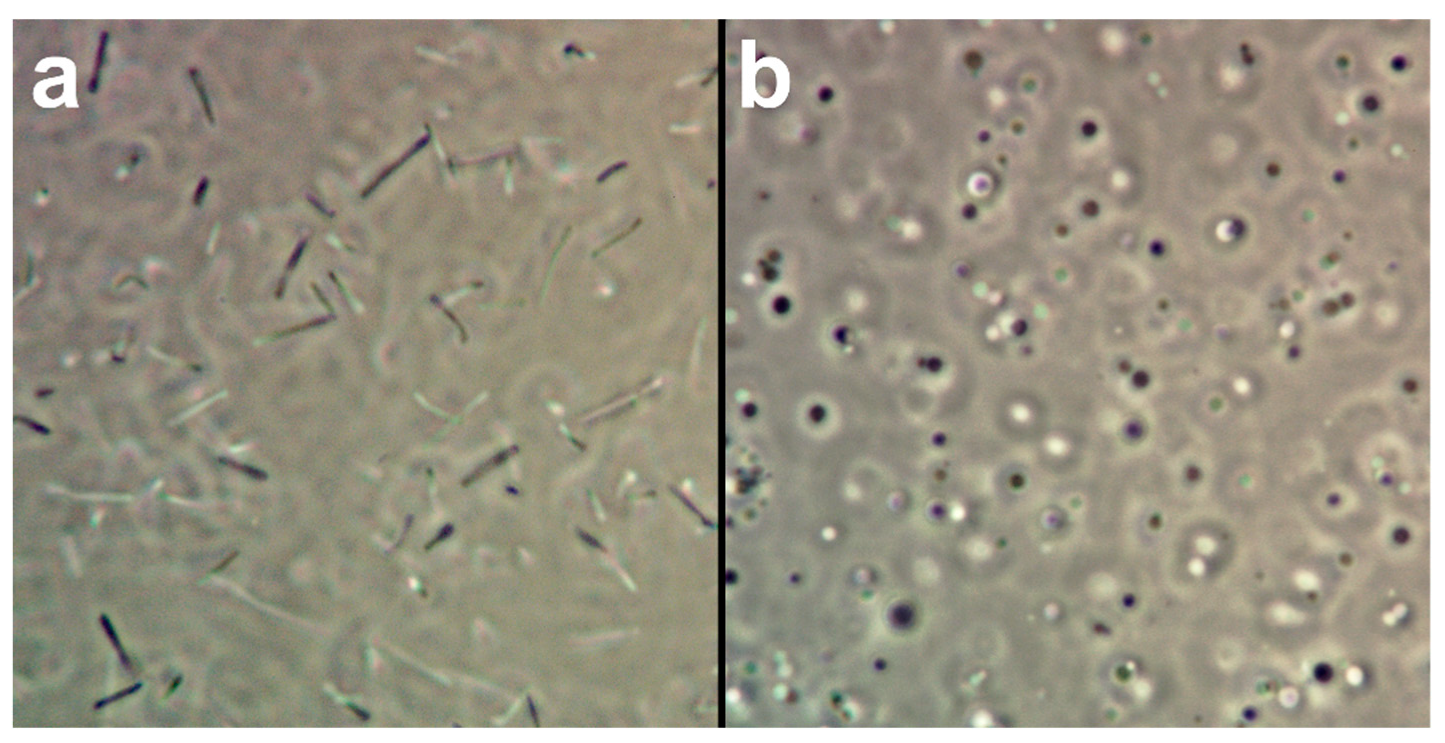
- Pellet the H. salinarum culture at 4000× g for 15 min at room temperature, discard the supernatant, resuspend the pellet in 1 mL of SPH and take a 50 µL sample for spheroplast formation control.
- Add 50 µL of EDTA solution to the resuspended cells, gently mix by shaking the tube by hand and take another 50 µL sample.
- If all cells turned from rods to spheroplasts, add 200 µL of the resuspended cells to the 15 mL conical vial containing the plasmid and incubate for 20 min at room temperature.
- Carefully add an equal volume of PEG solution to the spheroplast-DNA-mix (200 µL spheroplasts + volume of diluted DNA, e.g., 5 µL) and incubate for 20 min at room temperature.
- Fill up the conical vial to 10 mL with spheroplast dilution solution and incubate for 30 min at 40 °C.
3.7. Outgrowth of Transformed Cells (2 Days)
- Pellet the cells at 4000× g for 10 min at room temperature and resuspend in 1 mL regeneration medium. Place the tube horizontally in the incubator instead of standing in a rack and incubate at 180 rpm and 37 °C for 2 days.
3.8. Plating and Colony Formation (1–2 Weeks)
- Dilute the transformed cells and spread out 50 µL on L37-agar plates supplemented with 0.3 µg/mL novobiocin. As transformation efficiency varies strongly, try different dilutions (e.g., 1:100 and 1:1000). Seal the plates in plastic bags or with plastic tape to avoid evaporation during incubation (see Section 5.2). Incubate at 37 °C for 1–2 weeks.
3.9. Colony Picking and Cultivation (1 Week)
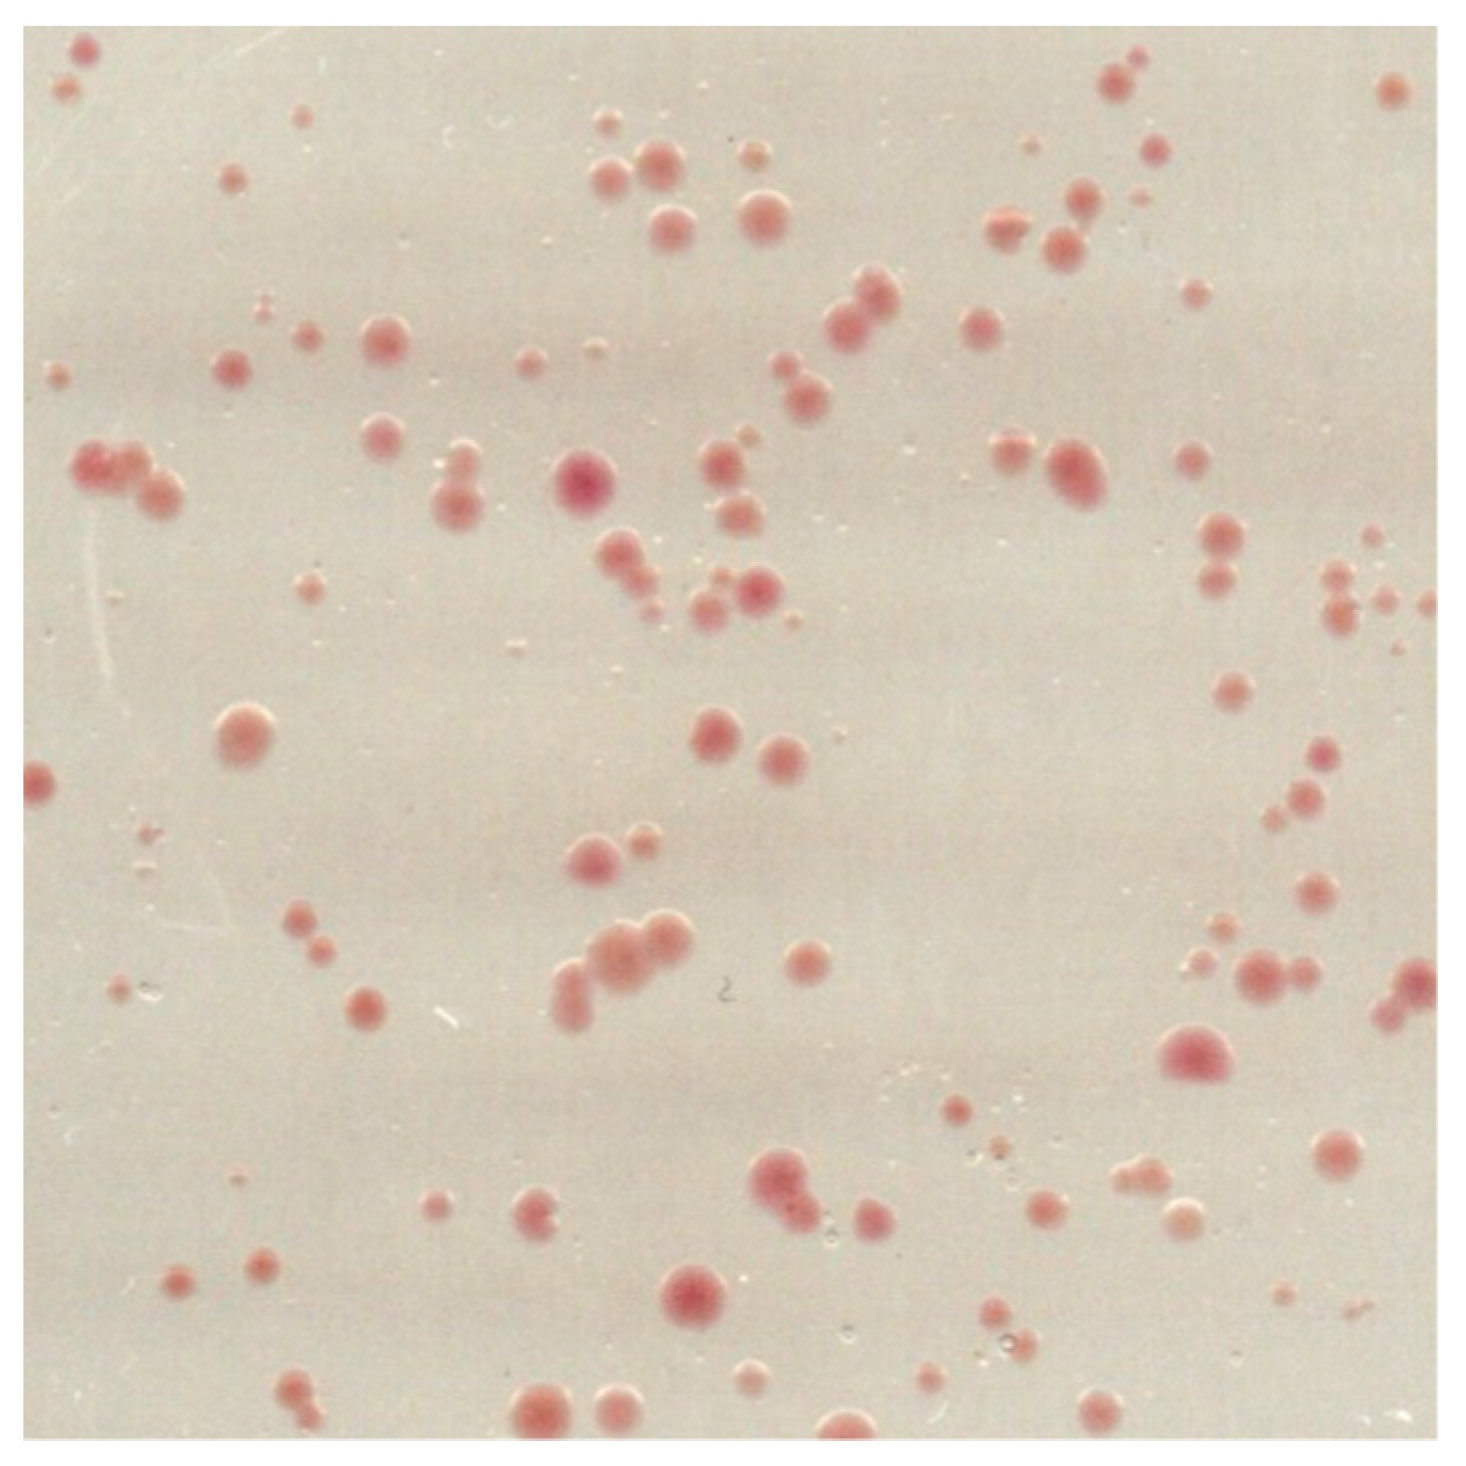
- Pick 10–20 colonies from the L37-agar plates (Figure 2) and with each, inoculate 20 mL of L37 supplemented with 0.3 µg/mL novobiocin in a 50 mL conical vial. Incubate at 170 rpm and 40 °C for 1 week.
![Mps 03 00051 i003]() CRITICAL STEP Try to pick colonies of different sizes and colour intensities. Colonies with a strong red colour may express considerable amounts of BR-wt. In our specific case, the colours did not vary significantly and the size of the clones did not correlate with the ratio of BR-C-His10 to BR-wt.
CRITICAL STEP Try to pick colonies of different sizes and colour intensities. Colonies with a strong red colour may express considerable amounts of BR-wt. In our specific case, the colours did not vary significantly and the size of the clones did not correlate with the ratio of BR-C-His10 to BR-wt.

3.10. Glycerol Stock Preparation (30 Min)
- Centrifuge 8 mL of each culture at 4000× g for 15 min at room temperature and resuspend in 3.2 mL L37. Add 800 µL of 50% (w/v) glycerol solution to reach a final concentration of 10%. Freeze with liquid nitrogen and store at −80 °C.
3.11. Clone Screening by Small-Volume Purple Membrane Preparation (0.5 Day)
- Centrifuge 10 mL of each culture at 5000× g for 15 min at 4 °C, resuspend in 1.6 mL basal salt and transfer the sample to a 2 mL Eppendorf tube. Centrifuge at 8000× g for 5 min at 4 °C and discard the supernatant.
- Add 700 µL of 10 mM MgSO4 supplemented with 30 µg DNAse (=12 µL of a 2.5 mg/mL solution). Lyse the cells by resuspending with a pipette until the solution is homogeneous.
![Mps 03 00051 i004]() CRITICAL STEP Remaining DNA leads to a viscous, inhomogeneous purple membrane sample and reduces the yield.
CRITICAL STEP Remaining DNA leads to a viscous, inhomogeneous purple membrane sample and reduces the yield. - Remove the cell debris by centrifuging the samples at 4300× g for 1 min at 4 °C, followed by two centrifugations at 7000× g for 1 min at 4 °C. Transfer the supernatant to a new tube after each centrifugation.
- Transfer the samples to 1 mL ultracentrifuge tubes and ultracentrifuge the membranes at 55,000× g for 15 min at 4 °C. Resuspend the pellets in 700 µL Milli-Q ultrapure water with a pipette and repeat the last centrifugation.
- Resuspend the pellets in 700 µL Milli-Q ultrapure water and ultracentrifuge the membranes at 60,000× g for 15 min at 4 °C. Resuspend the pellets in 700 µL Milli-Q ultrapure water with a pipette and repeat the last centrifugation.
- Resuspend the pellets in 25 µL Milli-Q ultrapure water with a pipette.
- Measure the concentration of bacteriorhodopsin in each sample by UV-Vis spectrometry (see Section 5.2).

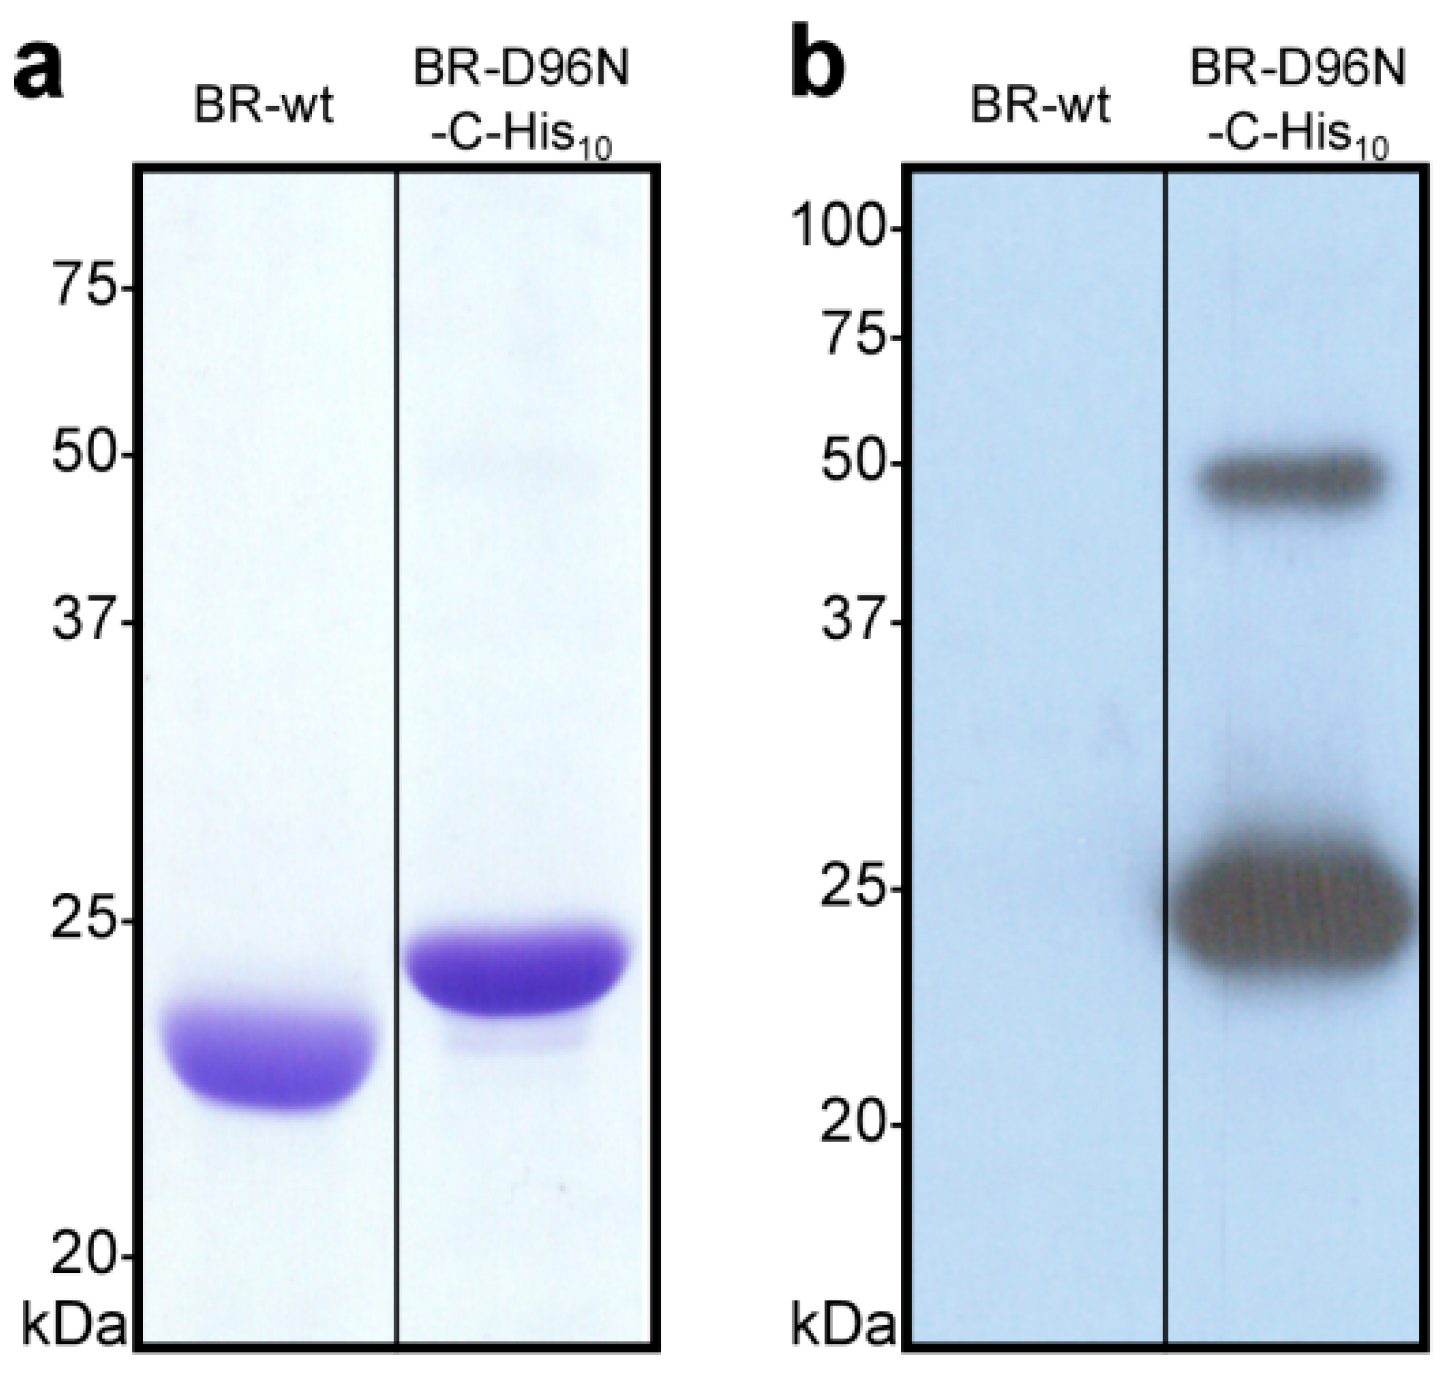
3.12. Evaluation of BR Expression by Coomassie Brilliant Blue-Stained SDS-PAGE and Western blot analysis (0.5 Day)
- Load membranes of each sample corresponding to 5 µg of bacteriorhodopsin on a 13.5% SDS-PAGE gel. As a negative control, include an equivalent of H. salinarum S9 membranes corresponding to 5 µg of bacteriorhodopsin (for expression and purification of S9 membranes see Section 3.14 and Section 3.15 of this protocol). If available, as a positive control, include an equivalent of membranes from a H. salinarum strain, expressing a His10-tagged bacteriorhodopsin corresponding to 5 µg of bacteriorhodopsin. Run the electrophoresis at 200 V until the dye front reaches the end of the gel and stain the gel using Coomassie Brilliant blue R-250 according to standard protocols.
- For Western blot, load an equivalent of membranes of each sample corresponding to 0.5 µg of bacteriorhodopsin on a 13.5% SDS-PAGE gel. As a negative control, include an equivalent of H. salinarum S9 membranes corresponding to 0.5 µg of bacteriorhodopsin. Run the electrophoresis at 200 V.
- Transfer the samples onto a PVDF-membrane, e.g., using a semi-dry blotting system. Incubate the membrane in 30 mL TBS containing 3% (w/v) BSA for 1 h at room temperature under gentle agitation to reduce unspecific binding of the antibodies.
- Incubate the membrane with anti-penta-His mouse primary antibody diluted 1:3000 in 30 mL TBS containing 3% (w/v) BSA for 1 h at room temperature under gentle agitation.
- Wash the membrane three times with 30 mL TBS containing 0.5% (v/v) Tween 20 for 10 min at room temperature under gentle agitation. Incubate with goat anti-mouse horseradish peroxidase (HRP)-conjugated secondary antibody diluted 1:3000 in 30 mL TBS containing 3% (w/v) BSA for 1 h at room temperature under gentle agitation.
- Wash the membrane three times with 30 mL TBS containing 0.5% (v/v) Tween 20 for 10 min at room temperature under gentle agitation.
- Add 2 mL of ECL-detection reagent (1 mL of each) to the membrane and incubate for 2 min at room temperature under gentle agitation. Seal the membrane in a plastic bag and expose an X-ray film.
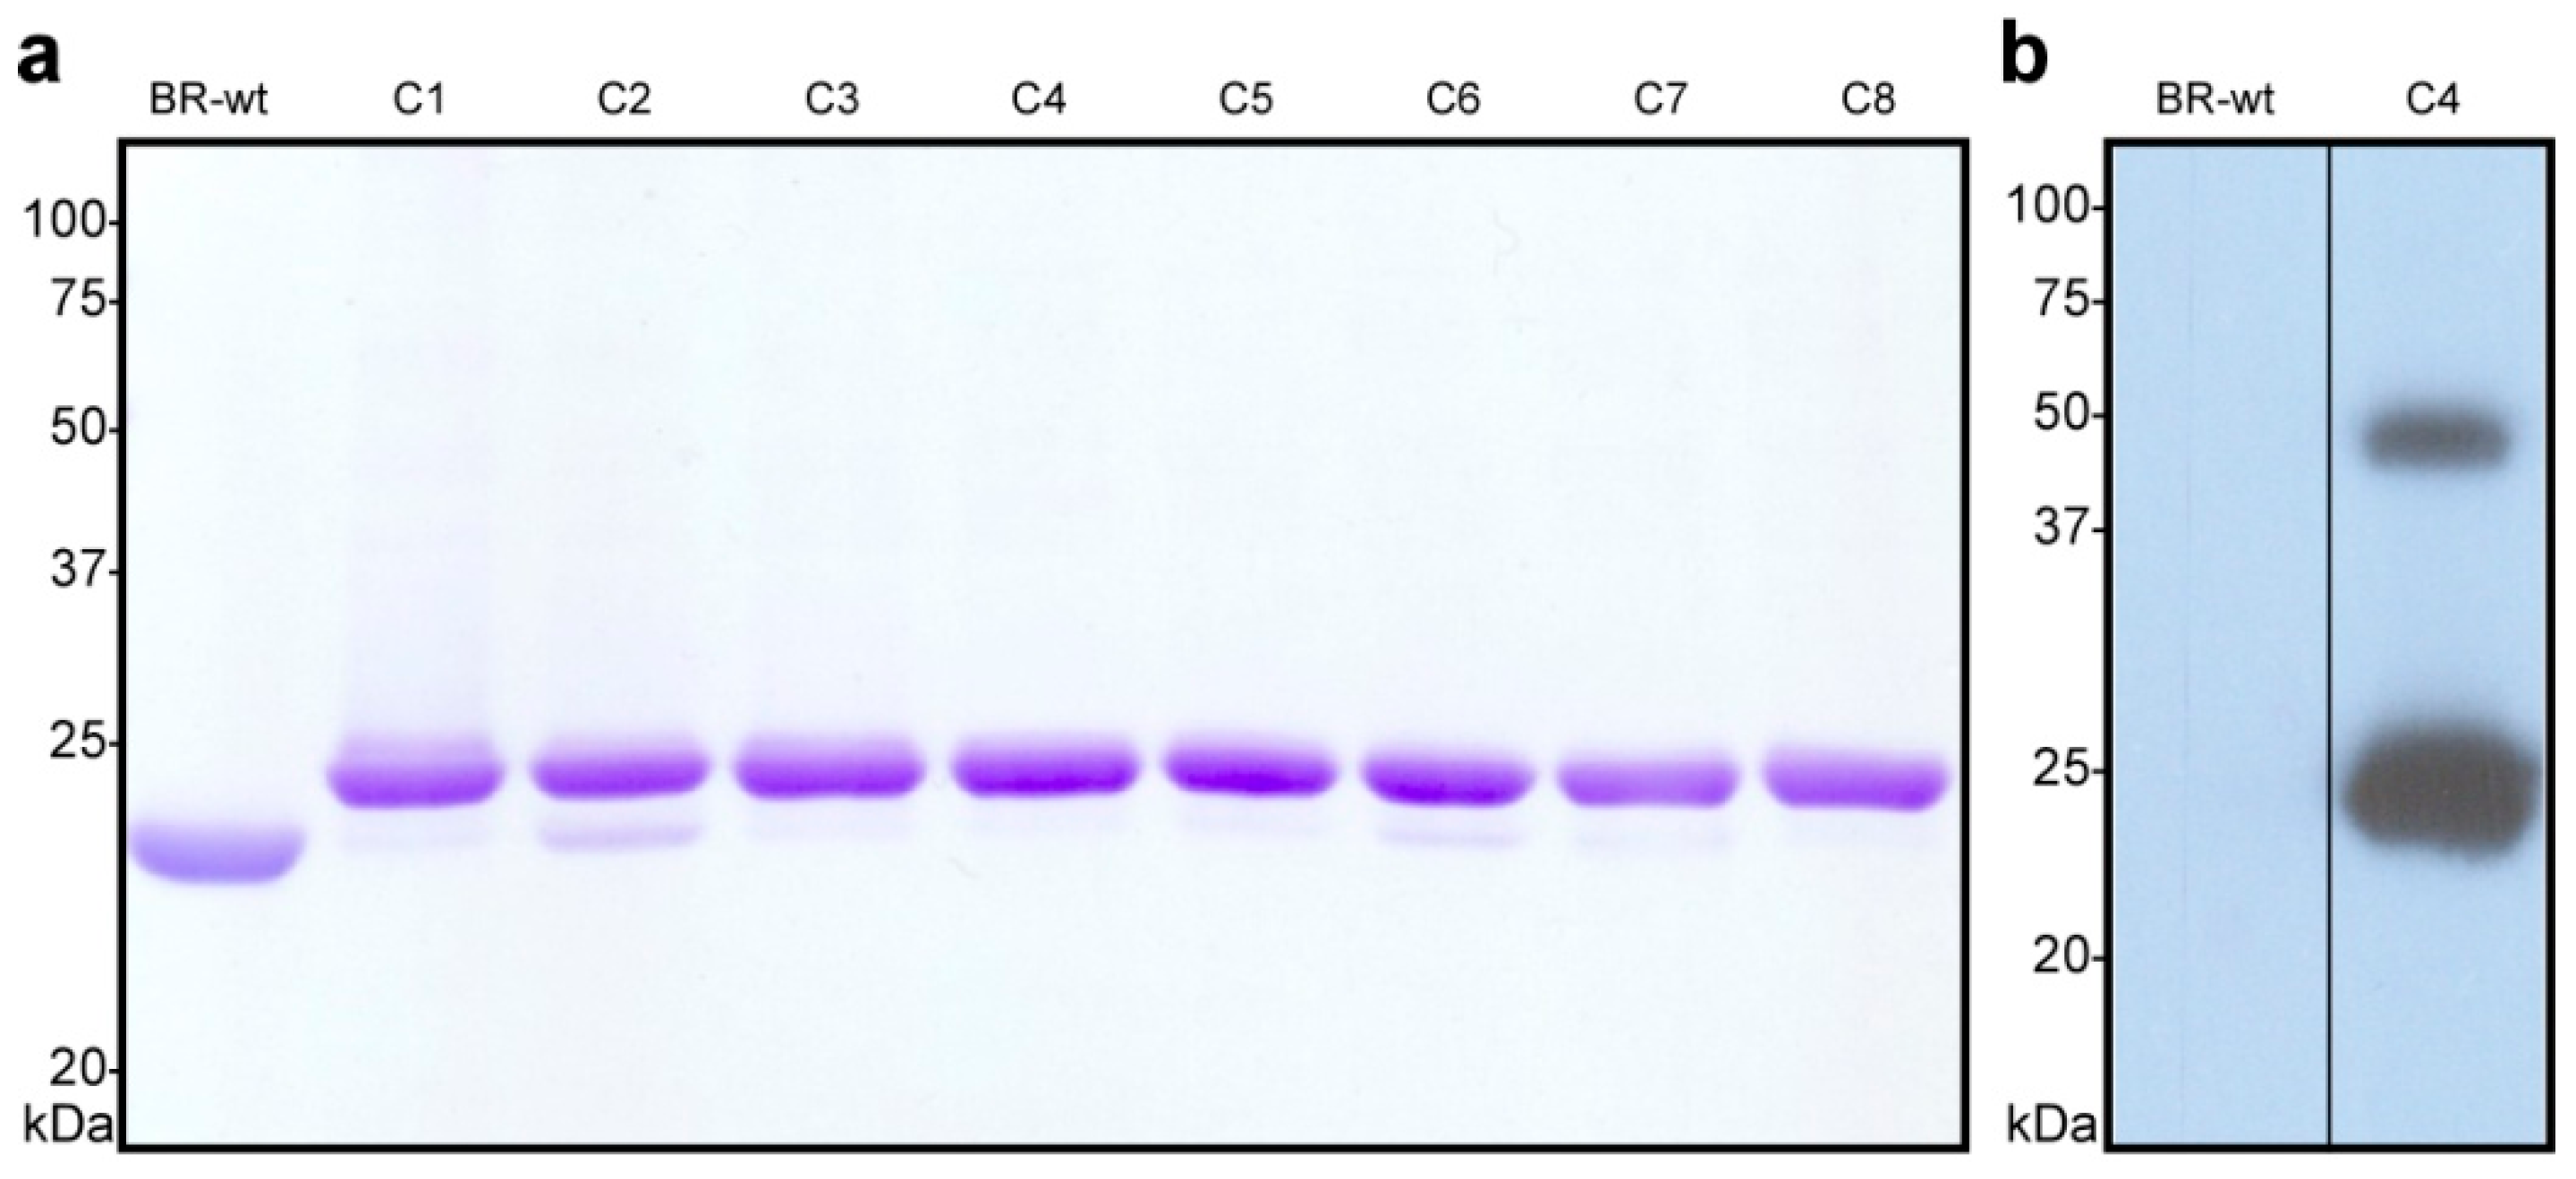
- Estimate the ratio of His10-tagged to wild-type bacteriorhodopsin in the different samples by SDS-PAGE (Figure 3a) and identify the best clone(s). If a pure clone could be obtained (i.e., no or a very small lower band), continue working with the glycerol stock of the corresponding clone. As an example, in Figure 3a, clone number 2 (C2) contains a considerable amount of BR-wt, while clone number 4 (C4) can be considered of high purity. The Western blot in Figure 3b shows that clone C4 contains the engineered C-terminal His10-tag. A smaller band around 50 kDa indicates the presence of SDS-resistant BR-C-His10 dimers.
3.13. Iterative Clone-Picking to Optimize Expression of Engineered BR (2–3 Weeks)
- If the ratio of His10-tagged to wild-type bacteriorhodopsin of the best clone is not satisfactory, inoculate 20 mL of L37 supplemented with 0.3 µg/mL novobiocin in a 50 mL conical vial with 10 µL of the glycerol stock of the best clone and incubate at 170 rpm for 1 week at 40 °C. Prepare from this culture new L37-agar plates, pick clones and repeat the analysis as described in Section 3.8, Section 3.9, Section 3.10, Section 3.11 and Section 3.12. This process may have to be iterated several times to obtain a clone that only expresses the His10-tagged bacteriorhodopsin construct.
3.14. Large-Volume Cultivation of a Selected Transformed H. Salinarum L33 Clone (2 Weeks)
- Inoculate 50 mL of L37 supplemented with 0.3 µg/mL novobiocin in a 250 mL Erlenmeyer flask with 50 µL of the glycerol stock of the selected clone. Incubate at 170 rpm for 1 week at 40 °C.
- Inoculate 2 L of L37 supplemented with 0.3 µg/mL novobiocin in a 5 L Erlenmeyer flask with 40 mL of the previous culture. Incubate at 170 rpm for 1 week at 40 °C. For a standard large-volume cultivation, we inoculate three flasks containing 2 L of each medium.
3.15. Purple Membrane Preparation (1.5 Days)
- Centrifuge the culture at 10,000× g for 20 min at 4 °C, resuspend the pellet in 400 mL basal salt using a 25 mL serological pipette and repeat the last centrifugation. Before centrifugation, measure the weight of the empty centrifugation tubes to determine the cell mass.
- Resuspend the pellet in 25 mL/g cell mass of Milli-Q ultrapurified water supplemented with 0.02% (w/v) NaN3 (preservative to inhibit bacterial growth). Add 1 mg DNase/g cell mass and gently stir the solution at 4 °C overnight to lyse the cells by osmotic shock.
![Mps 03 00051 i005]() CRITICAL STEP Remaining DNA leads to a viscous, inhomogeneous purple membrane sample and reduces the yield.
CRITICAL STEP Remaining DNA leads to a viscous, inhomogeneous purple membrane sample and reduces the yield. - Remove the cell debris by centrifuging the sample at 4300× g for 10 min at 4 °C, followed by two centrifugations at 7600× g for 10 min at 4 °C. Transfer the supernatant to a new tube after each centrifugation. Over the course of the three centrifugations, the cell debris pellets should change in color from brown to purple.
- Transfer the supernatant to two 94 mL ultracentrifuge tubes, fill them up with Milli-Q ultrapurified water and ultracentrifuge at 55,000× g for 1 h at 4 °C. Resuspend the pellets in Milli-Q ultrapurified water with a pipette, combine them in one 94 mL ultracentrifuge tube, fill it up with Milli-Q ultrapurified water and repeat the last centrifugation.
![Mps 03 00051 i006]() CRITICAL STEP There might still be some remaining cell debris as a gray spot at the center of the pellets. Resuspend the purple parts around it very carefully with a pipette by letting the water flow over the pellet without detaching the gray part from the wall of the tube. If the gray spots are relatively small, the whole pellets can be resuspended after the first centrifugation. It will be easier to separate the cell debris after the second centrifugation when the two gray spots from the previous pellets are combined in one spot.
CRITICAL STEP There might still be some remaining cell debris as a gray spot at the center of the pellets. Resuspend the purple parts around it very carefully with a pipette by letting the water flow over the pellet without detaching the gray part from the wall of the tube. If the gray spots are relatively small, the whole pellets can be resuspended after the first centrifugation. It will be easier to separate the cell debris after the second centrifugation when the two gray spots from the previous pellets are combined in one spot. - Resuspend the pellet in Milli-Q ultrapurified water in the same tube with a pipette and ultracentrifuge at 60,000× g for 1 h at 4 °C. Resuspend the pellet with Milli-Q ultrapurified water in the same tube and repeat the last centrifugation.
- Resuspend the pellet in ~0.5 mL/g cell mass of Milli-Q ultrapurified water supplemented with 0.02% (w/v) NaN3 with a pipette and homogenize using a glass homogenizer. You may have to adjust the volume depending on the expression efficiency of your construct and the concentration needed for following experiments.
- Measure the concentration of bacteriorhodopsin in your sample by UV-Vis spectrometry (see Section 5.2).
- Determine the purity of your sample and validate the presence of the His10-tag by Coomassie Brilliant blue-stained SDS-PAGE and Western blot (see Section 3.12).
![Mps 03 00051 i007]() PAUSE STEP Purple membrane samples in 0.02% NaN3 can be stored at 4 °C for years.
PAUSE STEP Purple membrane samples in 0.02% NaN3 can be stored at 4 °C for years.


3.16. Detergent-Mediated Reconstitution of BR into Preformed Liposomes (2 Days)
- Dry 10 mg of DOPC dissolved in chloroform in a 10 mL round bottom flask under a constant stream of nitrogen gas with gentle shaking. A thin layer of lipid is beneficial for the optimal formation of liposomes. Remove residual chloroform traces by keeping the flask under vacuum in a desiccator overnight.
- On the next day, solubilize 400 μg of BR in 3% (w/v) OG at a protein concentration of 1 mg/mL (e.g., add 120 μL of 10% (w/v) OG to 100 μL 4 mg/mL BR and 180 μL ultrapure water). Incubate the mixture for 3 h at room temperature under gentle rotation or shaking (avoid foam formation) and ensure that it is protected from light. Finally, the mixture is centrifuged for 15 min at 100,000× g to remove unsolubilized material.
- In the meantime, add 2 mL of hydration buffer to the dried lipid and shake it for around 30 min until the lipid is completely resuspended.
- Assemble the extruder with a 200 nm pore size membrane and one filter support on each side. Flush it with 1 mL of hydration buffer using the syringes to pass the solution back and forth. Then, pass the liposome suspension through in the same way 19 times. With an increasing number of passages, the suspension should become more transparent, indicating a reduction in particle size.
- Start this step before the centrifugation of solubilized BR. Destabilize the extruded liposomes with 0.4% (w/v) OG by adding 83 μL of 10% (w/v) OG for 15 min with gentle shaking.
- Add the solubilized BR to the destabilized liposomes and incubate with gentle shaking for 30 min.
![Mps 03 00051 i008]() CRITICAL STEP The final OG concentration after adding the solubilized protein to the liposomes should always be close to 0.8%. This ensures optimal destabilization and the most efficient protein insertion. Should you want to change the amount of protein for the reconstitution, make sure to compensate the amount of detergent added.
CRITICAL STEP The final OG concentration after adding the solubilized protein to the liposomes should always be close to 0.8%. This ensures optimal destabilization and the most efficient protein insertion. Should you want to change the amount of protein for the reconstitution, make sure to compensate the amount of detergent added. - In the meantime, soak the dialysis tubing and rinse it with Milli-Q ultrapure water.
- Close the dialysis tubing on one side with a plastic clip, fill in the protein liposome mixture and then close the other side with a second plastic clip. Place the filled dialysis tube in 2 L of dialysis buffer. Add a magnetic stir bar and dialyse overnight at 4 °C with gentle stirring. Up to two samples can be dialysed together in 2 L of dialysis buffer.
- Harvest the dialysed samples and ultracentrifuge them 10 min at 200,000× g. Resuspend the pellet in 1 mL of measuring solution by pipetting and centrifuge again. Wash the samples once more by repeating the resuspension and centrifugation, and finally resuspend the proteoliposomes in 800 μL of measuring solution.

3.17. Functional Characterization of BR Proteoliposomes by Photoactivity Assay (1 Day)
- Transfer the proteoliposome suspension to a clear unautoclaved 2 mL tube and add an appropriately sized magnetic stir bar. Autoclaved tubes tend to get cloudy, thus reducing the illumination of the samples in the next step.
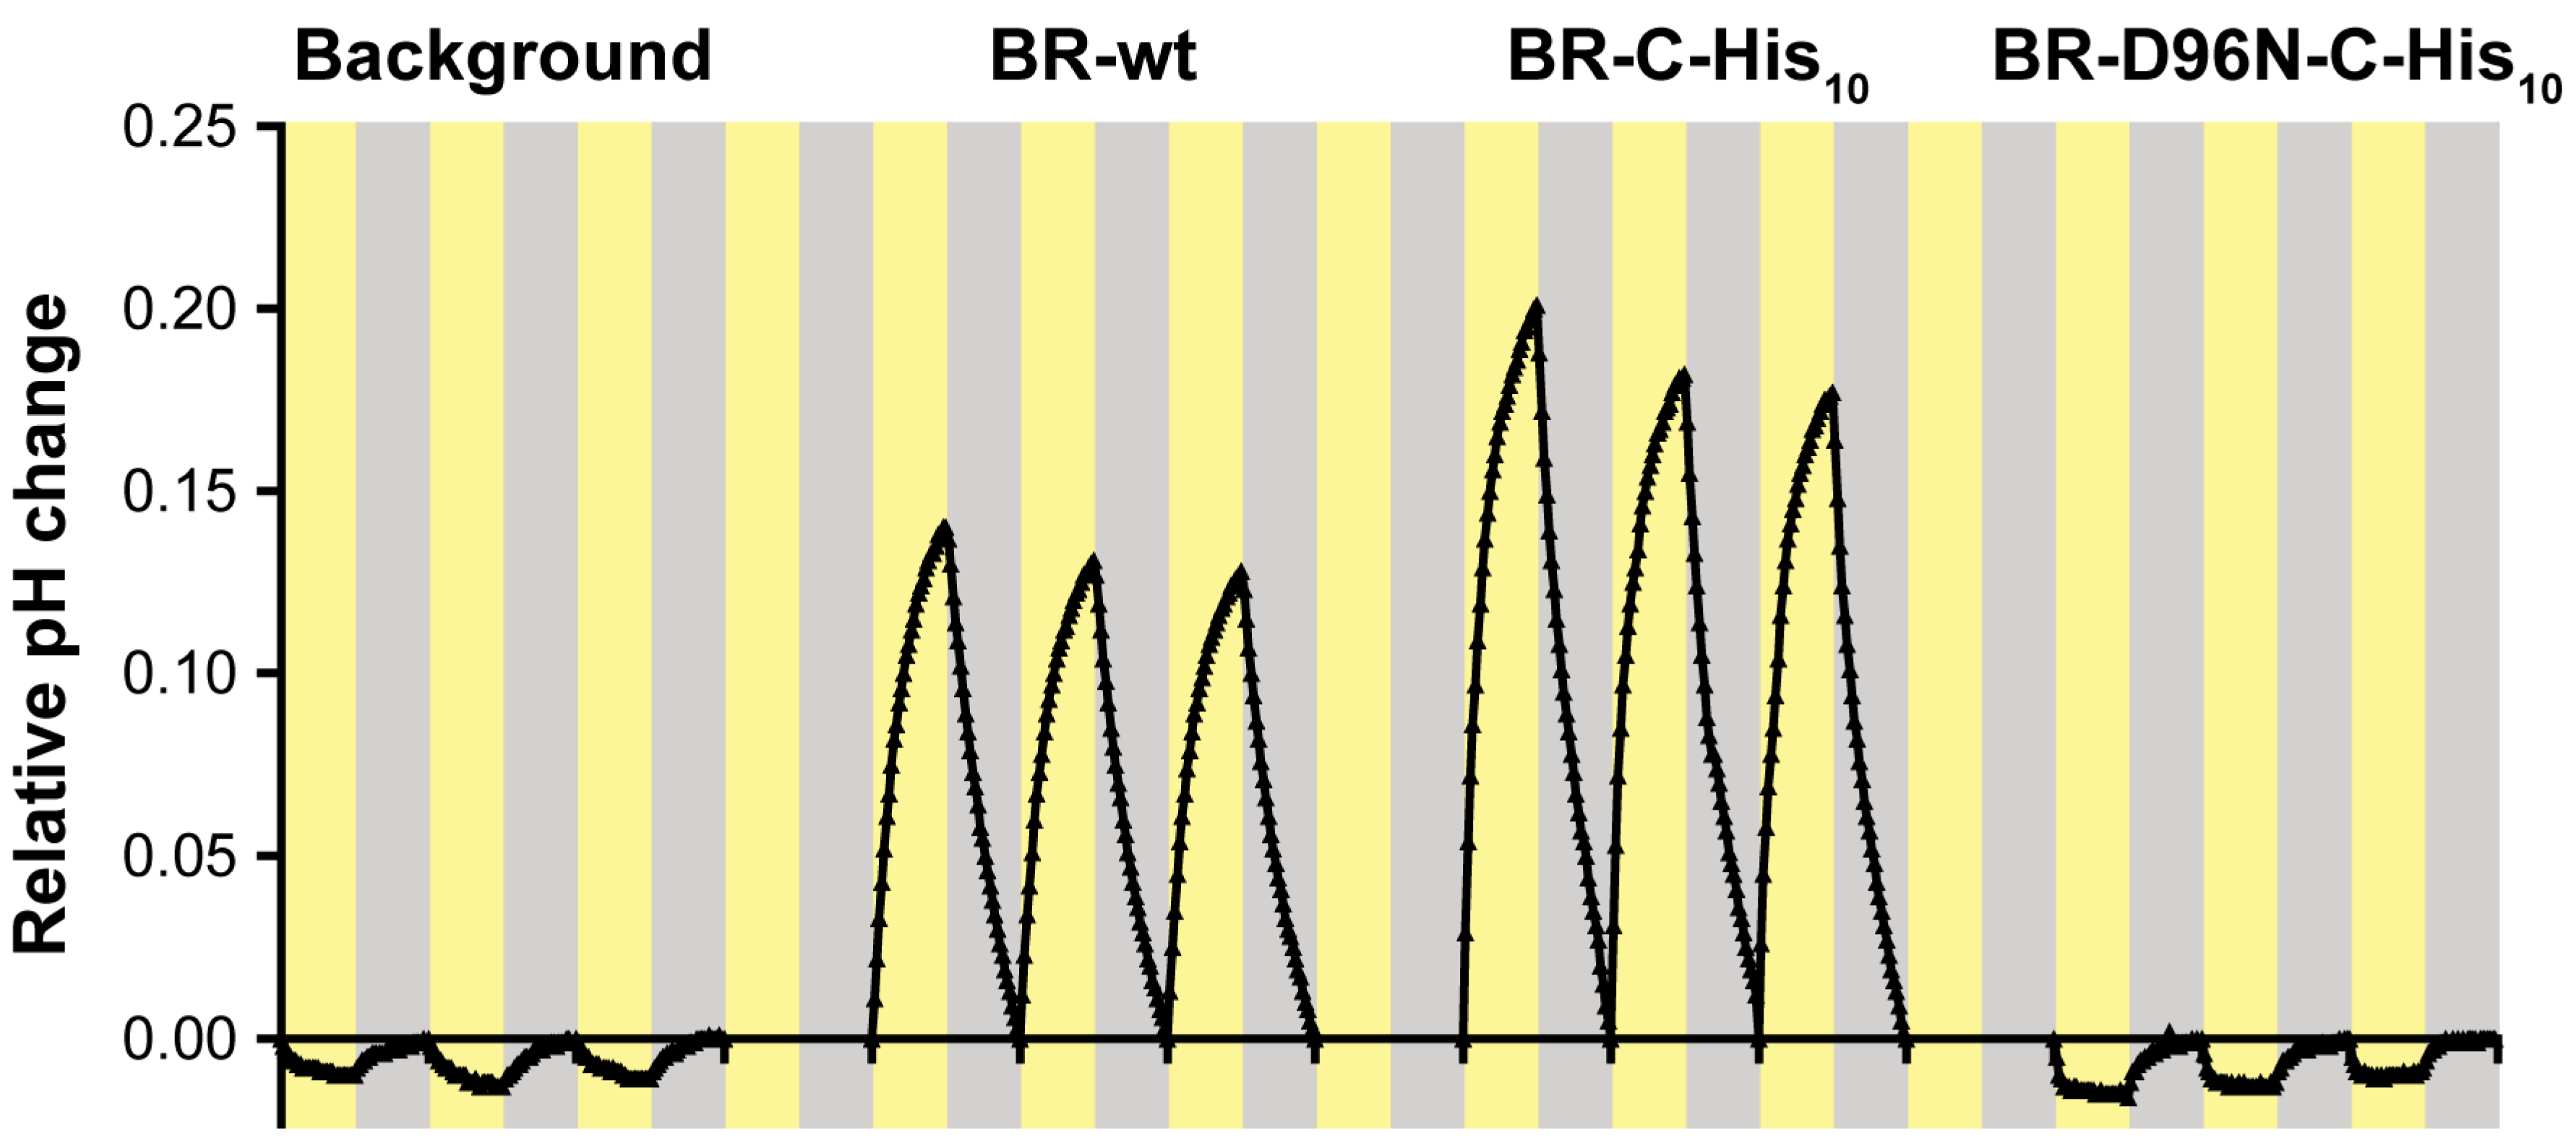
- The photoactivity of the proteoliposomes is assessed by measuring the pH change in the extravesicular medium upon illumination using a micro pH electrode. The sample should be constantly stirred and cooled to 18 °C by placing the tube in a transparent glass cooling cell with a water jacket. Illumination is provided by a warm white LED lamp (i.e., full spectrum). Data are collected in intervals of 30 s using a computer connected to the pH meter and running an appropriate pH meter software. Optimal illumination cycles for the described proteoliposomes comprise an initial 15 min adaptation period in the dark, followed by alternating periods of illumination and darkness of 15 min each (see Figure 4). Make sure to collect at least 4 peaks as the first one might exhibit unfavourable fluctuations. For a detailed overview and an illustration of the setup, see Hirschi et. al. (2019) [67].
- Finally, the data can be corrected for continuous pH drift by making the following approximation. A continuous piecewise linear function is constructed from the starting points of each illumination cycle and subtracted from the pH curve. This will set the starting points of each cycle to 0, thus converting the scale to relative pH change and removing any drift occurring during the recording. For a more detailed description of this process consult Harder et. al. (2016) [68].
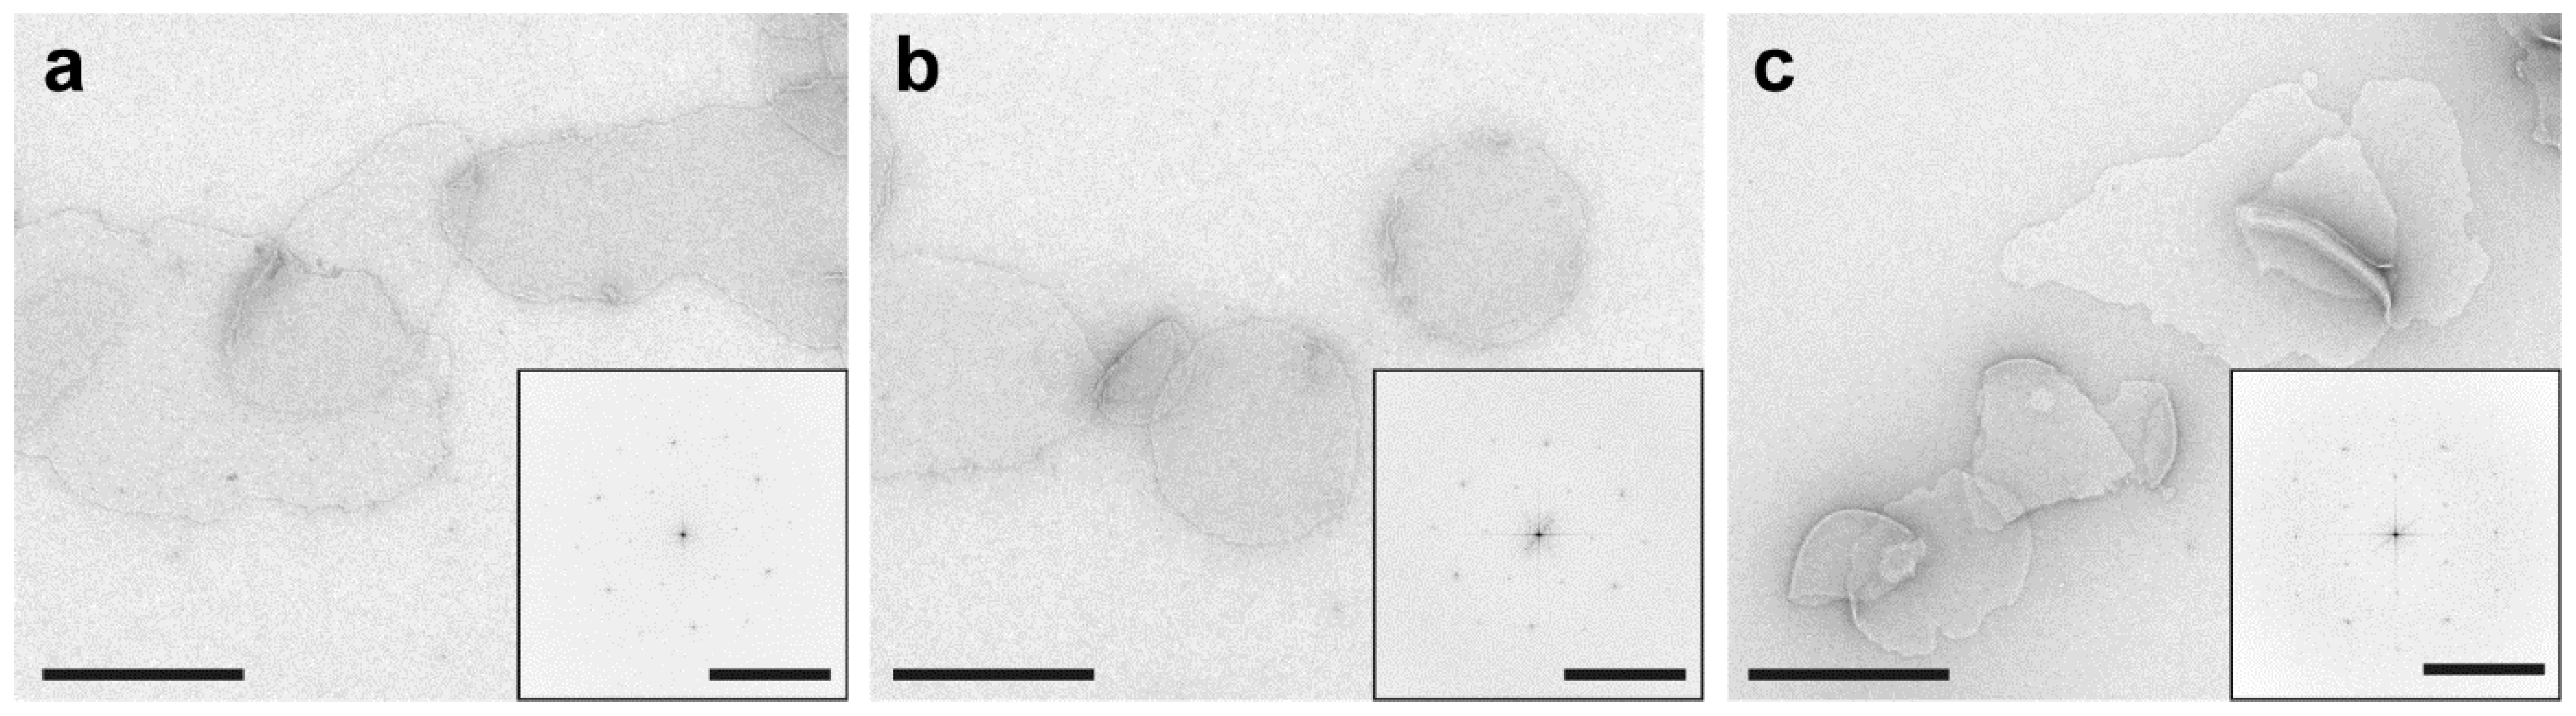
3.18. Structural Characterization of Purple Membranes by Negative Stain Transmission Electron Microscopy (1 Day)
- Prepare 0.75% (w/v) uranyl formate solution and filter it with a 0.2 μm syringe filter before use to remove any precipitates.
- Carbon-coated copper grids are placed with the coated (shiny) side facing up on a Parafilm-wrapped microscope slide. Use precision forceps while handling microscope grids and only hold them on the edges to avoid damaging the center. Grids are then glow discharged for 10 s under vacuum.
![Mps 03 00051 i009]() CRITICAL STEP Glow discharging electron microscopy grids is essential for the efficient adsorption of hydrophilic samples such as proteoliposomes to the hydrophobic grids. However, excessive glow discharging should be avoided as it can damage the extremely thin carbon layer.
CRITICAL STEP Glow discharging electron microscopy grids is essential for the efficient adsorption of hydrophilic samples such as proteoliposomes to the hydrophobic grids. However, excessive glow discharging should be avoided as it can damage the extremely thin carbon layer. - A total of 5 μL of purple membrane at a concentration of about 1 mg/mL is adsorbed onto a glow discharged grid for 1 min.
- The liquid is removed by gently touching the side of the grid with blotting paper. Then, the grid is immediately washed three times by placing a 5 μL drop of ultrapure water on the grid and removing it using the blotting paper.
- A total of 5 μL of uranyl formate solution is placed on the grid and immediately blotted. Then, another drop is added and incubated for 10 s before drying the grid again with blotting paper. Finally, let the grids air dry for a few minutes before placing them in a grid storage box.
- The general procedure of operating a transmission electron microscope can be obtained from the operating manual. The size and morphology of the purple membrane patches (see Figure 5) can be assessed at low magnification (e.g., 5–10,000×). The structural integrity and organization of the BR crystals can be assessed by imaging the patches at higher magnification (e.g., 68,000×) and observing the power spectrum via the Fourier transformation of corresponding images (see Figure 5 insets).

4. Expected Results
5. Setup
5.1. Reagent Setup
5.2. Equipment Setup
Supplementary Materials
Author Contributions
Funding
Acknowledgments
Conflicts of Interest
References
- Oesterhelt, D.; Stoeckenius, W. Rhodopsin-like protein from the purple membrane of Halobacterium halobium. Nat. New Biol. 1971, 233, 149–152. [Google Scholar] [CrossRef] [PubMed]
- Zscherp, C.; Schlesinger, R.; Tittor, J.; Oesterhelt, D.; Heberle, J. In situ determination of transient pKa changes of internal amino acids of bacteriorhodopsin by using time-resolved attenuated total reflection Fourier-transform infrared spectroscopy. Proc. Natl. Acad. Sci. USA 1999, 96, 5498–5503. [Google Scholar] [CrossRef] [Green Version]
- Sass, H.J.; Büldt, G.; Gessenich, R.; Hehn, D.; Neff, D.; Schlesinger, R.; Berendzen, J.; Ormos, P. Structural alterations for proton translocation in the M state of wild-type bacteriorhodopsin. Nature 2000, 406, 649–653. [Google Scholar] [CrossRef]
- Lanyi, J.K. Bacteriorhodopsin. Annu. Rev. Physiol. 2004, 66, 665–688. [Google Scholar] [CrossRef] [PubMed]
- Lorenz-Fonfria, V.A.; Saita, M.; Lazarova, T.; Schlesinger, R.; Heberle, J. pH-sensitive vibrational probe reveals a cytoplasmic protonated cluster in bacteriorhodopsin. Proc. Natl. Acad. Sci. USA 2017, 114, E10909–E10918. [Google Scholar] [CrossRef] [PubMed] [Green Version]
- Oesterhelt, D.; Hess, B. Reversible photolysis of the purple complex in the purple membrane of Halobacterium halobium. Eur. J. Biochem. 1973, 37, 316–326. [Google Scholar] [CrossRef]
- Lewis, A.; Spoonhower, J.; Bogomolni, R.A.; Lozier, R.H.; Stoeckenius, W. Tunable laser resonance Raman spectroscopy of bacteriorhodopsin. Proc. Natl. Acad. Sci. USA 1974, 71, 4462–4466. [Google Scholar] [CrossRef] [Green Version]
- Lozier, R.; Bogomolni, R.; Stoeckenius, W. Bacteriorhodopsin: A light-driven proton pump in Halobacterium halobium. Biophys. J. 1975, 15, 955–962. [Google Scholar] [CrossRef] [Green Version]
- Birge, R.R. Nature of the primary photochemical events in rhodopsin and bacteriorhodopsin. Biochim. Biophys. Acta (BBA) Bioenergy 1990, 1016, 293–327. [Google Scholar] [CrossRef]
- Danon, A.; Stoeckenius, W. Photophosphorylation in Halobacterium halobium. Proc. Natl. Acad. Sci. USA 1974, 71, 1234–1238. [Google Scholar] [CrossRef] [Green Version]
- Racker, E.; Stoeckenius, W. Reconstitution of purple membrane vesicles catalyzing light-driven proton uptake and adenosine triphosphate formation. J. Biol. Chem. 1974, 249, 662–663. [Google Scholar] [CrossRef] [PubMed]
- Stoeckenius, W.; Lozier, R.H. Light energy conversion in Halobacterium halobium. J. Supramol. Struct. 1974, 2, 769–774. [Google Scholar] [CrossRef] [PubMed]
- Henderson, R.; Unwin, P.N.T. Three-dimensional model of purple membrane obtained by electron microscopy. Nature 1975, 257, 28–32. [Google Scholar] [CrossRef] [PubMed]
- Müller, D.J.; Schabert, F.; Büldt, G.; Engel, A. Imaging purple membranes in aqueous solutions at sub-nanometer resolution by atomic force microscopy. Biophys. J. 1995, 68, 1681–1686. [Google Scholar] [CrossRef] [Green Version]
- Pebay-Peyroula, E.; Rummel, G.; Rosenbusch, J.P.; Landau, E.M. X-ray structure of bacteriorhodopsin at 2.5 Angstroms from microcrystals grown in lipidic cubic phases. Science 1997, 277, 1676–1681. [Google Scholar] [CrossRef] [Green Version]
- Kimura, Y.; Vassylyev, D.G.; Miyazawa, A.; Kidera, A.; Matsushima, M.; Mitsuoka, K.; Murata, K.; Hirai, T.; Fujiyoshi, Y. Surface of bacteriorhodopsin revealed by high-resolution electron crystallography. Nature 1997, 389, 206–211. [Google Scholar] [CrossRef]
- Nango, E.; Royant, A.; Kubo, M.; Nakane, T.; Wickstrand, C.; Kimura, T.; Tanaka, T.; Tono, K.; Song, C.; Tanaka, R.; et al. A three-dimensional movie of structural changes in bacteriorhodopsin. Science 2016, 354, 1552–1557. [Google Scholar] [CrossRef]
- Nogly, P.; Weinert, T.; James, D.; Carbajo, S.; Ozerov, D.; Furrer, A.; Gashi, D.; Borin, V.; Skopintsev, P.; Jaeger, K.; et al. Retinal isomerization in bacteriorhodopsin captured by a femtosecond x-ray laser. Science 2018, 361, eaat0094. [Google Scholar] [CrossRef] [Green Version]
- Weinert, T.; Skopintsev, P.; James, D.; Dworkowski, F.; Panepucci, E.; Kekilli, D.; Furrer, A.; Brünle, S.; Mous, S.; Ozerov, D.; et al. Proton uptake mechanism in bacteriorhodopsin captured by serial synchrotron crystallography. Science 2019, 365, 61–65. [Google Scholar] [CrossRef]
- Kovacs, G.N.; Colletier, J.-P.; Grünbein, M.L.; Yang, Y.; Stensitzki, T.; Batyuk, A.; Carbajo, S.; Doak, R.B.; Ehrenberg, D.; Foucar, L.; et al. Three-dimensional view of ultrafast dynamics in photoexcited bacteriorhodopsin. Nat. Commun. 2019, 10, 3177. [Google Scholar] [CrossRef] [Green Version]
- Sass, J.; Cordier, F.; Hoffmann, A.; Rogowski, M.; Cousin, A.; Omichinski, J.G.; Löwen, H.; Grzesiek, S. Purple membrane induced alignment of biological macromolecules in the magnetic field. J. Am. Chem. Soc. 1999, 121, 2047–2055. [Google Scholar] [CrossRef]
- Blaurock, A.E.; Stoeckenius, W. Structure of the purple membrane. Nat. New Biol. 1971, 233, 152–155. [Google Scholar] [CrossRef] [PubMed]
- Krebs, M.; A Isenbarger, T. Structural determinants of purple membrane assembly. Biochim. Biophys. Acta (BBA) Bioenergy 2000, 1460, 15–26. [Google Scholar] [CrossRef] [Green Version]
- Wagner, N.L.; Greco, J.A.; Ranaghan, M.J.; Birge, R.R. Directed evolution of bacteriorhodopsin for applications in bioelectronics. J. R. Soc. Interface 2013, 10, 20130197. [Google Scholar] [CrossRef] [PubMed] [Green Version]
- Birge, R.R.; Gillespie, N.B.; Izaguirre, E.W.; Kusnetzow, A.; Lawrence, A.F.; Singh, D.; Song, Q.W.; Schmidt, E.; Stuart, J.A.; Seetharaman, S.; et al. Biomolecular electronics: Protein-based associative processors and volumetric memories. J. Phys. Chem. B 1999, 103, 10746–10766. [Google Scholar] [CrossRef]
- Chen, Z.; Govender, D.; Gross, R.; Birge, R. Advances in protein-based three-dimensional optical memories. Biosystems 1995, 35, 145–151. [Google Scholar] [CrossRef]
- A Stuart, J.; Marcy, D.L.; Wise, K.J.; Birge, R.R. Volumetric optical memory based on bacteriorhodopsin. Synth. Met. 2002, 127, 3–15. [Google Scholar] [CrossRef]
- Hampp, N.A. Bacteriorhodopsin: Mutating a biomaterial into an optoelectronic material. Appl. Microbiol. Biotechnol. 2000, 53, 633–639. [Google Scholar] [CrossRef]
- Ormos, P.; Fábián, L.; Oroszi, L.; Wolff, E.K.; Ramsden, J.J.; Dér, A. Protein-based integrated optical switching and modulation. Appl. Phys. Lett. 2002, 80, 4060–4062. [Google Scholar] [CrossRef] [Green Version]
- Mathesz, A.; Fábián, L.; Valkai, S.; Alexandre, D.; Marques, P.V.; Ormos, P.; Wolff, E.K.; Dér, A. High-speed integrated optical logic based on the protein bacteriorhodopsin. Biosens. Bioelectron. 2013, 46, 48–52. [Google Scholar] [CrossRef] [Green Version]
- Walczak, K.A.; Bergstrom, P.; Friedrich, C. Light sensor platform based on the integration of bacteriorhodopsin with a single electron transistor. Act. Passiv. Electron. Components 2011, 2011, 1–7. [Google Scholar] [CrossRef] [Green Version]
- Bhattacharya, P.; Xu, J.; Váró, G.; Marcy, D.L.; Birge, R.R. Monolithically integrated bacteriorhodopsin-GaAs field-effect transistor photoreceiver. Opt. Lett. 2002, 27, 839–841. [Google Scholar] [CrossRef] [PubMed]
- Sharkany, J.P.; Korposh, S.O.; Batori-Tarci, Z.I.; Trikur, I.I.; Ramsden, J.J. Bacteriorhodopsin-based biochromic films for chemical sensors. Sens. Actuators B Chem. 2005, 107, 77–81. [Google Scholar] [CrossRef]
- Korposh, S.O.; Sharkan, Y.P.; Ramsden, J.J. Response of bacteriorhodopsin thin films to ammonia. Sens. Actuators B Chem. 2008, 129, 473–480. [Google Scholar] [CrossRef]
- Roy, S.; Prasad, M.; Topolancik, J.; Vollmer, F. All-optical switching with bacteriorhodopsin protein coated microcavities and its application to low power computing circuits. J. Appl. Phys. 2010, 107, 53115. [Google Scholar] [CrossRef] [Green Version]
- Greco, J.A.; Fernandes, L.A.L.; Wagner, N.L.; Azadmehr, M.; Häfliger, P.; Johannessen, E.A.; Birge, R.R. Pixel characterization of a protein-based retinal implant using a microfabricated sensor array pixel characterization of a protein-based retinal implant. Int. J. High Speed Electron. Syst. 2017, 26. [Google Scholar] [CrossRef]
- Shibata, M.; Uchihashi, T.; Yamashita, H.; Kandori, H.; Ando, T. Structural changes in bacteriorhodopsin in response to alternate illumination observed by high-speed atomic force microscopy. Angew. Chem. Int. Ed. 2011, 50, 4410–4413. [Google Scholar] [CrossRef] [Green Version]
- Pfreundschuh, M.; Harder, D.; Ucurum, Z.; Fotiadis, D.; Müller, D.J. Detecting ligand-binding events and free energy landscape while imaging membrane receptors at subnanometer resolution. Nano Lett. 2017, 17, 3261–3269. [Google Scholar] [CrossRef]
- Laskowski, P.R.; Pfreundschuh, M.; Stauffer, M.; Ucurum, Z.; Fotiadis, D.; Müller, D.J. High-resolution imaging and multiparametric characterization of native membranes by combining confocal microscopy and an atomic force microscopy-based toolbox. ACS Nano 2017, 11, 8292–8301. [Google Scholar] [CrossRef]
- Nomura, S.; Harada, Y. Functional expression of green fluorescent protein derivatives in Halobacterium salinarum. FEMS Microbiol. Lett. 1998, 167, 287–293. [Google Scholar] [CrossRef]
- Subramaniam, S.; Marti, T.; Khorana, H.G. Protonation state of Asp (Glu)-85 regulates the purple-to-blue transition in bacteriorhodopsin mutants Arg-82----Ala and Asp-85----Glu: The blue form is inactive in proton translocation. Proc. Natl. Acad. Sci. USA 1990, 87, 1013–1017. [Google Scholar] [CrossRef] [PubMed] [Green Version]
- Patil, A.V.; Premaruban, T.; Berthoumieu, O.; Watts, A.; Davis, J.J. Enhanced photocurrent in engineered bacteriorhodopsin monolayer. J. Phys. Chem. B 2011, 116, 683–689. [Google Scholar] [CrossRef] [PubMed]
- Cline, S.W.; Doolittle, W.F. Efficient transfection of the archaebacterium Halobacterium halobium. J. Bacteriol. 1987, 169, 1341–1344. [Google Scholar] [CrossRef] [PubMed] [Green Version]
- Cline, S.W.; Lam, W.L.; Charlebois, R.L.; Schalkwyk, L.C.; Doolittle, W.F. Transformation methods for halophilic archaebacteria. Can. J. Microbiol. 1989, 35, 148–152. [Google Scholar] [CrossRef]
- Lam, W.L.; Doolittle, W.F. Shuttle vectors for the archaebacterium Halobacterium volcanii. Proc. Natl. Acad. Sci. USA 1989, 86, 5478–5482. [Google Scholar] [CrossRef] [Green Version]
- Ni, B.; Chang, M.; Duschl, A.; Lanyi, J.; Needleman, R. An efficient system for the synthesis of bacteriorhodopsin in Halobacterium halobium. Gene 1990, 90, 169–172. [Google Scholar] [CrossRef]
- Ferrando, E.; Schweiger, U.; Oesterhelt, D. Homologous bacterio-opsin-encoding gene expression via site-specific vector integration. Gene 1993, 125, 41–47. [Google Scholar] [CrossRef]
- Holmes, M.L.; Dyall-Smith, M.L. A plasmid vector with a selectable marker for halophilic archaebacteria. J. Bacteriol. 1990, 172, 756–761. [Google Scholar] [CrossRef] [Green Version]
- Holmes, M.L.; Dyall-Smith, M.L. Mutations in DNA gyrase result in novobiocin resistance in halophilic archaebacteria. J. Bacteriol. 1991, 173, 642–648. [Google Scholar] [CrossRef] [Green Version]
- Krebs, M.P.; Hauss, T.; Heyn, M.P.; Rajbhandary, U.L.; Khorana, H.G. Expression of the bacterioopsin gene in Halobacterium halobium using a multicopy plasmid. Proc. Natl. Acad. Sci. USA 1991, 88, 859–863. [Google Scholar] [CrossRef] [Green Version]
- Krebs, M.P.; Mollaaghababa, R.; Khorana, H.G. Gene replacement in Halobacterium halobium and expression of bacteriorhodopsin mutants. Proc. Natl. Acad. Sci. USA 1993, 90, 1987–1991. [Google Scholar] [CrossRef] [PubMed] [Green Version]
- Holmes, M.; Pfeifer, F.; Dyall-Smith, M. Improved shuttle vectors for Haloferax volcanii including a dual-resistance plasmid. Gene 1994, 146, 117–121. [Google Scholar] [CrossRef]
- Wagner, G.; Oesterhelt, D.; Krippahl, G.; Lanyi, J.K. Bioenergetic role of halorhodopsin in Halobacterium halobium cells. FEBS Lett. 1981, 131, 341–345. [Google Scholar] [CrossRef] [Green Version]
- DasSarma, S.; Rajbhandary, U.L.; Khorana, H.G. High-frequency spontaneous mutation in the bacterio-opsin gene in Halobacterium halobium is mediated by transposable elements. Proc. Natl. Acad. Sci. USA 1983, 80, 2201–2205. [Google Scholar] [CrossRef] [PubMed] [Green Version]
- Karnik, S.S.; Nassal, M.; Doi, T.; Jay, E.; Sgaramella, V.; Khorana, H.G. Structure-function studies on bacteriorhodopsin. II. Improved expression of the bacterio-opsin gene in Escherichia coli. J. Biol. Chem. 1987, 262, 9255–9263. [Google Scholar] [PubMed]
- Nassal, M.; Mogi, T.; Karnik, S.S.; Khorana, H.G. Structure-function studies on bacteriorhodopsin. III. Total synthesis of a gene for bacterio-opsin and its expression in Escherichia coli. J. Biol. Chem. 1987, 262, 9264–9270. [Google Scholar] [PubMed]
- Mogi, T.; Stern, L.J.; Hackett, N.R.; Khorana, H.G. Bacteriorhodopsin mutants containing single tyrosine to phenylalanine substitutions are all active in proton translocation. Proc. Natl. Acad. Sci. USA 1987, 84, 5595–5599. [Google Scholar] [CrossRef] [Green Version]
- Shand, R.F.; Miercke, L.J.W.; Mitra, A.K.; Fong, S.K.; Stroud, R.M.; Betlach, M.C. Wild-type and mutant bacterioopsins D85N, D96N, and R82Q: High-level expression in Escherichia coli. Biochemistry 1991, 30, 3082–3088. [Google Scholar] [CrossRef]
- Hildebrandt, V.; Ramezani-Rad, M.; Swida, U.; Wrede, P.; Grzesiek, S.; Primke, M.; Büldt, G. Genetic transfer of the pigment bacteriorhodopsin into the eukaryote Schizosaccharomyces pombe. FEBS Lett. 1989, 243, 137–140. [Google Scholar] [CrossRef] [Green Version]
- Hildebrandt, V.; Fendler, K.; Heberle, J.; Hoffmann, A.; Bamberg, E.; Büldt, G. Bacteriorhodopsin expressed in Schizosaccharomyces pombe pumps protons through the plasma membrane. Proc. Natl. Acad. Sci. USA 1993, 90, 3578–3582. [Google Scholar] [CrossRef] [Green Version]
- Stoeckenius, W.; Rowen, R. A morphological study of Halobacterium halobium and its lysis in media of low salt concentration. J. Cell Biol. 1967, 34, 365–393. [Google Scholar] [CrossRef] [PubMed] [Green Version]
- Stoeckenius, W.; Kunau, W.H. Further characterization of particulate fractions from lysed cell envelopes of Halobacterium halobium and isolation of gas vacuole membranes. J. Cell Biol. 1968, 38, 337–357. [Google Scholar] [CrossRef] [PubMed] [Green Version]
- Oesterhelt, D.; Stoeckenius, W. Isolation of the cell membrane of Halobacterium halobium and its fractionation into red and purple membrane. Methods Enzym. 1974, 31, 667–678. [Google Scholar] [CrossRef]
- Geiser, A.H.; Sievert, M.K.; Guo, L.-W.; Grant, J.E.; Krebs, M.; Fotiadis, D.; Engel, A.; Ruoho, A.E. Bacteriorhodopsin chimeras containing the third cytoplasmic loop of bovine rhodopsin activate transducin for GTP/GDP exchange. Protein Sci. 2006, 15, 1679–1690. [Google Scholar] [CrossRef] [PubMed]
- Stoeckenius, W.; Lozier, R.H.; Bogomolni, R.A. Bacteriorhodopsin and the purple membrane of halobacteria. Biochim. Biophys. Acta (BBA) Rev. Bioenergy 1979, 505, 215–278. [Google Scholar] [CrossRef]
- Gordeliy, V.I.; Schlesinger, R.; Efremov, R.; Büldt, G.; Heberle, J. Crystallization in lipidic cubic phases: A case study with bacteriorhodopsin. In Membrane Protein Protocols; Humana Press Inc.: Totowa, NJ, USA, 2003; Volume 228, pp. 305–316. [Google Scholar] [CrossRef]
- Hirschi, S.; Fischer, N.; Kalbermatter, D.; Laskowski, P.R.; Ucurum, Z.; Müller, D.J.; Fotiadis, D. Design and assembly of a chemically switchable and fluorescently traceable light-driven proton pump system for bionanotechnological applications. Sci. Rep. 2019, 9, 1–10. [Google Scholar] [CrossRef] [PubMed] [Green Version]
- Harder, D.; Hirschi, S.; Ucurum, Z.; Goers, R.; Meier, W.P.; Müller, D.J.; Fotiadis, D. Engineering a chemical switch into the light-driven proton pump proteorhodopsin by cysteine mutagenesis and thiol modification. Angew. Chem. Int. Ed. 2016, 55, 8846–8849. [Google Scholar] [CrossRef]
- Pfeiffer, M. Studies on dynamics and function of bacteriorhodopsin from Halobacterium salinarum; Herbert Utz Verlag: Munich, Germany, 2000. [Google Scholar]
- Otto, H.; Marti, T.; Holz, M.; Mogi, T.; Lindau, M.; Khorana, H.G.; Heyn, M.P. Aspartic acid-96 is the internal proton donor in the reprotonation of the Schiff base of bacteriorhodopsin. Proc. Natl. Acad. Sci. USA 1989, 86, 9228–9232. [Google Scholar] [CrossRef] [Green Version]


| Component | Amount (µL) | Final Concentration |
|---|---|---|
| pUC18-bop plasmid template | 1 | 2 ng/µL |
| (100 ng/µL) | ||
| 5′-pUC-BamHI-BR forward primer | 1 | 2 pM |
| (100 pM) | ||
| 3′-BR-C-His10-HindIII reverse primer | 1 | 2 pM |
| (100 pM) | ||
| dNTP’s (10 mM for each dNTP) | 1 | 200 µM |
| Phusion CG buffer (5X) | 10 | 1X |
| DMSO (100%) | 1.5 | 3% |
| Phusion DNA Polymerase (2 U/µL) | 0.5 | 0.02 U/µL |
| Nuclease-free water | 34 | |
| Total | 50 |
| Cycles | Denaturation (94 °C) | Annealing (63 °C) | Elongation (72 °C) |
|---|---|---|---|
| 1 | 2 min | ||
| 32 | 45 s | 45 s | 1 min |
| 1 | 10 min |
| Component | Amount (µL) | Final Concentration |
|---|---|---|
| Purified PCR product (350 ng/µL) | 20 | 140 ng/µL |
| CutSmart buffer (10X) | 5 | 1X |
| HindIII-HF (20 U/µL) | 1 | 0.4 U/µL |
| BamHI-HF (20 U/µL) | 1 | 0.4 U/µL |
| Nuclease-free water | 23 | |
| Total | 50 |
| Component | Amount (µL) | Final Concentration |
|---|---|---|
| pHS blue plasmid (2 µg/µL) | 7 | 280 ng/µL |
| CutSmart buffer (10X) | 5 | 1X |
| HindIII-HF (20 U/µL) | 3 | 1.2 U/µL |
| BamHI-HF (20 U/µL) | 3 | 1.2 U/µL |
| Nuclease-free water | 32 | |
| Total | 50 |
| Component | Amount (µL) | Final Concentration |
|---|---|---|
| Digested pHS blue plasmid (130 ng/µL) | 1 | 6.5 ng/µL |
| Digested insert (32 ng/µL) | 14 | 22.5 ng/µL |
| Rapid ligation buffer (5X) | 4 | 1X |
| T4 DNA ligase (5 U/µL) | 1 | 0.25 U/µL |
| Total | 20 |
| Component | Amount (µL) | Final Concentration |
|---|---|---|
| Isolated pHS blue-bop-C-His10 (125 ng/µL) | 8 | 100 ng/µL |
| CutSmart buffer (10X) | 1 | 1X |
| HindIII-HF (20 U/µL) | 0.5 | 1 U/µL |
| BamHI-HF (20 U/µL) | 0.5 | 1 U/µL |
| Total | 10 |
© 2020 by the authors. Licensee MDPI, Basel, Switzerland. This article is an open access article distributed under the terms and conditions of the Creative Commons Attribution (CC BY) license (http://creativecommons.org/licenses/by/4.0/).
Share and Cite
Stauffer, M.; Hirschi, S.; Ucurum, Z.; Harder, D.; Schlesinger, R.; Fotiadis, D. Engineering and Production of the Light-Driven Proton Pump Bacteriorhodopsin in 2D Crystals for Basic Research and Applied Technologies. Methods Protoc. 2020, 3, 51. https://doi.org/10.3390/mps3030051
Stauffer M, Hirschi S, Ucurum Z, Harder D, Schlesinger R, Fotiadis D. Engineering and Production of the Light-Driven Proton Pump Bacteriorhodopsin in 2D Crystals for Basic Research and Applied Technologies. Methods and Protocols. 2020; 3(3):51. https://doi.org/10.3390/mps3030051
Chicago/Turabian StyleStauffer, Mirko, Stephan Hirschi, Zöhre Ucurum, Daniel Harder, Ramona Schlesinger, and Dimitrios Fotiadis. 2020. "Engineering and Production of the Light-Driven Proton Pump Bacteriorhodopsin in 2D Crystals for Basic Research and Applied Technologies" Methods and Protocols 3, no. 3: 51. https://doi.org/10.3390/mps3030051