Review of the Post-IR IRSL Dating Protocols of K-Feldspar

Department of Earth Sciences, The University of Hong Kong, Hong Kong 999077, China
*
Author to whom correspondence should be addressed.
Methods Protoc. 2020, 3(1), 7; https://doi.org/10.3390/mps3010007
Submission received: 17 October 2019
/
Revised: 8 January 2020
/
Accepted: 10 January 2020
/
Published: 14 January 2020
(This article belongs to the Special Issue Methods in Dating and Other Applications using Luminescence)
Abstract
:Compared to quartz, the infrared stimulated luminescence (IRSL) of K-feldspar saturates at higher dose, which has great potential for extending the dating limit. However, dating applications with K-feldspar has been hampered due to anomalous fading of the IRSL signal. The post-IR IRSL (pIRIR) signal of K-feldspar stimulated at a higher temperature after a prior low-temperature IR stimulation has significantly lower fading rate. Different dating protocols have been proposed with the pIRIR signals and successful dating applications have been made. In this study, we review the development of various pIRIR dating protocols, and compare their performance in estimating the equivalent dose (De). Standard growth curves (SGCs) of the pIRIR signals of K-feldspar are introduced. Single-grain K-feldspar pIRIR dating is presented and the existing problems are discussed.
1. Introduction
Optically stimulated luminescence (OSL) dating is applied to date the last exposure event of a mineral grain to sunlight [1]. The OSL ages are obtained by the equation: Age = De/Dr, where De is the equivalent dose, representing the radiation dose that mineral grains have received after being blocked from sunlight, and the Dr is the environmental dose rate mainly dominated by the radioactive elements U, Th, K. Quartz has long been used as the ideal mineral for OSL dating, because of its abundance in nature, its signal stability, and its susceptibility to bleaching, especially after the single-aliquot regenerative-dose (SAR) protocol was established [2,3,4]. However, the OSL signal of quartz saturates with relatively low radiation dose, which has limited its application in dating older samples. Studies have shown that the quartz OSL ages were underestimated when the samples were older than ~100 ka [5,6,7], a situation usually attributed to the early saturation behavior of quartz OSL signal [8]. In some case, such as in the aeolian deposits from the Chinese Loess Plateau, age underestimation began at ~70 ka [9,10], which may be related to abnormally short lifetime of the OSL signal [11,12].
Compared to quartz, the infrared stimulated luminescence (IRSL) of K-feldspar has several advantages: the IRSL signal of K-feldspar saturates at higher dose, which has the potential to date older samples; the IRSL signal intensity of K-feldspar is much greater than quartz OSL signal, providing higher data precision; and the K element within K-feldspar grains provides an internal component for the dose rate, which is not affected by variations of the external environment [13,14,15]. However, the application of K-feldspar IRSL dating has long been hampered by a phenomenon called anomalous fading [16,17,18]. The thermally stable luminescence signal of K-feldspar fades under ambient temperature, which is suggested to be a result of quantum tunneling between the electron traps and holes [16,17,18,19]. Fading correction method has been proposed to address this problem [14,20,21]. With this solution, the fading rate of IRSL signal for each individual sample needs to be measured, which requires a large amount of laboratory work. In addition, fading correction for older samples would become more complicated because of the dose-dependent behavior of fading rate [21,22,23,24], and age overestimation after fading correction has been widely reported [25,26,27,28,29]. An isochron dating method has also been proposed [30,31]. In this method, it is assumed that the IRSL signal induced by internal dose does not fade, and De values of K-feldspar fractions with different grain sizes need to be measured, which is also laborious.
It would be highly advantageous if a non-fading signal of K-feldspar could be identified. Studies that aimed to isolate the non-fading IRSL signals have driven the development of post-IR IRSL (pIRIR) dating protocols, and a detailed review has been published in 2014 [32]. Here, we briefly introduce the pIRIR developments before 2014, and focus on the improvements since 2014.
2. Development of pIRIR Dating Protocols
2.1. Two-Step IR Stimulation
Thomsen et al. [33] found that the IRSL signal stimulated at 225 °C after a preceding IR stimulation at 50 °C (post-IR IRSL) faded much more slowly. The 50 °C IR stimulation (IR50) is supposed to remove the close trap-hole pairs which are prone to tunneling; while the left distant trap-hole pairs stimulated at the subsequent high temperature experience less fading [33,34,35,36]. Following the observation of Thomsen et al. [33], Buylaert et al. [37] tested the two-step post-IR IRSL (pIRIR50, 225) dating protocol (Table 1) on K-feldspar extracts from various depositional environments. The fading rate (g2days value) of the pIRIR50, 225 signal (mean value, 1.62 ± 0.06%/decade) was significantly lower than the fading rate of the IR50 signal (mean value, 3.23 ± 0.13%/decade) [37]. After fading correction, the pIRIR50, 225 and IR50 signals had similar ages; however, the smaller fading rate made the pIRIR50, 225 ages less dependent on the assumptions behind the fading correction model [37].
In order to isolate a more stable pIRIR signal, Thiel et al. [38] increased the temperature of the second-step stimulation from 225 °C to 290 °C (Table 1). The measured fading rate of the pIRIR50, 290 signal of loess samples from Austria was 1.0–1.5%/decade, compared to 2.1–3.6%/decade of the IR50 signal [38]. However, based on observations that the natural pIRIR50, 290 signal of a sample from below the Brunhes/Matuyama geomagnetic reversal boundary was saturated and that a quartz sample also showed a measured fading rate of 1.3 ± 0.3%/decade, Thiel et al. [38] suggested that the fading rate of the pIRIR50, 290 signal was a laboratory artifact, and fading uncorrected pIRIR50, 290 ages were the most appropriate. Buylaert et al. [39] systematically tested the pIRIR50, 290 protocol and concluded that it was a robust dating method for Middle and Late Pleistocene sediments without fading correction.
The pIRIR signals stimulated at higher temperatures (e.g., pIRIR50, 225, pIRIR50, 290, pIRIR200, 290) are more stable than the IR50 signal; however, they are also more difficult to bleach [33,37,38]. Thus, the residual doses of the high-temperature pIRIR signals are a concern in dating. Buylaert et al. [40] reported that the residual doses of the pIRIR50, 225 and pIRIR50, 290 signals from modern aeolian samples of the Chinese Loess Plateau were in the range of 2–8 Gy and 5–19 Gy, respectively. The pIRIR50, 290 residual doses of three modern samples from an alluvial bar in Murray et al. [41] were measured to be 5–10 Gy. While quite high pIRIR50, 290 residual doses (20–55 Gy) were reported for modern glaciofluvial sediments from a glaciated bay [42]. In various solar bleaching experiments, the measured residual doses of the pIRIR signals varied within a wide range, from less than 2 Gy to >40 Gy [38,39,43,44,45], and the residual doses increased systematically with higher preheat temperature and stimulation temperature [46,47,48]. A positive relationship between the residual doses and De values has been documented in numerous studies [39,49,50,51,52,53,54]. With a fixed bleaching time, a linear function between the residual doses and De values can be determined, and a minimal residual dose can be obtained by extrapolating to De = 0 Gy. The minimal residual dose of the pIRIR50, 225/290 signal is mostly in the range of 4–7 Gy, which represents the contribution of an un-bleachable component that ubiquitously exists in fully-bleached samples [39,49,50,52,53,54]. In addition, some studies showed that with extremely long bleaching durations, the residual doses were also reduced to <10 Gy [29,51,52]. In summary, the residual doses of pIRIR290 signal for partially-bleached sediments (e.g., glaciofluvial deposits) could be high (up to ~50 Gy), but the residual doses for well-bleached sediments are, in most cases, smaller than 10 Gy. Some studies argued that bleaching under different natural conditions (e.g., sub-aqueous and sub-aerial) had different efficiency due to different spectrum, which questioned the strategy of residual dose subtraction for De measurements [51,55].
For well-bleached old samples, a De overestimation of <10 Gy would result in an age overestimation of <~3 ka (e.g., for typical loess sediments), which has small effect. However, it becomes significant for young samples (e.g., of Holocene ages). In order to reduce the effect of residual dose, Reimann et al. [27] proposed a modified two-step pIRIR protocol with the first IR stimulation at 50 °C and the second IR stimulation at 180 °C, together with a preheat temperature of 200 °C (Table 1). The residual dose of the pIRIR50, 180 signal was reduced to ~1 Gy [27]. Reimann et al. [27] showed that the pIRIR50, 180 signal was sufficiently stable to date well-bleached middle Holocene and late Pleistocene samples, as the pIRIR50, 180 ages agreed very well with quartz OSL ages and radiocarbon ages. To make it suitable to date even younger samples (e.g., of hundreds of years), the second IR stimulation was decreased to 150 °C, with a preheat treatment at 180 °C [28,56]. In several studies, the second IR stimulation temperature was changed to 170 °C with the preheat temperature at 200 °C to date Holocene aeolian deposits [57,58,59].
2.2. Multi-Step IR Stimulation
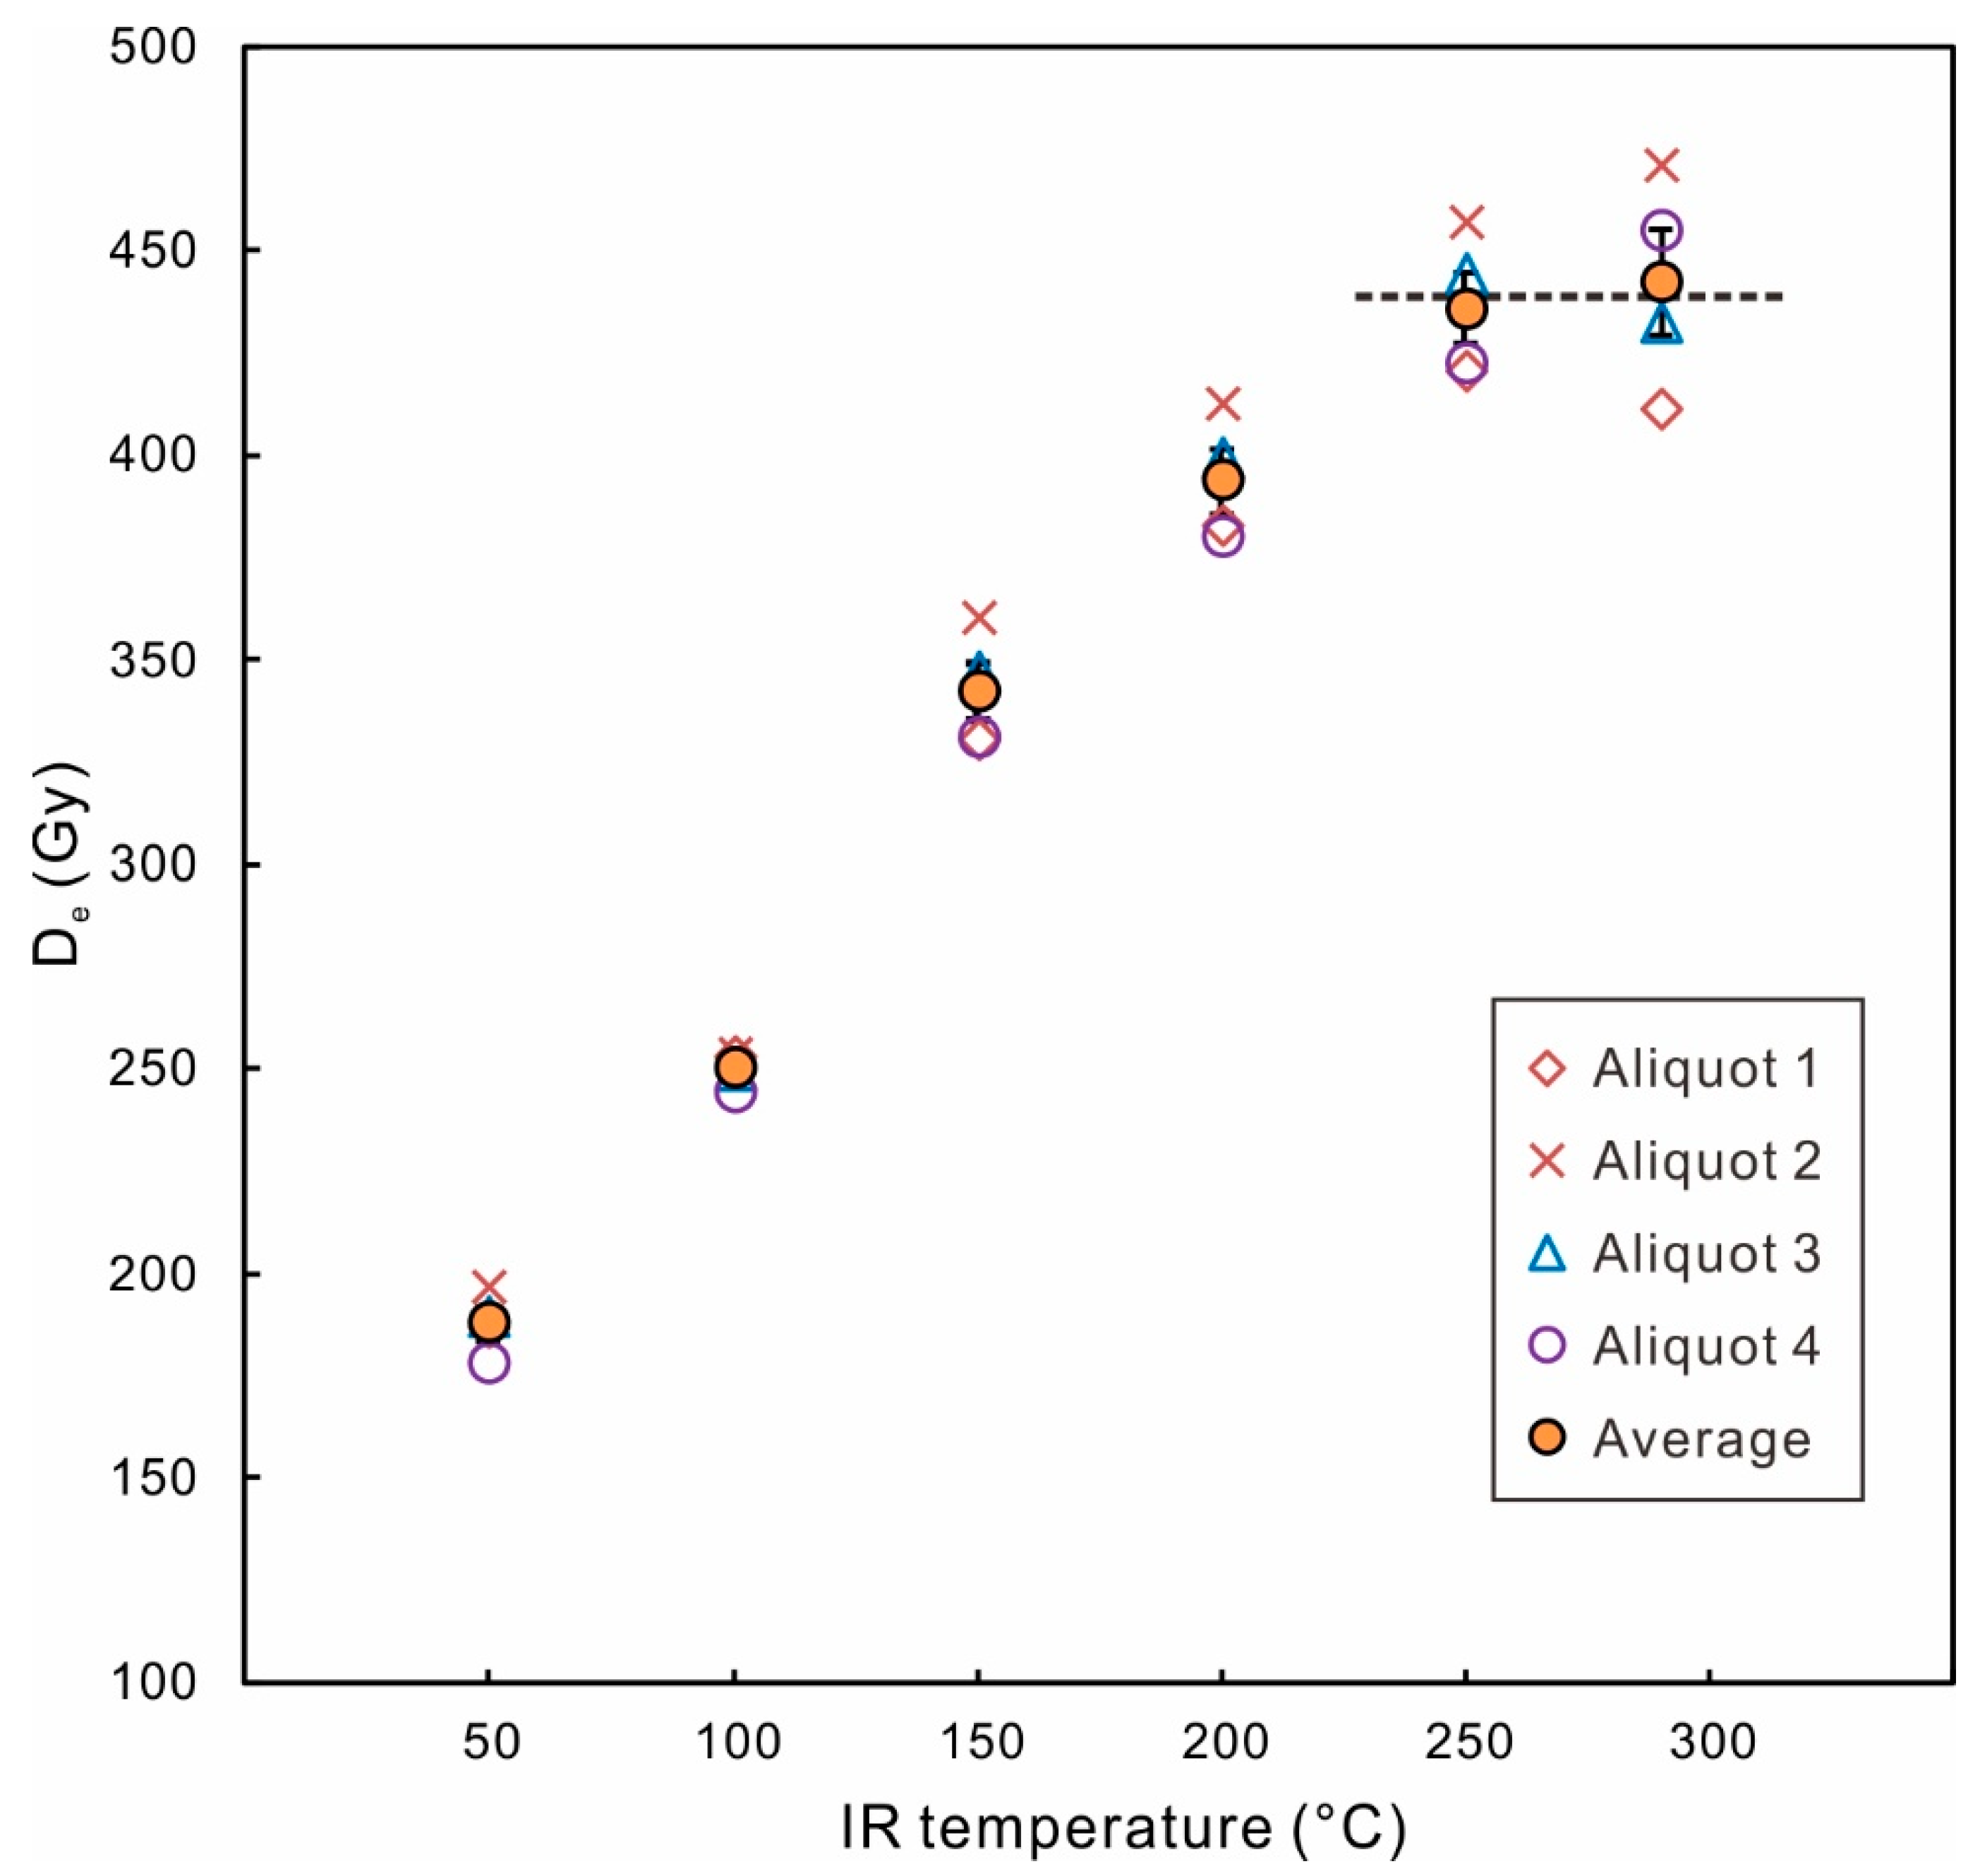
Li and Li [26] proposed a multiple-elevated-temperature (MET) pIRIR dating protocol, with five-step IR stimulations from 50 °C to 250 °C with an increment of 50 °C (Table 1). An advantage of this protocol is that there are multiple De values corresponding to IR stimulations at different temperatures. Once the De reaches a plateau in the high temperature range, it would provide firm evidence that the high-temperature pIRIR signals are sufficiently stable and experience negligible anomalous fading (Figure 1) [26]. Later, the five-step MET-pIRIR protocol was modified to a six-step MET-pIRIR protocol, with the highest IR stimulation temperature increased from 250 °C to 300 °C, and the preheat temperature increased from 300 °C to 320 °C [63]. For the studied loess and desert samples from north China, the fading rates of the IR50 signal were 3–5%/decade, while the fading rates of MET-pIRIR250 or MET-pIRIR300 signals were very close to zero [26,63].
From the solar bleaching experiments, residual doses of the MET-pIRIR250 signal were mostly in the range of 2–10 Gy, although in some cases they were up to ~20 Gy [26,64,65,66,67,68]. In order to make the MET-pIRIR protocol suitable for dating Holocene sediments, Fu and Li. [69] developed a modified low-temperature MET-pIRIR protocol. The preheat temperature was set to 200 °C and the five-step IR stimulation was performed from 50 °C to 170 °C with a step of 30 °C. The residual dose of the MET-pIRIR170 signal was generally less than 1 Gy [69]. For Holocene samples, Fu and Li. [69] observed an age plateau between the stimulation temperatures of 110–170 °C. The five-step stimulation can be simplified to a three-step stimulation at temperatures of 110, 140, 170 °C. With the three-step protocol, the age plateau still existed at the stimulation temperatures of 140 °C and 170 °C, indicating that the pIRIR signals at 140 °C and 170 °C can be considered as sufficiently stable over the timescale of Holocene period [69]. Thus, Fu and Li. [69] further simplified the three-step protocol to a two-step protocol, with IR stimulations at 110 °C and 170 °C. Although no age plateau can be observed with the two-step IR stimulation, the pIRIR110, 170 signal can still provide identical ages as the five-step pIRIR170 signal, the three-step pIRIR170 signal, and the quartz OSL signal. However, when the first IR stimulation temperature was decreased from 110 °C to 50 °C, the corresponded pIRIR50, 170 ages were slightly underestimated [69].
2.3. Modified Protocols to Extend the Dating Limit
The two-step pIRIR or MET-pIRIR protocols discussed above are all based on the conventional SAR protocol, with a subsequent test dose signal (Tx) to correct for the change in the sensitivity of the regenerative dose signal (Lx). Each aliquot is measured repeatedly with several cycles to build its individual growth curve [8]. The growth curve of the luminescence signal with the radiation dose can be fitted with a single saturating exponential function:
where I is the luminescence signal, D is the radiation dose, and D0 is called the characteristic saturation dose which quantifies the saturation behavior of the signal.
For quartz, D0 varies significantly between different grains and samples, but in most cases it is smaller than 200 Gy [73,74,75,76]. It is suggested that for reliable dating with quartz, the De should not exceed the 2D0 limit [8]. Although D0 of the K-feldspar pIRIR signal varies with different samples and experimental parameters (e.g., test dose, IR stimulation temperature), it is usually around 200–500 Gy with the conventional SAR protocol (Table 2). Applying the 2D0 limit, the dating range of the K-feldspar pIRIR signals would not exceed 1000 Gy. To extend the dating limit, modified protocols have been proposed based on the dose-dependent sensitivity of the MET-pIRIR signals from K-feldspar [61,62,77]. Li et al. [62] applied the multiple-aliquot regenerative-dose (MAR) protocol, but added a second test dose (T2) after a ‘cutheat to 600 °C’ treatment behind the first test dose (T1). The T1/T2 signal was applied to represent the dose-dependent sensitivity. For the MET-pIRIR250 signal, the D0 of the T1/T2 signal was ~740 Gy, which was significantly larger than that of the Lx/T1 signal (~340 Gy). In addition, the Lx/T2 signal also had a D0 of ~770 Gy, close to that of the T1/T2 signal. Chen et al. [77] presented that with the Lx/T2 signal, the De of a sample from the fifth paleosol layer (S5) of the Chinese loess sequence, corresponding to Marine Isotope Stage (MIS) 13–15, was estimated to be 1360 ± 200 Gy, which was broadly consistent with the expected De of 1550 ± 72 Gy. The modified MAR protocol is termed ‘MAR with heat’ in the text below (Table 1). Li et al. [61] modified the conventional SAR protocol, by adding a solar beaching treatment behind each cycle—‘SAR with solar’ (Table 1). It was found that solar bleaching was able to reset the luminescence sensitivity. Hence, the regenerative dose signal (Lx) or the test dose signal (Tx) can be used alone to estimate the De. Here, the Tx is used to represent the dose-dependent sensitivity. While the D0 of the Lx/Tx signal was ~400 Gy, the D0 of both the Lx and Tx signals was ~800 Gy [61].
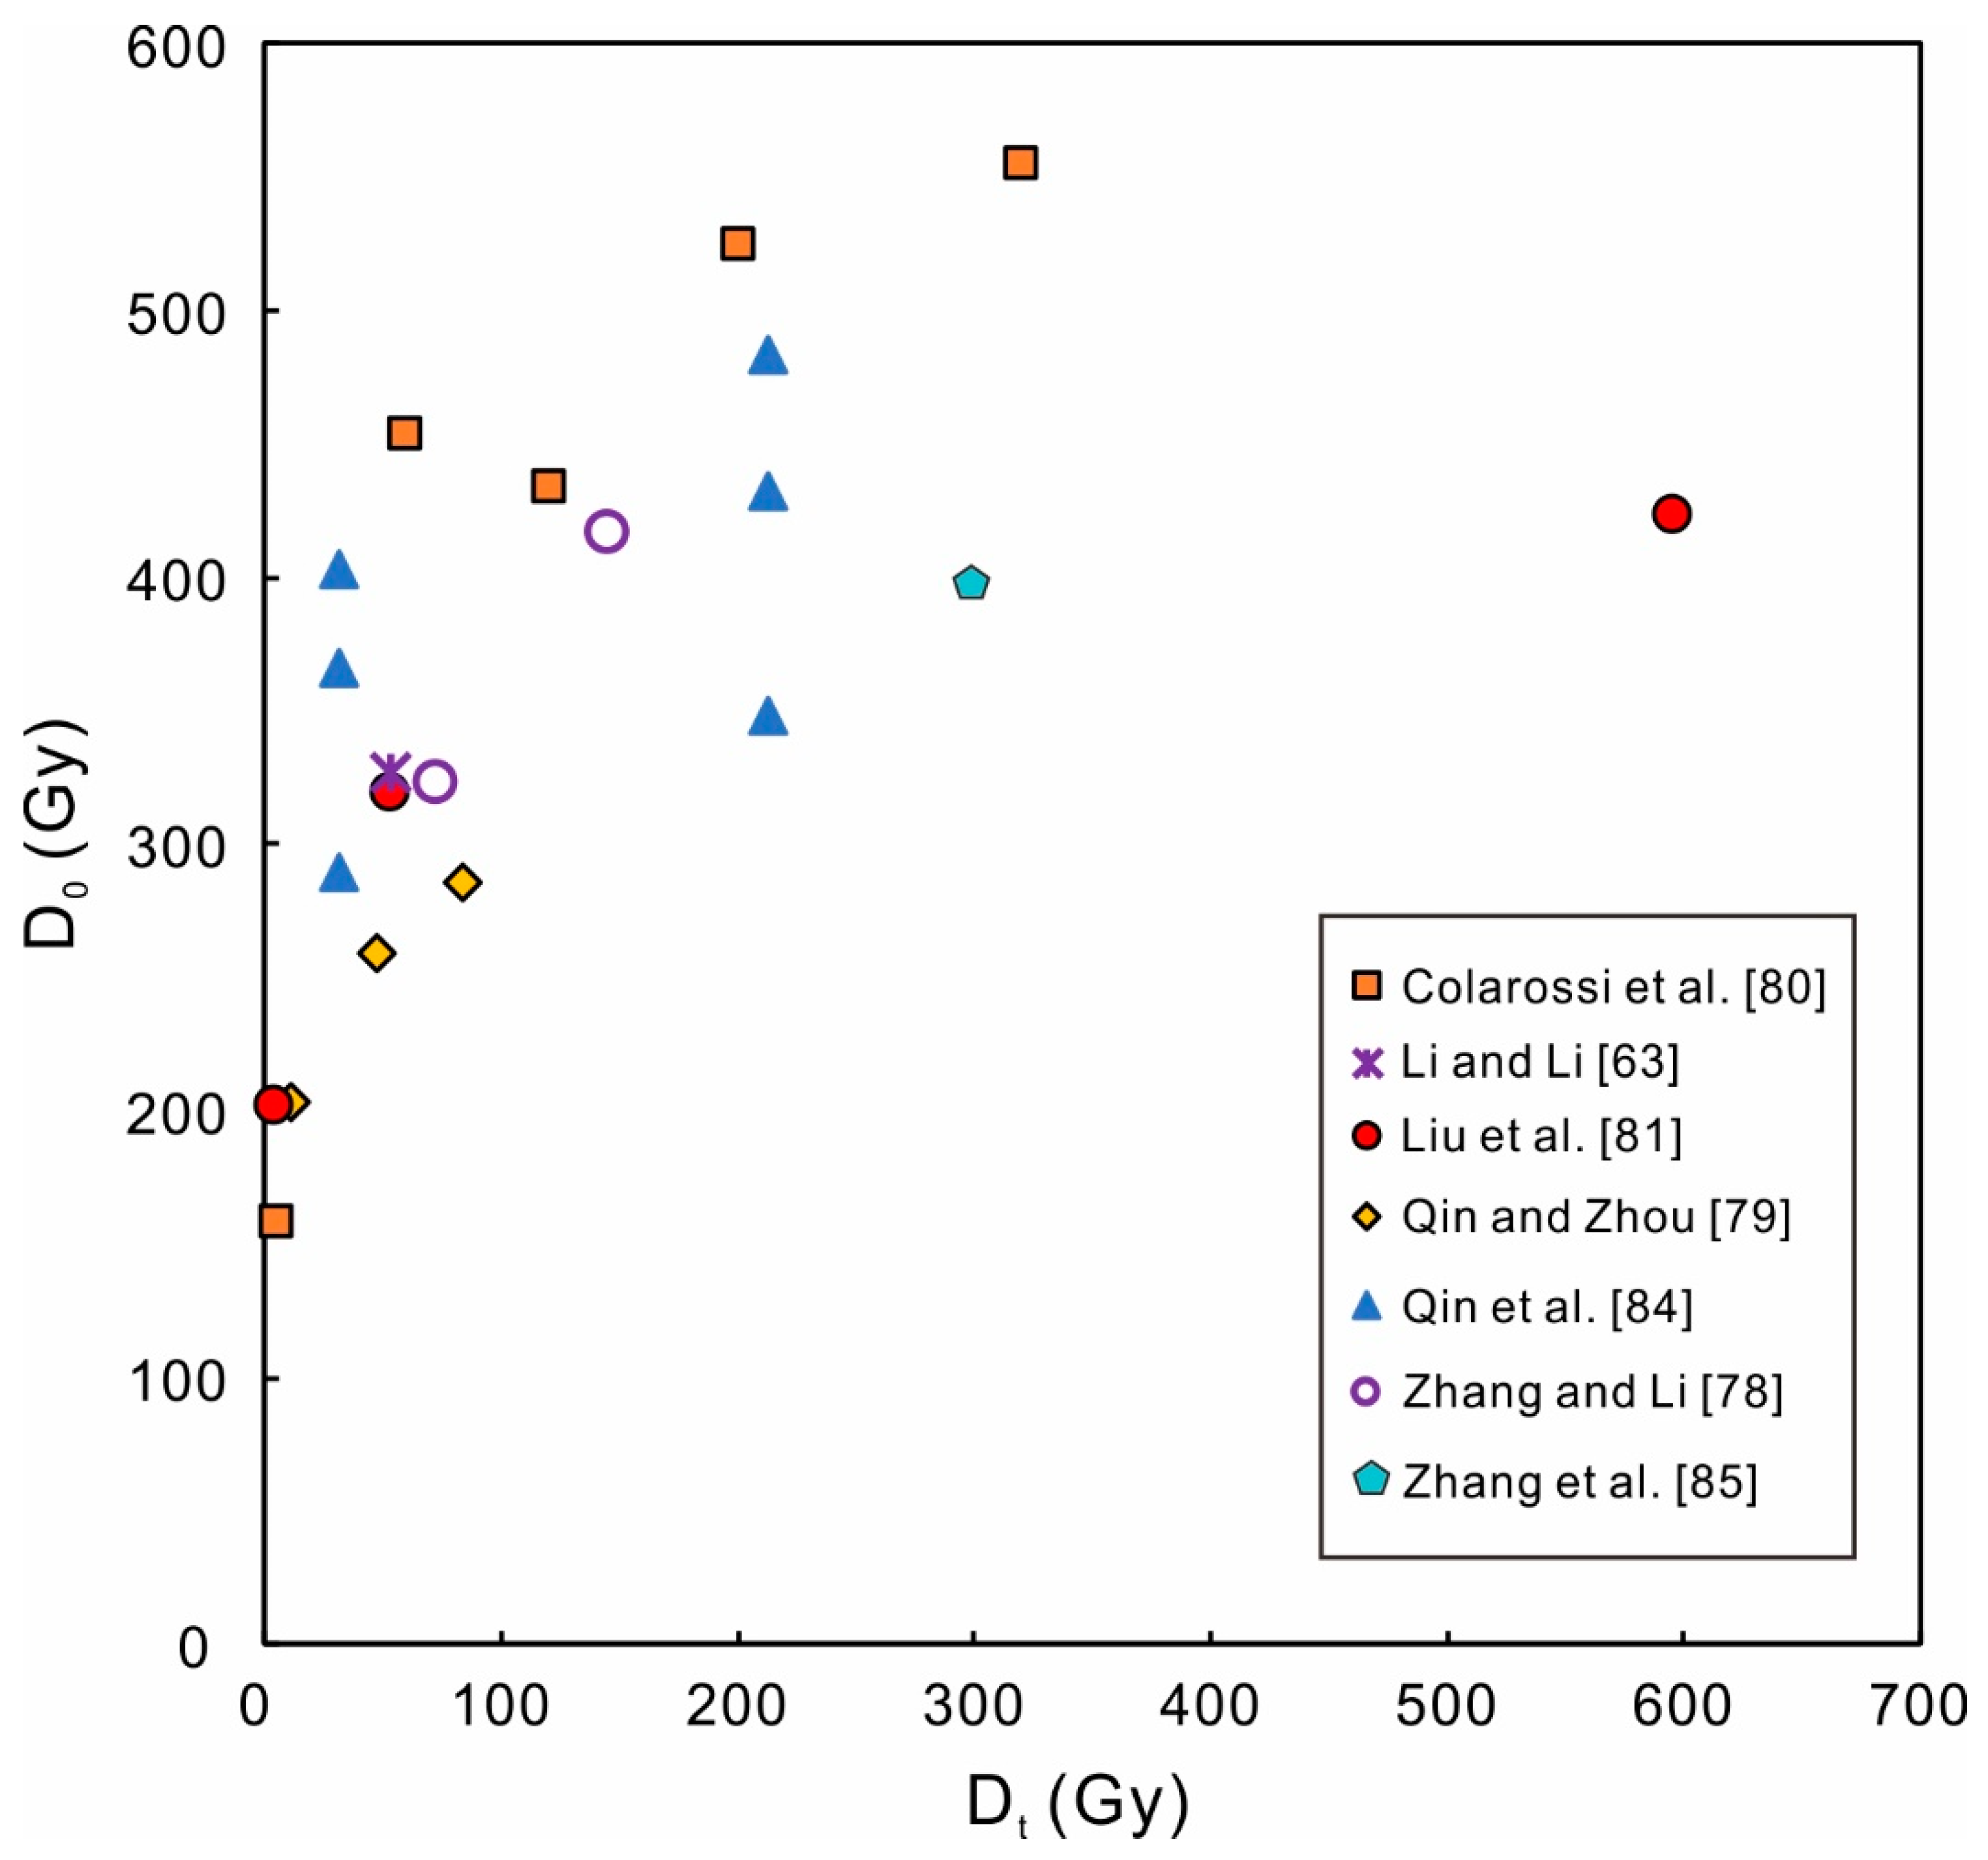
These modified MAR and SAR protocols have greatly increased the D0 of the K-feldspar pIRIR signal, and have extended the dating limit of K-feldspar to ~1500 Gy. Zhang and Li [78] proposed that a D0 of ~800 Gy was very likely to be the intrinsic property of the pIRIR signals. In the conventional SAR protocols, the signals of the test dose (Dt) would be overestimated due to the effect of the preceding regenerative dose [43,78,79,80,81,82]. Multiple hypotheses have been proposed to account for the overestimation, such as the thermally transferred signal [43,79], signal inheritance [80,81], and dose dependent sensitivity change [62,82]. The test dose signal following a larger regenerative dose would be overestimated in a higher degree, and the corresponding Lx/Tx would be underestimated more significantly; hence the fitted growth curves have apparently lower D0 values (200–500 Gy) compared to the intrinsic D0 (~800 Gy). A larger test dose would reduce such an effect, thus a positive relationship between D0 and Dt has been observed in numerous studies (Figure 2) [78,79,80,81,83,84].
3. Comparison between Different pIRIR Protocols
Several studies have been performed to investigate the pIRIR290 De dependence on the prior-IR stimulation temperature, and these studies suggested that the De values did not change significantly with the prior-IR stimulation temperature varied in the range of 50–260 °C [39,52,53,54,86]. From a comparison of the De values obtained with the pIRIR50, 290, pIRIR200, 290, MET-pIRIR250 signals, Li and Li [60] showed that the estimated De values were consistent between the three signals when De was less than ~400 Gy; however, when the expected De exceeded ~400 Gy, the pIRIR50, 290 signal had underestimated De results compared to the other two signals. Li and Li [60] suggested that the 50 °C prior-IR stimulation was too weak to completely remove the prone-to-fade signal. Qiu and Zhou. [87] compared the performance of four signals, which were pIRIR50, 290, pIRIR200, 290, three-step pIRIR200, 290 signal with first stimulation at 50 °C, second stimulation at 200 °C and last stimulation at 290 °C, IRoff-pIRIR200, 290 signal with isothermal holding (IR-off) for 200 s before the 290 °C IR stimulation, respectively. The De values of their tested samples were within the range of 400–900 Gy. Only the pIRIR50, 290 signal had underestimated the De values, whereas the other three signals provided consistent De results [87]. Buylaert et al. [39] revealed that when the prior-IR stimulation temperature was increased from 50 °C to 200 °C, the intensity of corresponded pIRIR200, 290 signal was only 7% of the pIRIR50, 290 signal. However, it was later found that the pIRIR290 signal intensity was still sufficiently high to guarantee precise measurements even when the prior-IR stimulation temperature was as high as 260 °C, and thus Buylaert et al. [88] applied the pIRIR200, 290 protocol to date the last interglacial paleosol (S1) in the Chinese Loess Plateau. Stevens et al. [89] reported that De values were underestimated when the prior-IR stimulation temperature was below 140 °C, but a De plateau had been reached when the prior-IR stimulation temperature was ≥170 °C; and the pIRIR200, 290 protocol was adopted to date the Chinese loess back to the S2 layer (second paleosol layer, corresponding to MIS 7). Ito et al. [29] carried out prior-IR stimulation temperature test on marine terrace deposits from Japan, and the results showed that the pIRIR290 De plateau existed when the prior-IR temperature was within the range of 100–200 °C; while the pIRIR290 De was underestimated with a prior-IR temperature of 50 °C and overestimated with a prior-IR temperature of 250 °C. A study performed on rock slices showed that the pIRIR290 signal from naturally saturated slices was close to the laboratory saturation level only when the first-IR stimulation temperature was high (e.g., 200 °C or 250 °C) [81]. These studies suggest that the first-IR stimulation is better to be performed at a higher temperature (e.g., 200 °C) when dating older samples with the pIRIR290 signal.
All of the foregoing comparisons in this section are based on the SAR protocol. However, the upper dating limit of these pIRIR SAR protocols has seldom been studied. A sample from the fifth loess layer (L5) of the Mangshan loess-palaeosol sequence of China was dated to be 401 ± 35 ka with the pIRIR200, 290 protocol, which was much younger than the expected age within MIS 12 [87]. Zhang et al. [85] showed that with the SAR protocols, irrespective of the pIRIR200, 290 signal or the MET-pIRIR250/300 signal, the De values were underestimated when the expected De exceeded ~800 Gy, whereas the ‘MAR with heat’ protocol could provide reliable De estimates. The SAR De underestimation began to occur at the De value of ~800 Gy, which was close to twice the D0 (~400 Gy with SAR protocol) for samples in Zhang et al. [85]. This indicates that the empirical 2D0 limit is also applicable to De measurements with K-feldspar.
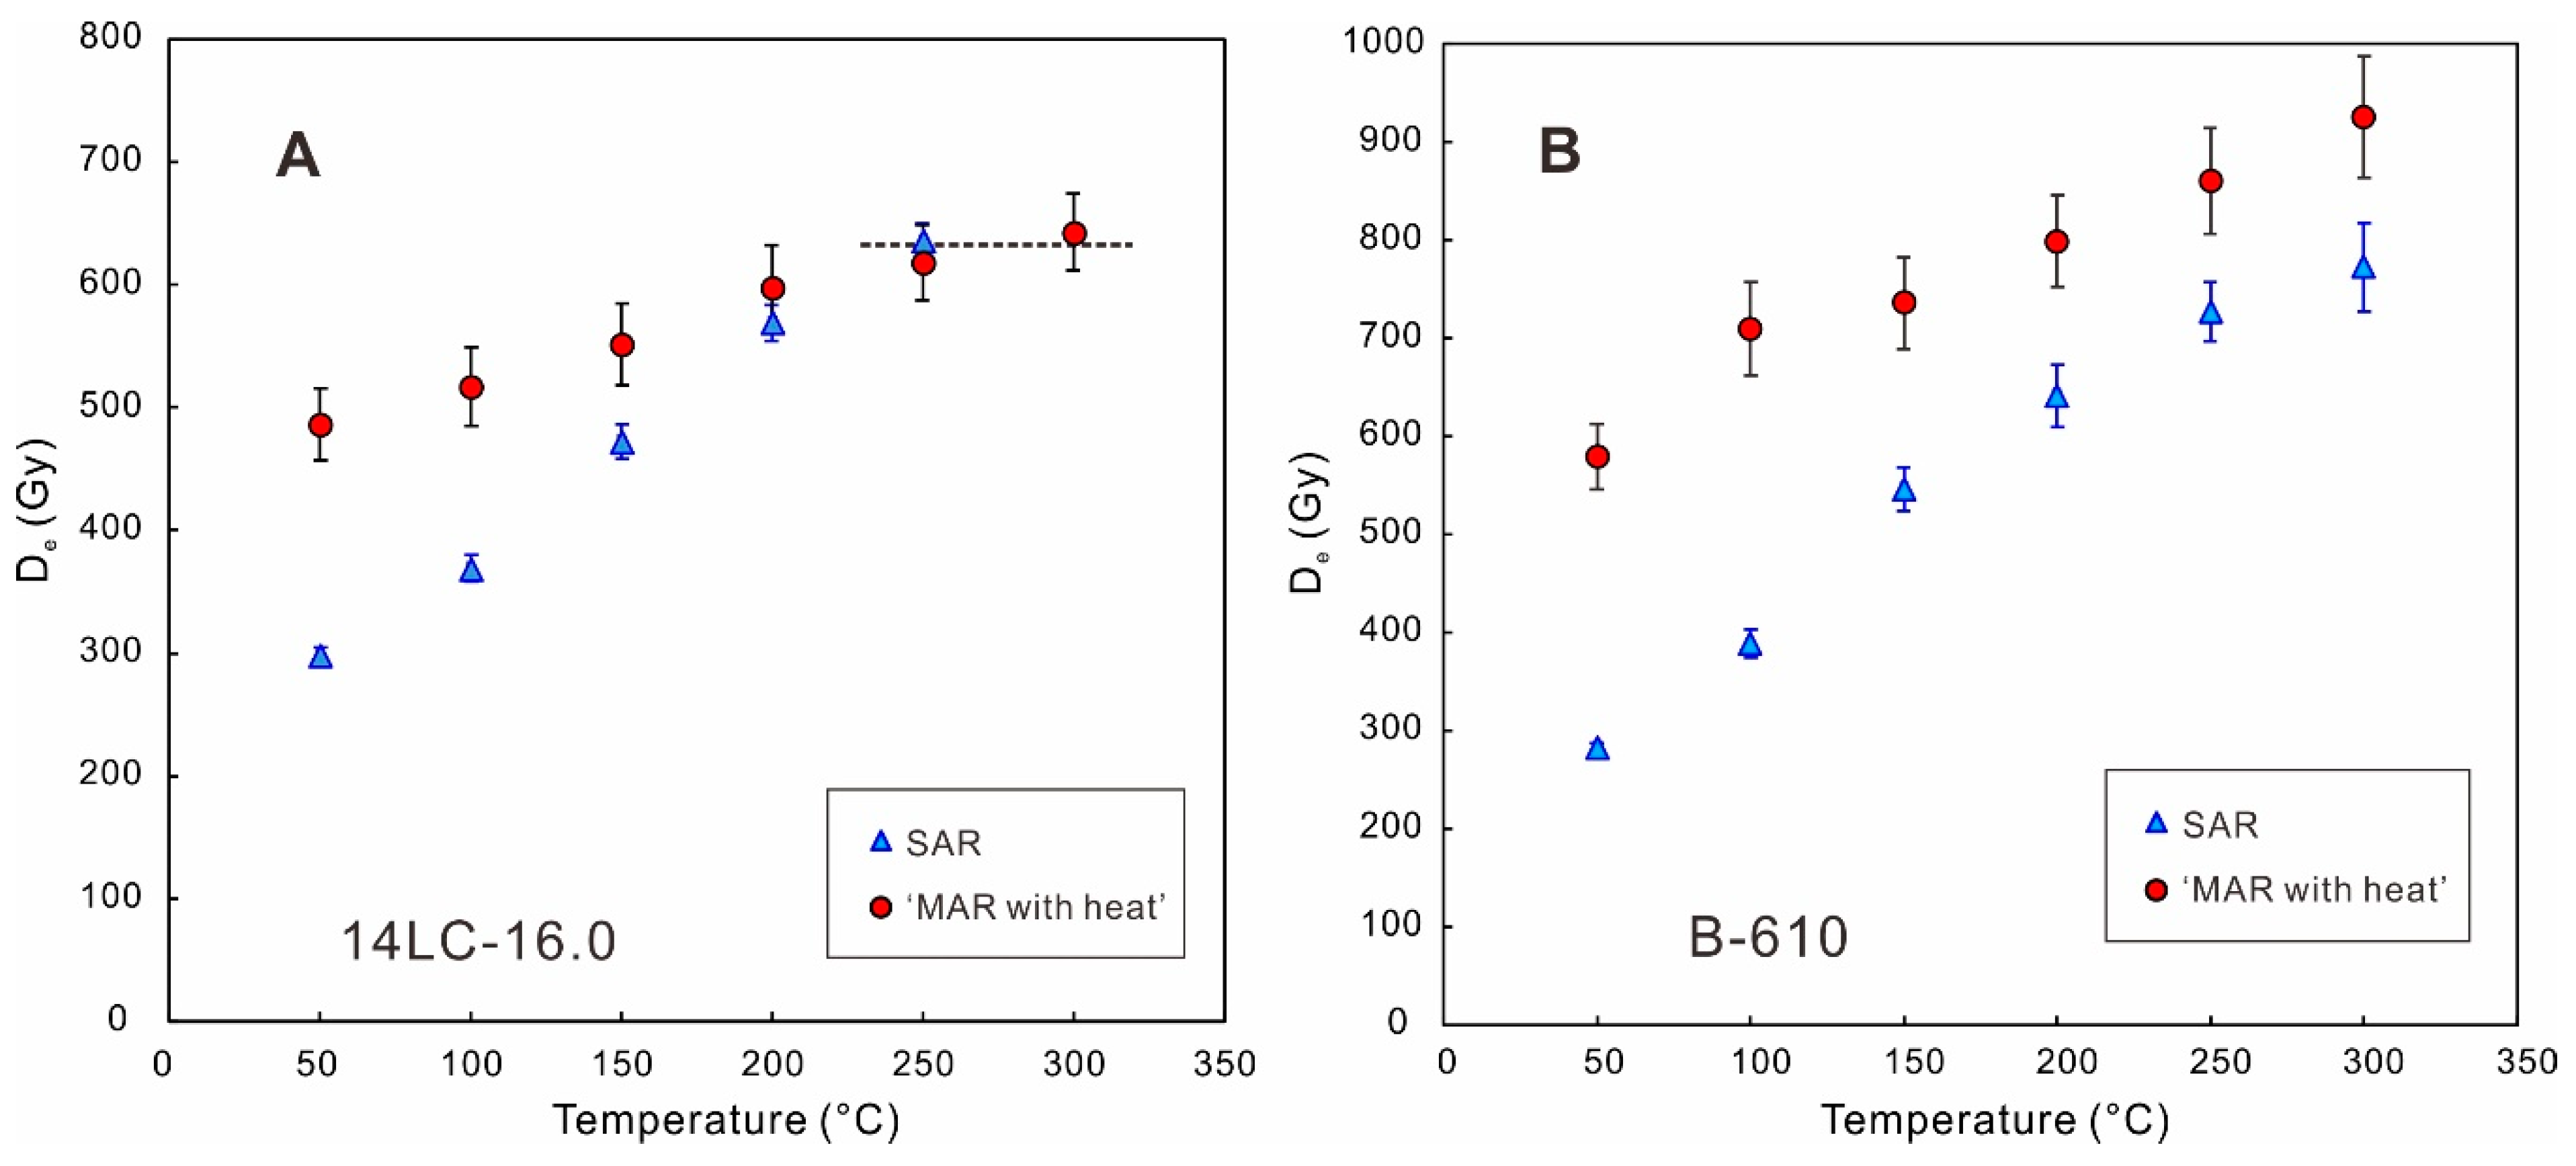
Figure 3A shows that for a loess sample with the De of ~640 Gy, the SAR De values are smaller compared to the MAR De values for the low-temperature signals, but they become similar for the high-temperature (250 °C and 300 °C) signals. Several studies have illustrated that sensitivity correction in the first cycle (natural signal measurement) of the SAR protocol is unsuccessful for the low-temperature IRSL signals (e.g., IR50) of K-feldspar when a high preheat temperature (e.g., >200 °C) is applied, and De underestimation exists for those low-temperature signals [67,84,90,91,92]. Age underestimation of the low-temperature IRSL signals has two sources with the SAR protocol—the anomalous fading and the failure of sensitivity correction. Some studies proposed that the failure of sensitivity correction was related to the increased electron trapping probability caused by the first preheat treatment [67,90,91]; while a recent study suggested that it was a combined effect of the decrease in the electron trapping probability and the increase in recombination probability [84]. The sensitivity correction of the high-temperature pIRIR signals is generally acceptable [67,84,91,92], which is why consistent SAR De and MAR De values can be obtained at the temperatures of 250 °C and 300 °C for relatively young samples (Figure 3A). However, the SAR De value becomes smaller than the MAR De value for a sample with De of ~900 Gy (Figure 3B) [85]. Despite of the generally successful sensitivity correction of the high-temperature pIRIR signals, both slight SAR De underestimation or overestimation can still occur, depending on the stimulation temperature of the pIRIR signals, the size of the De and the test dose, as well as sample origins [52,67,82,84,89]. Zhang et al. [85] performed dose recovery tests on the samples from their study, and observed a 10% overestimation for the dose recovery ratios with a recovery dose of 900 Gy, which cannot explain the SAR De underestimation for these old samples.
The empirical 2D0 limit was initially proposed for quartz [8]. A recent study argued that the De underestimation beyond the 2D0 limit of quartz was caused by the rejection of the ‘saturated’ aliquots or grains which resulted in a truncated De distribution [93]. Instead of the conventional ‘mean De’ method, Li et al. [93] proposed a ‘mean Ln/Tn’ method to overcome this problem. The ‘mean Ln/Tn’ method applies the mean of re-normalized natural signal (Ln/Tn) to calculate the final De, thus no grains or aliquots would be abandoned when their natural signals lie above the saturation level of the growth curve. This method has been successfully applied in dating quartz of archeological cave sediments with De values up to ~300 Gy [94]. However, for the K-feldspar samples whose SAR De values were underestimated in Zhang et al. [85], no ‘saturated’ aliquots were observed and discarded. Applying the ‘mean Ln/Tn’ method cannot overcome the De underestimation of K-feldspar in Zhang et al. [85]. Several studies revealed that the natural dose response curve of quartz saturated at lower dose than the laboratory dose response curve, and they suggested it was the reason for quartz De underestimation in the high dose range [74,95,96,97]. Whether the natural dose response curve of K-feldspar also saturates at lower dose than the laboratory dose response curve needs further research.
4. Standard Growth Curves
The standard growth curve (SGC) was initially proposed for quartz to simplify the measurement procedure of De estimation [98]. Test dose standardized OSL signal (Lx/Tx × Dt) was applied to construct the SGC [98]. With the SGC, only the sensitivity corrected natural signal (Ln/Tn) needs to be measured to estimate the De, which has greatly improved the efficiency of OSL dating [98]. However, some studies reported that if different Dt values were used, the Lx/Tx × Dt signal were still deviated from each other, with larger Lx/Tx × Dt for larger Dt [99,100]. Later, a regenerative dose normalization (re-normalization) procedure was proposed [101,102]. For each individual aliquot, the sensitivity corrected signals (Lx/Tx) are firstly re-normalized by a signal (Lr1/Tr1) from the aliquot itself. The re-normalized signal (I) is obtained by the following equation:
where Lx/Tx are the sensitivity corrected signals of all the regenerative doses and Lr1/Tr1 is the sensitivity corrected signal of a specific regenerative dose (Dr1). The I values of different aliquots and samples are plotted together, against the regenerative doses, to fit the SGC with appropriate functions such as the single saturating exponential (SSE) function, double saturating exponential (DSE) function, and general-order kinetic (GOK) function [103]. To estimate De, two cycles of the conventional SAR protocol need to be performed. The first cycle is to measure the natural signal (Ln/Tn) and the second cycle to measure the signal (Lc/Tc) of a regenerative dose, which is here termed the calibration dose (Dc). It is better to use a Dc that is close to the expected De value [78,102,104]. The Lc/Tc is used to calibrate the Ln/Tn:
where the f(Dc) is the corresponded functional value of Dc on the SGC. The SGC De can be estimated from the f(De) according to the SGC function.
The Dt applied in the SGC construction of K-feldspar was 24–66 Gy in Li et al. [102]. Due to the small size of the test dose, no dependence had been observed between the shape of the SGC and the Dt [102]. Zhang and Li [78] applied two larger Dt (72.5 Gy, 145 Gy) for SGC constructions, and reported that the SGC with a Dt of 145 Gy had a larger D0 than the SGC with a Dt of 72.5 Gy. As illustrated above, D0 generally increases with Dt (Figure 2). Zhang and Li [78] suggested that the Dt used for SGC De estimation should be close to the Dt used for SGC construction. Identical Dt for SGC construction and De estimation would always be the best choice.
A least-squares normalization procedure (‘LS-normalization’) was proposed to establish the SGCs for quartz from Haua Fteah cave, Libya [76]. Later, this LS-normalization procedure has also been applied in constructing SGCs for K-feldspar [92,105]. The ‘LS-normalization’ can further reduce the inter-grain and inter-aliquot variation of individual growth curves. It involves an iterative re-scaling and fitting process [76]. First, a starting curve is chosen. Then, individual growth curve of each aliquot or grain is re-scaled by multiplying a factor to make the sum of squared residuals—the difference between the observed values and the fitted values—is the smallest. All the rescaled-data are fitted again with a certain function. Iterate the re-scaling and fitting process until there is negligible change (<1%) in the results. The procedure can now be easily performed with the lsNORM function in the R package ‘numOSL’ [106].
For quartz, different grains or aliquots have quite different D0 values, and different SGCs need to be built for quartz groups with different saturation behaviors [76,94]. In Figure 2, the D0 values of K-feldspar are scatted even when the Dt is similar. That is because the figure includes different kinds of pIRIR signals (pIRIR50, 170, pIRIR50, 225, pIRIR50, 290, MET-pIRIR250, etc.). Also, the maximum regenerative doses used to build the growth curves in different studies are also different. Usually, the D0 would increase when the maximum regenerative dose is larger [107]. When using the same Dt, the identical pIRIR signal from K-feldspar has quite similar saturation behavior between different samples [78,102,105]. Individual growth curves of different K-feldspar grains or aliquots from different continents become very close to each other after re-normalization or re-scaling, which indicates the existence of a global SGC of K-feldspar [102,105].
With a SGC, the machine time needs to estimate the De is only 1/3 of the time with a standard SAR approach, but the De values obtained by the SGC method are almost identical to the SAR De values [78,102]. Similar to quartz, the SGC also provides the ‘mean Ln/Tn’ solution to date K-feldspar samples with natural signals close to saturation [108], which cannot be accomplished with the conventional SAR approach.
5. Single-Grain Dating
The conventionally used aliquots in OSL dating usually contain hundreds of grains. The De values determined by aliquots are the mean of multiple grains. For partially-bleached samples, it would result in age overestimation. Single-grain dating measures the De values of individual grains, thus it has great advantages in dealing with partially-bleached sediments. By applying certain age models (e.g., [109,110,111,112,113]), the portion of fully-bleached grains can be distinguished and the last exposure event can be dated. Single-grain dating is also applicable to sediments that were well-bleached at deposition, but suffered disturbance after burial which resulted in mixing between different-aged grains (e.g., [114,115,116,117,118]). Several studies have applied single-grain dating of K-feldspar with the low-temperature IRSL signal (e.g., at 50 °C) [119,120,121,122,123,124,125]. Different methods were applied to overcome the fading problem, such as the fadia method [119,120,121], the isochron method [122], isolating ‘zero’-fading grains [123], and fading correction [124,125]. After the pIRIR dating protocol was established, single-grain pIRIR dating with K-feldspar has been reported in numerous studies [43,108,126,127,128,129,130,131,132,133,134,135,136,137]. The machine time can be saved by performing prior-IR stimulations on all the grains simultaneously [108,129,137].
However, a general trend has been observed that brighter K-feldspar grains (higher signal sensitivity) yield higher De values [108,126,129,130,137]. Reimann et al. [126] applied pIRIR50, 180 dating protocol on K-feldspar single grains from southern Baltic Sea coast, NE Germany. A dependence of De values on the brightness of individual grains was observed—with higher De values for brighter grains, and only the brightest 30% of the K-feldspar grains yielded the mean single-grain pIRIR50, 180 ages that agreed with the age control [126]. As Reimann et al. [126] found that the fading rates of grains with different brightness were still close to each other, they suggested that the single-grain De dependence on brightness might be due to the different K contents in the grains (dimmer grains may contain less K). Brown et al. [129] performed K-feldspar single-grain pIRIR50, 225 dating for alluvial fan deposits in Baja California Sur, Mexico. In their study, the grains with brighter signal were found to have smaller fading rates. Rhodes [130] also reported a positive relationship between the grain brightness and De values, when dating individual K-feldspar grains from different locations with the pIRIR50, 225 signal. Rhodes [130] proposed an improved separation method to select the K-feldspar grains with density smaller than 2.565 g/cm3—the ‘Super-K’ grains with higher brightness, rather than the regular K-feldspar fraction (density < 2.58 g/cm3).
Jacobs et al. [108] carried out K-feldspar single-grain pIRIR200, 275 dating on sediments of the Denisova Cave in southern Siberia. For more than half of their samples, the weighted mean De values increased with a higher ’brightness threshold’ of the grains (Tn), and similar pattern was also observed in the dose recovery ratios [108]. To make accurate De estimation, Jacobs et al. [108] determined a ‘threshold’ Tn for each sample, above which a mean De ‘plateau’ could be reached. The measured K contents of 60 individual K-feldspar grains (density < 2.58 g/cm3) from Jacobs et al. [108] were mostly in the range of 12–14%, and no dependence of brightness on the K contents was observed. Guo et al. [137] compared the single-aliquot and single-grain MET-pIRIR170 De results of K-feldspar samples from the Nihewan Basin, northern China. The mean De values of single-grain results were smaller than the those of the single-aliquot results (single-aliquot De was dominated by brighter grains inside the aliquot). Applying the ‘brightness threshold’ method, the mean single-grain De values corresponding to brighter grains became close to the single-aliquot De values. Fading rate tests showed that dimmer grains had higher fading rates, and Guo et al. [137] suggested that the discrepancy between the single-grain and single-aliquot De values were mainly due to the different fading rates of grains. However, a systematic increase in the fading-corrected De values with the ‘brightness threshold’ still existed and they proposed that brighter grains might still have slightly higher internal K contents than dimmer grains [137]. Guo et al. [137] have not observed a dependence of dose recovery ratios on the grain brightness. All the recovery ratios were close to unity irrespective of grain brightness, indicating that the sensitivity correction of natural signal (the first cycle in SAR protocol) is still successful for both bright and dim grains [137].
These studies presented above indicate that it is a ubiquitous phenomenon that brighter K-feldspar grains have higher De estimates, and can provide more reliable ages. By now, at least three factors may contribute to the lower De values for dim grains. One is that the dim grains have higher fading rates [129,137]. The second is that dim grains contain less internal K (less than 12–14 %), which corresponds to lower environmental dose rate [126,137]. The third is that sensitivity correction of natural signal is not successful for dim grains [108]. The true reason may be a combination of several factors and may also be sample-dependent. Therefore, in single-grain dating of K-feldspar, it is essential to exclude the dim grains with a ‘brightness threshold’, as age underestimation would be brought in if all grains are included to calculate the mean De value. A suitable ‘brightness threshold’ might be determined by the relationship between the mean De values and the ‘brightness threshold’—the ‘plateau’ method [108,137].
6. Conclusions
The pIRIR signals of K-feldspar can be sufficiently stable to provide accurate age estimations without fading correction. However, care should be taken to choose the suitable pIRIR signal to date samples with different ages. For young samples (e.g., <10 ka), the low-temperature signals (e.g., pIRIR50, 180, MET-pIRIR170) can be applied with a low preheat temperature (e.g., 200 °C) to avoid the age overestimation caused by residual doses. For intermediate-aged samples (e.g., 10–110 ka), the pIRIR50, 290, pIRIR200, 290, MET-pIRIR250 signals are all suitable. For older samples, with De larger than 400 Gy (~110 ka with a typical dose rate of ~3.5 Gy/ka), the pIRIR50, 290 would underestimate the De values, while the pIRIR200, 290, MET-pIRIR250 signals can still provide robust results. The empirical upper dating limit of 2D0 is also applicable to K-feldspar. With the modified protocols, such as ‘MAR with heat’ and ‘SAR with solar’, the dating limit can be increased to ~1500 Gy due to larger D0.
The SGC of K-feldspar can greatly save the machine time needed for De measurement, while it provides De estimates almost identical to those of the standard SAR procedure. In addition, with the SGC, a ‘mean Ln/Tn’ approach for De estimation can be performed for samples whose natural signals are close to the saturation level of the growth curve. In single-grain dating of K-feldspar, bright grains usually have higher De values than the dim grains. Suitable ‘brightness threshold’ should be applied to exclude the dim grains to avoid age underestimation.
Author Contributions
Conceptualization, S.-H.L. and J.Z.; methodology, J.Z.; writing—original draft preparation, J.Z.; writing—review and editing, S.-H.L. All authors have read and agreed to the published version of the manuscript.
Funding
This research was founded by the grants to S.-H.L. from the Research Grant Council of the Hong Kong SAR, China (awards 17303014, 17307117).
Acknowledgments
We thank two anonymous reviewers and the editor—J.K. Feathers for their constructive comments.
Conflicts of Interest
The authors declare no conflict of interest. The funders had no role in the design of the study; in the collection, analyses, or interpretation of data; in the writing of the manuscript, or in the decision to publish the results.
References
- Aitken, M.J. An Introduction to Optical Dating; Clarendon Press: Oxford, UK, 1998. [Google Scholar]
- Murray, A.S.; Roberts, R.G. Measurement of the equivalent dose in quartz using a regenerative-dose single-aliquot protocol. Radiat. Meas. 1998, 29, 503–515. [Google Scholar] [CrossRef]
- Murray, A.S.; Wintle, A.G. Luminescence dating of quartz using an improved single-aliquot regenerative-dose protocol. Radiat. Meas. 2000, 32, 57–73. [Google Scholar] [CrossRef]
- Murray, A.S.; Wintle, A.G. The single aliquot regenerative dose protocol: Potential for improvements in reliability. Radiat. Meas. 2003, 37, 377–381. [Google Scholar] [CrossRef]
- Murray, A.S.; Funder, S. Optically stimulated luminescence dating of a Danish Eemian coastal marine deposit: A test of accuracy. Quat. Sci. Rev. 2003, 22, 1177–1183. [Google Scholar] [CrossRef]
- Murray, A.S.; Svendsen, J.I.; Mangerud, J.; Astakhov, V.I. Testing the accuracy of quartz OSL dating using a known-age Eemian site on the river Sula, northern Russia. Quat. Geochronol. 2007, 2, 102–109. [Google Scholar] [CrossRef]
- Andreucci, S.; Sechi, D.; Buylaert, J.P.; Sanna, L.; Pascucci, V. Post-IR IRSL290 dating of K-rich feldspar sand grains in a wind-dominated system on Sardinia. Mar. Pet. Geol. 2017, 87, 91–98. [Google Scholar] [CrossRef] [Green Version]
- Wintle, A.G.; Murray, A.S. A review of quartz optically stimulated luminescence characteristics and their relevance in single-aliquot regeneration dating protocols. Radiat. Meas. 2006, 41, 369–391. [Google Scholar] [CrossRef]
- Lai, Z.P. Chronology and the upper dating limit for loess samples from Luochuan section in the Chinese Loess Plateau using quartz OSL SAR protocol. J. Asian Earth Sci. 2010, 37, 176–185. [Google Scholar] [CrossRef]
- Buylaert, J.P.; Vandenberghe, D.; Murray, A.S.; Huot, S.; De Corte, F.; Van den Haute, P. Luminescence dating of old (> 70 ka) Chinese loess: A comparison of single-aliquot OSL and IRSL techniques. Quat. Geochronol. 2007, 2, 9–14. [Google Scholar] [CrossRef]
- Fan, A.C.; Li, S.H.; Li, B. Observation of unstable fast component in OSL of quartz. Radiat. Meas. 2011, 46, 21–28. [Google Scholar] [CrossRef] [Green Version]
- Lai, Z.P.; Fan, A.C. Examining Quartz Osl Age Underestimation for Loess Samples from Luochuan in the Chinese Loess Plateau. Geochronometria 2014, 41, 57–64. [Google Scholar] [CrossRef] [Green Version]
- Duller, G.A.T. Behavioural studies of stimulated luminescence from feldspars. Radiat. Meas. 1997, 27, 663–694. [Google Scholar] [CrossRef]
- Huntley, D.J.; Lamothe, M. Ubiquity of anomalous fading in K-feldspars and the measurement and correction for it in optical dating. Can. J. Earth Sci. 2001, 38, 1093–1106. [Google Scholar] [CrossRef]
- Li, S.H.; Chen, Y.Y.; Li, B.; Sun, J.M.; Yang, L.R. OSL dating of sediments from deserts in northern China. Quat. Geochronol. 2007, 2, 23–28. [Google Scholar] [CrossRef]
- Wintle, A.G. Anomalous Fading of Thermoluminescence in Mineral Samples. Nature 1973, 245, 143–144. [Google Scholar] [CrossRef]
- Spooner, N.A. Optical Dating—Preliminary-Results on the Anomalous Fading of Luminescence from Feldspars. Quat. Sci. Rev. 1992, 11, 139–145. [Google Scholar] [CrossRef]
- Spooner, N.A. The Anomalous Fading of Infrared-Stimulated Luminescence from Feldspars. Radiat. Meas. 1994, 23, 625–632. [Google Scholar] [CrossRef]
- Visocekas, R. Tunneling Radiative Recombination in Labradorite—Its Association with Anomalous Fading of Thermo-Luminescence. Nucl. Tracks Radiat. Meas. 1985, 10, 521–529. [Google Scholar] [CrossRef]
- Lamothe, M.; Auclair, M.; Hamzaoui, C.; Huot, S. Towards a prediction of long-term anomalous fading of feldspar IRSL. Radiat. Meas. 2003, 37, 493–498. [Google Scholar] [CrossRef]
- Kars, R.H.; Wallinga, J.; Cohen, K.M. A new approach towards anomalous fading correction for feldspar IRSL dating—tests on samples in field saturation. Radiat. Meas. 2008, 43, 786–790. [Google Scholar] [CrossRef]
- Li, B.; Li, S.-H. Investigations of the dose-dependent anomalous fading rate of feldspar from sediments. J. Phys. D Appl. Phys. 2008, 41, 225502. [Google Scholar] [CrossRef]
- Morthekai, P.; Jain, M.; Murray, A.S.; Thomsen, K.J.; Botter-Jensen, L. Fading characteristics of martian analogue materials and the applicability of a correction procedure. Radiat. Meas. 2008, 43, 672–678. [Google Scholar] [CrossRef]
- Wallinga, J.; Bos, A.J.J.; Dorenbos, P.; Murray, A.S.; Schokker, J. A test case for anomalous fading correction in IRSL dating. Quat. Geochronol. 2007, 2, 216–221. [Google Scholar] [CrossRef]
- Li, G.-Q.; Zhao, H.; Chen, F.-H. Comparison of three K-feldspar luminescence dating methods for Holocene samples. Geochronometria 2011, 38, 14–22. [Google Scholar] [CrossRef] [Green Version]
- Li, B.; Li, S.-H. Luminescence dating of K-feldspar from sediments: A protocol without anomalous fading correction. Quat. Geochronol. 2011, 6, 468–479. [Google Scholar] [CrossRef] [Green Version]
- Reimann, T.; Tsukamoto, S.; Naumann, M.; Frechen, M. The potential of using K-rich feldspars for optical dating of young coastal sediments—A test case from Darss-Zingst peninsula (southern Baltic Sea coast). Quat. Geochronol. 2011, 6, 207–222. [Google Scholar] [CrossRef]
- Madsen, A.T.; Buylaert, J.P.; Murray, A.S. Luminescence Dating of Young Coastal Deposits from New Zealand Using Feldspar. Geochronometria 2011, 38, 379–390. [Google Scholar] [CrossRef] [Green Version]
- Ito, K.; Tamura, T.; Tsukamoto, S. Post-IR IRSL Dating of K-Feldspar from Last Interglacial Marine Terrace Deposits on the Kamikita Coastal Plain, Northeastern Japan. Geochronometria 2017, 44, 352–365. [Google Scholar] [CrossRef] [Green Version]
- Li, B.; Li, S.-H.; Wintle, A.G.; Zhao, H. Isochron measurements of naturally irradiated K-feldspar grains. Radiat. Meas. 2007, 42, 1315–1327. [Google Scholar] [CrossRef]
- Li, B.; Li, S.-H.; Wintle, A.G.; Zhao, H. Isochron dating of sediments using luminescence of K-feldspar grains. J. Geophys. Res.-Earth Surf. 2008, 113. [Google Scholar] [CrossRef] [Green Version]
- Li, B.; Jacobs, Z.; Roberts, R.G.; Li, S.H. Review and assessment of the potential of post-IR IRSL dating methods to circumvent the problem of anomalous fading in feldspar luminescence. Geochronometria 2014, 41, 178–201. [Google Scholar] [CrossRef] [Green Version]
- Thomsen, K.J.; Murray, A.S.; Jain, M.; Botter-Jensen, L. Laboratory fading rates of various luminescence signals from feldspar-rich sediment extracts. Radiat. Meas. 2008, 43, 1474–1486. [Google Scholar] [CrossRef]
- Jain, M.; Ankjaergaard, C. Towards a non-fading signal in feldspar: Insight into charge transport and tunnelling from time-resolved optically stimulated luminescence. Radiat. Meas. 2011, 46, 292–309. [Google Scholar] [CrossRef]
- Poolton, N.R.J.; Wallinga, J.; Murray, A.S.; Bulur, E.; Botter-Jensen, L. Electrons in feldspar I: On the wavefunction of electrons trapped at simple lattice defects. Phys. Chem. Miner. 2002, 29, 210–216. [Google Scholar] [CrossRef]
- Poolton, N.R.J.; Ozanyan, K.B.; Wallinga, J.; Murray, A.S.; Botter-Jensen, L. Electrons in feldspar II: A consideration of the influence of conduction band-tail states on luminescence processes. Phys. Chem. Miner. 2002, 29, 217–225. [Google Scholar] [CrossRef]
- Buylaert, J.P.; Murray, A.S.; Thomsen, K.J.; Jain, M. Testing the potential of an elevated temperature IRSL signal from K-feldspar. Radiat. Meas. 2009, 44, 560–565. [Google Scholar] [CrossRef]
- Thiel, C.; Buylaert, J.P.; Murray, A.; Terhorst, B.; Hofer, I.; Tsukamoto, S.; Frechen, M. Luminescence dating of the Stratzing loess profile (Austria)—Testing the potential of an elevated temperature post-IR IRSL protocol. Quat. Int. 2011, 234, 23–31. [Google Scholar] [CrossRef]
- Buylaert, J.P.; Jain, M.; Murray, A.S.; Thomsen, K.J.; Thiel, C.; Sohbati, R. A robust feldspar luminescence dating method for Middle and Late Pleistocene sediments. Boreas 2012, 41, 435–451. [Google Scholar] [CrossRef]
- Buylaert, J.P.; Thiel, C.; Murray, A.S.; Vandenberghe, D.A.G.; Yi, S.W.; Lu, H.Y. IRSL and Post-IR IRSL Residual Doses Recorded in Modern Dust Samples from the Chinese Loess Plateau. Geochronometria 2011, 38, 432–440. [Google Scholar] [CrossRef] [Green Version]
- Murray, A.S.; Thomsen, K.J.; Masuda, N.; Buylaert, J.P.; Jain, M. Identifying well-bleached quartz using the different bleaching rates of quartz and feldspar luminescence signals. Radiat. Meas. 2012, 47, 688–695. [Google Scholar] [CrossRef]
- Alexanderson, H.; Murray, A.S. Luminescence signals from modern sediments in a glaciated bay, NW Svalbard. Quat. Geochronol. 2012, 10, 250–256. [Google Scholar] [CrossRef]
- Nian, X.M.; Bailey, R.M.; Zhou, L.P. Investigations of the post-IR IRSL protocol applied to single K-feldspar grains from fluvial sediment samples. Radiat. Meas. 2012, 47, 703–709. [Google Scholar] [CrossRef]
- Stevens, T.; Markovic, S.B.; Zech, M.; Hambach, U.; Sumegi, P. Dust deposition and climate in the Carpathian Basin over an independently dated last glacial-interglacial cycle. Quat. Sci. Rev. 2011, 30, 662–681. [Google Scholar] [CrossRef]
- Li, Y.; Tsukamoto, S.; Frechen, M.; Gabriel, G. Timing of fluvial sedimentation in the Upper Rhine Graben since the Middle Pleistocene: Constraints from quartz and feldspar luminescence dating. Boreas 2018, 47, 256–270. [Google Scholar] [CrossRef]
- Zhang, J.R.; Tsukamoto, S.; Nottebaum, V.; Lehmkuhl, F.; Frechen, M. D-e plateau and its implications for post-IR IRSL dating of polymineral fine grains. Quat. Geochronol. 2015, 30, 147–153. [Google Scholar] [CrossRef]
- Wang, Y.X.; Chen, T.Y.; Chongyi, E.; An, F.Y.; Lai, Z.P.; Zhao, L.; Liu, X.J. Quartz OSL and K-feldspar post-IR IRSL dating of loess in the Huangshui river valley, northeastern Tibetan plateau. Aeolian Res. 2018, 33, 23–32. [Google Scholar] [CrossRef]
- Roberts, H.M. Testing Post-IR IRSL protocols for minimising fading in feldspars, using Alaskan loess with independent chronological control. Radiat. Meas. 2012, 47, 716–724. [Google Scholar] [CrossRef]
- Sohbati, R.; Murray, A.S.; Buylaert, J.P.; Ortuno, M.; Cunha, P.P.; Masana, E. Luminescence dating of Pleistocene alluvial sediments affected by the Alhama de Murcia fault (eastern Betics, Spain)—A comparison between OSL, IRSL and post-IR IRSL ages. Boreas 2012, 41, 250–262. [Google Scholar] [CrossRef]
- Murray, A.S.; Schmidt, E.D.; Stevens, T.; Buylaert, J.P.; Markovic, S.B.; Tsukamoto, S.; Frechen, M. Dating Middle Pleistocene loess from Stari Slankamen (Vojvodina, Serbia)—Limitations imposed by the saturation behaviour of an elevated temperature IRSL signal. Catena 2014, 117, 34–42. [Google Scholar] [CrossRef]
- Kars, R.H.; Reimann, T.; Ankjaergaard, C.; Wallinga, J. Bleaching of the post-IR IRSL signal: New insights for feldspar luminescence dating. Boreas 2014, 43, 780–791. [Google Scholar] [CrossRef]
- Yi, S.W.; Buylaert, J.P.; Murray, A.S.; Lu, H.Y.; Thiel, C.; Zeng, L. A detailed post-IR IRSL dating study of the Niuyangzigou loess site in northeastern China. Boreas 2016, 45, 644–657. [Google Scholar] [CrossRef] [Green Version]
- Li, G.Q.; Rao, Z.G.; Duan, Y.W.; Xia, D.S.; Wang, L.B.; Madsen, D.B.; Jia, J.; Wei, H.T.; Qiang, M.R.; Chen, J.H.; et al. Paleoenvironmental changes recorded in a luminescence dated loess/paleosol sequence from the Tianshan Mountains, arid central Asia, since the Penultimate Glaciation. Earth Planet. Sci. Lett. 2016, 448, 1–12. [Google Scholar] [CrossRef]
- Li, G.Q.; Li, F.L.; Jin, M.; She, L.L.; Duan, Y.W.; Madsen, D.; Wang, L.B.; Chen, F. Late Quaternary lake evolution in the Gaxun Nur basin, central Gobi Desert, China, based on quartz OSL and K-feldspar pIRIR dating of paleoshorelines. J. Quat. Sci. 2017, 32, 347–361. [Google Scholar] [CrossRef]
- Lowick, S.E.; Trauerstein, M.; Preusser, F. Testing the application of post IR-IRSL dating to fine grain waterlain sediments. Quat. Geochronol. 2012, 8, 33–40. [Google Scholar] [CrossRef]
- Reimann, T.; Tsukamoto, S. Dating the recent past (<500 years) by pst-IR IRSL feldspar—Examples from the North Sea and Baltic Sea coast. Quat. Geochronol. 2012, 10, 180–187. [Google Scholar]
- Li, G.Q.; Wen, L.J.; Xia, D.S.; Duan, Y.W.; Rao, Z.G.; Madsen, D.B.; Wei, H.T.; Li, F.L.; Jia, J.; Chen, F.H. Quartz OSL and K-feldspar pIRIR dating of a loess/paleosol sequence from arid central Asia, Tianshan Mountains, NW China. Quat. Geochronol. 2015, 28, 40–53. [Google Scholar] [CrossRef]
- Wang, L.; Jia, J.; Zhao, H.; Liu, H.; Duan, Y.; Xie, H.; Zhang, D.D.; Chen, F. Optical dating of Holocene paleosol development and climate changes in the Yili Basin, arid central Asia. Holocene 2019, 29, 1068–1077. [Google Scholar] [CrossRef]
- Buckland, C.E.; Bailey, R.M.; Thomas, D.S.G. Using post-IR IRSL and OSL to date young (<200 years) dryland aeolian dune deposits. Radiat. Meas. 2019, 126, 106131. [Google Scholar]
- Li, B.; Li, S.H. A reply to the comments by Thomsen et al. on “Luminescence dating of K-feldspar from sediments: A protocol without anomalous fading correction”. Quat. Geochronol. 2012, 8, 49–51. [Google Scholar] [CrossRef] [Green Version]
- Li, B.; Roberts, R.G.; Jacobs, Z.; Li, S.H. A single-aliquot luminescence dating procedure for K-feldspar based on the dose-dependent MET-pIRIR signal sensitivity. Quat. Geochronol. 2014, 20, 51–64. [Google Scholar] [CrossRef] [Green Version]
- Li, B.; Jacobs, Z.; Roberts, R.G.; Li, S.H. Extending the age limit of luminescence dating using the dose-dependent sensitivity of MET-pIRIR signals from K-feldspar. Quat. Geochronol. 2013, 17, 55–67. [Google Scholar] [CrossRef] [Green Version]
- Li, B.; Li, S.H. Luminescence dating of Chinese loess beyond 130 ka using the non-fading signal from K-feldspar. Quat. Geochronol. 2012, 10, 24–31. [Google Scholar] [CrossRef] [Green Version]
- Fu, X.; Li, B.; Li, S.H. Testing a multi-step post-IR IRSL dating method using polymineral fine grains from Chinese loess. Quat. Geochronol. 2012, 10, 8–15. [Google Scholar] [CrossRef] [Green Version]
- Chen, Y.W.; Li, S.H.; Li, B. Residual doses and sensitivity change of post IR IRSL signals from potassium feldspar under different bleaching conditions. Geochronometria 2013, 40, 229–238. [Google Scholar] [CrossRef] [Green Version]
- Li, B.; Roberts, R.G.; Jacobs, Z. On the dose dependency of the bleachable and non-bleachable components of IRSL from K-feldspar: Improved procedures for luminescence dating of Quaternary sediments. Quat. Geochronol. 2013, 17, 1–13. [Google Scholar] [CrossRef] [Green Version]
- Zhang, J.J. Behavior of the electron trapping probability change in IRSL dating of K-feldspar: A dose recovery study. Quat. Geochronol. 2018, 44, 38–46. [Google Scholar] [CrossRef]
- Rui, X.; Zhang, J.F.; Hou, Y.M.; Yang, Z.M.; Liu, Y.; Zhen, Z.M.; Zhou, L.P. Feldspar multi-elevated-temperature post-IR IRSL dating of the Wulanmulun Paleolithic site and its implication. Quat. Geochronol. 2015, 30, 438–444. [Google Scholar] [CrossRef]
- Fu, X.; Li, S.-H. A modified multi-elevated-temperature post-IR IRSL protocol for dating Holocene sediments using K-feldspar. Quat. Geochronol. 2013, 17, 44–54. [Google Scholar] [CrossRef]
- McGuire, C.; Rhodes, E.J. Downstream MET-IRSL single-grain distributions in the Mojave River, southern California: Testing assumptions of a virtual velocity model. Quat. Geochronol. 2015, 30, 239–244. [Google Scholar] [CrossRef] [Green Version]
- Reimann, T.; Notenboom, P.D.; De Schipper, M.A.; Wallinga, J. Testing for sufficient signal resetting during sediment transport using a polymineral multiple-signal luminescence approach. Quat. Geochronol. 2015, 25, 26–36. [Google Scholar] [CrossRef]
- Zhang, J.J.; Li, S.H.; Sun, J.M.; Hao, Q.Z. Fake age hiatus in a loess section revealed by OSL dating of calcrete nodules. J. Asian Earth Sci. 2018, 155, 139–145. [Google Scholar] [CrossRef]
- Gong, Z.J.; Sun, J.M.; Lu, T.Y.; Tian, Z.H. Investigating the optically stimulated luminescence dose saturation behavior for quartz grains from dune sands in China. Quat. Geochronol. 2014, 22, 137–143. [Google Scholar] [CrossRef]
- Timar-Gabor, A.; Wintle, A.G. On natural and laboratory generated dose response curves for quartz of different grain sizes from Romanian loess. Quat. Geochronol. 2013, 18, 34–40. [Google Scholar] [CrossRef]
- Duller, G.A.T.; Botter-Jensen, L.; Murray, A.S. Optical dating of single sand-sized grains of quartz: Sources of variability. Radiat. Meas. 2000, 32, 453–457. [Google Scholar] [CrossRef]
- Li, B.; Jacobs, Z.; Roberts, R.G. Investigation of the applicability of standardised growth curves for OSL dating of quartz from Haua Fteah cave, Libya. Quat. Geochronol. 2016, 35, 1–15. [Google Scholar] [CrossRef] [Green Version]
- Chen, Y.W.; Li, S.H.; Li, B.; Hao, Q.Z.; Sun, J.M. Maximum age limitation in luminescence dating of Chinese loess using the multiple-aliquot MET-pIRIR signals from K-feldspar. Quat. Geochronol. 2015, 30, 207–212. [Google Scholar] [CrossRef] [Green Version]
- Zhang, J.; Li, S.-H. Constructions of standardised growth curves (SGCs) for IRSL signals from K-feldspar, plagioclase and polymineral fractions. Quat. Geochronol. 2019, 49, 8–15. [Google Scholar] [CrossRef]
- Qin, J.T.; Zhou, L.P. Effects of thermally transferred signals in the post-IR IRSL SAR protocol. Radiat. Meas. 2012, 47, 710–715. [Google Scholar] [CrossRef]
- Colarossi, D.; Duller, G.A.T.; Roberts, H.M. Exploring the behaviour of luminescence signals from feldspars: Implications for the single aliquot regenerative dose protocol. Radiat. Meas. 2018, 109, 35–44. [Google Scholar] [CrossRef]
- Liu, J.F.; Murray, A.; Sohbati, R.; Jain, M. The effect of test dose and first IR stimulation temperature on post-IR IRSL measurements on rock slices. Geochronometria 2016, 43, 179–187. [Google Scholar] [CrossRef] [Green Version]
- Fu, X.; Li, S.H.; Li, B. Optical dating of aeolian and fluvial sediments in north Tian Shan range, China: Luminescence characteristics and methodological aspects. Quat. Geochronol. 2015, 30, 161–167. [Google Scholar] [CrossRef] [Green Version]
- Carr, A.S.; Hay, A.S.; Powell, D.M.; Livingstone, I. Testing post-IR IRSL luminescence dating methods in the southwest Mojave Desert, California, USA. Quat. Geochronol. 2019, 49, 85–91. [Google Scholar] [CrossRef]
- Qin, J.T.; Chen, J.; Li, Y.T.; Zhou, L.P. Initial sensitivity change of K-feldspar pIRIR signals due to uncompensated decrease in electron trapping probability: Evidence from radiofluorescence measurements. Radiat. Meas. 2018, 120, 131–136. [Google Scholar] [CrossRef]
- Zhang, J.; Li, S.-H.; Wang, X.; Hao, Q.; Hu, G.; Chen, Y. Comparison of equivalent doses obtained with various post-IR IRSL dating protocols of K-feldspar. Geochronometria 2020, in press. [Google Scholar]
- Yi, S.; Buylaert, J.-P.; Murray, A.S.; Thiel, C.; Zeng, L.; Lu, H. High resolution OSL and post-IR IRSL dating of the last interglacial–glacial cycle at the Sanbahuo loess site (northeastern China). Quat. Geochronol. 2015, 30, 200–206. [Google Scholar] [CrossRef] [Green Version]
- Qiu, F.Y.; Zhou, L.P. A new luminescence chronology for the Mangshan loess-palaeosol sequence on the southern bank of the Yellow River in Henan, central China. Quat. Geochronol. 2015, 30, 24–33. [Google Scholar] [CrossRef]
- Buylaert, J.-P.; Yeo, E.-Y.; Thiel, C.; Yi, S.; Stevens, T.; Thompson, W.; Frechen, M.; Murray, A.; Lu, H. A detailed post-IR IRSL chronology for the last interglacial soil at the Jingbian loess site (northern China). Quat. Geochronol. 2015, 30, 194–199. [Google Scholar] [CrossRef] [Green Version]
- Stevens, T.; Buylaert, J.P.; Thiel, C.; Ujvari, G.; Yi, S.; Murray, A.S.; Frechen, M.; Lu, H. Ice-volume-forced erosion of the Chinese Loess Plateau global Quaternary stratotype site. Nat. Commun. 2018, 9, 983. [Google Scholar] [CrossRef]
- Wallinga, J.; Murray, A.; Duller, G. Underestimation of equivalent dose in single-aliquot optical dating of feldspars caused by preheating. Radiat. Meas. 2000, 32, 691–695. [Google Scholar] [CrossRef]
- Kars, R.H.; Reimann, T.; Wallinga, J. Are feldspar SAR protocols appropriate for post-IR IRSL dating? Quat. Geochronol. 2014, 22, 126–136. [Google Scholar] [CrossRef]
- Li, B.; Jacobs, Z.; Roberts, R.G. An improved multiple-aliquot regenerative-dose (MAR) procedure for post-IR IRSL dating of K-feldspar. Anc. TL 2017, 35, 1–10. [Google Scholar]
- Li, B.; Jacobs, Z.; Roberts, R.G.; Galbraith, R.; Peng, J. Variability in quartz OSL signals caused by measurement uncertainties: Problems and solutions. Quat. Geochronol. 2017, 41, 11–25. [Google Scholar] [CrossRef] [Green Version]
- Hu, Y.; Marwick, B.; Zhang, J.F.; Rui, X.; Hou, Y.M.; Yue, J.P.; Chen, W.R.; Huang, W.W.; Li, B. Late Middle Pleistocene Levallois stone-tool technology in southwest China. Nature 2019, 565, 82–85. [Google Scholar] [CrossRef] [PubMed]
- Timar-Gabor, A.; Constantin, D.; Buylaert, J.P.; Jain, M.; Murray, A.S.; Wintle, A.G. Fundamental investigations of natural and laboratory generated SAR dose response curves for quartz OSL in the high dose range. Radiat. Meas. 2015, 81, 150–156. [Google Scholar] [CrossRef] [Green Version]
- Anechitei-Deacu, V.; Timar-Gabor, A.; Thomsen, K.J.; Buylaert, J.P.; Jain, M.; Bailey, M.; Murray, A.S. Single and multi-grain OSL investigations in the high dose range using coarse quartz. Radiat. Meas. 2018, 120, 124–130. [Google Scholar] [CrossRef]
- Anechitei-Deacu, V.; Timar-Gabor, A.; Constantin, D.; Trandafir-Antohi, O.; Del Valle, L.; Fornos, J.J.; Gomez-Pujol, L.; Wintle, A.G. Assessing the Maximum Limit of SAR-OSL Dating Using Quartz of Different Grain Sizes. Geochronometria 2018, 45, 146–159. [Google Scholar] [CrossRef] [Green Version]
- Roberts, H.M.; Duller, G.A.T. Standardised growth curves for optical dating of sediment using multiple-grain aliquots. Radiat. Meas. 2004, 38, 241–252. [Google Scholar] [CrossRef]
- Burbidge, C.I.; Duller, G.A.T.; Roberts, H.M. De determination for young samples using the standardised OSL response of coarse-grain quartz. Radiat. Meas. 2006, 41, 278–288. [Google Scholar] [CrossRef]
- Shen, Z.X.; Mauz, B. Estimating the equivalent dose of late Pleistocene fine silt quartz from the Lower Mississippi Valley using a standardized OSL growth curve. Radiat. Meas. 2011, 46, 649–654. [Google Scholar] [CrossRef]
- Li, B.; Roberts, R.G.; Jacobs, Z.; Li, S.H. Potential of establishing a ‘global standardised growth curve’ (gSGC) for optical dating of quartz from sediments. Quat. Geochronol. 2015, 27, 94–104. [Google Scholar] [CrossRef] [Green Version]
- Li, B.; Roberts, R.G.; Jacobs, Z.; Li, S.H.; Guo, Y.J. Construction of a ‘global standardised growth curve’ (gSGC) for infrared stimulated luminescence dating of K-feldspar. Quat. Geochronol. 2015, 27, 119–130. [Google Scholar] [CrossRef] [Green Version]
- Guralnik, B.; Li, B.; Jain, M.; Chen, R.; Paris, R.B.; Murray, A.S.; Li, S.H.; Pagonis, V.; Valla, P.G.; Herman, F. Radiation-induced growth and isothermal decay of infrared-stimulated luminescence from feldspar. Radiat. Meas. 2015, 81, 224–231. [Google Scholar] [CrossRef] [Green Version]
- Peng, J.; Pagonis, V.; Li, B. On the intrinsic accuracy and precision of the standardised growth curve (SGC) and global-SGC (gSGC) methods for equivalent dose determination: A simulation study. Radiat. Meas. 2016, 94, 53–64. [Google Scholar] [CrossRef] [Green Version]
- Li, B.; Jacobs, Z.; Roberts, R.G.; Li, S.H. Single-grain dating of potassium-rich feldspar grains: Towards a global standardised growth curve for the post-IR IRSL signal. Quat. Geochronol. 2018, 45, 23–36. [Google Scholar] [CrossRef] [Green Version]
- Peng, J.; Li, B. Single-aliquot Regenerative-Dose (SAR) and Standardised Growth Curve (SGC) Equivalent Dose Determination in a Batch Model Using the Package ‘numOSL’. Anc. TL 2017, 35, 32–53. [Google Scholar]
- Timar-Gabor, A.; Buylaert, J.P.; Guralnik, B.; Trandafir-Antohi, O.; Constantin, D.; Anechitei-Deacu, V.; Jain, M.; Murray, A.S.; Porat, N.; Hao, Q.; et al. On the importance of grain size in luminescence dating using quartz. Radiat. Meas. 2017, 106, 464–471. [Google Scholar] [CrossRef]
- Jacobs, Z.; Li, B.; Shunkov, M.V.; Kozlikin, M.B.; Bolikhovskaya, N.S.; Agadjanian, A.K.; Uliyanov, V.A.; Vasiliev, S.K.; O’Gorman, K.; Derevianko, A.P.; et al. Timing of archaic hominin occupation of Denisova Cave in southern Siberia. Nature 2019, 565, 594–599. [Google Scholar] [CrossRef]
- Galbraith, R.F.; Roberts, R.G.; Laslett, G.M.; Yoshida, H.; Olley, J.M. Optical dating of single and multiple grains of quartz from jinmium rock shelter, northern Australia, part 1, Experimental design and statistical models. Archaeometry 1999, 41, 339–364. [Google Scholar] [CrossRef]
- Thomsen, K.J.; Murray, A.S.; Botter-Jensen, L.; Kinahan, J. Determination of burial dose in incompletely bleached fluvial samples using single grains of quartz. Radiat. Meas. 2007, 42, 370–379. [Google Scholar] [CrossRef]
- Arnold, L.J.; Roberts, R.G.; Galbraith, R.F.; DeLong, S.B. A revised burial dose estimation procedure for optical dating of young and modern-age sediments. Quat. Geochronol. 2009, 4, 306–325. [Google Scholar] [CrossRef]
- Smedley, R.K. A new R function for the Internal External Uncertainty (IEU) model. Anc. TL 2015, 33, 16–21. [Google Scholar]
- Hu, G.M.; Li, S.H. Simplified procedures for optical dating of young sediments using quartz. Quat Geochronol. 2019, 49, 31–38. [Google Scholar] [CrossRef]
- Roberts, R.G.; Galbraith, R.F.; Yoshida, H.; Laslett, G.M.; Olley, J.M. Distinguishing dose populations in sediment mixtures: A test of single-grain optical dating procedures using mixtures of laboratory-dosed quartz. Radiat. Meas. 2000, 32, 459–465. [Google Scholar] [CrossRef]
- Roberts, R.G.; Flannery, T.F.; Ayliffe, L.K.; Yoshida, H.; Olley, J.M.; Prideaux, G.J.; Laslett, G.M.; Baynes, A.; Smith, M.A.; Jones, R.; et al. New ages for the last Australian megafauna: Continent-wide extinction about 46,000 years ago. Science 2001, 292, 1888–1892. [Google Scholar] [CrossRef] [Green Version]
- Jacobs, Z.; Duller, G.A.T.; Wintle, A.G.; Henshilwood, C.S. Extending the chronology of deposits at Blombos Cave, South Africa, back to 140 ka using optical dating of single and multiple grains of quartz. J. Hum. Evol. 2006, 51, 255–273. [Google Scholar] [CrossRef]
- Feathers, J.; Kipnis, R.; Pilo, L.; Arroyo-Kalin, M.; Coblentz, D. How old is Luzia? Luminescence dating and stratigraphic integrity at Lapa Vermelha, Lagoa Santa, Brazil. Geoarchaeology 2010, 25, 395–436. [Google Scholar] [CrossRef]
- Fu, X.; Cohen, T.J.; Fryirs, K. Single-grain OSL dating of fluvial terraces in the upper Hunter catchment, southeastern Australia. Quat. Geochronol. 2019, 49, 115–122. [Google Scholar] [CrossRef]
- Lamothe, M.; Auclair, M. A solution to anomalous fading and age shortfalls in optical dating of feldspar minerals. Earth Planet. Sci. Lett. 1999, 171, 319–323. [Google Scholar] [CrossRef]
- Lamothe, M.; Auclair, M. The fadia method: A new approach in luminescence dating using the analysis of single feldspar grains. Radiat. Meas. 2000, 32, 433–438. [Google Scholar] [CrossRef]
- Balescu, S.; Lamothe, M.; Auclair, M.; Shilts, W.W. IRSL dating of Middle Pleistocene interglacial sediments from southern Quebec (Canada) using multiple and single grain aliquots. Quat. Sci. Rev. 2001, 20, 821–824. [Google Scholar] [CrossRef]
- Li, B.; Li, S.H.; Duller, G.A.T.; Wintle, A.G. Infrared stimulated luminescence measurements of single grains of K-rich feldspar for isochron dating. Quat. Geochronol. 2011, 6, 71–81. [Google Scholar] [CrossRef] [Green Version]
- Neudorf, C.M.; Roberts, R.G.; Jacobs, Z. Sources of overdispersion in a K-rich feldspar sample from north-central India: Insights from De, K content and IRSL age distributions for individual grains. Radiat. Meas. 2012, 47, 696–702. [Google Scholar] [CrossRef]
- Trauerstein, M.; Lowick, S.; Preusser, F.; Rufer, D.; Schlunegger, F. Exploring fading in single grain feldspar IRSL measurements. Quat. Geochronol. 2012, 10, 327–333. [Google Scholar] [CrossRef]
- Feathers, J.; Tunnicliffe, J. Effect of single-grain versus multi-grain aliquots in determining age for K-feldspars from southwestern British Columbia. Anc. TL 2011, 29, 53–58. [Google Scholar]
- Reimann, T.; Thomsen, K.J.; Jain, M.; Murray, A.S.; Frechen, M. Single-grain dating of young sediments using the pIRIR signal from feldspar. Quat. Geochronol. 2012, 11, 28–41. [Google Scholar] [CrossRef]
- Van Gorp, W.; Veldkamp, A.; Temme, A.J.A.M.; Maddy, D.; Demir, T.; van der Schriek, T.; Reimann, T.; Wallinga, J.; Wijbrans, J.; Schoorl, J.M. Fluvial response to Holocene volcanic damming and breaching in the Gediz and Geren rivers, western Turkey. Geomorphology 2013, 201, 430–448. [Google Scholar] [CrossRef]
- Trauerstein, M.; Lowick, S.E.; Preusser, F.; Schlunegger, F. Small aliquot and single grain IRSL and post-IR IRSL dating of fluvial and alluvial sediments from the Pativilca valley, Peru. Quat. Geochronol. 2014, 22, 163–174. [Google Scholar] [CrossRef]
- Brown, N.D.; Rhodes, E.J.; Antinao, J.L.; McDonald, E.V. Single-grain post-IR IRSL signals of K-feldspars from alluvial fan deposits in Baja California Sur, Mexico. Quat. Int. 2015, 362, 132–138. [Google Scholar] [CrossRef] [Green Version]
- Rhodes, E.J. Dating sediments using potassium feldspar single-grain IRSL: Initial methodological considerations. Quat. Int. 2015, 362, 14–22. [Google Scholar] [CrossRef] [Green Version]
- Gliganic, L.A.; Cohen, T.J.; Meyer, M.; Molenaar, A. Variations in luminescence properties of quartz and feldspar from modern fluvial sediments in three rivers. Quat. Geochronol. 2017, 41, 70–82. [Google Scholar] [CrossRef]
- Reimann, T.; Roman-Sanchez, A.; Vanwalleghem, T.; Wallinga, J. Getting a grip on soil reworking—Single-grain feldspar luminescence as a novel tool to quantify soil reworking rates. Quat. Geochronol. 2017, 42, 1–14. [Google Scholar] [CrossRef]
- Brill, D.; Reimann, T.; Wallinga, J.; May, S.M.; Engel, M.; Riedesel, S.; Bruckner, H. Testing the accuracy of feldspar single grains to date late Holocene cyclone and tsunami deposits. Quat. Geochronol. 2018, 48, 91–103. [Google Scholar] [CrossRef] [Green Version]
- Riedesel, S.; Brill, D.; Roberts, H.M.; Duller, G.A.T.; Garrett, E.; Zander, A.M.; King, G.E.; Tamura, T.; Burow, C.; Cunningham, A.; et al. Single-grain feldspar luminescence chronology of historical extreme wave event deposits recorded in a coastal lowland, Pacific coast of central Japan. Quat. Geochronol. 2018, 45, 37–49. [Google Scholar] [CrossRef] [Green Version]
- Schaarschmidt, M.; Fu, X.; Li, B.; Marwick, B.; Khaing, K.; Douka, K.; Roberts, R.G. pIRIR and IR-RF dating of archaeological deposits at Badahlin and Gu Myaung Caves—First luminescence ages for Myanmar. Quat. Geochronol. 2019, 49, 262–270. [Google Scholar] [CrossRef] [Green Version]
- Smedley, R.K.; Buylaert, J.P.; Ujvari, G. Comparing the accuracy and precision of luminescence ages for partially-bleached sediments using single grains of K-feldspar and quartz. Quat. Geochronol. 2019, 53, 101007. [Google Scholar] [CrossRef]
- Guo, Y.; Li, B.; Zhao, H. Comparison of single-aliquot and single-grain MET-pIRIR De results for potassium feldspar samples from the Nihewan Basin, northen China. Quat. Geochronol. 2020, 56, 101040. [Google Scholar] [CrossRef]
Figure 1.
De versus IR stimulation temperature in the MET-pIRIR protocol. The sample used is 14LC-11.0, from the top of the L2 layer (second loess layer, corresponding to Marine Isotope Stage 6) in the Luochuan section, Chinese Loess Plateau (Zhang et al. [72]). Four aliquots were measured. The error bar of the average is the standard error calculated from four aliquots.

Figure 2.
Characteristic saturation dose (D0) of the pIRIR signals versus the test dose (Dt), with the SAR protocol. Data are from Table 2. A general positive relationship exists between D0 and Dt. Please note that the pIRIR signals in this graph includes different kinds of signals, such as pIRIR50, 170, pIRIR50, 225, pIRIR50, 290, MET-pIRIR250/300 signals. So the D0 is scattered even with the same Dt.

Figure 3.
Comparison of De values obtained by the conventional SAR protocol (Li and Li [63]) and the modified ‘MAR with heat’ protocol (Li et al. [62]), with a six-step IR stimulation from 50 °C to 300 °C. (A) Sample 14LC-16.0 is from the base of the L2 layer (second loess layer, MIS 6) in the Luochuan section, Chinese Loess Plateau. The higher degree of SAR De underestimation compared to MAR De at low IR stimulation temperatures is due to the failure of sensitivity correction. Note that the De values are still consistent between the SAR and MAR protocols at higher IR stimulation temperatures (250 °C and 300 °C). (B) Sample B-610 is from the Jingbian section of Chinese Loess Plateau. Note that the SAR De values are still underestimated at high IR stimulation temperatures compared to the MAR De values, because De is already larger than 800 Gy. Figure 3B is modified from Zhang et al. [85].


Table 1.
Different pIRIR protocols: pIRIR50, 225; pIRIR50, 180; pIRIR50, 290; pIRIR200, 290; MET-pIRIR; ‘SAR with solar’; ‘MAR with heat’.
Table 1.
Different pIRIR protocols: pIRIR50, 225; pIRIR50, 180; pIRIR50, 290; pIRIR200, 290; MET-pIRIR; ‘SAR with solar’; ‘MAR with heat’.
| Step | pIRIR50,225 | pIRIR50, 180 | pIRIR50, 290 | pIRIR200, 290 | MET-pIRIR | ‘SAR with Solar’ | ‘MAR with Heat’ |
|---|---|---|---|---|---|---|---|
| Buylaert et al. [37] | Reimann et al. [27] | Thiel et al. [38] | Li and Li [60] | Li and Li [26] | Li et al. [61] | Li et al. [62], Modified | |
| 1 * | Regenerative dose, Di | Regenerative dose, Di | Regenerative dose, Di | Regenerative dose, Di | Regenerative dose, Di | Regenerative dose, Di | Regenerative dose, Di |
| 2 | Preheat at 250 °C for 60 s | Preheat at 200 °C for 60 s | Preheat at 320 °C for 60 s | Preheat at 320 °C for 60 s | Preheat at 300 °C for 10 s | Preheat at 300 °C for 60 s | Preheat at 320 °C for 60 s |
| 3 | IR for 100 s at 50 °C | IR for 100 s at 50 °C | IR for 200 s at 50 °C | IR for 200 s at 200 °C | IR for 100 s at 50 °C | IR for 100 s at 50 °C | IR for 100 s at 50 °C |
| 4 | IR for 100 s at 225 °C | IR for 100 s at 180 °C | IR for 200 s at 290 °C | IR for 200 s at 290 °C | IR for 100 s at 100 °C | IR for 100 s at 100 °C | IR for 100 s at 100 °C |
| 5 | Test dose, Dt | Test dose, Dt | Test dose, Dt | Test dose, Dt | IR for 100 s at 150 °C | IR for 100 s at 150 °C | IR for 100 s at 150 °C |
| 6 | Preheat at 250 °C for 60 s | Preheat at 200 °C for 60 s | Preheat at 320 °C for 60 s | Preheat at 320 °C for 60 s | IR for 100 s at 200 °C | IR for 100 s at 200 °C | IR for 100 s at 200 °C |
| 7 | IR for 100 s at 50 °C | IR for 100 s at 50 °C | IR for 200 s at 50 °C | IR for 200 s at 200 °C | IR for 100 s at 250 °C | IR for 100 s at 250 °C | IR for 100 s at 250 °C |
| 8 | IR for 100 s at 225 °C | IR for 100 s at 180 °C | IR for 200 s at 290 °C | IR for 200 s at 290 °C | Test dose, Dt | Test dose, Dt | IR for 100 s at 300 °C |
| 9 | IR at 290 °C for 40 s | Return to step 1 | IR at 325 °C for 100 s | IR at 325 °C for 100 s | Preheat at 300 °C for 10 s | Preheat at 300 °C for 60 s | Cutheat to 500 °C |
| 10 | Return to step 1 | Return to step 1 | Return to step 1 | IR for 100 s at 50 °C | IR for 100 s at 50 °C | Test dose, Dt | |
| 11 | IR for 100 s at 100 °C | IR for 100 s at 100 °C | Preheat at 320 °C for 60 s | ||||
| 12 | IR for 100 s at 150 °C | IR for 100 s at 150 °C | IR for 100 s at 50 °C | ||||
| 13 | IR for 100 s at 200 °C | IR for 100 s at 200 °C | IR for 100 s at 100 °C | ||||
| 14 | IR for 100 s at 250 °C | IR for 100 s at 250 °C | IR for 100 s at 150 °C | ||||
| 15 | IR at 320 °C for 100 s | Solar simulator for 2 h | IR for 100 s at 200 °C | ||||
| 16 | Return to step 1 | Return to step 1 | IR for 100 s at 250 °C | ||||
| 17 | IR for 100 s at 300 °C |
* For SAR protocols, in the first cycle, i = 0 and D0 = 0, and the natural signal is measured. The sequence is run with several regenerative doses including a zero dose and a repeat dose, to build the growth curve.
Table 2.
Characteristic saturation dose (D0) of the growth curves from the conventional SAR protocol with different pIRIR signals.
Table 2.
Characteristic saturation dose (D0) of the growth curves from the conventional SAR protocol with different pIRIR signals.
| Signal | D0 (Gy) | Test Dose (Gy) | Reference |
|---|---|---|---|
| pIRIR50, 295 | 204 ± 5 | 12 | Qin and Zhou [79] |
| 286 ± 24 | 84 | ||
| pIRIR50, 290 | 203 | 4 | Liu et al. [81] |
| 320 | 53 | ||
| 424 | 595 | ||
| pIRIR50, 225 | 159 ± 87 | 5 | Colarossi et al. [80] |
| 455 | 60 | ||
| 435 | 120 | ||
| 526 | 200 | ||
| 556 ± 66 | 320 | ||
| pIRIR50, 290 | 290 | 32 | Qin et al. [84] |
| 349 | 213 | ||
| pIRIR50, 225 | 367 | 32 | |
| 433 | 213 | ||
| pIRIR50, 170 | 404 | 32 | |
| 484 | 213 | ||
| MET-pIRIR250 | 327 ± 16 | 54 | Li and Li [63] |
| MET-pIRIR300 | 250 ± 12 | 54 | |
| MET-pIRIR250 | 324 ± 5 | 72.5 | Zhang and Li [78] |
| 417 ± 9 | 145 | ||
| MET-pIRIR300 | 396 ± 13 | 300 | Zhang et al. [85] |
© 2020 by the authors. Licensee MDPI, Basel, Switzerland. This article is an open access article distributed under the terms and conditions of the Creative Commons Attribution (CC BY) license (http://creativecommons.org/licenses/by/4.0/).
Share and Cite
MDPI and ACS Style
Zhang, J.; Li, S.-H. Review of the Post-IR IRSL Dating Protocols of K-Feldspar. Methods Protoc. 2020, 3, 7. https://doi.org/10.3390/mps3010007
AMA Style
Zhang J, Li S-H. Review of the Post-IR IRSL Dating Protocols of K-Feldspar. Methods and Protocols. 2020; 3(1):7. https://doi.org/10.3390/mps3010007
Chicago/Turabian StyleZhang, Junjie, and Sheng-Hua Li. 2020. "Review of the Post-IR IRSL Dating Protocols of K-Feldspar" Methods and Protocols 3, no. 1: 7. https://doi.org/10.3390/mps3010007