
YOLO-PAM: Parasite-Attention-Based Model for Efficient Malaria Detection


Department of Mathematics and Computer Science, University of Cagliari, Via Ospedale 72, 09124 Cagliari, Italy
*
Authors to whom correspondence should be addressed.
J. Imaging 2023, 9(12), 266; https://doi.org/10.3390/jimaging9120266
Submission received: 20 October 2023
/
Revised: 14 November 2023
/
Accepted: 24 November 2023
/
Published: 30 November 2023
(This article belongs to the Section Medical Imaging)
Abstract
:Malaria is a potentially fatal infectious disease caused by the Plasmodium parasite. The mortality rate can be significantly reduced if the condition is diagnosed and treated early. However, in many underdeveloped countries, the detection of malaria parasites from blood smears is still performed manually by experienced hematologists. This process is time-consuming and error-prone. In recent years, deep-learning-based object-detection methods have shown promising results in automating this task, which is critical to ensure diagnosis and treatment in the shortest possible time. In this paper, we propose a novel Transformer- and attention-based object-detection architecture designed to detect malaria parasites with high efficiency and precision, focusing on detecting several parasite sizes. The proposed method was tested on two public datasets, namely MP-IDB and IML. The evaluation results demonstrated a mean average precision exceeding 83.6% on distinct Plasmodium species within MP-IDB and reaching nearly 60% on IML. These findings underscore the effectiveness of our proposed architecture in automating malaria parasite detection, offering a potential breakthrough in expediting diagnosis and treatment processes.
1. Introduction
Malaria, a widespread disease, is induced by the Plasmodium parasite and is transmitted to humans via bites from infected female Anopheles mosquitoes. In the year 2019, there were approximately 229 million reported cases of malaria globally, leading to 409,000 fatalities. Significantly, 94% of both malaria cases and associated deaths were concentrated in Africa, with children below the age of five identified as the most-susceptible demographic, constituting 67% of the total malaria-related deaths worldwide.
Although methods for the clinical diagnosis of malaria, such as molecular diagnostics with Real-Time Polymerase Chain Reaction (RT-PCR) [1], have been proposed in recent years, microscopy is the most-appropriate method for the detection of malaria in the field [2] and for blood diseases or infections in general. They are detected through the analysis of blood cells using peripheral blood slides under a light microscope. Thus, in addition to the diagnosis of malaria infection [3,4,5], some examples include the detection of leukemia [6,7,8,9] or the counting of blood cells [10,11,12,13,14].
Malaria, a disease caused by parasites belonging to the genus Plasmodium, manifests in humans through the invasion of Red Blood Cells (RBCs). Transmission occurs via the bites of infected female Anopheles mosquitoes, commonly known as “malaria vectors”. There are five main types of parasites responsible for human malaria: P. falciparum (P.f.), P. vivax (P.v.), P. ovale (P.o.), P. malariae (P.m.), and P. knowlesi (P.k.), with the first two posing the greatest threat [15,16].
The life stages of these parasites within the human host include the ring, trophozoite, schizont, and gametocyte phases. Human malaria, as defined by the World Health Organization (WHO), is considered a preventable and treatable condition if diagnosed promptly. Failure to address the disease promptly may lead to severe complications such as disseminated intravascular thrombosis, tissue necrosis, and splenic hypertrophy [16,17,18,19].
Nevertheless, the symptoms induced by malaria often closely resemble those associated with diseases such as viral hepatitis, dengue fever, and leptospirosis, thereby complicating the diagnostic process [2,20]. Several diagnostic methods have been developed to overcome this problem. Nevertheless, the currently available diagnostic tools often neglect or fail to distinguish between non-falciparum types [2]. In addition, several factors complicate the identification of these species. For example, parasitemia is typically very low in P.v.- and P.m.-infected individuals [21]; P.v. and P.o. are characterized by the slow development of some of their sporozoites (early stage of schizonts), forming hypnozoites, which are difficult to detect [22]. Infections with non-falciparum species are often asymptomatic, which makes their detection even more difficult because infected people do not seek treatment at a health facility due to the lack of symptoms. These reasons include the need to keep infectious diseases under control, especially in underdeveloped countries with no medical centers nearby or capable of handling many patients [16].
Manual microscopy of Peripheral Blood Smears (PBSs) has several advantages for malaria diagnosis, including low cost, portability, specificity, and sensitivity [23]. However, there are many problems associated with this method. Examples include technical skills in slide preparation; lysis of red blood cells and related changes in parasite morphology (leading to errors in species identification); quality and illumination of the microscope; the staining procedure; the competence and care of the microscopist; and finally, the level of parasitemia [2].
Moreover, the manual process is typically laborious and time-intensive, and incorrect diagnoses may result in unwarranted drug administration, with potential exposure to associated side effects or severe disease progression.
Further problems for this type of analysis are caused by the fact that, in many cases, only microscopy or rapid tests are available as diagnostic tools. Several pieces of research have shown consistent errors in Plasmodium species identification by microscopists, such as missed P.o. infections with low parasite densities, P.f.-infected specimens misidentified as P.m., and P.o. slides misidentified as P.v., which could lead to ineffective treatment administration and increase the risk of severe malaria. Furthermore, it is common to fail to distinguish early trophozoites of P.v. from those of P.f., especially when parasitemia is low, as well as P.m. from other Plasmodium species using a microscopic method [24]. The similar morphologies of the malaria species can also lead to mixed infections, mostly misdiagnosed [2]. These events can also lead to a worsening of the clinical picture.
Accurate and timely malaria diagnosis is crucial for effective treatment and preventing severe complications. While traditional methods like microscopy remain the gold standard, recent developments in deep learning, specifically deep Convolutional Neural Networks (CNNs), have shown promising results in malaria cell image analysis.
Several studies have explored the application of deep CNNs in malaria diagnosis at the single-cell level, emphasizing the importance of accurately identifying whether a cell is infected with the malaria parasite [25,26,27,28,29,30].
Despite the advances produced by these methods, the use of datasets composed of images presenting monocentric cells represents an overly ideal scenario in which salient and highly discriminating features can be extracted from the images. Of course, this is valid under the assumption that pathologists take crops manually or that detection systems provide perfect crops. However, this assumption is not verified in real-world application scenarios because the systems are fully automated, and therefore, the crops cannot always be accurate or perfectly centered [31,32,33,34,35].
Other challenges exist, such as discriminating between different Plasmodium species and managing the complexities associated with low parasitemia levels and asymptomatic infections. Consequently, the exact localization of parasites within cells, obtained through precise bounding box detection, could offer valuable insights for in-depth studies and detailed diagnosis [5,36,37]. Therefore, integrating deep learning techniques with object detection capabilities becomes essential in this context. This integration allows accurate classification of infected cells and precise localization of parasites within these cells, providing comprehensive information for detailed analysis and diagnosis.
The challenges expressed motivated this work. Its objective was to devise a methodology named the Parasite Attention Module (PAM), which was seamlessly incorporated into the You Only Look Once (YOLO) architecture. This methodology was designed to automatically detect malaria parasites, addressing the limitations associated with the prevailing gold-standard microscopy technique. Specifically, the main contributions of this research are summarized as follows: (i) the development of a novel Transformer- and attention-based object-detection architecture based on the latest version of YOLO for malaria parasite detection; (ii) the investigation and extension of the proposal to the four different species for mixed or intra-species detection; (iii) the evaluation of two different datasets, including intra-dataset experimentations, based on the different species.
The rest of this article is organized as follows. First, the related work is presented in Section 2, and then, the materials and methods are described in Section 3. The proposed architecture is described in Section 4, while the experiments and results are presented in Section 5, along with a discussion of every investigation. Finally, the conclusions are drawn in Section 6.
2. Literature Review
In recent years, the field of computer vision has proposed various Computer-Aided Diagnosis (CAD) solutions aimed at automating the detection of malaria parasites. These endeavors seek to alleviate the challenges associated with manual analysis, offering a more-reliable and standardized interpretation of blood samples. This automation, in turn, can potentially mitigate diagnostic costs [37,38].
Before the emergence of deep learning techniques, malaria parasite detection in images relied on classical methods involving multiple steps: image preprocessing, object detection or segmentation, feature extraction, and classification. Techniques like mathematical morphology for preprocessing and segmentation [31,32], along with handcrafted features [33,34], have been used to train machine learning classifiers. The landscape of computer vision approaches for malaria parasite detection underwent a significant transformation with the introduction of AlexNet’s Convolutional Neural Network (CNN) [39], marking a paradigm shift.
Various deep learning approaches have been proposed as alternatives to classical methods for this task, as evidenced by numerous studies published in the last decade [5,25,30,36,37,40].
In the context of deep learning approaches, existing works on malaria can be divided into two categories. Works that perform classification on images containing single cells aim to identify the most-appropriate classifier to discriminate between parasitized and healthy cells by proposing custom CNN architectures or using off-the-shelf CNNs [25,26,27,28,29,30,41]. Additionally, Rajaraman et al. explored the performance of deep neural ensembles [30]. These methods typically use the NIH [29] dataset as a reference. More recently, Sengar et al.examined the use of vision Transformers on the same dataset [42].
On the other hand, works proposing full pipelines typically propose parasite detection from whole images and rely on several existing datasets, such as BBC041 [36], MP-IDB [43,44], IML [40], or M5 [37].
Arshad et al. proposed a dataset containing P. vivax malaria species in four life cycle stages. The authors presented a deep-learning-based life cycle stage classification, where the ResNet-50v2 network was selected for single-stage multi-class classification [40].
Sultani et al. collected a new malaria image dataset with multiple microscopes and magnifications using thin-blood smear slides. They obtained two variations of the dataset, one from Low-Cost Microscopes (LCMs) and another from High-Cost Microscopes (HCMs), aiming to replicate the challenges associated with real-world image acquisition in resource-limited environments. To address the malaria detection task, the authors used several object detectors. In addition, they also discussed the issue of microscope domain adaptation tasks and tested some off-the-shelf domain adaptation methods. The optimal performance emerged through the application of ranking combined with triplet loss, with the HCM serving as the source domain and the LCM as the target domain [37].
Since malaria parasites consistently target erythrocytes, automated malaria detection systems must analyze these cells to determine infection and classify the associated life stages. Existing literature only addresses the classification problem without considering the detection problem. Additionally, considerable emphasis has been placed on developing mobile devices to facilitate cost-effective and rapid malaria diagnosis, particularly in underdeveloped regions where access to more-expensive laboratory facilities is limited [34].
Regarding dataset utilization, some studies have employed the same datasets as utilized in this investigation. As of the current writing, a limited number of studies have used MP-IDB [5,44,45], whereas IML has only been utilized by its proposers [40]. Maity et al. implemented a semantic segmentation technique followed by the application of a Capsule Network (CapsNet) for the categorization of P.f. rings [5], whereas Rahman et al. conducted a comparative evaluation involving various off-the-shelf networks for binary classification purposes [45].
The principal distinctions between our study and the existing state-of-the-art methodologies stem from deploying a detector with a dual objective: identifying distinct types of malaria-infected RBCs and discriminating various life stages within a unified framework.
Compared to the works defined so far, this work aimed to provide a lightweight and effective method to detect malaria parasites of any species and life stage.
3. Materials and Methods
This section presents the materials and methods used in this study. Specifically, Section 3.1 gives an overview of the employed datasets. Then, Section 3.2 describes object detection with a specific focus on the YOLO family. Section 3.3 explains the modules composing the proposed architecture’s structure, and finally, Section 3.4 presents the metrics adopted to evaluate the experimental results.
3.1. Datasets
MP-IDB [4] comprises 210 images encompassing four distinct species of malaria parasites. The distribution is as follows: 104 images for P. falciparum, 37 for P. malariae, 29 for P. ovale, and 40 for P. vivax. Each parasite species exhibits four distinct life stages, namely ring, trophozoite, schizont, and gametocyte. Each image is accompanied by its associated ground truth, indicating the presence of one or more life stages. The entire dataset was captured at a resolution of px with a color depth of 24 bit.
IML [40] contains images of blood samples taken with a camera mounted on an XSZ-107 series microscope at a magnification. The dataset contains 345 images with an average of 111 blood cells. Only P. vivax is represented.
Sample images from both datasets are presented in Figure 1.
3.2. Object Detectors
Modern detectors are based on deep learning methods and are divided into two categories: one-stage and two-stage. Two-stage architectures, such as Faster R-CNN [46], first extract Regions Of Interest (ROIs) and, then, perform classification and bounding box regression in a coarse-to-fine process. In contrast, one-stage detectors, including the SSD [47], FPN [48], and YOLO family [49,50,51,52], produce bounding boxes and classes directly from predicted feature maps with predefined anchors.
One-stage detectors are faster and more compact, making them more suitable for time-critical applications and computationally constrained edge devices [53,54].
Recently, the success of Transformers in image recognition has led to the development of several end-to-end Detection Transformers (DETRs). Despite their high recognition accuracy, DETRs are hampered by their complex architectures and slow convergence problems [53].
To overcome these limitations, in this paper, we propose a modified version of the one-stage detector YOLOv8 to be efficient and accurate, especially on small parasite objects.
YOLO
Instead of the traditional two-step approach based on a region-selection method, the YOLO family of detectors uses an end-to-end differentiable network that integrates bounding box estimation and object identification. YOLO divides the input image into constant-size grids, and a CNN predicts the bounding boxes and classes for each grid. If the confidence of a bounding box is above a certain threshold, it is selected to locate the object in the image. The CNN performs only one pass to make predictions and, after non-maximum suppression, produces known objects and their bounding boxes, ensuring that each object is detected only once.
YOLOv8 is a family of architectures and models for object detection pre-trained on the Common Object in Context (COCO) dataset [55].
This family comprises five distinct models that share a common architecture, but diverge in breadth, depth, and the number of trainable parameters. The models denoted as YOLOv8n (nano), YOLOv8s (small), YOLOv8m (medium), YOLOv8l (large), and YOLOv8x (extra-large), are each pre-trained on images with resolutions of either or px. Notably, in terms of trainable parameters, YOLOv8n encompasses 3.2 million, YOLOv8s 11.2 million, YOLOv8m 25.9 million, YOLOv8l 43.7 million, and YOLOv8x 68.2 million.
The YOLOv8 architecture is composed of three integral components, similar to other single-stage object detectors, namely the backbone, neck, and prediction head.
The backbone is a pre-trained network specialized in extracting features from the input image. This process involves reducing the spatial resolution of the image while concurrently increasing the resolution of the extracted features.
The neck component combines the extracted features and generates three distinct scales of feature maps, commonly referred to as feature pyramids. This design enhances the model’s ability to generalize effectively to objects of varying sizes and scales.
Subsequently, the prediction head employs anchor boxes on the feature maps, facilitating the detection of objects based on the previously generated feature maps.
Similarly to YOLOv5, the YOLOv8 architecture uses the CSPDarknet53 architecture with a Spatial Pyramid Pooling (SPP) layer [56] as the backbone, uses the Path Aggregation Network (PANet) [57] as the neck, and the YOLO detection head [49].
Despite the significant improvement in detection speed, it is a well-known fact that YOLO architectures struggle to detect small objects, compared to two-stage detectors [49,54]. This particular problem was addressed as one of the objectives of this paper. In fact, the considered scenario included cases where small parasites appear. The smallest ones, i.e., the smallest rings, are sometimes not large enough to be considered by a generic detector.
3.3. Core Modules and Mechanisms
In this section, we review the several key components and state-of-the-art mechanisms adopted in order to enhance the existing baseline architecture. To better visualize the relationships and hierarchy discernible among these components, we provide a schematic representation in Figure 2.
3.3.1. Attention Mechanisms
The concept of attention, a vital cognitive function in human perception, involves selectively focusing on the salient parts of a scene, enabling efficient processing of visual information [58]. This ability allows humans to filter relevant information with limited computational resources, enhancing both efficiency and accuracy in perception [59].
In recent years, attention mechanisms have found applications in various computer science domains, including natural language processing and Computer Vision (CV) [59]. In these contexts, attention acts as a technique to emphasize specific parts of input data when generating output, essentially assigning importance weights to different input features.
In the realm of object detection, attention mechanisms guide the model’s focus toward image regions likely to contain relevant objects. This selective attention significantly enhances object detection accuracy by reducing irrelevant information processed by the model. An approach in computer vision involves utilizing CNNs with attention modules [60]. These modules consist of learnable weights that prioritize different regions of the input image. Through training, the model adapts these weights, learning to concentrate on crucial image regions for a given task.
With regard to CV tasks, attention mechanisms can be broadly classified into channel, spatial, temporal, branch, channel and spatial, and spatial and temporal attention [61]. For the purpose of this work, we provide a concise definition of the channel and spatial attention mechanisms. On the one hand, channel attention dynamically modifies the importance of each channel, resembling the selection of specific objects and, thus, determining what deserves attention. This adjustment follows the concept that, in deep neural networks, distinct channels within various feature maps typically signify separate objects [61]. Hu et al. [62] introduced channel attention and proposed SENet for this task.
On the other hand, spatial attention involves creating an attention mask that spans various spatial domains within an image. This mask is generated to highlight essential regions. These highlighted regions are either selected directly as important spatial areas based on the generated attention mask or the attention mechanism predicts the most-relevant spatial positions directly [61]. This process enables deep learning models to focus on specific parts of an image, improving their ability to recognize objects and understand the context within complex visual data.
3.3.2. Convolutional Block Attention Module (CBAM)
To enhance informative channels and important regions of CNNs, Woo et al. [58] proposed the Convolutional Block Attention Module (CBAM). It sequentially stacks channel and spatial attention modules, which decouple the channel and spatial attention maps for computational efficiency. Additionally, CBAM leverages spatial global information by introducing global pooling.
CBAM has two sequential sub-modules, channel and spatial. Given an input feature map , CBAM sequentially infers a 1D channel attention vector and a 2D spatial attention map .
The channel attention module learns to weigh the importance of different channels in a feature map based on their relevance. In contrast, the spatial attention module understands to selectively emphasize important spatial regions of the feature map. This combination permits the highlighting of proper channels and enhancing informative local regions.
CBAM can also be represented in the notation expressed by Equation (1):
where denotes a global average pooling operation that aggregates the spatial dimensions of the feature map, MLP denotes a two-layer feedforward network with ReLU activations, and represents the sigmoid activation function.
The spatial attention module operates on the feature map X and the channel attention weights . It first computes a set of spatial attention weights by passing the feature map through a convolutional layer with a sigmoid activation function, as shown in Equation (2):
where ⊗ denotes elementwise multiplication, Conv denotes a convolutional layer, and is as defined above. The spatial attention weights are then used to modulate the feature map as follows (defined in Equation (3)):
where Y denotes the output feature map.
3.3.3. Normalized Attention Module
The Normalized Attention Module (NAM), proposed for neural networks, represents a lightweight and efficient attention mechanism. This module combines the channel and spatial attention mechanisms into a unified module, utilizing the batch normalization scaling factor to measure the importance of both channels and pixel regions [63].
This module can be described by the following notation:
where and are scaling factors, is a batch normalization module, and , are the input feature maps.
3.3.4. Swin Transformer
This is one of the most-recent Vision Transformer architectures, which has shown impressive results in object detection tasks [64] and is the current state-of-the-art on the COCO test–dev dataset. The core idea of the Swin Transformer is to use hierarchical partitioning of image feature maps, allowing for efficient computation and scalability to larger input resolutions. In particular, the Swin Transformer Block replaces the standard self-attention mechanism with a shifted window-based self-attention. This allows the attention mechanism to be computed more efficiently, as the computational complexity is reduced from quadratic to linear with respect to the input resolution. Additionally, the Swin Transformer Block introduces a hierarchical structure, which allows for multi-scale feature representation, which is critical for capturing information at different levels of abstraction in an image.
3.3.5. C2f and C3 Modules
The C2f and C3 modules are core modules of the YOLO architecture. On the one hand, the C3 module belongs to the YOLOv5 architecture and is one of its core architectural Blocks. It basically indicates a CSP Bottleneck with three convolutions. On the other hand, the C2f module belongs to the YOLOv8 architecture and serves as an architectural upgrade, replacing the C3 module. The C2f module is faster and lighter, which is achieved by using a lower number of convolutional filters. It is a CSP Bottleneck with two convolutions.
3.3.6. C2f
The C2f module consists of a convolution layer called , which reduces the input channels to twice the hidden channels, and a convolution layer called , which reduces the input channels to the desired output channels. It also includes a sequence of Bottleneck Blocks for further processing. The forward pass involves applying to the input tensor x, splitting the output into two parts, processing them through the Bottleneck Blocks, and finally, concatenating the outputs and passing them through to obtain the final output.
3.3.7. C3
The C3 module is similar to C2f, but with an additional 1 × 1 convolution layer called . It includes a convolution layer , another , and a convolution layer called for reducing the concatenated input channels to the desired output channels. The forward pass involves applying and to the input tensor separately, concatenating the outputs, processing them through the Bottleneck Blocks, and passing the result through to obtain the final output.
3.3.8. C3 Swin Transformer Block
This is a C3 module with a Swin Transformer Block in place of the Bottleneck component. Some works, such as [65], have added the Swin Transformer Block to the YOLOv5 architecture, while we included the C3 Swin Transformer Block (C3STR) module within our architectures.
3.4. Metrics
The assessment of object-detection methods often involves the use of the mean average precision metric and its variations, as described in COCO [55]. Precision is calculated based on the concept of the Intersection over Union (IoU), which measures the accuracy of detection by comparing the overlapping area between the predicted bounding box and the actual object to the total combined area.
To determine the accuracy of detection results, a specific threshold is set for the IoU. If the IoU exceeds this threshold, the detection is considered accurate and classified as a True Positive (TP). On the other hand, if the IoU falls below the threshold, the detection is labeled as a False Positive (FP). Additionally, if the model fails to detect an object that exists in the ground truth, it is referred to as a False Negative (FN).
Experimental evaluations were conducted using five variations of the mean average precision metric:
- AP was evaluated with 10 different IoUs varying in a range of 50% to 95% with steps of 5%;
- AP was evaluated with a single value o the IoU corresponding to 50%;
- AP is the AP determined for small objects (with area px);
- AP is the AP determined for medium objects (with area px);
- AP is the AP determined for large objects (with area px).
4. The Proposed Network: YOLO-PAM
In addition to proposing an efficient and precise malaria-parasite-detection system, this study aimed to overcome the limitations of existing state-of-the-art methods. Our objective was threefold: First was to achieve the speed and compactness typical of one-stage detectors while maintaining high accuracy without the need for a secondary stage, i.e., the classification stage. Second, we integrated Transformer models, steering clear of an end-to-end DETR framework to avoid excessive complexity and sluggish convergence. Last, we tackled the detection of the parasites of varying the sizes, from small to large, within a unified system, eliminating the need for an additional specialized subsystem.
Our methodology primarily focused on enhancing the efficiency and accuracy of the medium-sized one-stage detector, YOLOv5m6. Selected for its characteristics, this model comprised 35.7 million trainable parameters and was pre-trained on images sized at pixels. Modifying its final layer equipped it to effectively detect all four phases of the malaria life cycle. This model balances network depth and parameter count, making it highly suitable for low-end computational resources and mobile devices [66].
Our proposed YOLO-PAM model aimed for a lighter approach compared to YOLOv5m6. To achieve this, we adopted the same fundamental concepts of YOLOv5m6 for the YOLOv8m architecture. We also reduced the model’s width to 3/4 of its original, resulting in fewer filters used and enabling faster training and inference. The architectural proposal is illustrated in Figure 3.
A key contribution involved strategically integrating multiple CBAM attention modules within vital components of the baseline architecture, such as the backbone and neck, influencing the prediction heads. This enhancement builds upon prior research [58], demonstrating the efficacy of these modules in improving classification and detection tasks. We made specific modifications to the original YOLOv8 architecture:
- 1.
- We excluded prediction heads designed for large objects, retaining those tailored for medium-sized ones. This decision aimed to prevent unnecessary computational overhead associated with handling excessively large objects and directed the architectural focus towards the precise dimensions of the objects in the images, specifically those of small and medium size in terms of pixel count.
- 2.
- Moreover, an additional head was incorporated to use features from the lower layers of the model’s backbone. These layers offer less-refined features, but possess higher resolution, a critical aspect for the precise detection of smaller objects, for example. Leveraging lower backbone layers allows the extraction of high-resolution features, essential for discriminating objects occupying minimal pixels. Higher layers excel in discerning medium-sized objects, but might lose the details of smaller objects due to the reduced feature map resolution caused by the convolution.
- 3.
- A further contribution entailed the integration of features extracted from the C3STR layers with those acquired from the C3 layers immediately followed by the CBAM layers. Subsequently, a NAM module was applied to introduce further attention to the resulting feature maps. This procedure endowed the prediction heads with the utmost refined features the model could generate, a detail highlighted by the orange arrows in the schematic representation illustrated in Figure 3.
In contrast to alternative strategies that integrate Transformers and attention mechanisms by substituting the last C3 layer with Transformer Blocks [65,67], our approach diverged significantly. Our objective was to preserve the distinctive locally specialized features intrinsic to CNNs while incorporating global features extracted through vision Transformers. This approach involved merging these two feature types within the model heads, enabling the retention of the nuanced advantages associated with global and local features. In summary, our strategy involved integrating three different attention mechanisms—CBAM, NAM, and C3STR—aiming to leverage their respective advantages.
5. Experimental Results
This section delineates the conducted experimental evaluation, starting with a comprehensive overview of the experimental setup detailed in Section 5.1. Additionally, it provides details regarding dataset splits and the implemented data augmentation, aiming to offer a comprehensive understanding of the experimental design. Subsequent sections are dedicated to specific aspects of the evaluation: Section 5.2 delves into the ablation study, while Section 5.3 and Section 5.4, respectively, present the results on MP-IDB and IML. Furthermore, Section 5.5 furnishes an overview of the qualitative results, and lastly, Section 5.6 undertakes a comparative analysis between our proposed architecture and the state-of-the-art methods.
5.1. Experimental Setup
The experiments were performed on a workstation with the following hardware specifications: an Intel(R) Core(TM) i9-8950HK @ 2.90 GHz CPU, 32 GB RAM, and an NVIDIA GTX1050 Ti GPU with 4 GB memory. We used the PyTorch implementation of YOLOv8 (available at: https://github.com/ultralytics/ultralytics (accessed on 28 November 2023)), developed by the Ultralytics LLC and the YOLOAir’s implementation of C3STR (available at: https://github.com/iscyy/yoloair (accessed on 28 November 2023)). The backbones used were ResNet-50 pretrained on ImageNet with the FPN and Darknet53 for YOLO. All YOLO-based networks were initialized using pre-trained weights on the COCO2017 dataset [55]. Adam served as the optimizer, configured with a learning rate of 0.001 and a momentum of 0.9. Each model underwent training for 100 epochs, employing a batch size of 4.
- Data augmentation: We generated 35 distinct augmented samples from each original sample for every species. This augmentation strategy aimed to enhance the diversity of the training data, address data imbalance issues, bolster the models against potential object rotations, and enable targeted generalization capabilities. We chose a milder augmentation approach due to the vulnerability of certain parasites. Specific augmentation techniques, such as shearing, were observed to have the potential to adversely affect parasites, with notable implications for those of smaller dimensions [44]. Table 2 shows the applied augmentations.
5.2. Ablation Study
Table 3 presents the results of the ablation study conducted on the P.f. split of the MP-IDB dataset, specifically chosen due to its diverse representation of different life stages and the presence of parasites of varying sizes, ranging from small to large. The objective of these experiments was to systematically evaluate the impact of various modifications on the detection performance. Four different configurations were tested: The baseline method (YOLOv8m) achieved an AP of 78.9%. When incorporating CBAM alone, the performance improved marginally to 79.6%. By focusing solely on the modifications in the backbone architecture (C3), the AP score increased to 81.2%. The most-substantial improvement was observed when both the CBAM and C3 modifications were integrated (CBAM + C3), resulting in an AP score of 83.6%. This table provides a detailed insight into the effectiveness of each modification. It underscores the significance of the combined enhancements, demonstrating their positive impact on the accuracy of malaria parasite detection.
5.3. Experimental Results on MP-IDB
Table 4 presents a detailed quantitative assessment of malaria parasite detection performance across four species (P.f., P.m., P.o., and P.v.) within MP-IDB. The evaluation employed multiple detection methods: Faster R-CNN, RetinaNet, FCOS, YOLOv8m, and the proposed YOLO-PAM.
Across the P.f. class, YOLO-PAM showcased remarkable performance, achieving an AP of 83.6%, outperforming other methods, including YOLOv8m (78.9%), and demonstrating significant improvements. It also surpassed Zedda et al.’s [44] method by a consistent 3.7% in the AP. In the P.m. category, YOLO-PAM excelled once again, achieving a striking AP of 93.6%, surpassing the baseline YOLOv8m’s AP of 78.8%. Similarly, in the P.o. class, YOLO-PAM achieved an outstanding AP of 94.4%, outclassing YOLOv8m’s AP of 89.7%. In the P.v. category, YOLO-PAM attained an AP of 87.2%, demonstrating superior performance compared to YOLOv8m’s AP of 85.9%.
Notably, YOLO-PAM consistently outperformed other methods across all parasite species, as evidenced by the bolded entries in the table. These numerical results underscore the effectiveness of the proposed YOLO-PAM in malaria parasite detection, emphasizing its accuracy and robustness in identifying parasites of varying sizes within different species.
5.4. Experimental Results on IML
Table 5 provides a detailed analysis of the malaria parasite detection performance across multiple methods within the IML dataset [40].
In the context of the overall AP, YOLO-PAM emerged as the most-effective method, achieving a remarkable AP of 59.9%, outperforming other methods such as the FRCNN (27.9%), RetinaNet (24.2%), FCOS (7.2%), and even the baseline, YOLOv8m (56.2%). YOLO-PAM’s superior performance is further highlighted by its excellent AP score of 91.8%, indicating its ability to accurately detect parasites with a high IoU threshold.
Moreover, regarding specific AP scores, YOLO-PAM excelled across different object scales. It achieved the highest AP (medium-sized objects) at 60.0%, demonstrating its precision in detecting parasites of medium sizes. Additionally, YOLO-PAM achieved a substantial AP (large-sized objects) score of 65.0%, underscoring its capability in accurately identifying larger parasites. These results emphasize YOLO-PAM’s versatility and accuracy across various object sizes, making it a robust and reliable choice for malaria parasite detection tasks within the IML dataset. It is important to note that IML does not provide any small parasites.
5.5. Qualitative Analysis
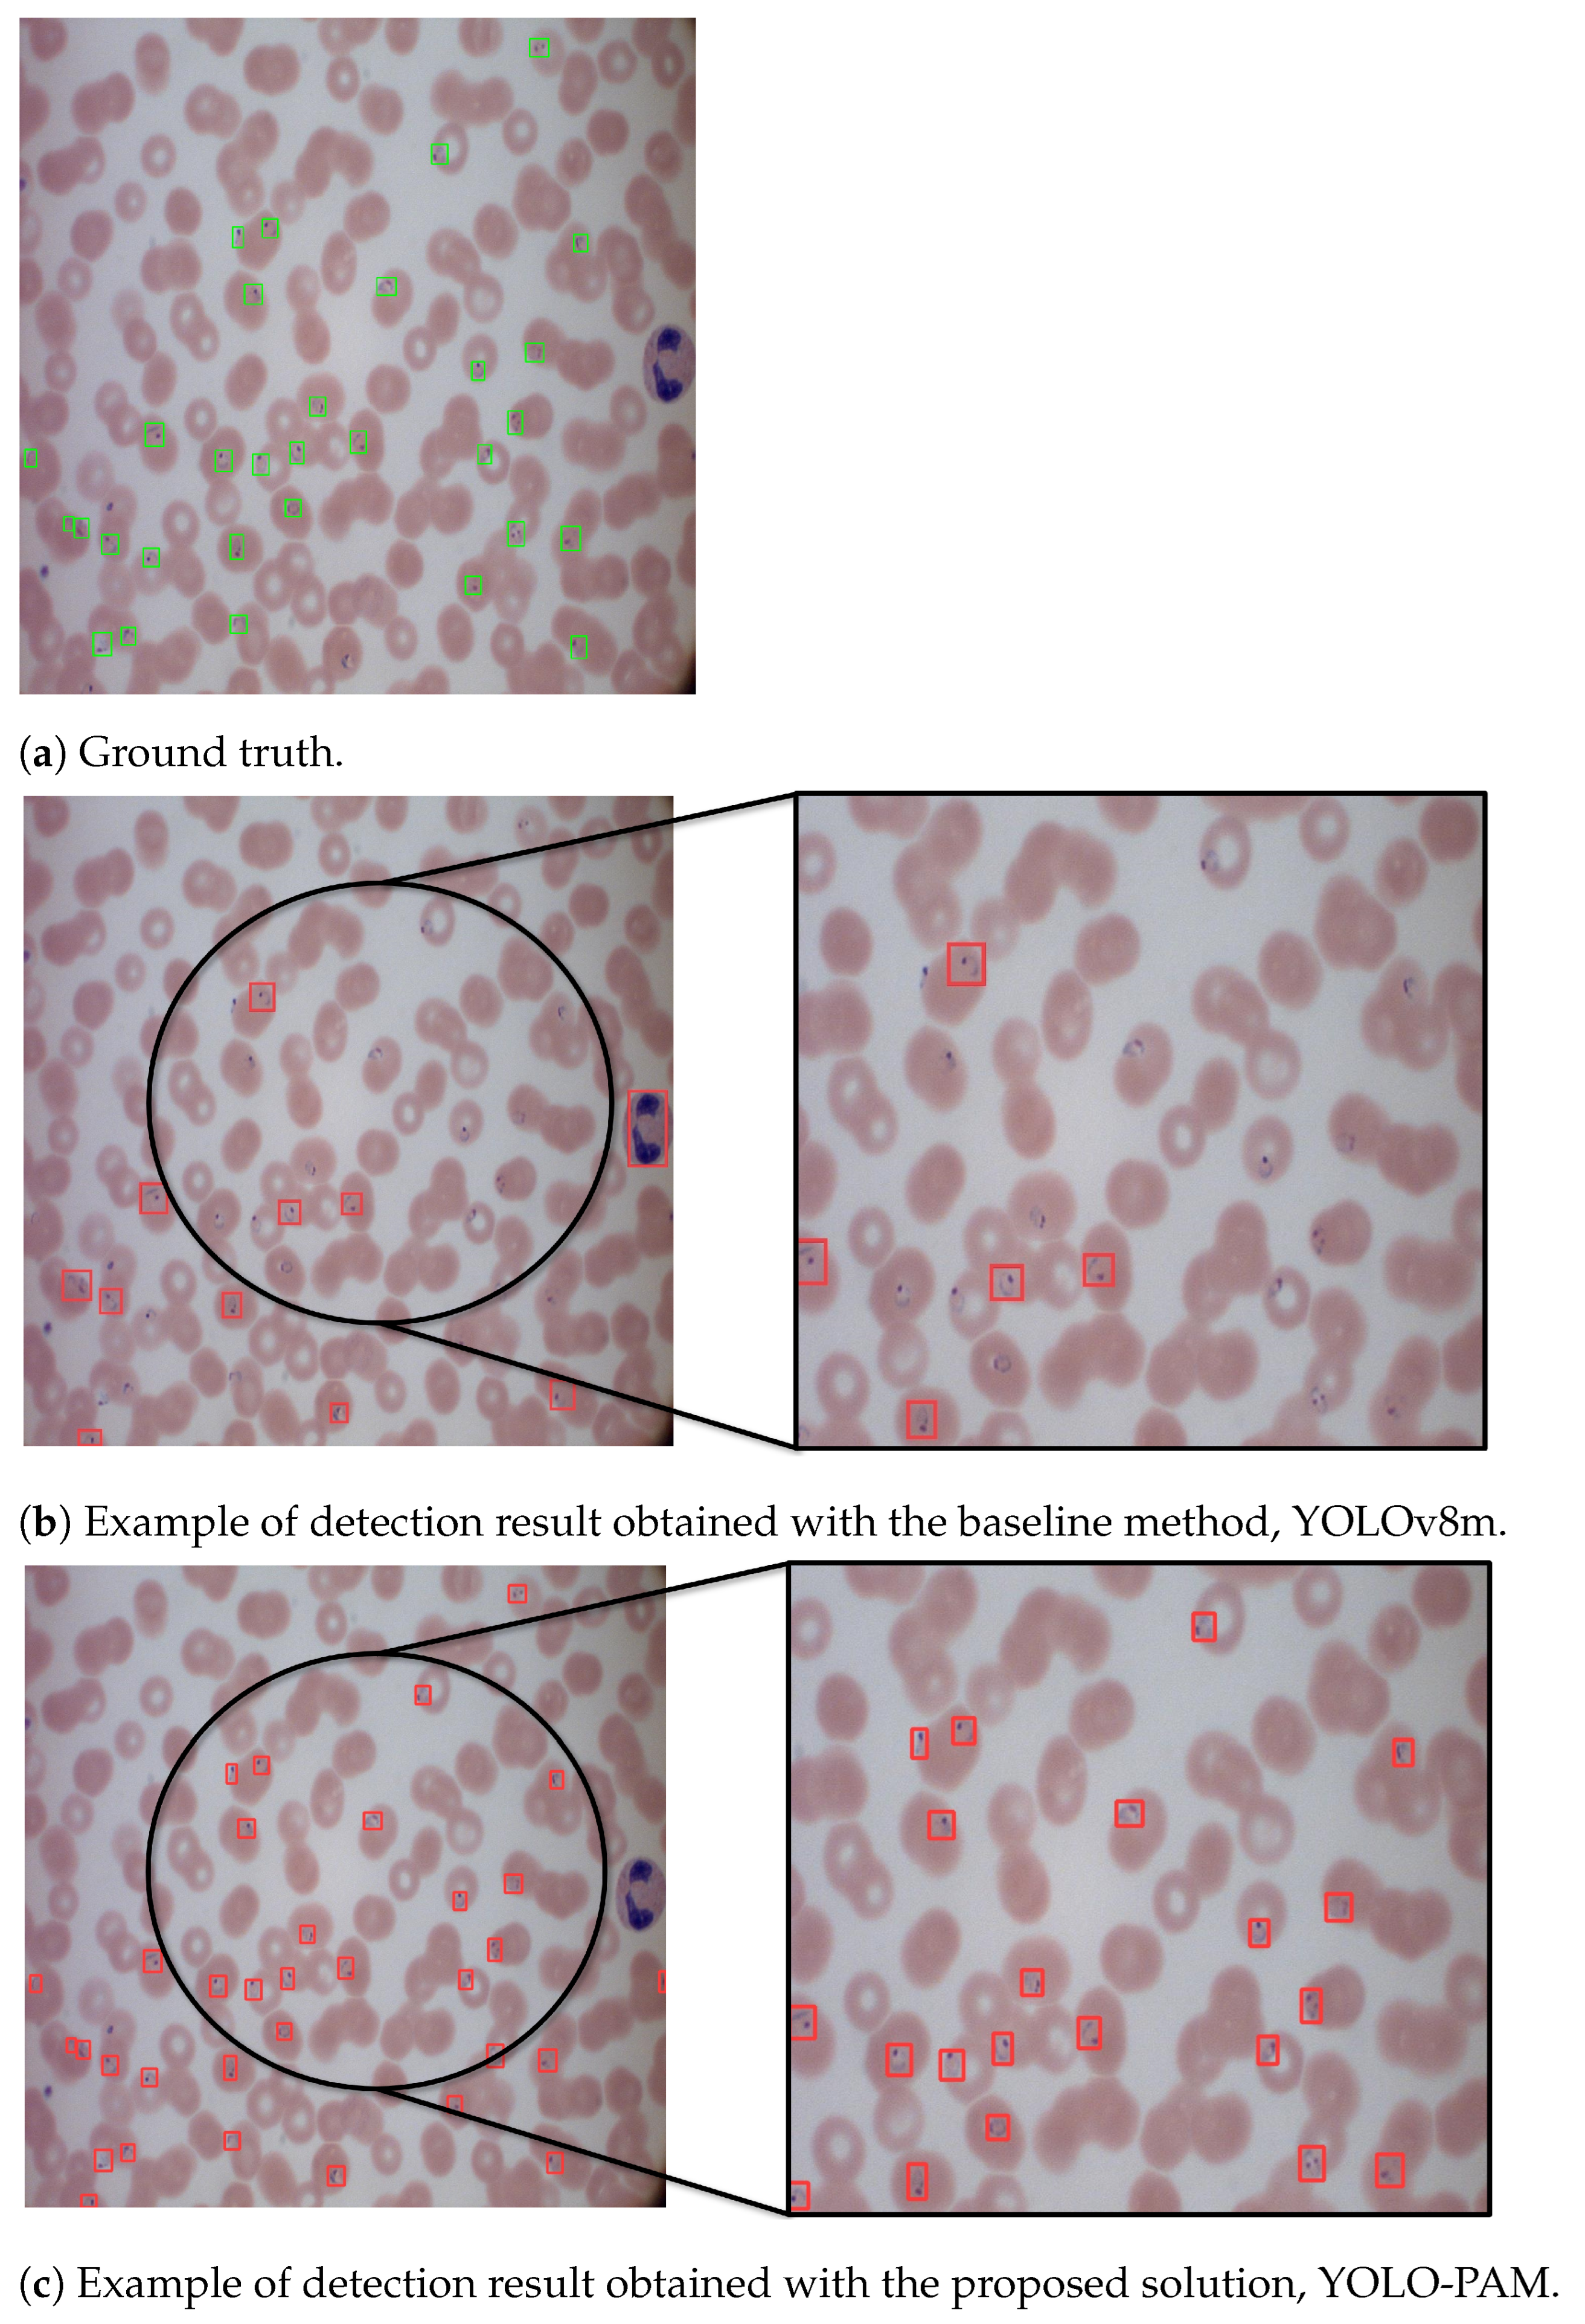
Figure 4 shows the predicted bounding boxes generated by the proposed architecture. As can be seen, it demonstrated a high degree of agreement with the ground truth, showing outstanding improvements over the baseline results obtained with YOLOv8. Moreover, YOLO-PAM outperformed the detectors adopted for comparison, as shown by the numerical data presented in Table 4 and Table 5.
5.6. System Comparison
In this section, we compare YOLO-PAM with some works present in the literature that employed the same datasets as the object of this study.
Regarding the MP-IDB dataset, Rahman et al. conducted binary classification on individual cells segmented from MP-IDB using the watershed transform. Diverging from their approach, we focused exclusively on parasite detection, omitting healthy RBCs. Thus, a direct comparison was precluded. Nevertheless, the authors achieved an 85.18% binary classification accuracy using a fine-tuned VGG-19 specialized in discriminating healthy single RBCs from infected counterparts [45].
Maity et al. built a comprehensive system capable of segmenting infected RBCs using a multilayer feedforward Artificial Neural Network applied to full-sized images. They subsequently employed a CapsNet for the classification of the obtained crops. Their reported correct classification of 885 P. falciparum rings out of 927 yielded a classification accuracy of 95.46%. However, the authors did not extend the classification to gametocytes, trophozoites, or schizonts [5].
Zedda et al. used a modified version of YOLOv5 for parasite detection, reporting an 84.6% mean average precision on MP-IDB [44].
Concerning the IML dataset, Arshad et al. implemented a framework involving a segmentation step followed by multi-stage classification using off-the-shelf CNNs. Two segmentation methodologies were tested, yielding 89.33% precision with the morphological approach and 82.42% with the U-Net method [40].
The proposed YOLO-PAM approach offers several advantages compared to existing state-of-the-art methods. First, in the critical scenario of malaria parasite detection, where swift and accurate identification is paramount for timely diagnosis, YOLO’s efficiency in providing real-time results stands as a significant advantage. Furthermore, YOLO-PAM’s reduced parameter count, compared to other architectures, strikes a balance between accuracy and speed, which is particularly beneficial in resource-constrained settings where prompt and precise detections are imperative for timely intervention. Table 6 compares parameter counts and inference times between YOLO-PAM and other architectures, demonstrating improved results with lower parameters and comparable inference times to the reference baseline.
Second, YOLO-PAM provides a unified framework for end-to-end detection, allowing simultaneous predictions of bounding boxes and class probabilities for multiple parasite types and stages within an image.
Third, the unified architecture of YOLO-PAM, considering the entire image in a single forward pass, streamlines the detection process and enhances the model’s ability to capture spatial dependencies effectively.
By leveraging these advantages, this work aimed to contribute significantly to the field of malaria diagnosis by providing a robust and efficient solution for automated parasite detection.
6. Conclusions
In summary, this study’s experimental results and analysis demonstrated the effectiveness and superiority of the proposed malaria-parasite-detection method, YOLO-PAM, across multiple datasets and parasite species. The ablation study systematically assessed the impact of various modifications on the detection performance. Notably, integrating both CBAM and C3STR modifications significantly enhanced the accuracy, highlighting the importance of these combined enhancements.
When evaluated on MP-IDB, YOLO-PAM consistently outperformed existing methods across all four parasite species. Notably, within the P.f. class, YOLO-PAM achieved a remarkable Average Precision (AP) of 83.6%, surpassing both the baseline YOLOv8m and the previously established state-of-the-art detection method [44]. Similarly, in the P.m. and P.o. categories, YOLO-PAM exhibited high performance, demonstrating its precision in detecting parasites of varying sizes within these species.
Furthermore, the evaluation of the IML dataset reinforced YOLO-PAM’s superiority. With an overall AP of 59.9%, it outperformed the FRCNN, RetinaNet, FCOS, and the baseline, YOLOv8m, demonstrating its accuracy in detecting malaria parasites even in challenging scenarios.
YOLO-PAM exhibited precision for small objects, as observed in the P.f. class, and for medium- and large-sized parasites, underscoring its versatility across different object scales.
In conclusion, YOLO-PAM presents a robust and reliable solution for malaria parasite detection, addressing the limitations of existing methods and demonstrating superior performance across diverse datasets and parasite species. Its accuracy, versatility, and reliability make it a valuable contribution to malaria research and healthcare, promising significant advancements in malaria diagnosis and ultimately contributing to the global efforts to combat this infectious disease.
Several potential directions for future research were outlined. The primary goal was to enhance the current approach to accurately detect all malaria parasite species simultaneously. Additionally, building upon the encouraging results within the intra-dataset context, the approach will be tailored to a cross-dataset framework to enhance its resilience to potential environmental variations between the source and target data. Finally, a long-term objective is to expand the approach to encompass a multi-magnification image representation of the same blood smear, enabling more-precise detection of malaria parasites across varying magnifications.
Author Contributions
Conceptualization, L.Z.; methodology, L.Z. and A.L.; investigation, L.Z., A.L., and C.D.R.; software, L.Z.; writing—original draft, L.Z. and A.L.; writing—review and editing, L.Z., A.L. and C.D.R.; supervision, A.L. and C.D.R. All authors have read and agreed to the published version of the manuscript.
Funding
We acknowledge financial support under the National Recovery and Resilience Plan (NRRP), Mission 4 Component 2 Investment 1.5—Call for tender No. 3277 published on December 30, 2021, by the Italian Ministry of University and Research (MUR) funded by the European Union—NextGenerationEU. Project Code ECS0000038—Project Title eINS Ecosystem of Innovation for Next Generation Sardinia—CUP F53C22000430001—Grant Assignment Decree No. 1056 adopted on June 23, 2022, by the Italian Ministry of University and Research (MUR).
Data Availability Statement
All the material used and developed for this work is available at the following GitHub repository https://github.com/snarci/YOLO-SPAM (accessed on 28 November 2023).
Conflicts of Interest
The authors declare no conflict of interest.
Abbreviations
The following abbreviations are used in this manuscript:
| P. | Plasmodium |
| P.f. | Plasmodium falciparum |
| P.v. | Plasmodium vivax |
| P.o. | Plasmodium ovale |
| P.m. | Plasmodium malariae |
| YOLO | You Only Look Once |
| PAM | Parasite Attention Module |
| PBS | Peripheral Blood Smear |
| CAD | Computer-Aided Diagnosis |
| CNN | Convolutional Neural Network |
| CBAM | Convolutional Block Attention Module |
| NAM | Normalized Attention Module |
| AP | Average Precision |
References
- Rantala, A.M.; Taylor, S.M.; Trottman, P.A.; Luntamo, M.; Mbewe, B.; Maleta, K.; Kulmala, T.; Ashorn, P.; Meshnick, S.R. Comparison of real-time PCR and microscopy for malaria parasite detection in Malawian pregnant women. Malar. J. 2010, 9, 269. [Google Scholar] [CrossRef] [PubMed]
- Gimenez, A.M.; Marques, R.F.; Regiart, M.; Bargieri, D.Y. Diagnostic methods for non-falciparum malaria. Front. Cell. Infect. Microbiol. 2021, 11, 681063. [Google Scholar] [CrossRef] [PubMed]
- A, V.; Kanna, B.R. Deep learning approach to detect malaria from microscopic images. Multimed. Tools Appl. 2020, 79, 15297–15317. [Google Scholar]
- Loddo, A.; Ruberto, C.D.; Kocher, M.; Prod’Hom, G. MP-IDB: The Malaria Parasite Image Database for Image Processing and Analysis. In Proceedings of the Processing and Analysis of Biomedical Information—First International SIPAIM Workshop, SaMBa 2018, Held in Conjunction with MICCAI 2018, Granada, Spain, 20 September 2018; Revised Selected Papers. Leporé, N., Brieva, J., Romero, E., Racoceanu, D., Joskowicz, L., Eds.; Springer: Berlin/Heidelberg, Germany, 2018; Volume 11379, pp. 57–65. [Google Scholar]
- Maity, M.; Jaiswal, A.; Gantait, K.; Chatterjee, J.; Mukherjee, A. Quantification of malaria parasitaemia using trainable semantic segmentation and capsnet. Pattern Recognit. Lett. 2020, 138, 88–94. [Google Scholar] [CrossRef]
- Huang, Q.; Li, W.; Zhang, B.; Li, Q.; Tao, R.; Lovell, N.H. Blood Cell Classification Based on Hyperspectral Imaging with Modulated Gabor and CNN. IEEE J. Biomed. Health Inform. 2020, 24, 160–170. [Google Scholar] [CrossRef]
- Mondal, C.; Hasan, M.K.; Jawad, M.T.; Dutta, A.; Islam, M.R.; Awal, M.A.; Ahmad, M. Acute Lymphoblastic Leukemia Detection from Microscopic Images Using Weighted Ensemble of Convolutional Neural Networks. arXiv 2021, arXiv:2105.03995. [Google Scholar]
- Vogado, L.H.; Veras, R.M.; Araujo, F.H.; Silva, R.R.; Aires, K.R. Leukemia diagnosis in blood slides using transfer learning in CNNs and SVM for classification. Eng. Appl. Artif. Intell. 2018, 72, 415–422. [Google Scholar] [CrossRef]
- Toğaçar, M.; Ergen, B.; Cömert, Z. Classification of white blood cells using deep features obtained from Convolutional Neural Network models based on the combination of feature selection methods. Appl. Soft Comput. J. 2020, 97, 106810. [Google Scholar] [CrossRef]
- Di Ruberto, C.; Loddo, A.; Puglisi, G. Blob Detection and Deep Learning for Leukemic Blood Image Analysis. Appl. Sci. 2020, 10, 1176. [Google Scholar] [CrossRef]
- Di Ruberto, C.; Loddo, A.; Putzu, L. Learning by Sampling for White Blood Cells Segmentation. In Proceedings of the Image Analysis and Processing—ICIAP 2015—18th International Conference, Genoa, Italy, 7–11 September 2015; Proceedings, Part I. Springer: Berlin/Heidelberg, Germany, 2015; Volume 9279, pp. 557–567. [Google Scholar]
- Di Ruberto, C.; Loddo, A.; Putzu, L. A leucocytes count system from blood smear images Segmentation and counting of white blood cells based on learning by sampling. Mach. Vis. Appl. 2016, 27, 1151–1160. [Google Scholar] [CrossRef]
- Di Ruberto, C.; Loddo, A.; Putzu, L. Detection of red and white blood cells from microscopic blood images using a region proposal approach. Comput. Biol. Med. 2020, 116, 103530. [Google Scholar] [CrossRef] [PubMed]
- Xie, W.; Noble, J.A.; Zisserman, A. Microscopy cell counting and detection with fully convolutional regression networks. Comput. Methods Biomech. Biomed. Eng. Imaging Vis. 2018, 6, 283–292. [Google Scholar] [CrossRef]
- Healthcare, Stanford 2021. Available online: https://stanfordhealthcare.org/medical-conditions/primary-care/malaria/types.html (accessed on 8 March 2023).
- WHO. 2022. Available online: https://www.who.int/news-room/fact-sheets/detail/malaria (accessed on 8 March 2023).
- World Health Organization. 2021. Available online: https://www.who.int/health-topics/malaria#tab=tab_1 (accessed on 8 March 2023).
- ScienceDirect. 2021. Available online: https://www.sciencedirect.com/topics/neuroscience/malaria (accessed on 8 March 2023).
- For Disease Control, United States Center; Prevention. 2021. Available online: https://www.cdc.gov/malaria/about/biology/index.html (accessed on 8 March 2023).
- Gadia, C.L.B.; Manirakiza, A.; Tekpa, G.; Konamna, X.; Vickos, U.; Nakoune, E. Identification of pathogens for differential diagnosis of fever with jaundice in the Central African Republic: A retrospective assessment, 2008–2010. BMC Infect. Dis. 2017, 17, 735. [Google Scholar] [CrossRef] [PubMed]
- Kerlin, D.H.; Gatton, M.L. Preferential invasion by Plasmodium merozoites and the self-regulation of parasite burden. PLoS ONE 2013, 8, e57434. [Google Scholar] [CrossRef]
- Voorberg-van der Wel, A.; Roma, G.; Gupta, D.K.; Schuierer, S.; Nigsch, F.; Carbone, W.; Zeeman, A.M.; Lee, B.H.; Hofman, S.O.; Faber, B.W.; et al. A comparative transcriptomic analysis of replicating and dormant liver stages of the relapsing malaria parasite Plasmodium cynomolgi. Elife 2017, 6, e29605. [Google Scholar] [CrossRef] [PubMed]
- Berzosa, P.; de Lucio, A.; Romay-Barja, M.; Herrador, Z.; González, V.; García, L.; Fernández-Martínez, A.; Santana-Morales, M.; Ncogo, P.; Valladares, B.; et al. Comparison of three diagnostic methods (microscopy, RDT, and PCR) for the detection of malaria parasites in representative samples from Equatorial Guinea. Malar. J. 2018, 17, 333. [Google Scholar] [CrossRef]
- Kotepui, M.; Kotepui, K.U.; De Jesus Milanez, G.; Masangkay, F.R. Summary of discordant results between rapid diagnosis tests, microscopy, and polymerase chain reaction for detecting Plasmodium mixed infection: A systematic review and meta-analysis. Sci. Rep. 2020, 10, 12765. [Google Scholar] [CrossRef]
- Liang, Z.; Powell, A.; Ersoy, I.; Poostchi, M.; Silamut, K.; Palaniappan, K.; Guo, P.; Hossain, M.A.; Antani, S.K.; Maude, R.J.; et al. CNN-based image analysis for malaria diagnosis. In Proceedings of the IEEE International Conference on Bioinformatics and Biomedicine, BIBM 2016, Shenzhen, China, 15–18 December 2016; Tian, T., Jiang, Q., Liu, Y., Burrage, K., Song, J., Wang, Y., Hu, X., Morishita, S., Zhu, Q., Wang, G., Eds.; IEEE Computer Society: Washington, DC, USA, 2016; pp. 493–496. [Google Scholar]
- Gopakumar, G.P.; Swetha, M.; Sai Siva, G.; Sai Subrahmanyam, G.R.K. Convolutional neural network-based malaria diagnosis from focus stack of blood smear images acquired using custom-built slide scanner. J. Biophotonics 2018, 11, e201700003. [Google Scholar] [CrossRef]
- Dong, Y.; Jiang, Z.; Shen, H.; Pan, W.D. Classification accuracies of malaria infected cells using deep convolutional neural networks based on decompressed images. In Proceedings of the SoutheastCon 2017, Concord, NC, USA, 30 March–2 April 2017; IEEE: Piscataway, NJ, USA, 2017; pp. 1–6. [Google Scholar]
- Dong, Y.; Jiang, Z.; Shen, H.; Pan, W.D.; Williams, L.A.; Reddy, V.V.B.; Benjamin, W.H.; Bryan, A.W. Evaluations of deep convolutional neural networks for automatic identification of malaria infected cells. In Proceedings of the 2017 IEEE EMBS International Conference on Biomedical & Health Informatics, BHI 2017, Orland, FL, USA, 16–19 February 2017; IEEE: Piscataway, NJ, USA, 2017; pp. 101–104. [Google Scholar]
- Rajaraman, S.; Antani, S.K.; Poostchi, M.; Silamut, K.; Hossain, M.A.; Maude, R.J.; Jaeger, S.; Thoma, G.R. Pre-trained convolutional neural networks as feature extractors toward improved malaria parasite detection in thin blood smear images. PeerJ 2018, 6, e4568. [Google Scholar] [CrossRef]
- Rajaraman, S.; Jaeger, S.; Antani, S.K. Performance evaluation of deep neural ensembles toward malaria parasite detection in thin-blood smear images. PeerJ 2019, 7, e6977. [Google Scholar] [CrossRef]
- Di Ruberto, C.; Dempster, A.; Khan, S.; Jarra, B. Analysis of infected blood cell images using morphological operators. Image Vis. Comput. 2002, 20, 133–146. [Google Scholar] [CrossRef]
- Tek, F.B.; Dempster, A.G.; Kale, I. Malaria Parasite Detection in Peripheral Blood Images; BMVA: Edinburgh, UK, 2006. [Google Scholar]
- Kumarasamy, S.K.; Ong, S.; Tan, K.S. Robust contour reconstruction of red blood cells and parasites in the automated identification of the stages of malarial infection. Mach. Vis. Appl. 2011, 22, 461–469. [Google Scholar] [CrossRef]
- Bias, S.; Reni, S.; Kale, I. Mobile Hardware Based Implementation of a Novel, Efficient, Fuzzy Logic Inspired Edge Detection Technique for Analysis of Malaria Infected Microscopic Thin Blood Images. In Proceedings of the 9th International Conference on Emerging Ubiquitous Systems and Pervasive Networks (EUSPN 2018)/the 8th International Conference on Current and Future Trends of Information and Communication Technologies in Healthcare (ICTH-2018)/Affiliated Workshops, Leuven, Belgium, 5–8 November 2018; Procedia Computer Science. Elsevier: Amsterdam, The Netherlands, 2018; Volume 141, pp. 374–381. [Google Scholar]
- Loddo, A.; Putzu, L. On the effectiveness of leukocytes classification methods in a real application scenario. AI 2021, 2, 394–412. [Google Scholar] [CrossRef]
- Zaid, M.; Ali, S.; Ali, M.; Hussein, S.; Saadia, A.; Sultani, W. Identifying out of distribution samples for skin cancer and malaria images. Biomed. Signal Process. Control 2022, 78, 103882. [Google Scholar] [CrossRef]
- Sultani, W.; Nawaz, W.; Javed, S.; Danish, M.S.; Saadia, A.; Ali, M. Towards Low-Cost and Efficient Malaria Detection. In Proceedings of the IEEE/CVF Conference on Computer Vision and Pattern Recognition, CVPR 2022, New Orleans, LA, USA, 18–24 June 2022; IEEE: Piscataway, NJ, USA, 2022; pp. 20655–20664. [Google Scholar]
- Loddo, A.; Ruberto, C.D.; Kocher, M. Recent Advances of Malaria Parasites Detection Systems Based on Mathematical Morphology. Sensors 2018, 18, 513. [Google Scholar] [CrossRef] [PubMed]
- Krizhevsky, A.; Sutskever, I.; Hinton, G.E. ImageNet Classification with Deep Convolutional Neural Networks. In Proceedings of the 25th International Conference on Neural Information Processing Systems (NIPS’12), Lake Tahoe, NV, USA, 3–6 December 2012; Volume 1, pp. 1097–1105. [Google Scholar]
- Arshad, Q.A.; Ali, M.; Hassan, S.; Chen, C.; Imran, A.; Rasul, G.; Sultani, W. A dataset and benchmark for malaria life-cycle classification in thin blood smear images. Neural Comput. Appl. 2022, 34, 4473–4485. [Google Scholar] [CrossRef]
- Diker, A. An efficient model of residual based convolutional neural network with Bayesian optimization for the classification of malarial cell images. Comput. Biol. Med. 2022, 148, 105635. [Google Scholar] [CrossRef]
- Sengar, N.; Burget, R.; Dutta, M.K. A vision Transformer based approach for analysis of plasmodium vivax life cycle for malaria prediction using thin blood smear microscopic images. Comput. Methods Programs Biomed. 2022, 224, 106996. [Google Scholar] [CrossRef]
- Loddo, A.; Fadda, C.; Ruberto, C.D. An Empirical Evaluation of Convolutional Networks for Malaria Diagnosis. J. Imaging 2022, 8, 66. [Google Scholar] [CrossRef]
- Zedda, L.; Loddo, A.; Di Ruberto, C. A Deep Learning Based Framework for Malaria Diagnosis on High Variation Data Set. In Proceedings of the Image Analysis and Processing—ICIAP 2022—21st International Conference, Lecce, Italy, 23–27 May 2022; Proceedings, Part II. Springer: Berlin/Heidelberg, Germany, 2022; Volume 13232, pp. 358–370. [Google Scholar]
- Rahman, A.; Zunair, H.; Reme, T.R.; Rahman, M.S.; Mahdy, M.R.C. A comparative analysis of deep learning architectures on high variation malaria parasite classification dataset. Tissue Cell 2021, 69, 101473. [Google Scholar] [CrossRef]
- Ren, S.; He, K.; Girshick, R.B.; Sun, J. Faster R-CNN: Towards Real-Time Object Detection with Region Proposal Networks. In Proceedings of the Advances in Neural Information Processing Systems 28: Annual Conference on Neural Information Processing Systems 2015, Montreal, QC, Canada, 7–12 December 2015; pp. 91–99. [Google Scholar]
- Liu, W.; Anguelov, D.; Erhan, D.; Szegedy, C.; Reed, S.E.; Fu, C.; Berg, A.C. SSD: Single Shot MultiBox Detector. In Proceedings of the Computer Vision—ECCV 2016—14th European Conference, Amsterdam, The Netherlands, 11–14 October 2016; Proceedings, Part I. Springer: Berlin/Heidelberg, Germany, 2016; Volume 9905, pp. 21–37. [Google Scholar]
- Lin, T.; Dollár, P.; Girshick, R.B.; He, K.; Hariharan, B.; Belongie, S.J. Feature Pyramid Networks for Object Detection. In Proceedings of the 2017 IEEE Conference on Computer Vision and Pattern Recognition, CVPR 2017, Honolulu, HI, USA, 21–26 July 2017; IEEE Computer Society: Washington, DC, USA, 2017; pp. 936–944. [Google Scholar]
- Redmon, J.; Divvala, S.K.; Girshick, R.B.; Farhadi, A. You Only Look Once: Unified, Real-Time Object Detection. In Proceedings of the 2016 IEEE Conference on Computer Vision and Pattern Recognition, CVPR 2016, Las Vegas, NV, USA, 27–30 June 2016; IEEE Computer Society: Washington, DC, USA, 2016; pp. 779–788. [Google Scholar]
- Redmon, J.; Farhadi, A. YOLO9000: Better, Faster, Stronger. In Proceedings of the 2017 IEEE Conference on Computer Vision and Pattern Recognition, CVPR 2017, Honolulu, HI, USA, 21–26 July 2017; IEEE Computer Society: Washington, DC, USA, 2017; pp. 6517–6525. [Google Scholar]
- Redmon, J.; Farhadi, A. YOLOv3: An Incremental Improvement. arXiv 2018, arXiv:1804.02767. [Google Scholar]
- Bochkovskiy, A.; Wang, C.; Liao, H.M. YOLOv4: Optimal Speed and Accuracy of Object Detection. arXiv 2020, arXiv:2004.10934. [Google Scholar]
- Zhou, H.; Jiang, F.; Lu, H. SSDA-YOLO: Semi-supervised domain adaptive YOLO for cross-domain object detection. Comput. Vis. Image Underst. 2023, 229, 103649. [Google Scholar] [CrossRef]
- Zou, Z.; Chen, K.; Shi, Z.; Guo, Y.; Ye, J. Object Detection in 20 Years: A Survey. Proc. IEEE 2023, 111, 257–276. [Google Scholar] [CrossRef]
- Lin, T.; Maire, M.; Belongie, S.J.; Hays, J.; Perona, P.; Ramanan, D.; Dollár, P.; Zitnick, C.L. Microsoft COCO: Common Objects in Context. In Proceedings of the Computer Vision—ECCV 2014—13th European Conference, Zurich, Switzerland, 6–12 September 2014; Proceedings, Part V; Lecture Notes in Computer Science. Springer: Berlin/Heidelberg, Germany, 2014; Volume 8693, pp. 740–755. [Google Scholar]
- He, K.; Zhang, X.; Ren, S.; Sun, J. Spatial Pyramid Pooling in Deep Convolutional Networks for Visual Recognition. IEEE Trans. Pattern Anal. Mach. Intell. 2015, 37, 1904–1916. [Google Scholar] [CrossRef] [PubMed]
- Liu, S.; Qi, L.; Qin, H.; Shi, J.; Jia, J. Path Aggregation Network for Instance Segmentation. In Proceedings of the 2018 IEEE Conference on Computer Vision and Pattern Recognition, CVPR 2018, Salt Lake City, UT, USA, 18–22 June 2018; Computer Vision Foundation/IEEE Computer Society: Washington, DC, USA, 2018; pp. 8759–8768. [Google Scholar]
- Woo, S.; Park, J.; Lee, J.; Kweon, I.S. CBAM: Convolutional Block Attention Module. In Proceedings of the Computer Vision—ECCV 2018—15th European Conference, Munich, Germany, 8–14 September 2018; Proceedings, Part VII; Lecture Notes in Computer, Science. Ferrari, V., Hebert, M., Sminchisescu, C., Weiss, Y., Eds.; Springer: Berlin/Heidelberg, Germany, 2018; Volume 11211, pp. 3–19. [Google Scholar]
- Niu, Z.; Zhong, G.; Yu, H. A review on the attention mechanism of deep learning. Neurocomputing 2021, 452, 48–62. [Google Scholar] [CrossRef]
- Wang, F.; Jiang, M.; Qian, C.; Yang, S.; Li, C.; Zhang, H.; Wang, X.; Tang, X. Residual Attention Network for Image Classification. In Proceedings of the 2017 IEEE Conference on Computer Vision and Pattern Recognition, CVPR 2017, Honolulu, HI, USA, 21–26 July 2017; IEEE Computer Society: Washington, DC, USA, 2017; pp. 6450–6458. [Google Scholar]
- Guo, M.; Xu, T.; Liu, J.; Liu, Z.; Jiang, P.; Mu, T.; Zhang, S.; Martin, R.R.; Cheng, M.; Hu, S. Attention mechanisms in computer vision: A survey. Comput. Vis. Media 2022, 8, 331–368. [Google Scholar] [CrossRef]
- Hu, J.; Shen, L.; Sun, G. Squeeze-and-Excitation Networks. In Proceedings of the 2018 IEEE Conference on Computer Vision and Pattern Recognition, CVPR 2018, Salt Lake City, UT, USA, 18–22 June 2018; Computer Vision Foundation/IEEE Computer Society: Washington, DC, USA, 2018; pp. 7132–7141. [Google Scholar]
- Liu, Y.; Shao, Z.; Teng, Y.; Hoffmann, N. NAM: Normalization-based Attention Module. arXiv 2021, arXiv:2111.12419. [Google Scholar]
- Liu, Z.; Lin, Y.; Cao, Y.; Hu, H.; Wei, Y.; Zhang, Z.; Lin, S.; Guo, B. Swin Transformer: Hierarchical Vision Transformer using Shifted Windows. In Proceedings of the 2021 IEEE/CVF International Conference on Computer Vision, ICCV 2021, Montreal, QC, Canada, 10–17 October 2021; IEEE: Piscataway, NJ, USA, 2021; pp. 9992–10002. [Google Scholar]
- Gong, H.; Mu, T.; Li, Q.; Dai, H.; Li, C.; He, Z.; Wang, W.; Han, F.; Tuniyazi, A.; Li, H.; et al. Swin-Transformer-Enabled YOLOv5 with Attention Mechanism for Small Object Detection on Satellite Images. Remote Sens. 2022, 14, 2861. [Google Scholar] [CrossRef]
- Zheng, J.; Sun, S.; Zhao, S. Fast ship detection based on lightweight YOLOv5 network. IET Image Process. 2022, 16, 1585–1593. [Google Scholar] [CrossRef]
- Zhu, X.; Lyu, S.; Wang, X.; Zhao, Q. TPH-YOLOv5: Improved YOLOv5 Based on Transformer Prediction Head for Object Detection on Drone-captured Scenarios. In Proceedings of the IEEE/CVF International Conference on Computer Vision Workshops, ICCVW 2021, Montreal, BC, Canada, 11–17 October 2021; IEEE: Piscataway, NJ, USA, 2021; pp. 2778–2788. [Google Scholar]
Figure 1.
Comprehensive overview of the investigated datasets. The figure presents a detailed overview of the two datasets investigated in this study: MP-IDB and IML. MP-IDB encompasses four distinct malaria species—P. falciparum, P. malariae, P. ovale, and P. vivax. In contrast, the IML dataset exclusively consists of samples related to P. vivax. Notably, the MP-IDB dataset demonstrates intra-species variations, while the datasets differ significantly from each other.
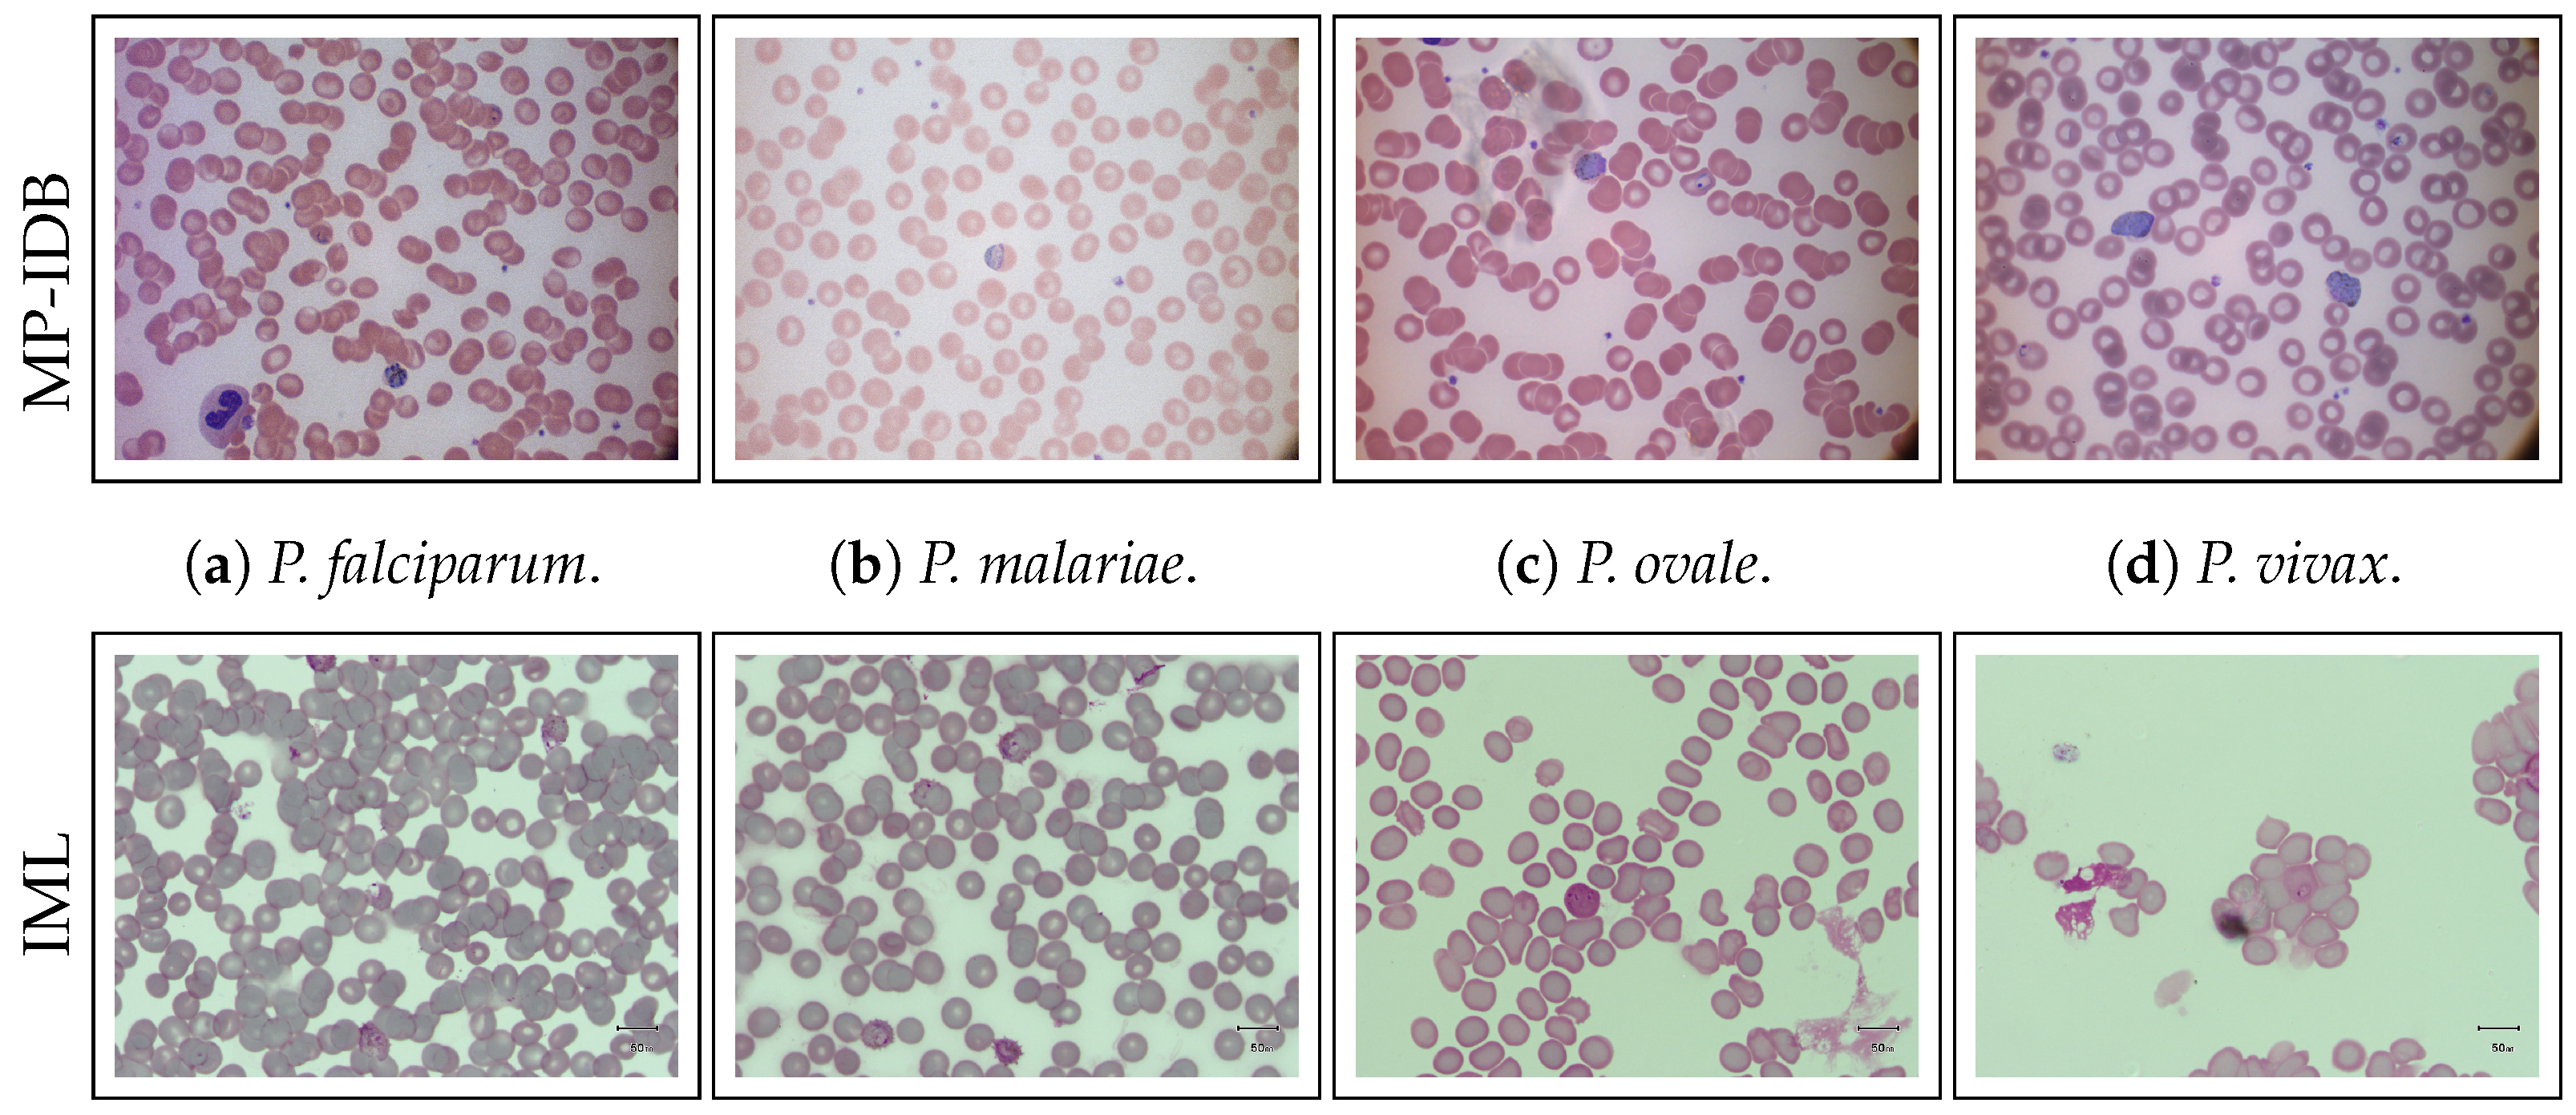
Figure 2.
Overview of the modules and mechanisms’ hierarchy proposed in this study to enhance the performance of YOLOv8. Here, NAM stands for Normalized Attention Module, while CBAM refers to Convolutional Block Attention Module. Further, C2f is a fast implementation of the Cross-Stage Partial (CSP) Bottleneck with 2 convolutions, while C3 indicates a CSP Bottleneck with 3 convolutions. Finally, C3STR refers to the integration of the Swin Transformer Block in place of the C3 module’s Bottleneck.
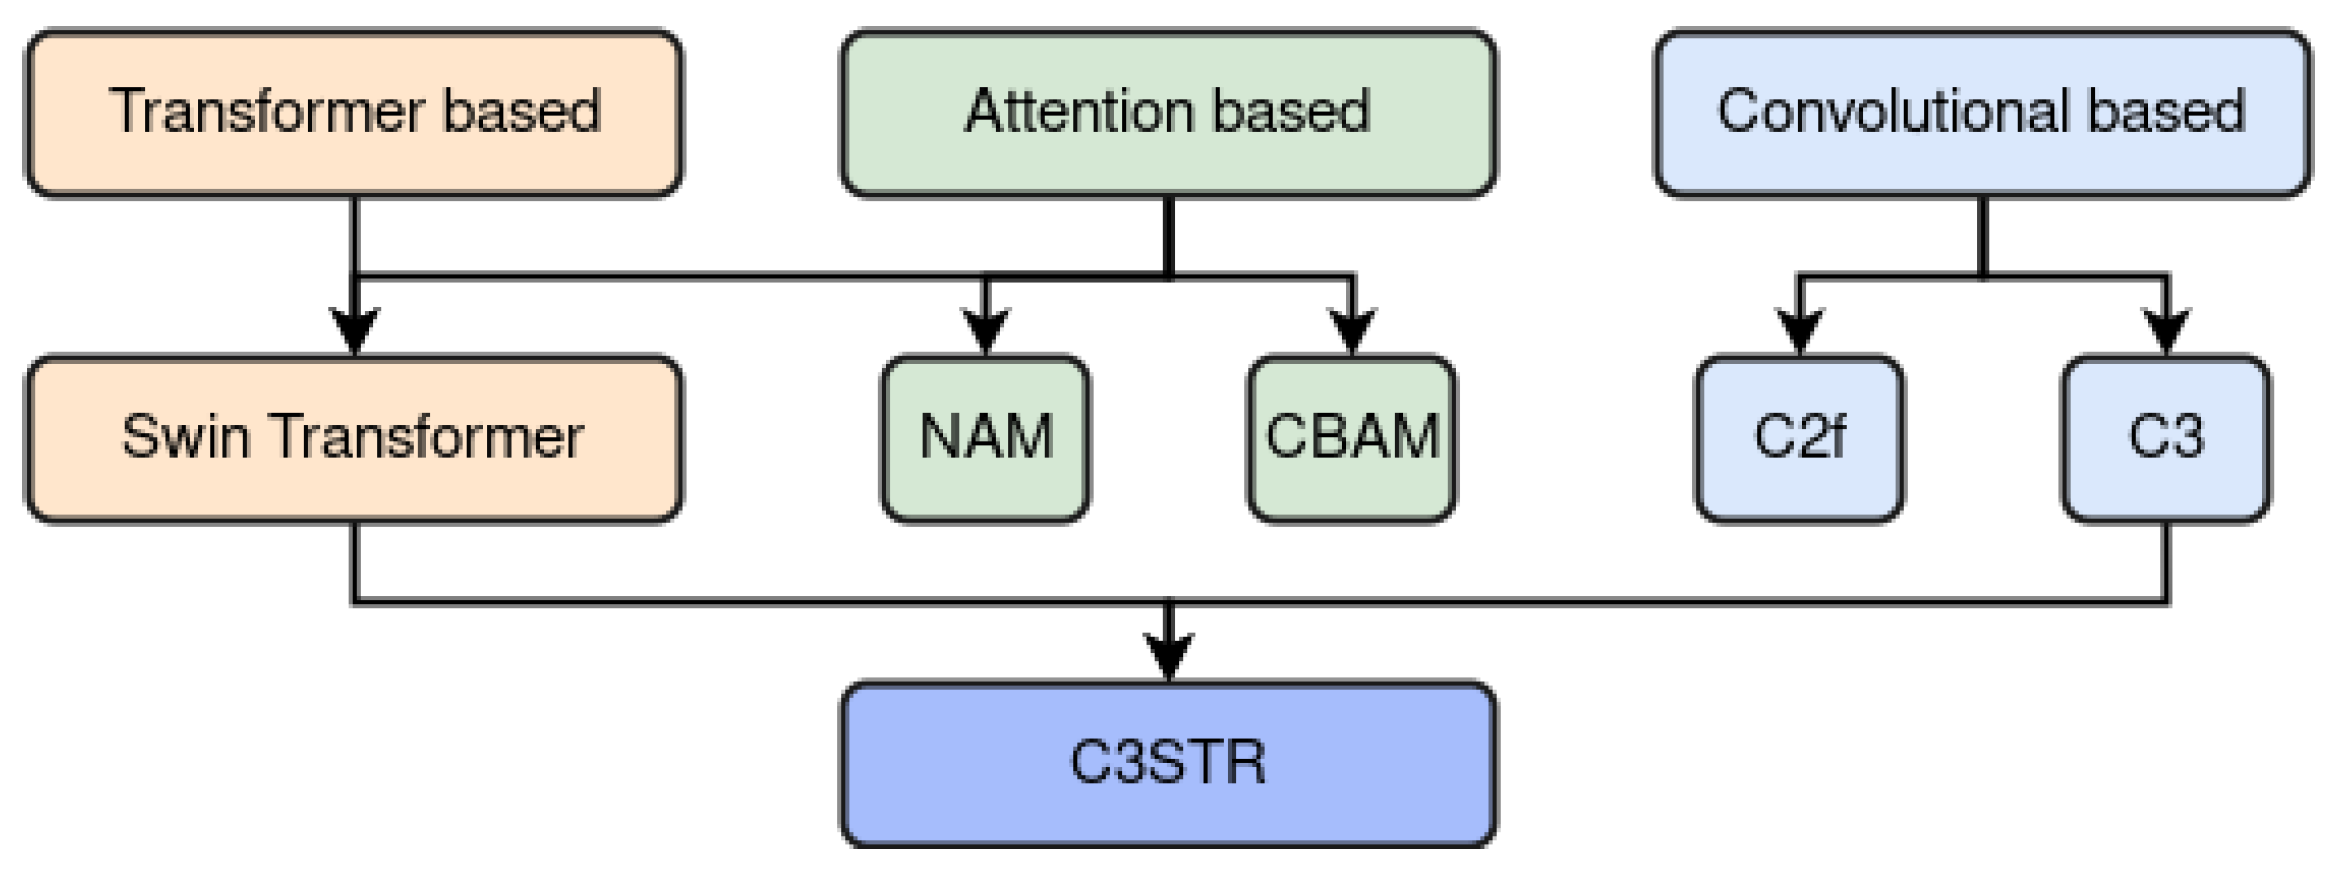
Figure 3.
The proposed YOLO-PAM architecture.
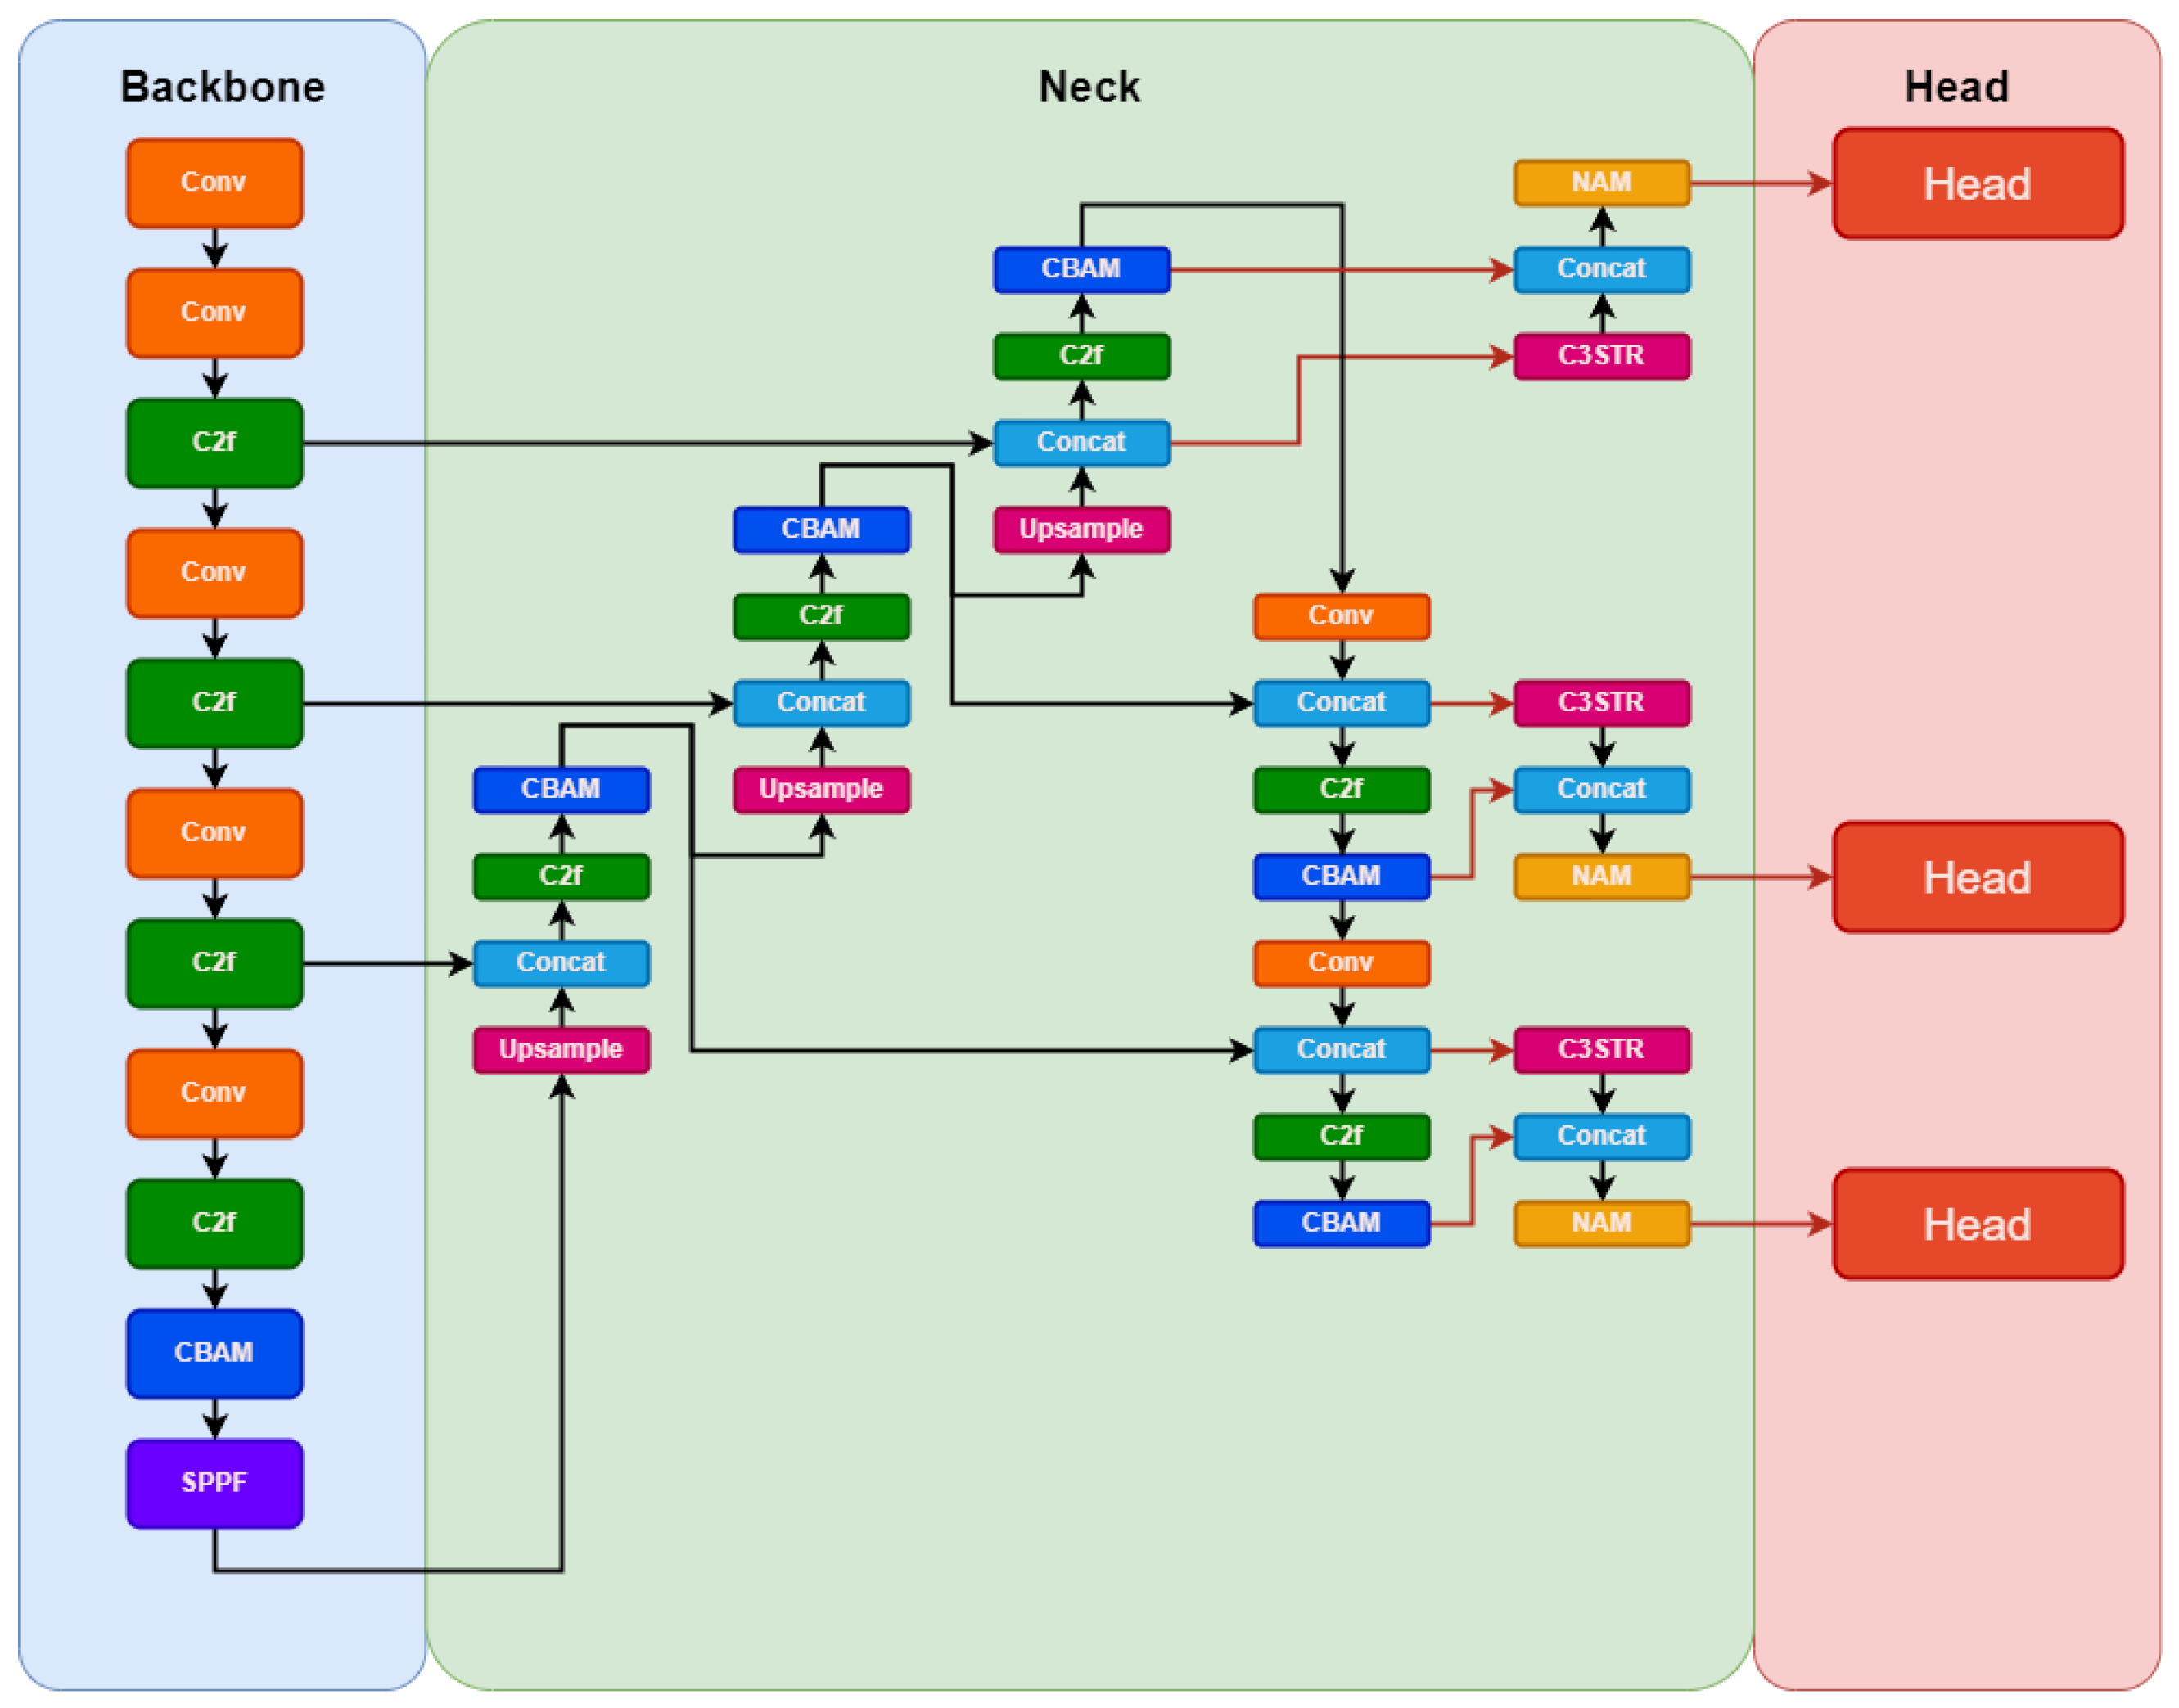
Figure 4.
The middle section shows detection outcomes obtained with the baseline method, YOLOv8m, on a sample image taken from the P.f. split of MP-IDB. A closer look (at the right) reveals missing parasites in the detection, along with the misclassification of a white blood cell as a parasite. In contrast, the lower section presents results obtained with the proposed method, YOLO-PAM. Here, all the parasites are accurately detected, and the white blood cell is not flagged as a parasite. This comparison underscores the enhanced precision and accuracy achieved by YOLO-PAM.

Table 1.
Distribution of the parasites of both datasets based on their size, measured in pixels. S, M, and L indicate Small, Medium, and Large parasites.
Table 1.
Distribution of the parasites of both datasets based on their size, measured in pixels. S, M, and L indicate Small, Medium, and Large parasites.
| Parasites | ||||||||||
|---|---|---|---|---|---|---|---|---|---|---|
| Dataset | Species | Train Set | Val Set | Test Set | ||||||
| S | M | L | S | M | L | S | M | L | ||
| MP-IDB | P. falciparum | 370 | 408 | 0 | 123 | 136 | 0 | 123 | 136 | 1 |
| P. malariae | 1 | 25 | 0 | 1 | 8 | 0 | 0 | 8 | 0 | |
| P. ovale | 0 | 20 | 0 | 0 | 6 | 0 | 0 | 7 | 0 | |
| P. vivax | 2 | 29 | 2 | 1 | 10 | 1 | 3 | 10 | 5 | |
| IML | P. Vivax | 6 | 128 | 249 | 1 | 9 | 49 | 3 | 16 | 89 |
Table 2.
Augmentation parameters and their associated probabilities. The table delineates the parameters employed for data augmentation, including rotation range iterations, Gaussian noise variance range, and Hue, Saturation, Value (HSV) shift limits, along with their respective probabilities of implementation.
| Augmentation | Parameters | Probability |
|---|---|---|
| Rotation | range iterations: [0, 3] | 1 |
| Gaussian Noise | variance range: [50, 100] | 0.3 |
| HSV-Hue | shift limit: 20 | 0.3 |
| HSV-Saturation | shift limit: 30 | 0.3 |
| HSV-Value | shift limit: 20 | 0.3 |
Table 3.
Ablation study conducted on the P.f. split of MP-IDB, chosen for its representative selection of various life stages and the presence of small, medium, and large parasites. This subset enables comprehensive assessment and validation of the proposed modifications and enhancements.
Table 3.
Ablation study conducted on the P.f. split of MP-IDB, chosen for its representative selection of various life stages and the presence of small, medium, and large parasites. This subset enables comprehensive assessment and validation of the proposed modifications and enhancements.
| Method | AP (%) |
|---|---|
| Baseline (YOLOv8m) | 78.9 |
| Baseline + CBAM only | 79.6 |
| Baseline + C3STR only | 81.2 |
| Baseline + CBAM + C3STR (Our) | 83.6 |
Table 4.
Quantitative evaluation results obtained on the four parasite classes in MP-IDB [4]. The reported performance metrics include the average precision at different Intersection over Union thresholds and scales. The best results are emphasized in bold.
Table 4.
Quantitative evaluation results obtained on the four parasite classes in MP-IDB [4]. The reported performance metrics include the average precision at different Intersection over Union thresholds and scales. The best results are emphasized in bold.
| Class | Method | AP (%) | AP | AP | AP | AP |
|---|---|---|---|---|---|---|
| P.f. | FRCNN | 39.2 | 80.6 | 33.7 | 44.3 | 0.0 |
| RetinaNet | 34.0 | 78.5 | 23.9 | 42.6 | 0.0 | |
| FCOS | 10.1 | 39.9 | 5.6 | 14.5 | 0.0 | |
| Zedda et al. [44] | - | 95.2 | - | - | - | |
| YOLOv8m | 78.9 | 98.3 | 70.0 | 77.0 | 90.0 | |
| YOLO-PAM | 83.6 | 98.9 | 76.0 | 80.0 | 99.9 | |
| P.m. | FRCNN | 75.1 | 98.4 | - | 75.1 | - |
| RetinaNet | 76.0 | 95.0 | - | 76.2 | - | |
| FCOS | 4.7 | 21.2 | - | 8.8 | - | |
| YOLOv8m | 78.8 | 97.2 | - | 74.0 | - | |
| YOLO-PAM | 93.6 | 98.5 | - | 84.2 | - | |
| P.o. | FRCNN | 71.0 | 89.1 | - | 71.0 | - |
| RetinaNet | 74.3 | 91.5 | - | 74.3 | - | |
| FCOS | 44.2 | 81.8 | - | 45.1 | - | |
| YOLOv8m | 89.7 | 99.5 | - | 83.0 | - | |
| YOLO-PAM | 94.4 | 99.5 | - | 85.0 | - | |
| P.v. | FRCNN | 60.3 | 87.7 | 20.2 | 61.5 | 85.0 |
| RetinaNet | 62.8 | 85.5 | 10.1 | 65.7 | 84.1 | |
| FCOS | 53.0 | 81.0 | 5.1 | 53.8 | 83.1 | |
| YOLOv8m | 85.9 | 93.7 | 19.0 | 83.9 | 96.0 | |
| YOLO-PAM | 87.2 | 94.2 | 19.0 | 86.0 | 94.0 |
Table 5.
Quantitative evaluation results obtained on the IML dataset [40]. The reported performance metrics include the mean average precision at different Intersection over Union thresholds and scales. The best results are emphasized in bold.
Table 5.
Quantitative evaluation results obtained on the IML dataset [40]. The reported performance metrics include the mean average precision at different Intersection over Union thresholds and scales. The best results are emphasized in bold.
| Method | AP (%) | AP | AP | AP | AP |
|---|---|---|---|---|---|
| FRCNN | 27.9 | 73.1 | - | 31.9 | 0.0 |
| RetinaNet | 24.2 | 71.2 | - | 30.7 | 0.0 |
| FCOS | 7.2 | 36.2 | - | 10.5 | 0.0 |
| YOLOv8m | 56.2 | 89.2 | - | 55.5 | 64.0 |
| YOLO-PAM | 59.9 | 91.8 | - | 60.0 | 65.0 |
Table 6.
Indication of the number of parameters (in millions) of every architecture used and inference time (in seconds). YOLO-PAM offer improved results with lower parameters and almost the same inference time as the baseline.
Table 6.
Indication of the number of parameters (in millions) of every architecture used and inference time (in seconds). YOLO-PAM offer improved results with lower parameters and almost the same inference time as the baseline.
| Models | Parameters (M) | Inf. Time (s) |
|---|---|---|
| YOLOv8 (baseline) | 43.2 | 0.0131 |
| FRCNN | 41.2 | 0.101 |
| RetinaNet | 34.1 | 0.102 |
| FCOS | 32.3 | 0.286 |
| YOLO-PAM | 29.8 (−13.4) | 0.0165 |
Disclaimer/Publisher’s Note: The statements, opinions and data contained in all publications are solely those of the individual author(s) and contributor(s) and not of MDPI and/or the editor(s). MDPI and/or the editor(s) disclaim responsibility for any injury to people or property resulting from any ideas, methods, instructions or products referred to in the content. |
© 2023 by the authors. Licensee MDPI, Basel, Switzerland. This article is an open access article distributed under the terms and conditions of the Creative Commons Attribution (CC BY) license (https://creativecommons.org/licenses/by/4.0/).
Share and Cite
MDPI and ACS Style
Zedda, L.; Loddo, A.; Di Ruberto, C. YOLO-PAM: Parasite-Attention-Based Model for Efficient Malaria Detection. J. Imaging 2023, 9, 266. https://doi.org/10.3390/jimaging9120266
AMA Style
Zedda L, Loddo A, Di Ruberto C. YOLO-PAM: Parasite-Attention-Based Model for Efficient Malaria Detection. Journal of Imaging. 2023; 9(12):266. https://doi.org/10.3390/jimaging9120266
Chicago/Turabian StyleZedda, Luca, Andrea Loddo, and Cecilia Di Ruberto. 2023. "YOLO-PAM: Parasite-Attention-Based Model for Efficient Malaria Detection" Journal of Imaging 9, no. 12: 266. https://doi.org/10.3390/jimaging9120266
Note that from the first issue of 2016, this journal uses article numbers instead of page numbers. See further details here.