An Ecological Visual Exploration Tool to Support the Analysis of Visual Processing Pathways in Children with Autism Spectrum Disorders


Abstract
1. Introduction
2. Main Contributions and Related Works
- it proposes an unobtrusive technique to estimate the gaze ray;
- the proposed technique was quantitatively evaluated on both adults and children;
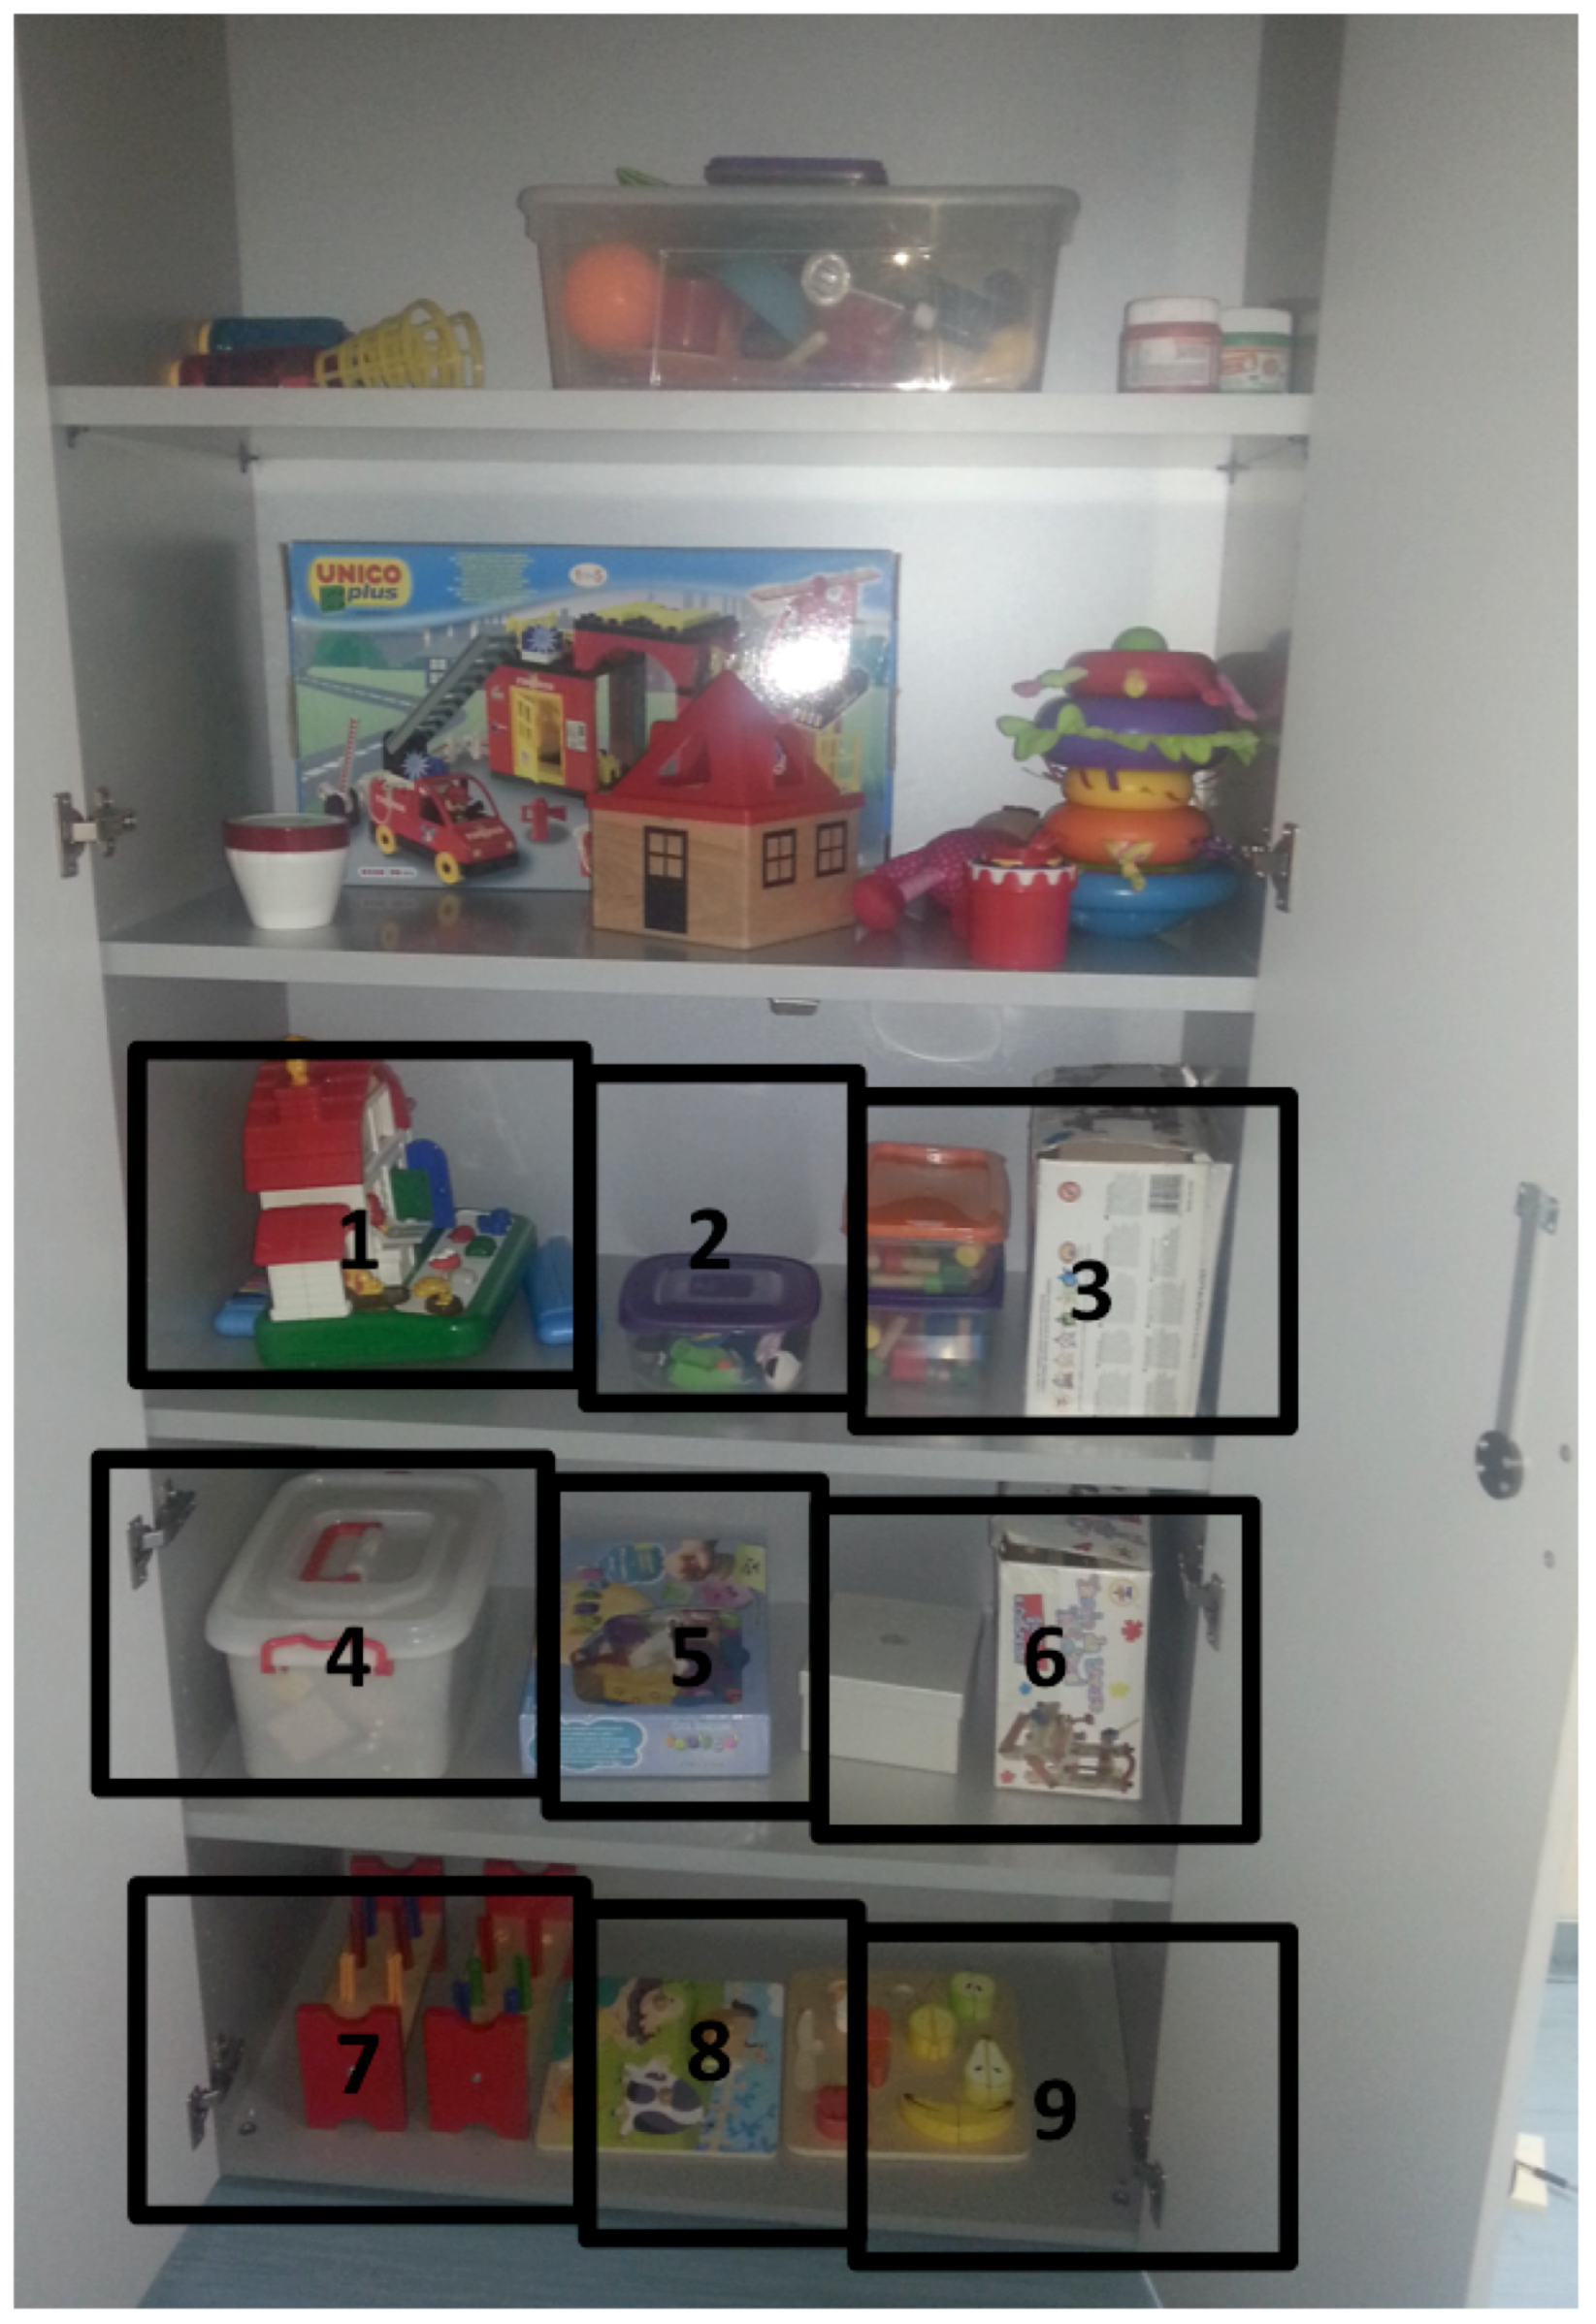
- qualitative evaluation was then performed on children with ASD in a treatment room equipped with a closet containing toys properly disposed by the therapists; the children were asked to explore the closet’s content and to pick up a toy that would be used during the subsequent therapeutic session;
- the system supplies gaze-tracks, hit-maps and overall statistics that can be exploited by the therapist to better perform the behavioral analysis of the individuals;
- the system is low-cost, and it makes use of commercial depth sensors;
- no calibration, nor training phases are required;
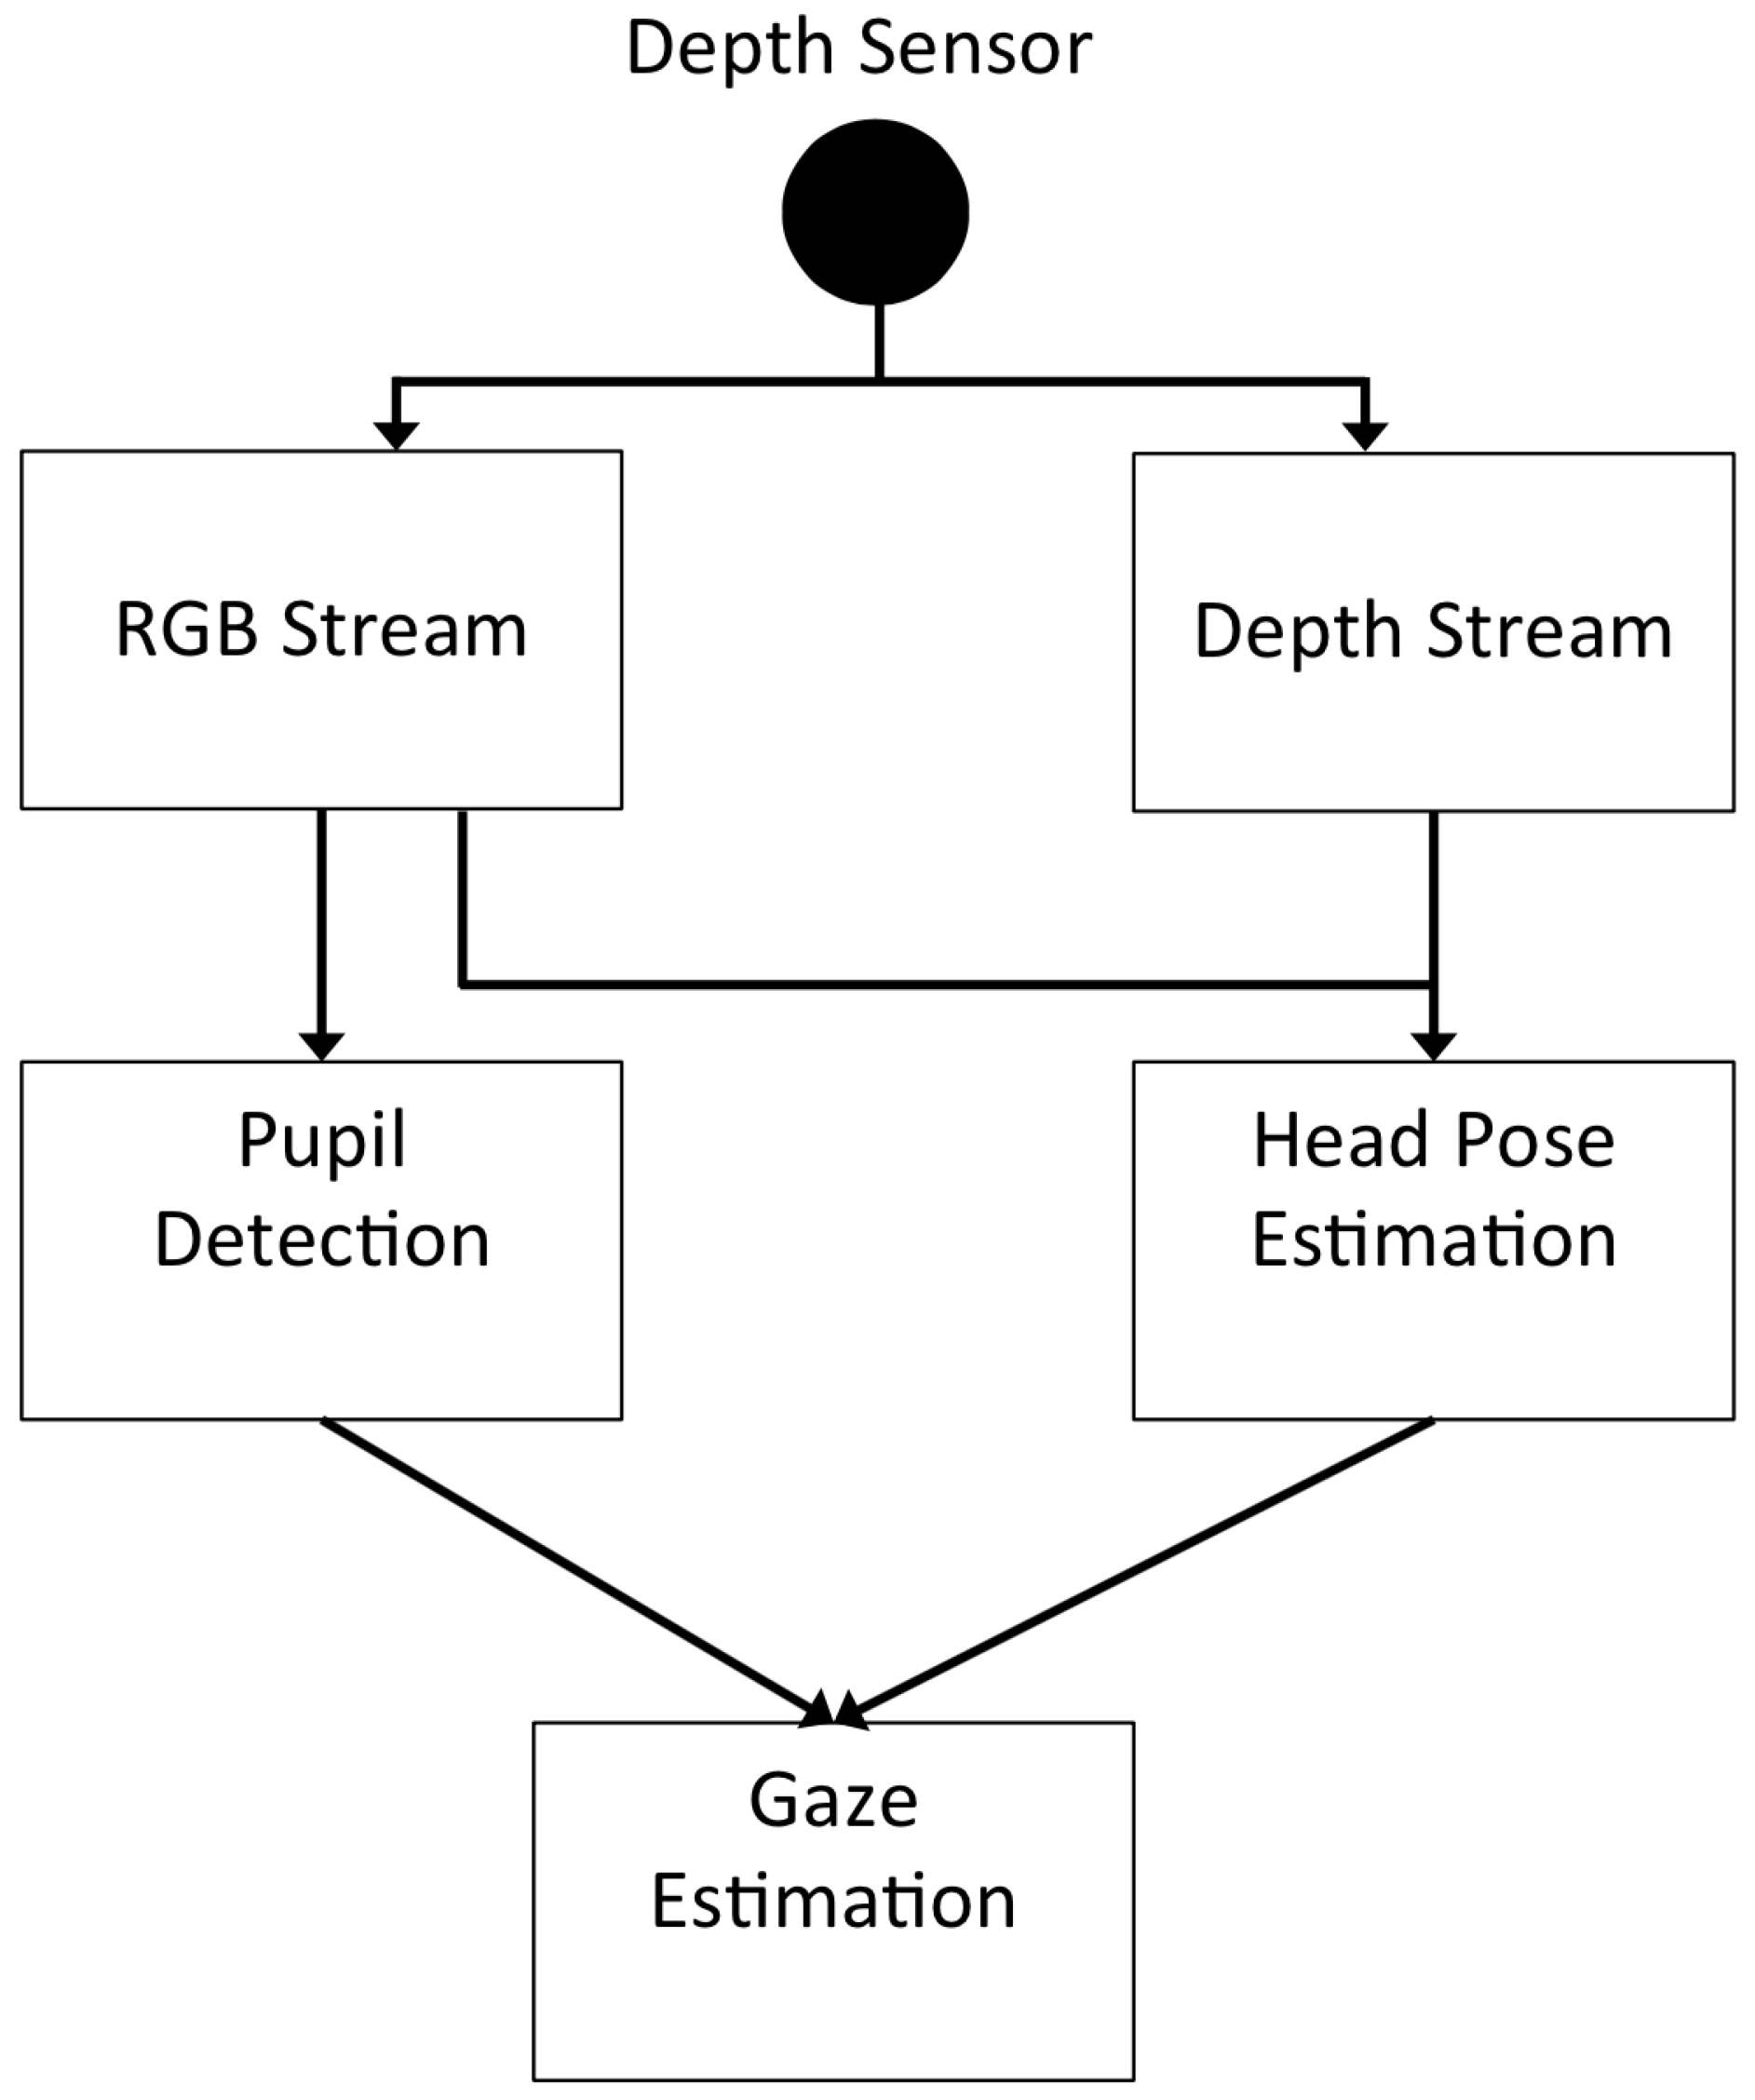
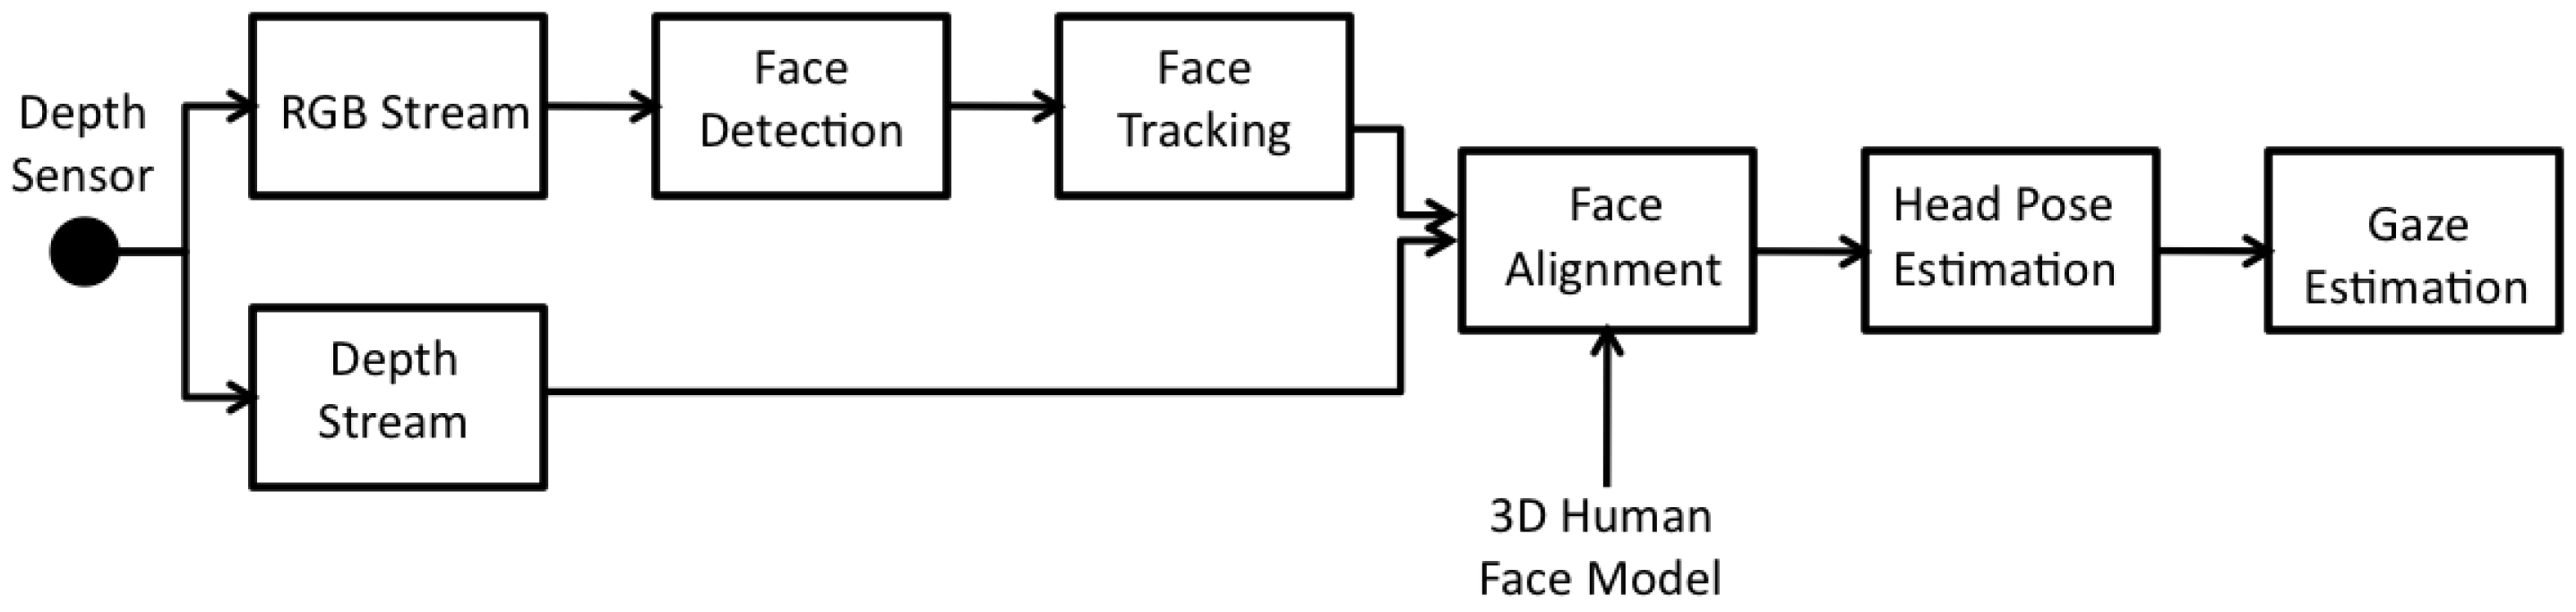
3. Proposed Free Gaze Estimation Method
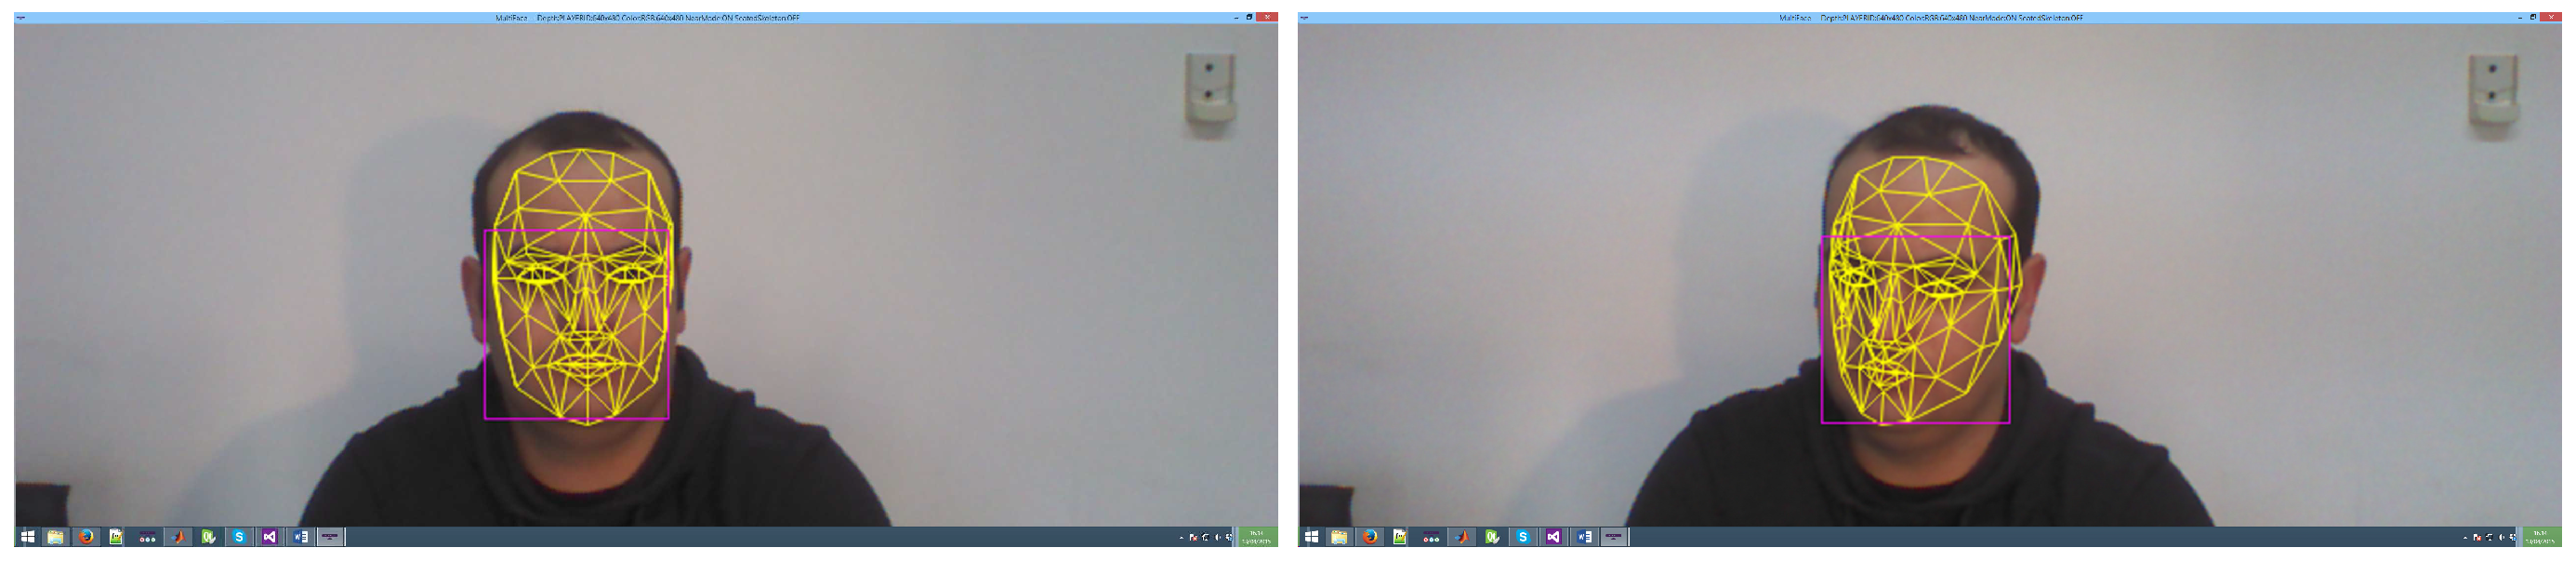
3.1. Head Pose Estimation
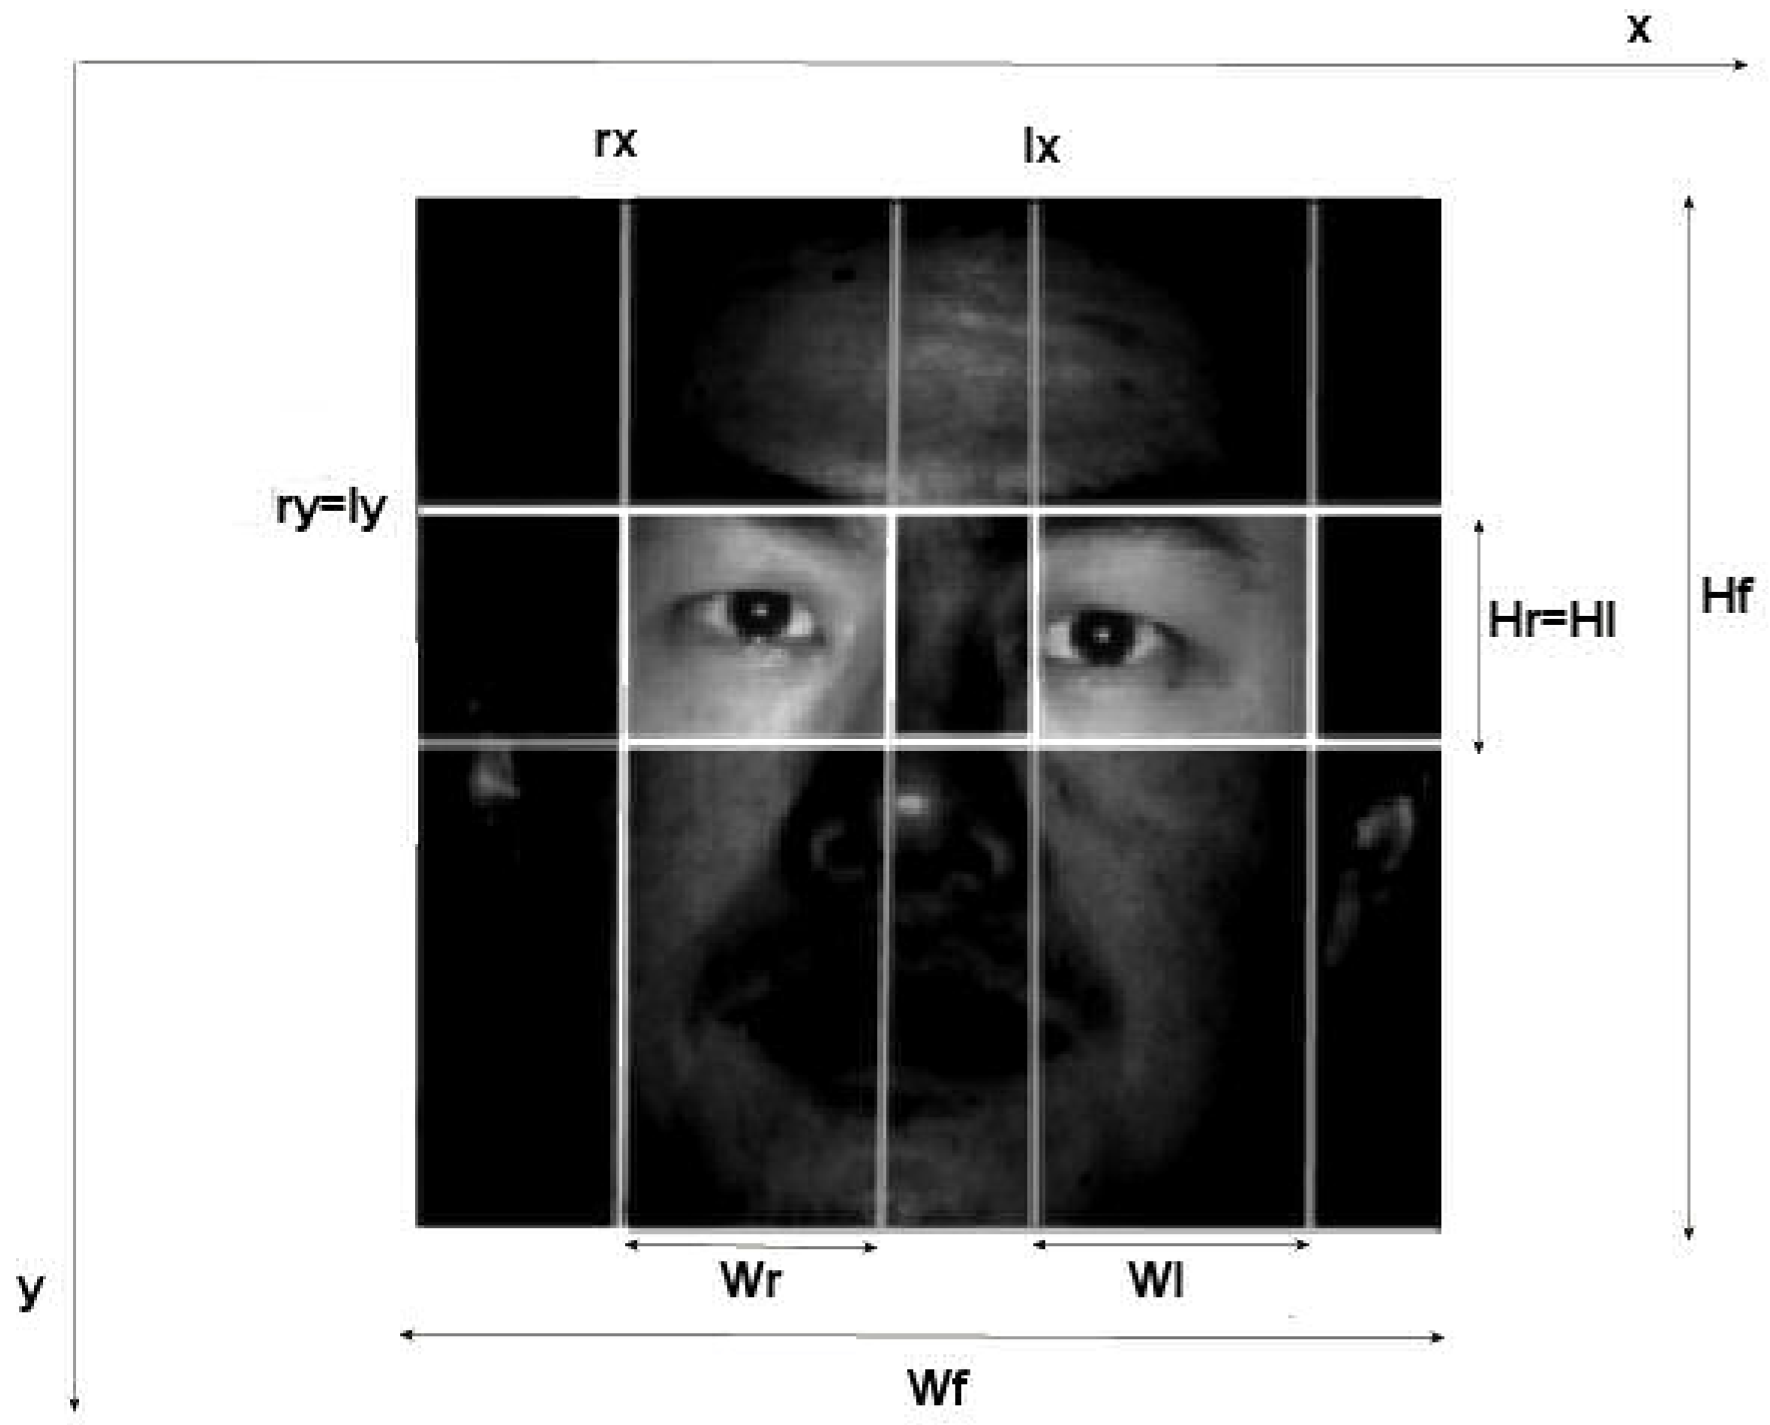
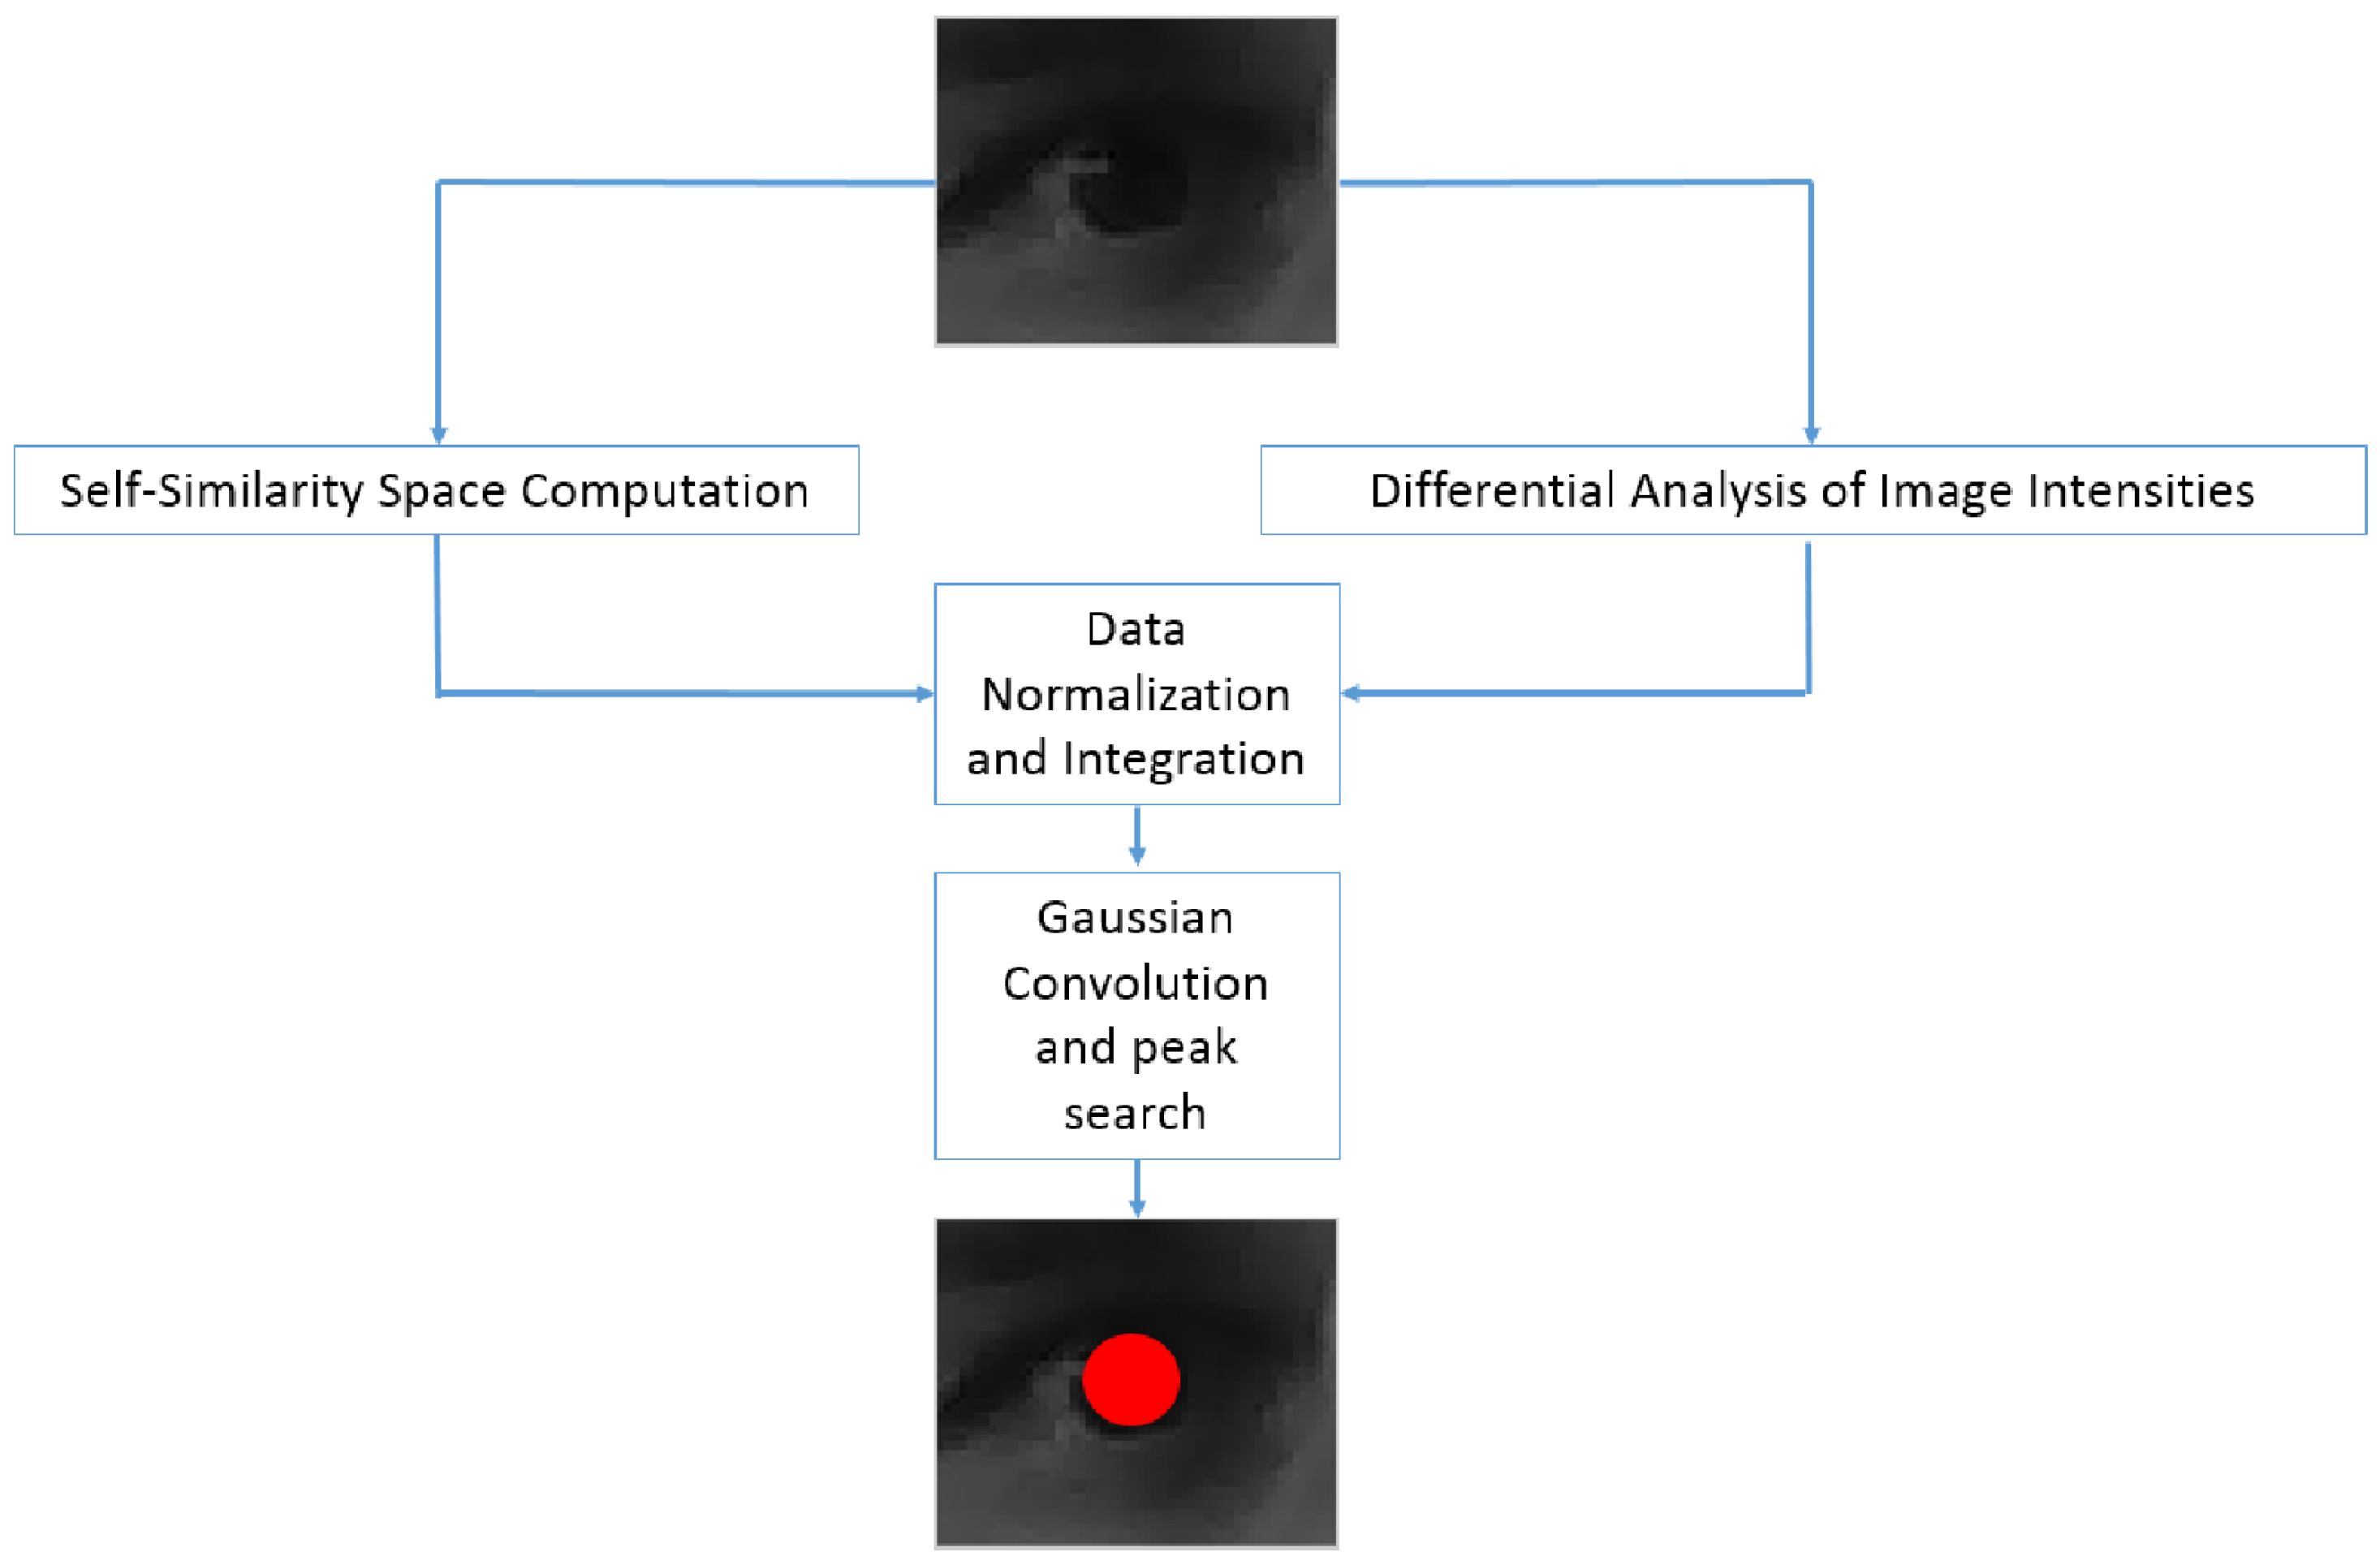
3.2. Pupil Detection
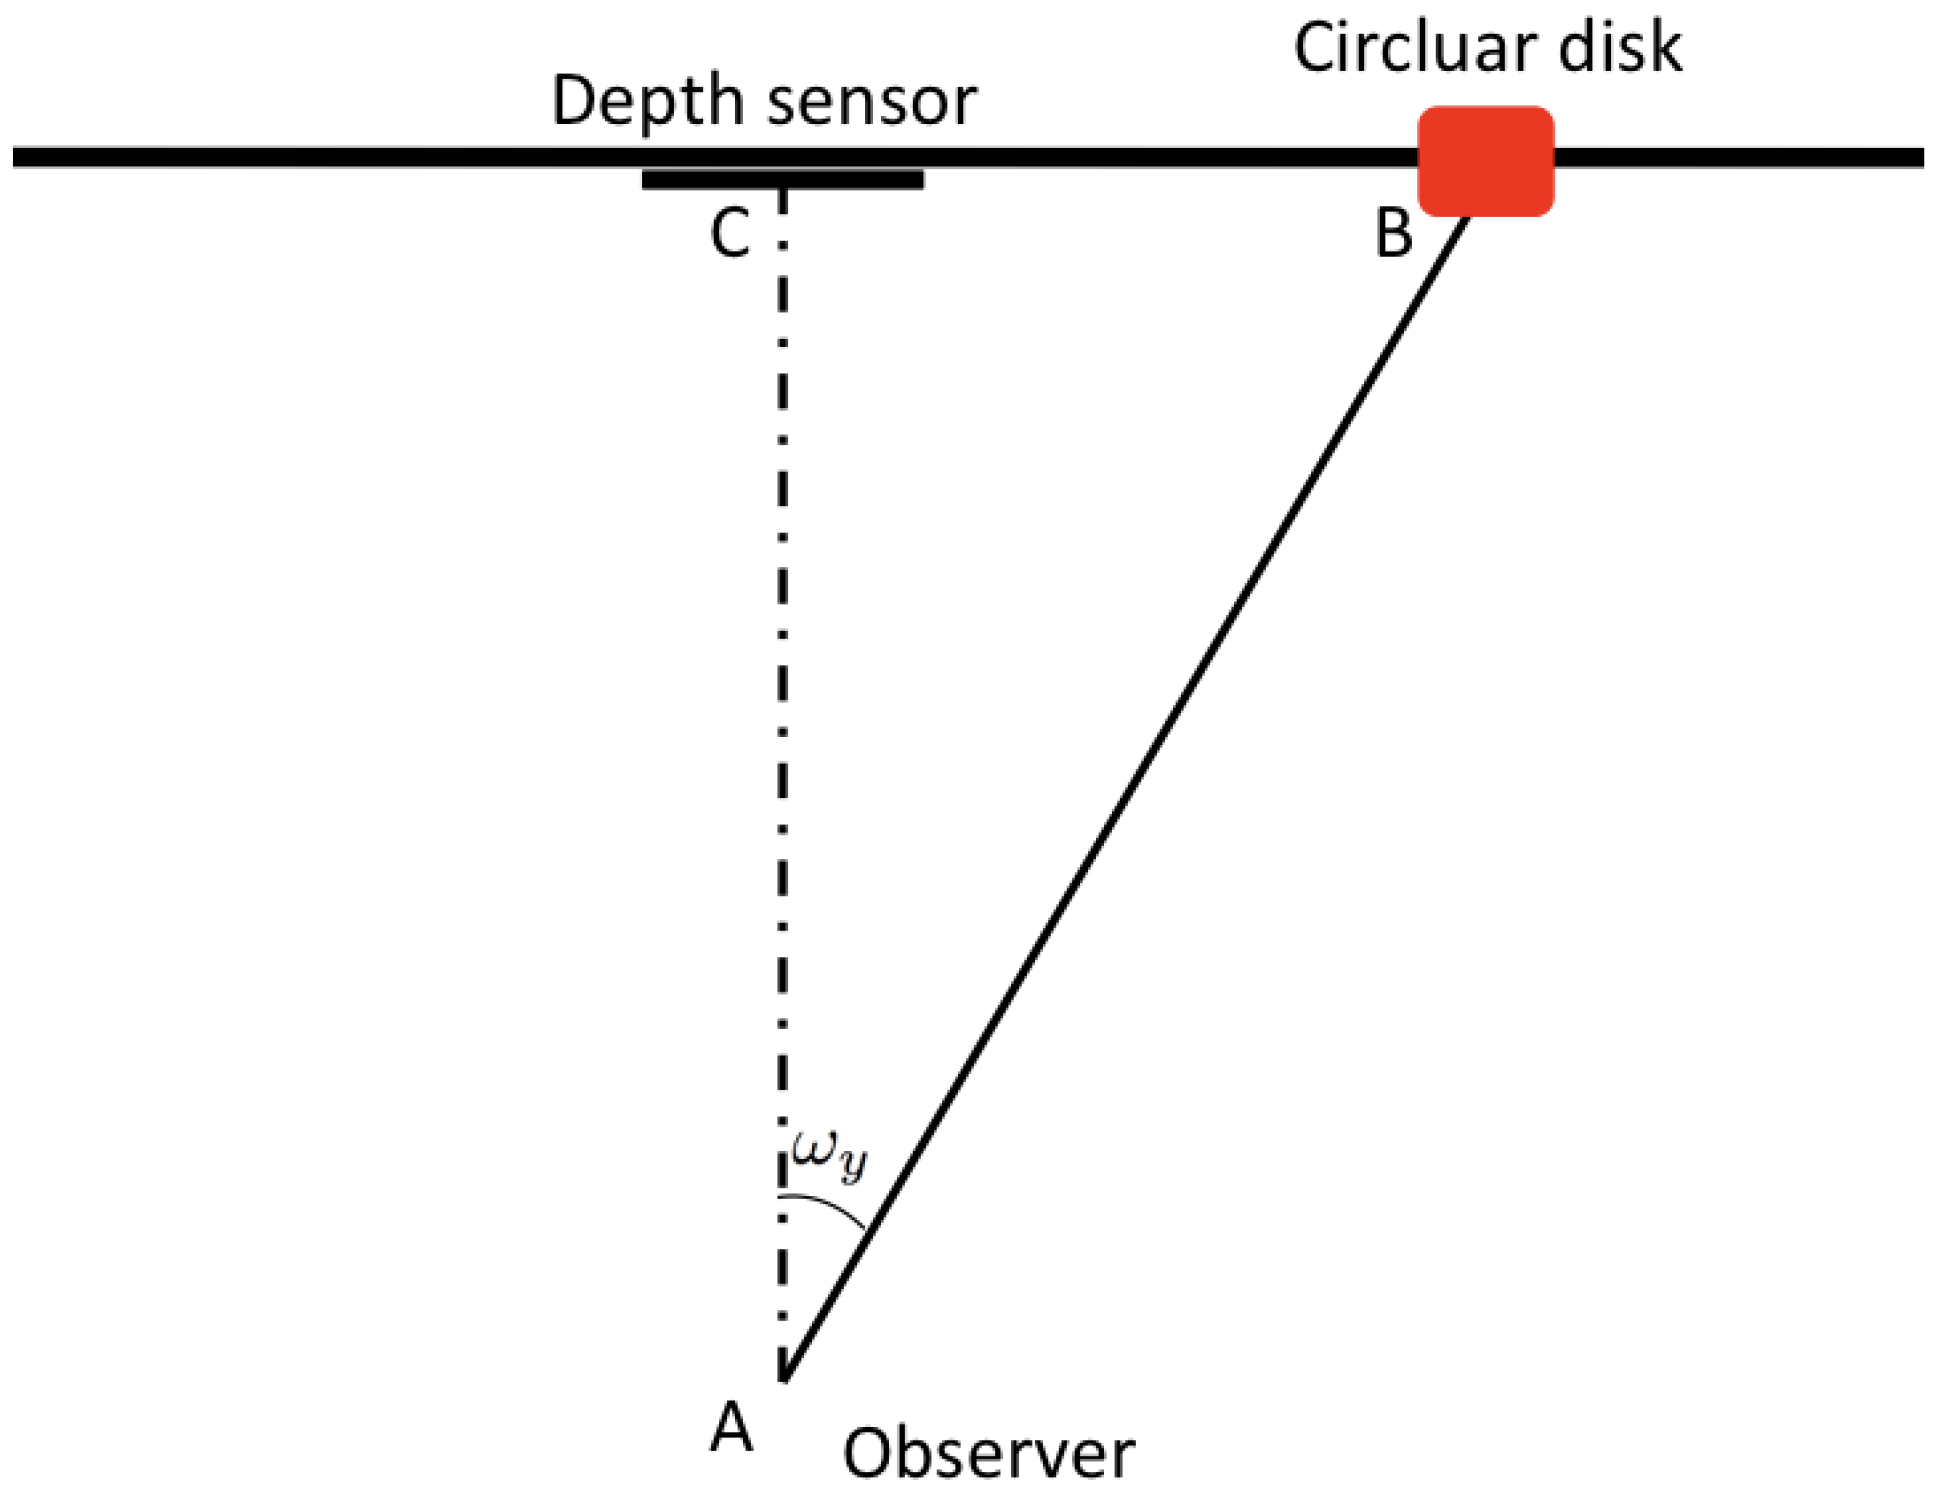
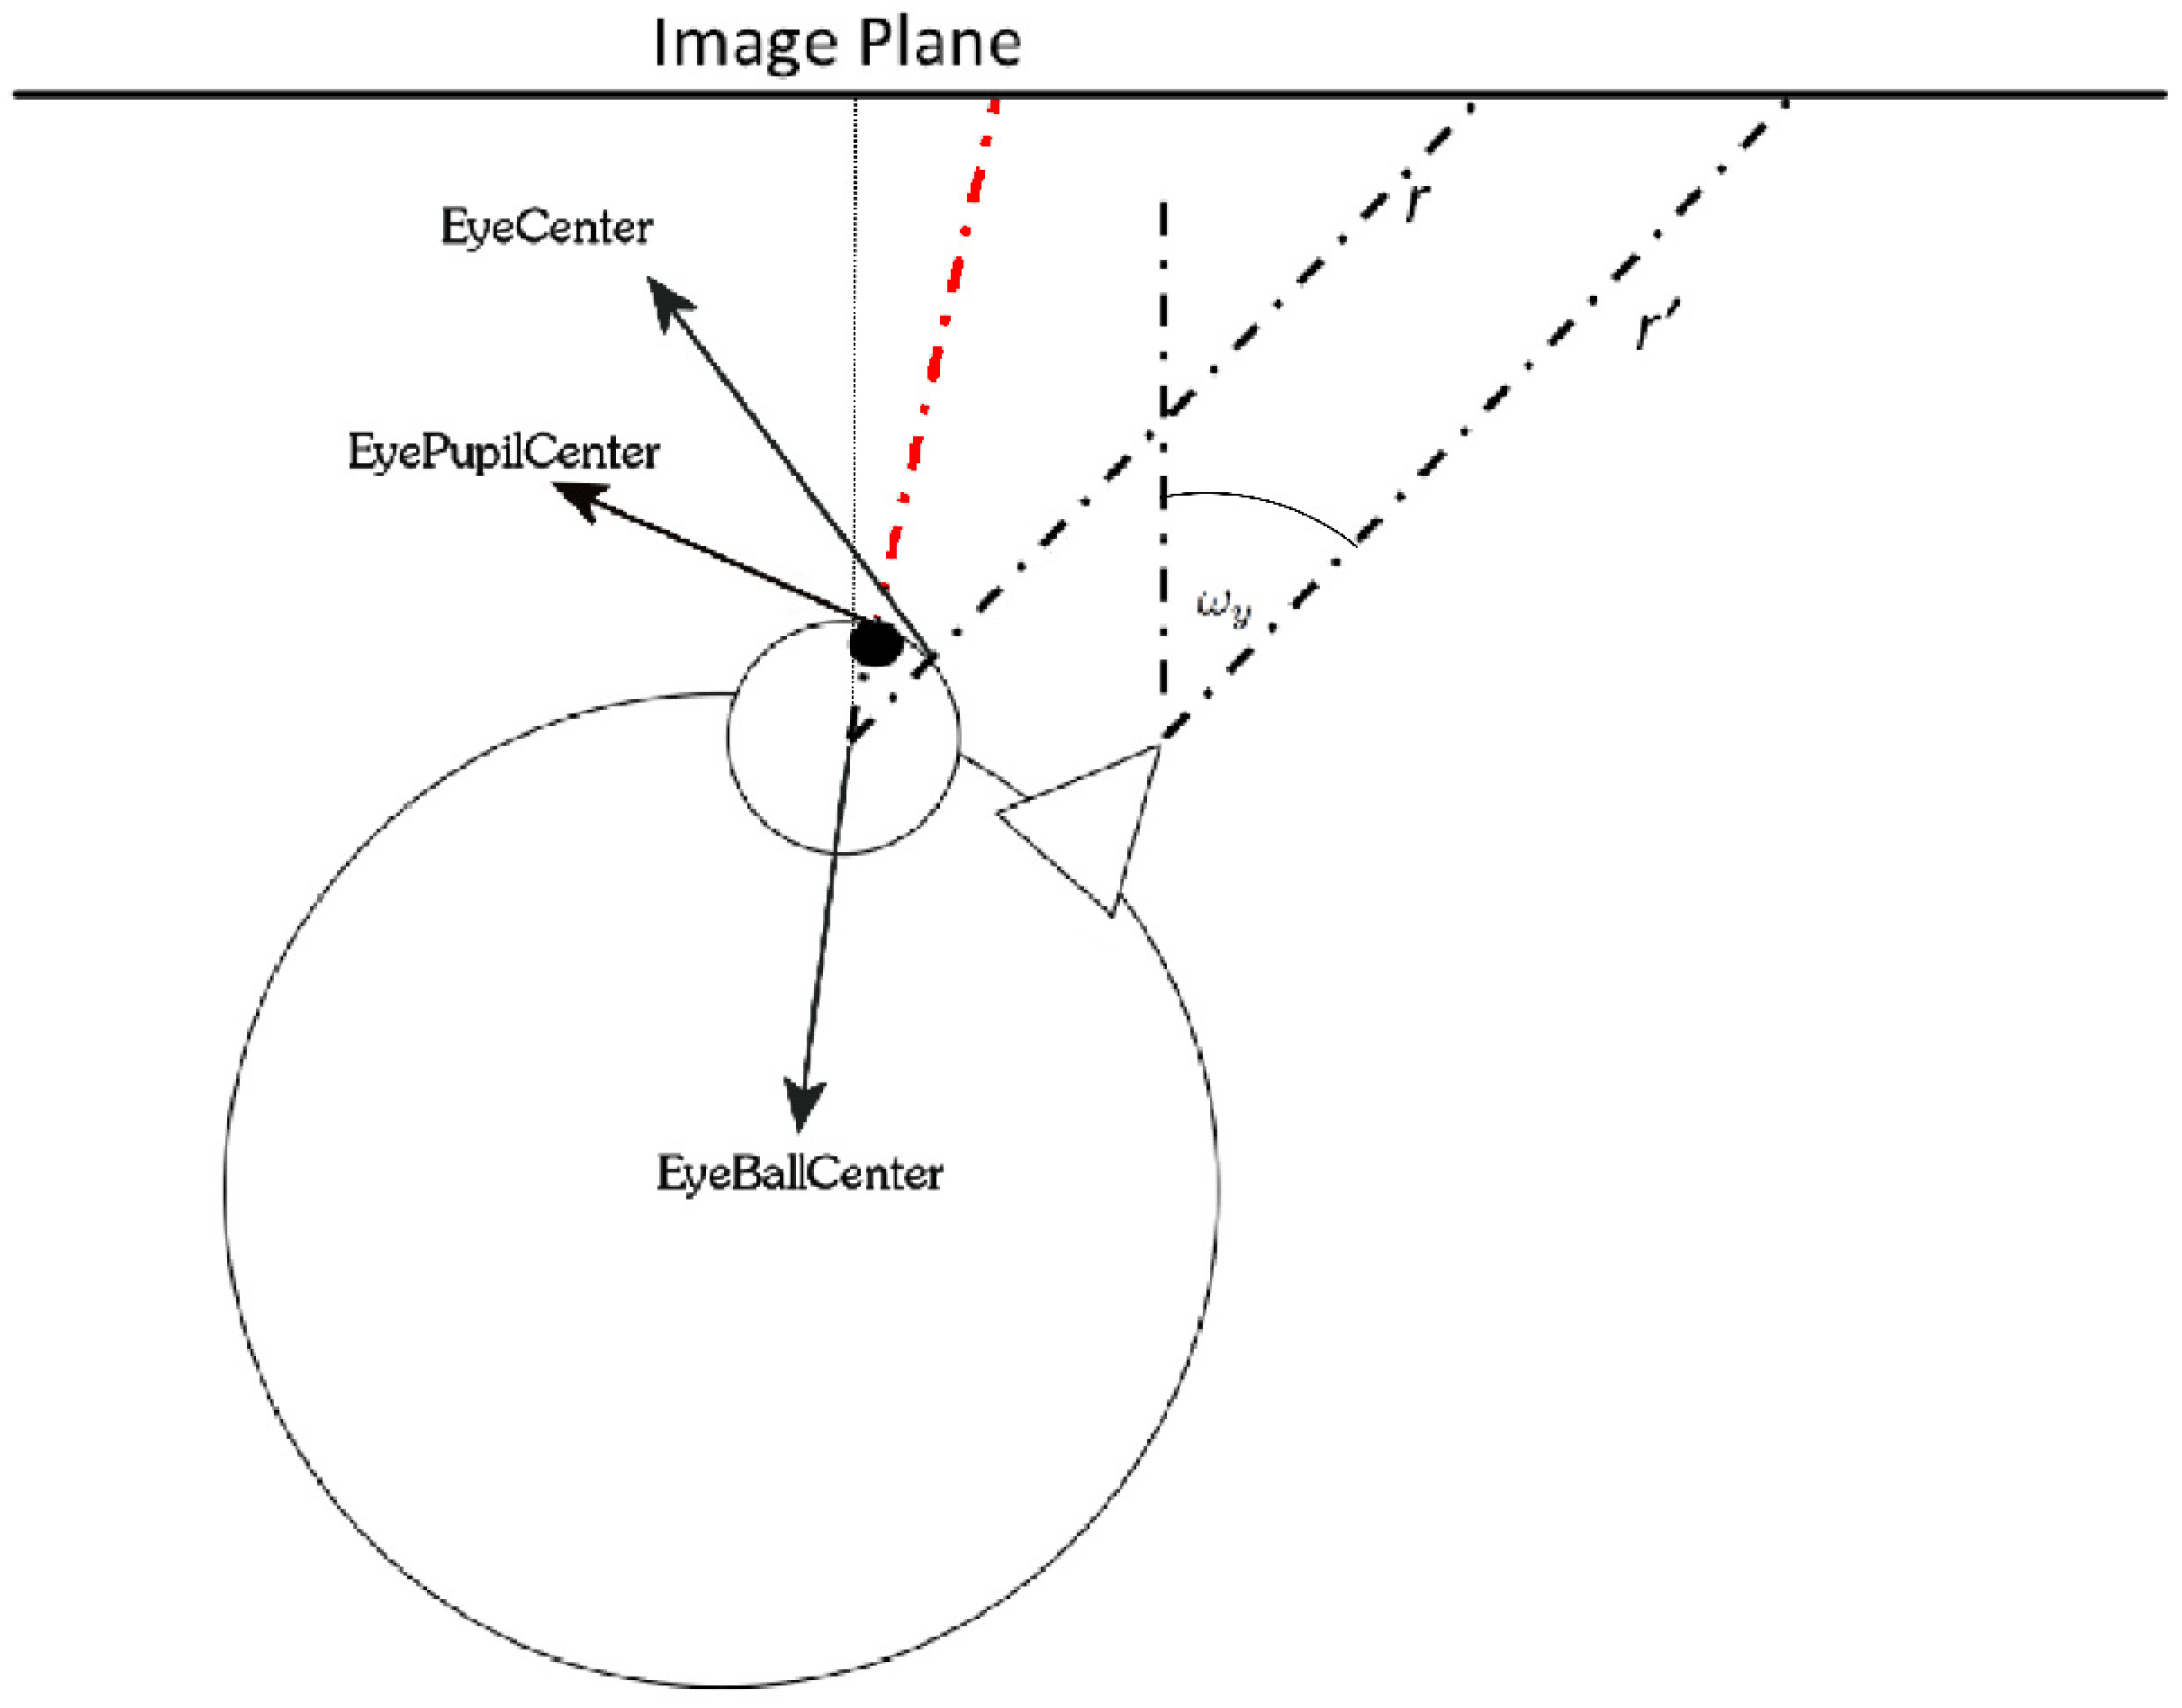
3.3. Gaze Estimation
- Eye center: the 3D coordinates of the center of the eye, on the eye sphere surface; their values are extracted from the 3D overlapped mask, denoted by:
- Pupil center: the 3D coordinates of the center of the eye’s pupil; their values are derived from the pupil detection module, denoted by:
- Eyeball center: the 3D coordinates of the center of the sphere that models the eye; it is a variable that is not visible and whose position can only be estimated, denoted by:
4. Experimental Results and Discussion
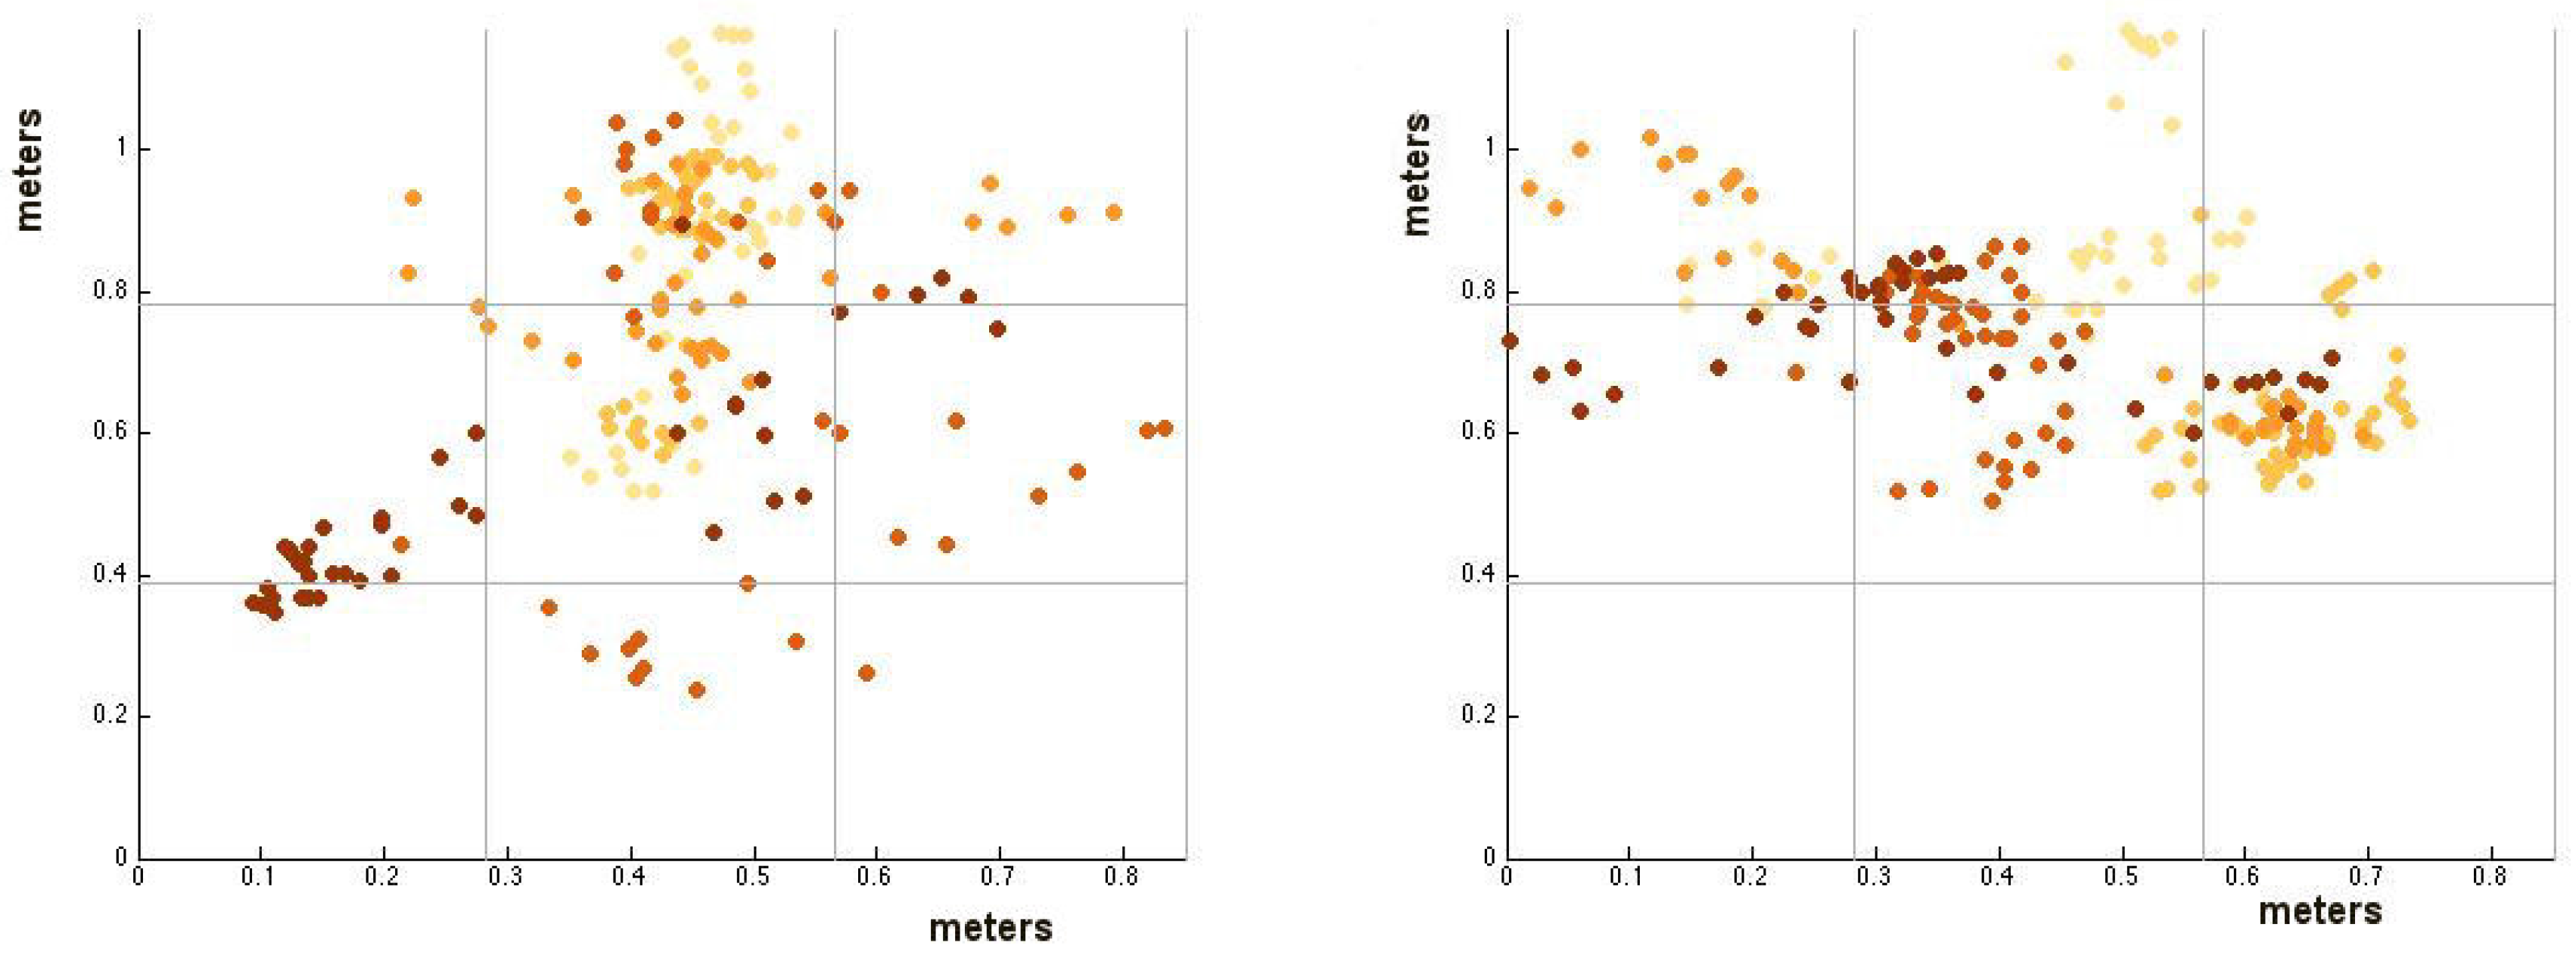
4.1. Evaluation of the System Accuracy
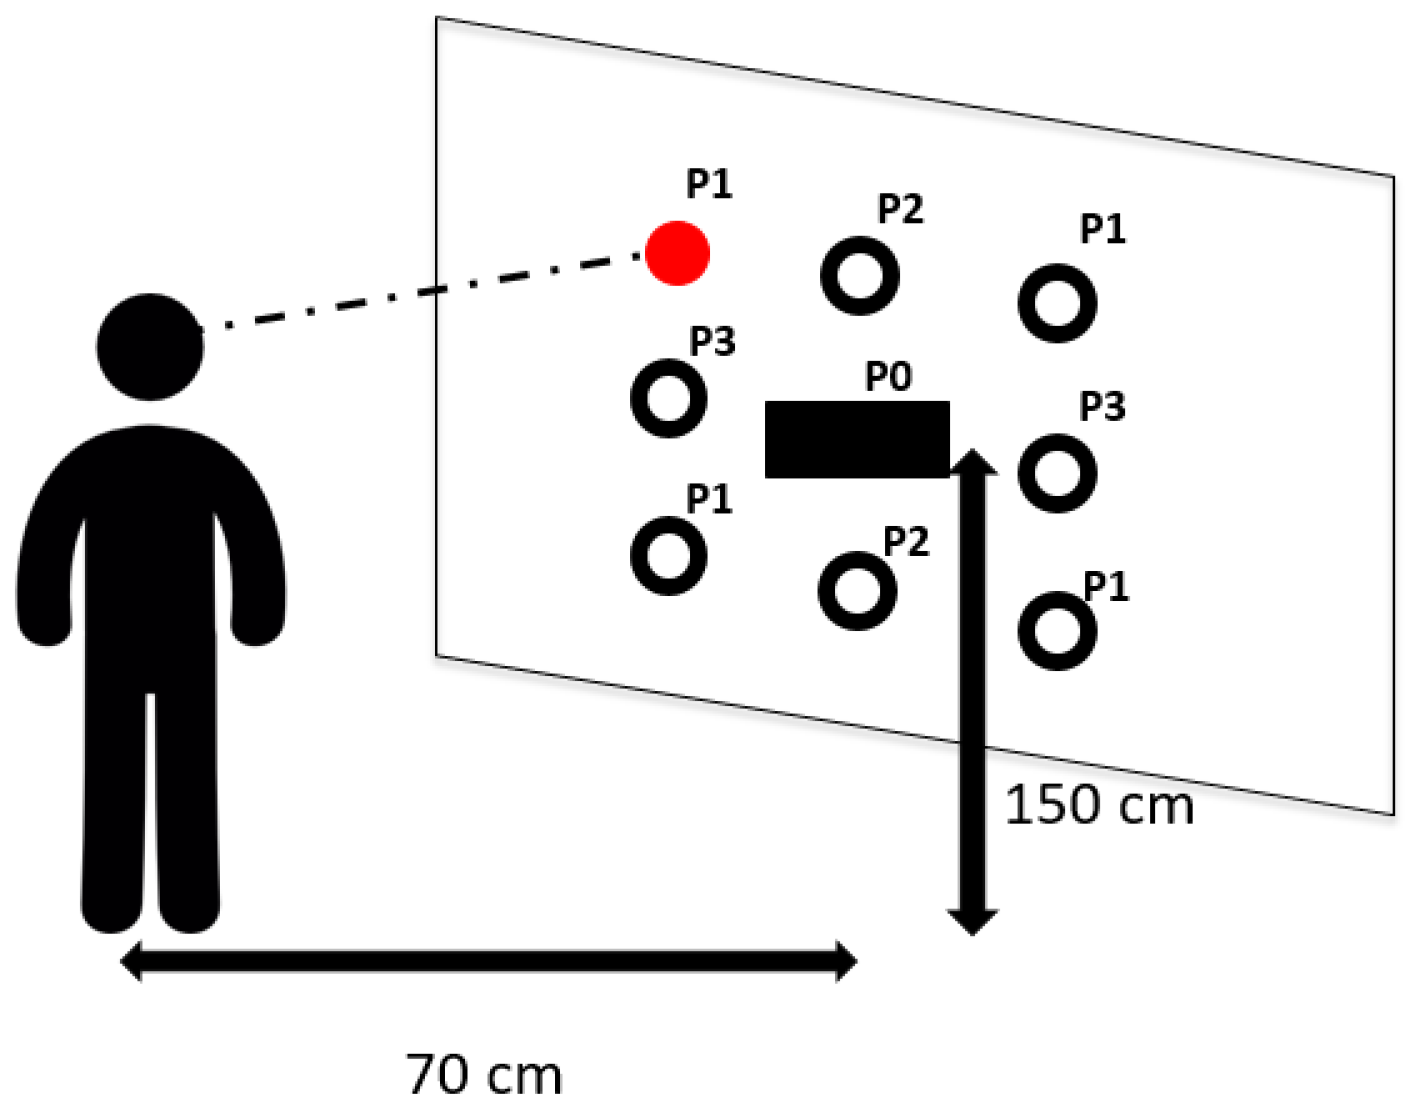
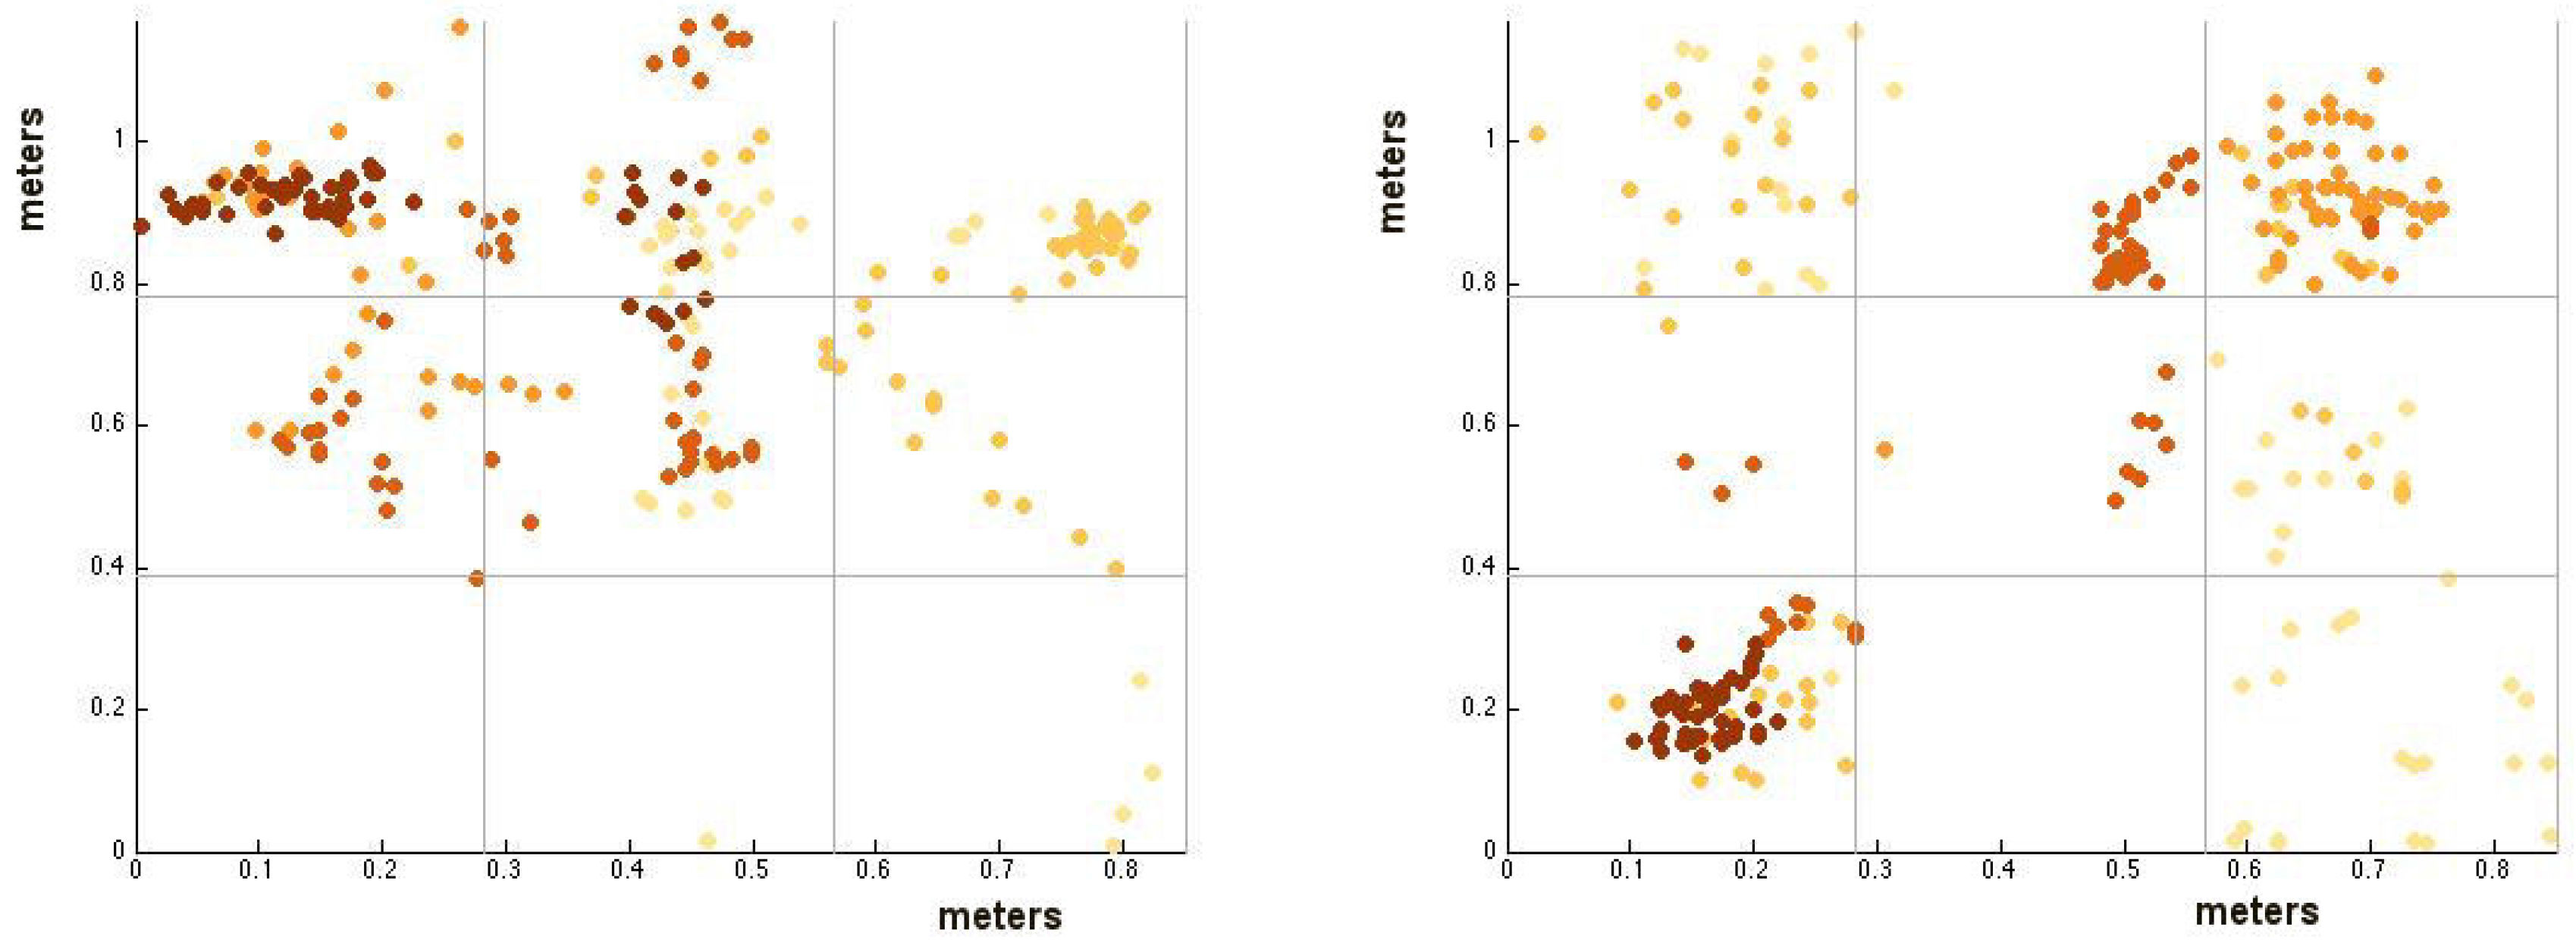
4.2. Exploitation of the System in a Real ASD Treatment Scenario
- Fixation count: the number of fixations on a specific AOI. A fixation was accounted if at least 15 consecutive frames present a hit on the same AOI;
- First fixation: the first AOI on which the system accounts a fixation after closet opening;
- Sequence: the ordered list of AOIs observed by the child in terms of fixations;
- Most viewed toy: the AOI with the highest number of hits.
5. Conclusions
Acknowledgments
Author Contributions
Conflicts of Interest
References
- Leo, M.; Medioni, G.; Trivedi, M.; Kanade, T.; Farinella, G. Computer vision for assistive technologies. Comput. Vis. Image Underst. 2017, 154, 1–15. [Google Scholar] [CrossRef]
- D’orazio, T.; Leo, M.; Distante, A. Eye detection in face images for a driver vigilance system. In Proceedings of the Intelligent Vehicles Symposium, Parma, Italy, 14–17 June 2004; pp. 95–98. [Google Scholar]
- Baron-Cohen, S.; Auyeung, B.; Nørgaard-Pedersen, B.; Hougaard, D.M.; Abdallah, M.W.; Melgaard, L.; Cohen, A.S.; Chakrabarti, B.; Ruta, L.; Lombardo, M.V. Elevated fetal steroidogenic activity in autism. Mol. Psychiatry 2015, 20, 369–376. [Google Scholar] [CrossRef] [PubMed]
- Colombi, C.; Narzisi, A.; Ruta, L.; Cigala, V.; Gagliano, A.; Pioggia, G.; Siracusano, R.; Rogers, S.J.; Muratori, F.; Team, P.P. Implementation of the Early Start Denver Model in an Italian community. Autism 2016. [Google Scholar] [CrossRef] [PubMed]
- Marco, E.J.; Hinkley, L.B.; Hill, S.S.; Nagarajan, S.S. Sensory processing in autism: A review of neurophysiologic findings. Pediatr. Res. 2011, 69, 48R–54R. [Google Scholar] [CrossRef] [PubMed]
- Chita-Tegmark, M. Social attention in ASD: A review and meta-analysis of eye-tracking studies. Res. Dev. Disabil. 2016, 48, 79–93. [Google Scholar] [CrossRef] [PubMed]
- Heaton, T.J.; Freeth, M. Reduced visual exploration when viewing photographic scenes in individuals with autism spectrum disorder. J. Abnorm. Psychol. 2016, 125, 399. [Google Scholar] [CrossRef] [PubMed]
- Elison, J.T.; Sasson, N.J.; Turner-Brown, L.M.; Dichter, G.S.; Bodfish, J.W. Age trends in visual exploration of social and nonsocial information in children with autism. Res. Autism Spectr. Disord. 2012, 6, 842–851. [Google Scholar] [CrossRef] [PubMed]
- Sasson, N.J.; Elison, J.T. Eye tracking young children with autism. J. Vis. Exp. 2012. [Google Scholar] [CrossRef] [PubMed]
- Hochhauser, M.; Grynszpan, O. Methods Investigating How Individuals with Autism Spectrum Disorder Spontaneously Attend to Social Events. Rev. J. Autism Dev. Disord. 2016, 4, 82–93. [Google Scholar] [CrossRef]
- Vismara, L.A.; Rogers, S.J. The Early Start Denver Model: A case study of an innovative practice. J. Early Interv. 2008, 31, 91–108. [Google Scholar] [CrossRef]
- Vivanti, G.; Paynter, J.; Duncan, E.; Fothergill, H.; Dissanayake, C.; Rogers, S.J.; Victorian ASELCC Team. Effectiveness and feasibility of the Early Start Denver Model implemented in a group-based community childcare setting. J. Autism Dev. Disord. 2014, 44, 3140–3153. [Google Scholar] [CrossRef] [PubMed]
- Dawson, G.; Rogers, S.; Munson, J.; Smith, M.; Winter, J.; Greenson, J.; Donaldson, A.; Varley, J. Randomized, controlled trial of an intervention for toddlers with autism: The early start denver model. Pediatrics 2010, 125, e17–e23. [Google Scholar] [CrossRef] [PubMed]
- Rogers, S.J.; Dawson, G. Early Start Denver Model for Young Children with Autism: Promoting Language, Learning, and Engagement; Guilford Press: New York, NY, USA, 2010; p. 299. [Google Scholar]
- Baron-Cohen, S. Perceptual role taking and protodeclarative pointing in autism. Br. J. Dev. Psychol. 1989, 7, 113–127. [Google Scholar] [CrossRef]
- Curcio, F. Sensorimotor functioning and communication in mute autistic children. J. Autism Child. Schizophr. 1978, 8, 281–292. [Google Scholar] [CrossRef] [PubMed]
- Ulke-Kurkcuoglu, B.; Kircaali-Iftar, G. A comparison of the effects of providing activity and material choice to children with autism spectrum disorders. J. Appl. Behav. Anal. 2010, 43, 717–721. [Google Scholar] [CrossRef] [PubMed]
- Lai, M.C.; Lombardo, M.V.; Baron-Cohen, S. Autism. Lancet 2014, 383, 896–910. [Google Scholar] [CrossRef]
- Sivalingam, R.; Cherian, A.; Fasching, J.; Walczak, N.; Bird, N.; Morellas, V.; Murphy, B.; Cullen, K.; Lim, K.; Sapiro, G.; et al. A multi-sensor visual tracking system for behavior monitoring of at-risk children. In Proceedings of the 2012 IEEE International Conference on Robotics and Automation (ICRA), Saint Paul, MN, USA, 14–18 May 2012; pp. 1345–1350. [Google Scholar]
- Rehg, J.M. Behavior Imaging: Using Computer Vision to Study Autism. In Proceedings of the MVA 2011 IAPR Conference on Machine Vision Applications, Nara, Japan, 13–15 June 2011. [Google Scholar]
- Clifford, S.; Young, R.; Williamson, P. Assessing the early characteristics of autistic disorder using video analysis. J. Autism Dev. Disord. 2007, 37, 301–313. [Google Scholar] [CrossRef] [PubMed]
- Baron-Cohen, S.; Cox, A.; Baird, G.; Swettenham, J.; Nightingale, N.; Morgan, K.; Drew, A.; Charman, T. Psychological markers in the detection of autism in infancy in a large population. Br. J. Psychiatry 1996, 168, 158–163. [Google Scholar] [CrossRef] [PubMed]
- Robins, D.L.; Fein, D.; Barton, M. Modified Checklist for Autism in Toddlers, Revised, with Follow-Up (M-CHAT-R/F) TM. 2009. Available online: https://www.autismspeaks.org/sites/default/files/docs/sciencedocs/m-chat/m-chat-r_f.pdf?v=1 (accessed on 1 December 2017).
- Klin, A.; Jones, W.; Schultz, R.; Volkmar, F.; Cohen, D. Visual fixation patterns during viewing of naturalistic social situations as predictors of social competence in individuals with autism. Arch. Gen. Psychiatry 2002, 59, 809–816. [Google Scholar] [CrossRef] [PubMed]
- Shic, F.; Bradshaw, J.; Klin, A.; Scassellati, B.; Chawarska, K. Limited activity monitoring in toddlers with autism spectrum disorder. Brain Res. 2011, 1380, 246–254. [Google Scholar] [CrossRef] [PubMed]
- Noris, B.; Nadel, J.; Barker, M.; Hadjikhani, N.; Billard, A. Investigating gaze of children with ASD in naturalistic settings. PLoS ONE 2012, 7. [Google Scholar] [CrossRef] [PubMed]
- Riby, D.; Hancock, P.J. Looking at movies and cartoons: eye-tracking evidence from Williams syndrome and autism. J. Intellect. Disabil. Res. 2009, 53, 169–181. [Google Scholar] [CrossRef] [PubMed]
- Riby, D.M.; Hancock, P.J. Viewing it differently: Social scene perception in Williams syndrome and autism. Neuropsychologia 2008, 46, 2855–2860. [Google Scholar] [CrossRef] [PubMed]
- Trepagnier, C.; Sebrechts, M.M.; Peterson, R. Atypical face gaze in autism. Cyberpsychol. Behav. 2002, 5, 213–217. [Google Scholar] [CrossRef] [PubMed]
- Ozonoff, S.; Macari, S.; Young, G.S.; Goldring, S.; Thompson, M.; Rogers, S.J. Atypical object exploration at 12 months of age is associated with autism in a prospective sample. Autism 2008, 12, 457–472. [Google Scholar] [CrossRef] [PubMed]
- Sasson, N.J.; Turner-Brown, L.M.; Holtzclaw, T.N.; Lam, K.S.; Bodfish, J.W. Children with autism demonstrate circumscribed attention during passive viewing of complex social and nonsocial picture arrays. Autism Res. 2008, 1, 31–42. [Google Scholar] [CrossRef] [PubMed]
- Hutman, T.; Chela, M.K.; Gillespie-Lynch, K.; Sigman, M. Selective visual attention at twelve months: Signs of autism in early social interactions. J. Autism Dev. Disord. 2012, 42, 487–498. [Google Scholar] [CrossRef] [PubMed]
- Pierce, K.; Conant, D.; Hazin, R.; Stoner, R.; Desmond, J. Preference for geometric patterns early in life as a risk factor for autism. Arch. Gen. Psychiatry 2011, 68, 101–109. [Google Scholar] [CrossRef] [PubMed]
- Noris, B.; Benmachiche, K.; Meynet, J.; Thiran, J.P.; Billard, A.G. Analysis of head-mounted wireless camera videos for early diagnosis of autism. In Computer Recognition Systems 2; Springer: Berlin/Heidelberg, Germany, 2007; pp. 663–670. [Google Scholar]
- Tentori, M.; Hayes, G.R. Designing for interaction immediacy to enhance social skills of children with autism. In Proceedings of the 12th ACM international conference on Ubiquitous computing, Copenhagen, Denmark, 26–29 September 2010; pp. 51–60. [Google Scholar]
- Boraston, Z.; Blakemore, S.J. The application of eye-tracking technology in the study of autism. J. Physiol. 2007, 581, 893–898. [Google Scholar] [CrossRef] [PubMed]
- Lai, M.L.; Tsai, M.J.; Yang, F.Y.; Hsu, C.Y.; Liu, T.C.; Lee, S.W.Y.; Lee, M.H.; Chiou, G.L.; Liang, J.C.; Tsai, C.C. A review of using eye-tracking technology in exploring learning from 2000 to 2012. Educ. Res. Rev. 2013, 10, 90–115. [Google Scholar] [CrossRef]
- Wagner, J.B.; Hirsch, S.B.; Vogel-Farley, V.K.; Redcay, E.; Nelson, C.A. Eye-tracking, autonomic, and electrophysiological correlates of emotional face processing in adolescents with autism spectrum disorder. J. Autism Dev. Disord. 2013, 43, 188–199. [Google Scholar] [CrossRef] [PubMed]
- Dalton, K.M.; Nacewicz, B.M.; Johnstone, T.; Schaefer, H.S.; Gernsbacher, M.A.; Goldsmith, H.; Alexander, A.L.; Davidson, R.J. Gaze fixation and the neural circuitry of face processing in autism. Nat. Neurosci. 2005, 8, 519–526. [Google Scholar]
- Shic, F.; Chawarska, K.; Bradshaw, J.; Scassellati, B. Autism, eye-tracking, entropy. In Proceedings of the 2008 7th IEEE International Conference on Development and Learning, Monterey, CA, USA, 9–12 August 2008; pp. 73–78. [Google Scholar]
- Pelphrey, K.A.; Sasson, N.J.; Reznick, J.S.; Paul, G.; Goldman, B.D.; Piven, J. Visual scanning of faces in autism. J. Autism Dev. Disord. 2002, 32, 249–261. [Google Scholar] [CrossRef] [PubMed]
- Senju, A.; Csibra, G. Gaze following in human infants depends on communicative signals. Curr. Biol. 2008, 18, 668–671. [Google Scholar] [CrossRef] [PubMed]
- Yoder, P.; Stone, W.L.; Walden, T.; Malesa, E. Predicting social impairment and ASD diagnosis in younger siblings of children with autism spectrum disorder. J. Autism Dev. Disord. 2009, 39, 1381–1391. [Google Scholar] [CrossRef] [PubMed]
- Dawson, G.; Toth, K.; Abbott, R.; Osterling, J.; Munson, J.; Estes, A.; Liaw, J. Early social attention impairments in autism: Social orienting, joint attention, and attention to distress. Dev. Psychol. 2004, 40, 271. [Google Scholar] [CrossRef] [PubMed]
- Guillon, Q.; Hadjikhani, N.; Baduel, S.; Rogé, B. Visual social attention in autism spectrum disorder: Insights from eye tracking studies. Neurosci. Biobehav. Rev. 2014, 42, 279–297. [Google Scholar] [CrossRef] [PubMed]
- Nakano, T.; Tanaka, K.; Endo, Y.; Yamane, Y.; Yamamoto, T.; Nakano, Y.; Ohta, H.; Kato, N.; Kitazawa, S. Atypical gaze patterns in children and adults with autism spectrum disorders dissociated from developmental changes in gaze behaviour. Proc. R. Soc. Lond. B Biol. Sci. 2010. [Google Scholar] [CrossRef] [PubMed]
- Von Hofsten, C.; Uhlig, H.; Adell, M.; Kochukhova, O. How children with autism look at events. Res. Autism Spectr. Disord. 2009, 3, 556–569. [Google Scholar] [CrossRef]
- Falck-Ytter, T.; Fernell, E.; Gillberg, C.; Von Hofsten, C. Face scanning distinguishes social from communication impairments in autism. Dev. Sci. 2010, 13, 864–875. [Google Scholar] [CrossRef] [PubMed]
- Nyström, M.; Hooge, I.; Andersson, R. Pupil size influences the eye-tracker signal during saccades. Vis. Res. 2016, 121, 95–103. [Google Scholar] [CrossRef] [PubMed]
- Franchak, J.M.; Kretch, K.S.; Soska, K.C.; Adolph, K.E. Head-mounted eye tracking: A new method to describe infant looking. Child Dev. 2011, 82, 1738–1750. [Google Scholar] [CrossRef] [PubMed]
- Noris, B.; Keller, J.B.; Billard, A. A wearable gaze tracking system for children in unconstrained environments. Comput. Vis. Image Underst. 2011, 115, 476–486. [Google Scholar] [CrossRef]
- Parés, N.; Carreras, A.; Durany, J.; Ferrer, J.; Freixa, P.; Gómez, D.; Kruglanski, O.; Parés, R.; Ribas, J.I.; Soler, M.; et al. Promotion of creative activity in children with severe autism through visuals in an interactive multisensory environment. In Proceedings of the 2005 Conference on Interaction Design and Children, Boulder, CO, USA, 8–10 June 2005; pp. 110–116. [Google Scholar]
- Cazzato, D.; Evangelista, A.; Leo, M.; Carcagnì, P.; Distante, C. A low-cost and calibration-free gaze estimator for soft biometrics: An explorative study. Pattern Recognit. Lett. 2016, 82, 196–206. [Google Scholar] [CrossRef]
- Fuhl, W.; Tonsen, M.; Bulling, A.; Kasneci, E. Pupil detection for head-mounted eye tracking in the wild: An evaluation of the state of the art. Mach. Vis. Appl. 2016, 27, 1275–1288. [Google Scholar] [CrossRef]
- De Beugher, S.; Brône, G.; Goedemé, T. Automatic analysis of in-the-wild mobile eye-tracking experiments. In Proceedings of the First International Workshop on Egocentric Perception, Interaction and Computing, Amsterdam, The Netherlands, 9 October 2016; Volume 1. [Google Scholar]
- Wen, Q.; Xu, F.; Yong, J.H. Real-time 3D Eye Performance Reconstruction for RGBD Cameras. IEEE Trans. Vis. Comput. Graph. 2017, 23, 2586–2598. [Google Scholar] [CrossRef] [PubMed]
- Brey, P. Freedom and privacy in ambient intelligence. Ethics Inf. Technol. 2005, 7, 157–166. [Google Scholar] [CrossRef]
- Langheinrich, M. Privacy by design—Principles of privacy-aware ubiquitous systems. In Proceedings of the International Conference on Ubiquitous Computing, Atlanta, GA, USA, 30 September–2 October 2001; Springer: Berlin/Heidelberg, Germany, 2001; pp. 273–291. [Google Scholar]
- Stiefelhagen, R.; Zhu, J. Head orientation and gaze direction in meetings. In Proceedings of the CHI’02 Extended Abstracts on Human Factors in Computing Systems, Minneapolis, MN, USA, 20–25 April 2002; pp. 858–859. [Google Scholar]
- Cootes, T.F.; Edwards, G.J.; Taylor, C.J. Active appearance models. IEEE Trans. Pattern Anal. Mach. Intell. 2001, 23, 681–685. [Google Scholar] [CrossRef]
- Besl, P.J.; McKay, N.D. Method for registration of 3-D shapes. Robotics-DL Tentative; International Society for Optics and Photonics: Bellingham, WA, USA, 1992; pp. 586–606. [Google Scholar]
- Ahlberg, J. Candide-3-an updated parameterised face. Citeseer, January 2001; 1–16. [Google Scholar]
- Xiao, J.; Moriyama, T.; Kanade, T.; Cohn, J.F. Robust full-motion recovery of head by dynamic templates and re-registration techniques. Int. J. Imaging Syst. Technol. 2003, 13, 85–94. [Google Scholar] [CrossRef] [PubMed]
- Basu, S.; Essa, I.; Pentland, A. Motion regularization for model-based head tracking. In Proceedings of the 13th International Conference on Pattern Recognition, Vienna, Austria, 25–29 August 1996; Volume 3, pp. 611–616. [Google Scholar]
- Sun, L.; Liu, Z.; Sun, M.T. Real time gaze estimation with a consumer depth camera. Inf. Sci. 2015, 320, 346–360. [Google Scholar] [CrossRef]
- Xiong, X.; Cai, Q.; Liu, Z.; Zhang, Z. Eye gaze tracking using an RGBD camera: A comparison with a RGB solution. In Proceedings of the 2014 ACM International Joint Conference on Pervasive and Ubiquitous Computing: Adjunct Publication, Seattle, WA, USA, 13–17 September 2014; pp. 1113–1121. [Google Scholar]
- Wass, S.V.; Jones, E.J.; Gliga, T.; Smith, T.J.; Charman, T.; Johnson, M.H.; BASIS Team. Shorter spontaneous fixation durations in infants with later emerging autism. Sci. Rep. 2015, 5. [Google Scholar] [CrossRef] [PubMed]
- Richards, J.E. The development of attention to simple and complex visual stimuli in infants: Behavioral and psychophysiological measures. Dev. Rev. 2010, 30, 203–219. [Google Scholar] [CrossRef] [PubMed]
- Rickham, P. Human experimentation. Code of ethics of the world medical association: Declaration of Helsinki. Br. Med. J. 1964, 2, 177. [Google Scholar] [PubMed]
- Huntley, M. The Griffiths Mental Development Scales: From Birth to 2 Years; Association for Research in Infant and Child Development (ARICD): Oxford, UK, 1996. [Google Scholar]
- Luiz, D.; Foxcroft, C.; Stewart, R. The construct validity of the Griffiths Scales of Mental Development. Child Care Health Dev. 2001, 27, 73–83. [Google Scholar] [CrossRef] [PubMed]
- Boyd, B.A.; McDonough, S.G.; Bodfish, J.W. Evidence-based behavioral interventions for repetitive behaviors in autism. J. Autism Dev. Disord. 2012, 42, 1236–1248. [Google Scholar] [CrossRef] [PubMed]
- Adrien, J.; Perrot, A.; Hameury, L.; Martineau, J.; Roux, S.; Sauvage, D. Family home movies: Identification of early autistic signs in infants later diagnosed as autistics. Brain Dysfunct. 1991, 4, 355–362. [Google Scholar]


| Errors (deg) | |||||
|---|---|---|---|---|---|
| x | y | Std x | Std y | ||
| P0 | Frontal | 0.99 | 1.23 | 0.30 | 0.52 |
| Left | 1.05 | 1.43 | 0.40 | 0.66 | |
| Right | 1.25 | 1.98 | 0.43 | 0.78 | |
| P1 | Frontal | 4.22 | 3.92 | 1.66 | 1.88 |
| Left | 4.80 | 4.33 | 1.83 | 2.04 | |
| Right | 6.00 | 5.07 | 2.31 | 2.14 | |
| P2 | Frontal | 3.50 | 1.80 | 1.06 | 1.28 |
| Left | 3.77 | 1.99 | 1.09 | 1.31 | |
| Right | 4.98 | 2.16 | 1.12 | 1.44 | |
| P3 | Frontal | 1.89 | 2.21 | 0.80 | 0.77 |
| Left | 2.03 | 2.83 | 1.33 | 1.44 | |
| Right | 3.09 | 4.37 | 2.01 | 2.15 | |
| Average | Frontal | 2.46 | 2.29 | 0.95 | 1.11 |
| Left | 2.91 | 2.00 | 1.16 | 1.36 | |
| Right | 3.83 | 3.39 | 1.46 | 1.60 | |
| Errors (deg) | |||||
|---|---|---|---|---|---|
| x | y | Std x | Std y | ||
| P0 | Frontal | 1.04 | 1.27 | 0.38 | 0.60 |
| Left | 1.11 | 1.42 | 0.48 | 0.71 | |
| Right | 1.31 | 1.99 | 0.47 | 0.82 | |
| P1 | Frontal | 4.34 | 3.95 | 1.68 | 1.90 |
| Left | 5.04 | 4.63 | 1.86 | 1.99 | |
| Right | 6.35 | 5.18 | 2.41 | 2.44 | |
| P2 | Frontal | 3.57 | 1.89 | 1.06 | 1.31 |
| Left | 4.01 | 2.05 | 1.19 | 1.34 | |
| Right | 5.00 | 2.19 | 1.19 | 1.47 | |
| P3 | Frontal | 2.10 | 2.29 | 0.88 | 0.79 |
| Left | 2.01 | 2.88 | 1.39 | 1.50 | |
| Right | 3.17 | 4.43 | 2.13 | 2.18 | |
| Average | Frontal | 2.76 | 2.35 | 1.00 | 1.15 |
| Left | 3.04 | 2.24 | 1.23 | 1.38 | |
| Right | 3.95 | 3.44 | 1.55 | 1.72 | |
| Child | Gender | Age (months) | Griffith’s Developmental Scale |
|---|---|---|---|
| #1 | Male | 68 | 92 |
| #2 | Male | 80 | 85 |
| #3 | Male | 79 | 86 |
| Sector | Child 1 | Child 2 | Child 3 A | Child 3 B |
|---|---|---|---|---|
| #1 | 2 | 26 | 67 | 33 |
| #2 | 82 | 51 | 44 | 30 |
| #3 | 10 | 8 | 33 | 60 |
| #4 | 20 | 13 | 23 | 4 |
| #5 | 46 | 47 | 41 | 8 |
| #6 | 10 | 62 | 12 | 17 |
| #7 | 17 | 0 | 1 | 75 |
| #8 | 9 | 0 | 1 | 1 |
| #9 | 1 | 0 | 4 | 20 |
| Metric | Child 1 | Child 2 | Child 3 A | Child 3 B |
|---|---|---|---|---|
| Fixation Count | 4 | 4 | 7 | 9 |
| Sequence | 5-2-5-7 | 2-1-5-6 | 5-2-3-5-4-2-1 | 1-9-6-3-1-7-3-2-7 |
| First Fixation Cell | 5 | 2 | 5 | 1 |
| Selected Toy | 7 | 4 | 1 | 7 |
| Most Viewed Toy | 2 | 6 | 1 | 7 |
| Total Number of Hits | Hits in the Uncertainty Regions | Uncertainty Ratio | |
|---|---|---|---|
| Child 1 | 197 | 25 | 12% |
| Child 2 | 207 | 28 | 13% |
| Child 3A | 226 | 22 | 9.7% |
| Child 3B | 248 | 18 | 7.2% |
© 2017 by the authors. Licensee MDPI, Basel, Switzerland. This article is an open access article distributed under the terms and conditions of the Creative Commons Attribution (CC BY) license (http://creativecommons.org/licenses/by/4.0/).
Share and Cite
Cazzato, D.; Leo, M.; Distante, C.; Crifaci, G.; Bernava, G.M.; Ruta, L.; Pioggia, G.; Castro, S.M. An Ecological Visual Exploration Tool to Support the Analysis of Visual Processing Pathways in Children with Autism Spectrum Disorders. J. Imaging 2018, 4, 9. https://doi.org/10.3390/jimaging4010009
Cazzato D, Leo M, Distante C, Crifaci G, Bernava GM, Ruta L, Pioggia G, Castro SM. An Ecological Visual Exploration Tool to Support the Analysis of Visual Processing Pathways in Children with Autism Spectrum Disorders. Journal of Imaging. 2018; 4(1):9. https://doi.org/10.3390/jimaging4010009
Chicago/Turabian StyleCazzato, Dario, Marco Leo, Cosimo Distante, Giulia Crifaci, Giuseppe Massimo Bernava, Liliana Ruta, Giovanni Pioggia, and Silvia M. Castro. 2018. "An Ecological Visual Exploration Tool to Support the Analysis of Visual Processing Pathways in Children with Autism Spectrum Disorders" Journal of Imaging 4, no. 1: 9. https://doi.org/10.3390/jimaging4010009
APA StyleCazzato, D., Leo, M., Distante, C., Crifaci, G., Bernava, G. M., Ruta, L., Pioggia, G., & Castro, S. M. (2018). An Ecological Visual Exploration Tool to Support the Analysis of Visual Processing Pathways in Children with Autism Spectrum Disorders. Journal of Imaging, 4(1), 9. https://doi.org/10.3390/jimaging4010009