Application of High-Dynamic Range Imaging Techniques in Architecture: A Step toward High-Quality Daylit Interiors?


Abstract
:1. Introduction
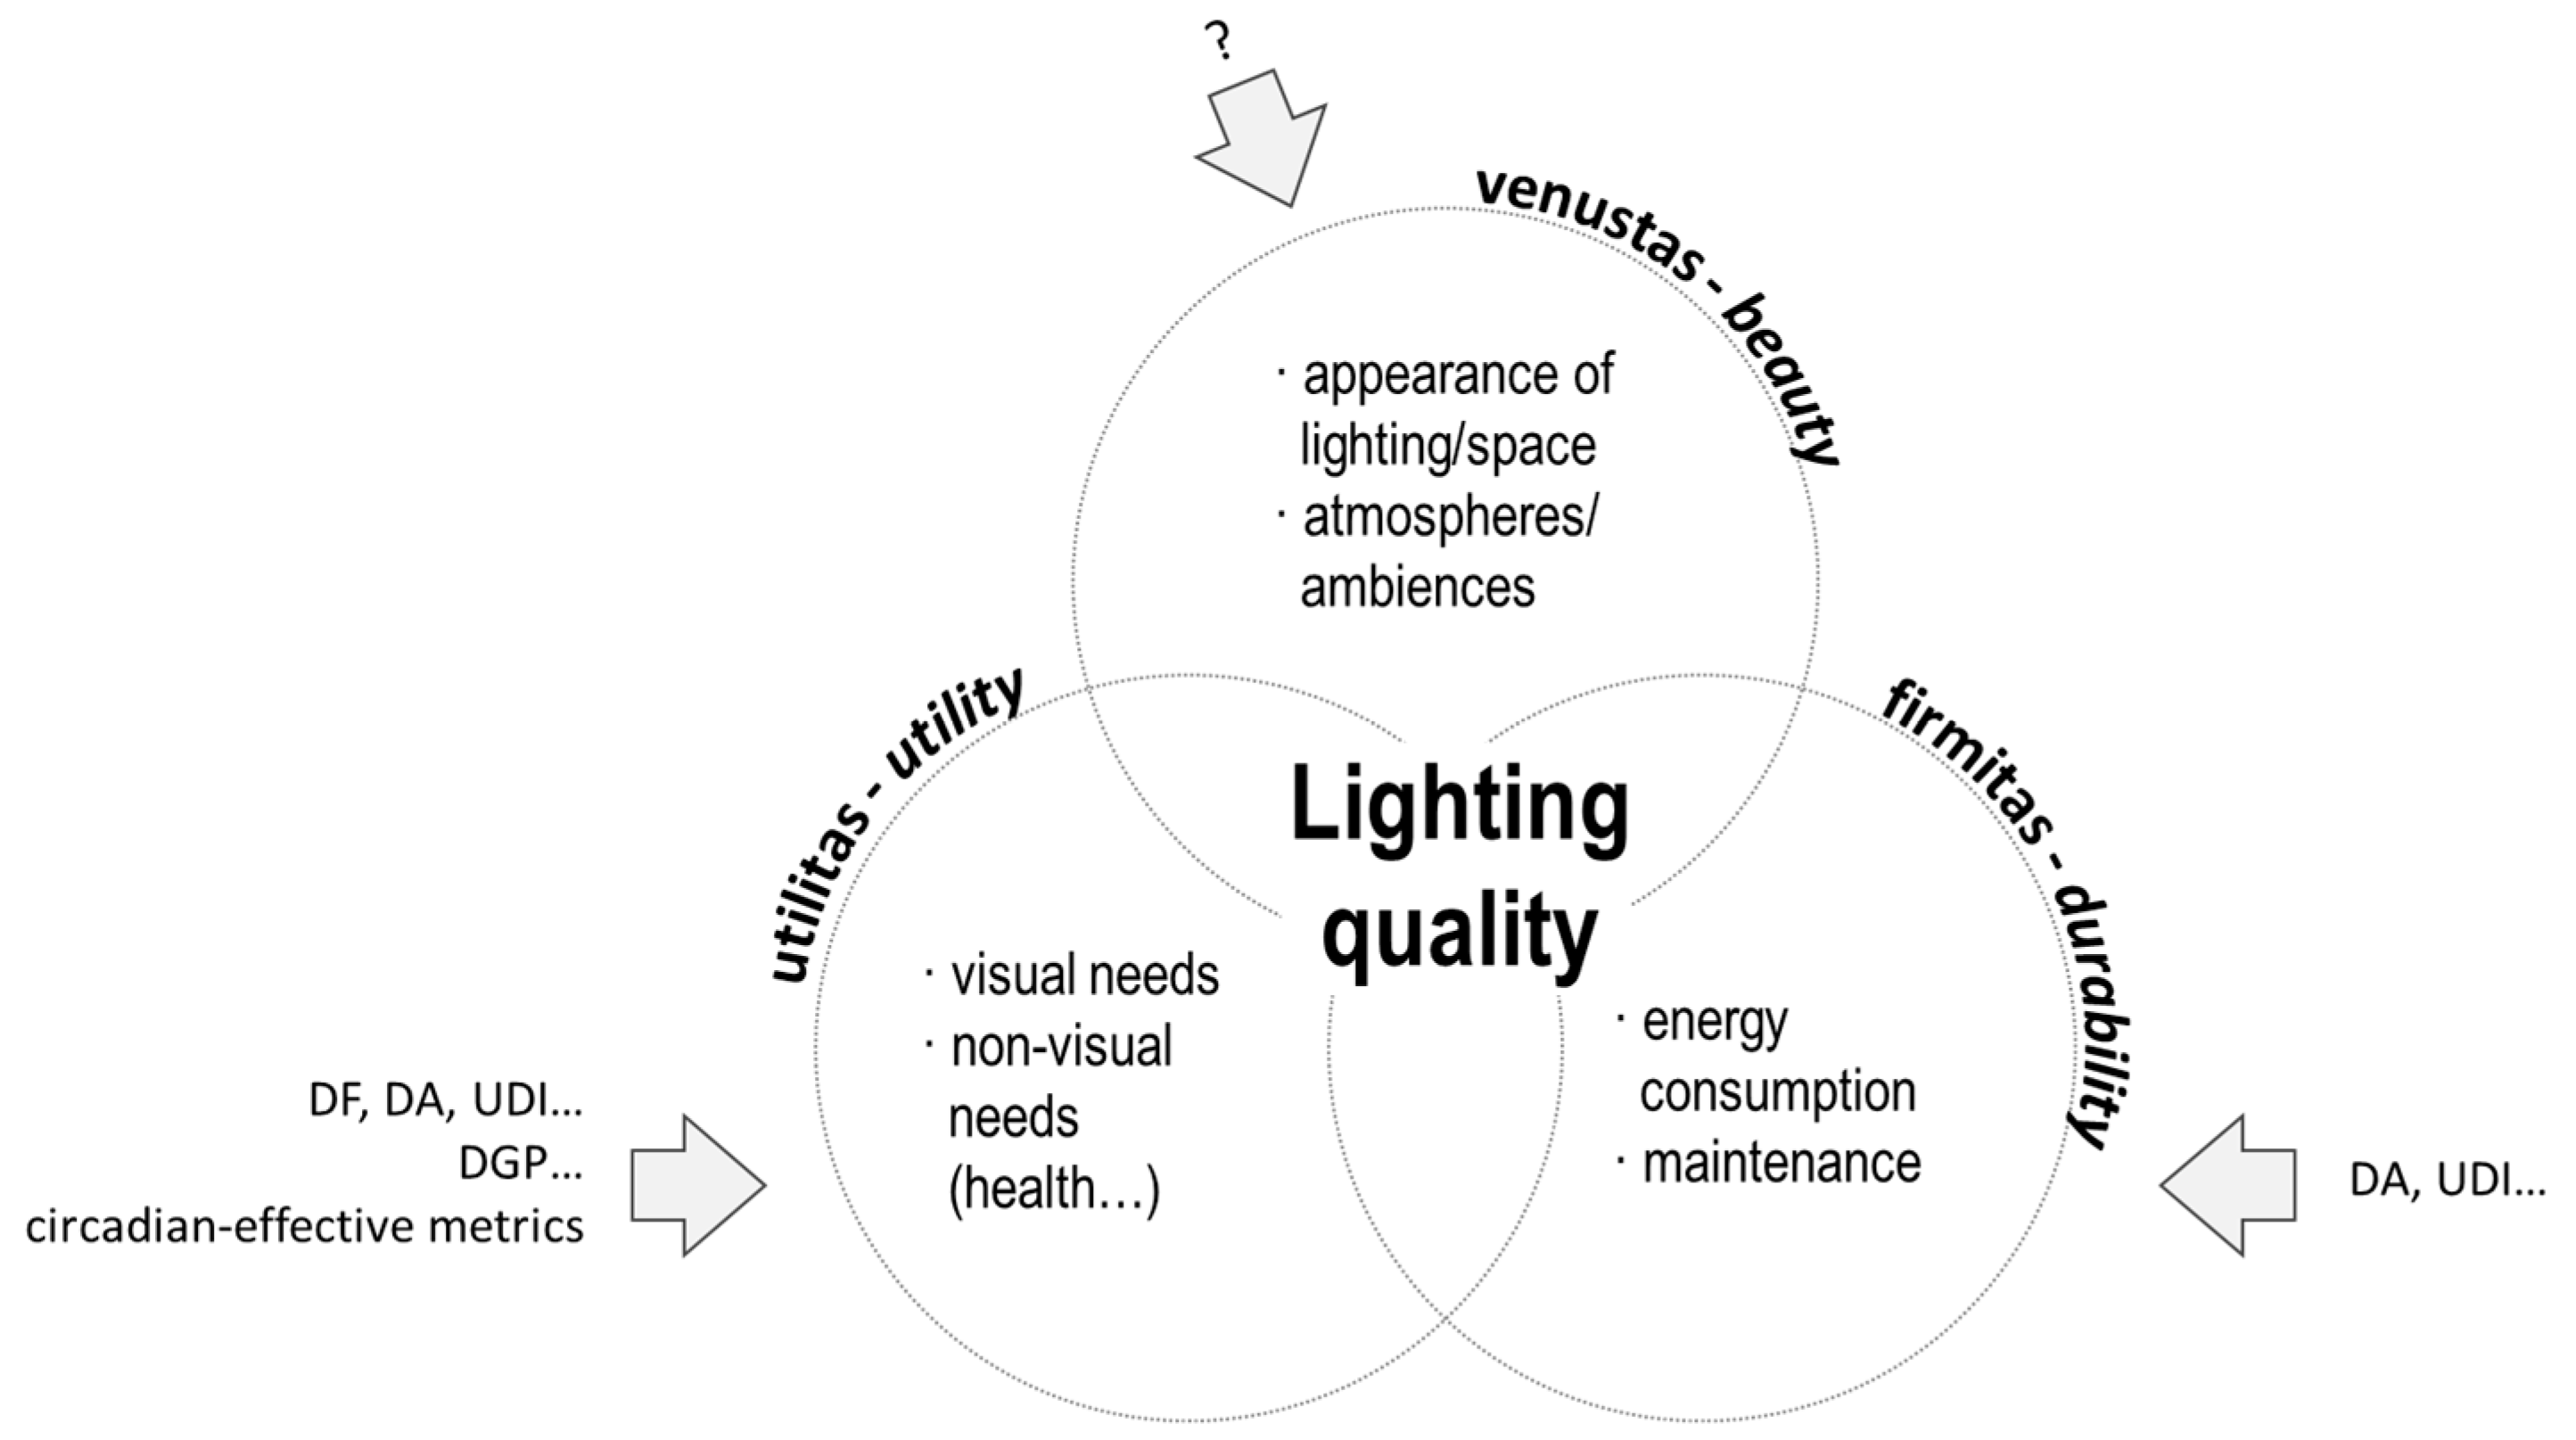
- Thanks to computer technology, computing power increased dramatically from the 1970s, and the first physically-based lighting simulation systems were developed in the Eighties. These advances favored the development of dynamic climate-based performance indicators such as daylight autonomy (DA) [3] and useful daylight illuminance (UDI) [4]. These metrics are calculated based on weather files describing typical conditions at the building’s location. They take into account daylight variability, target illuminance level, and building occupancy periods. They also inform on the potential to reduce lighting consumption thanks to daylighting. We observe that UDI and DA, developed more than 10 years, have difficulty being adopted by practitioners. To our opinion, potential reasons are (1) calculation tools and software not adapted to architectural design realities and (2) a need for a normative/regulative context specifying targets.
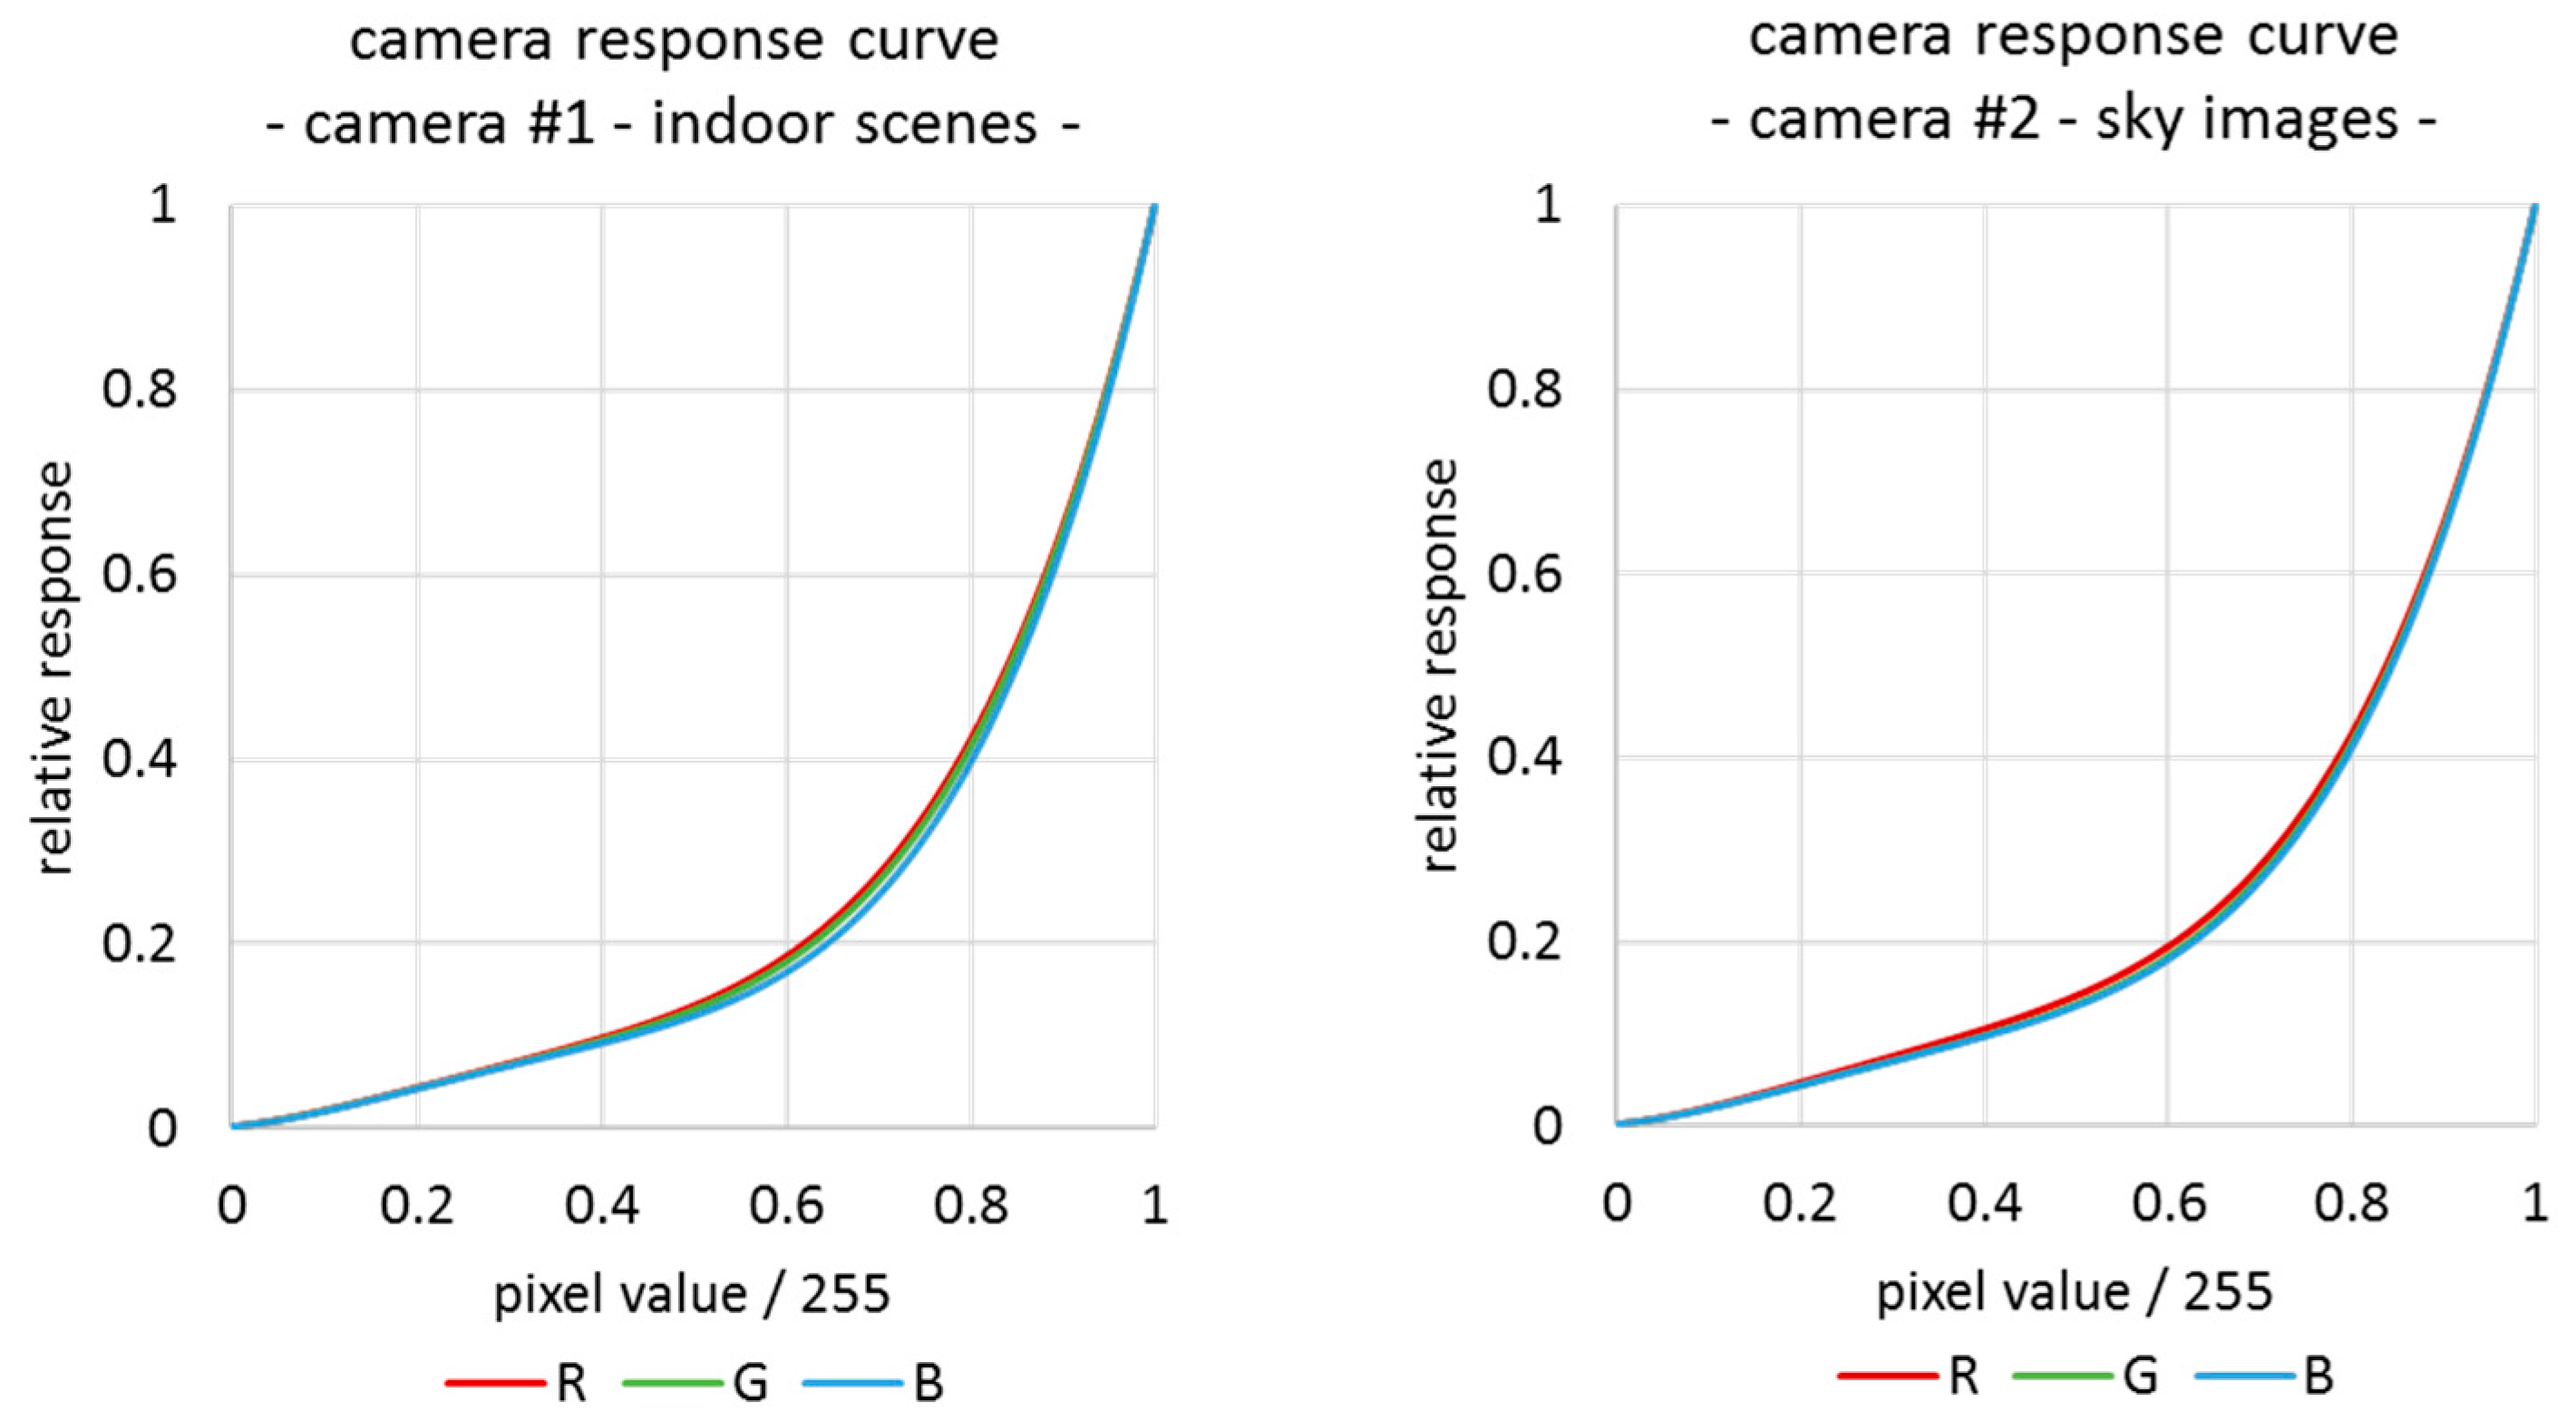
- In the past decade, HDR photography was increasingly used by lighting researchers as a luminance data acquisition tool. Over spot luminance meters, this technique has the advantage to capture luminances in the human field of view more rapidly and with a higher resolution. It also makes possible statistical analyses of luminances of specific surfaces/areas of interest. The accuracy of luminance measurement with HDR photography is widely influenced by the care taken during acquisition and treatment [5,6,7]. A measurement error of less than 10% can be expected [6]. HDR photography surely accelerated the development of luminance-based metrics predicting visual discomfort caused by glaring situations (e.g., DGP [8]), and will probably facilitate their validation.
- Last, in recent years, we have observed a growing interest of lighting researchers for circadian matters [9,10]. This interest follows the discovery in the 2000s of a third type of retinal photoreceptor [11,12]. Light is today recognized as the “major synchronizer of circadian rhythms to the 24-h solar day” [13]. To help designers to address the need for the building’s daylight access-supporting circadian regulation, circadian daylight metrics are under development [14,15].
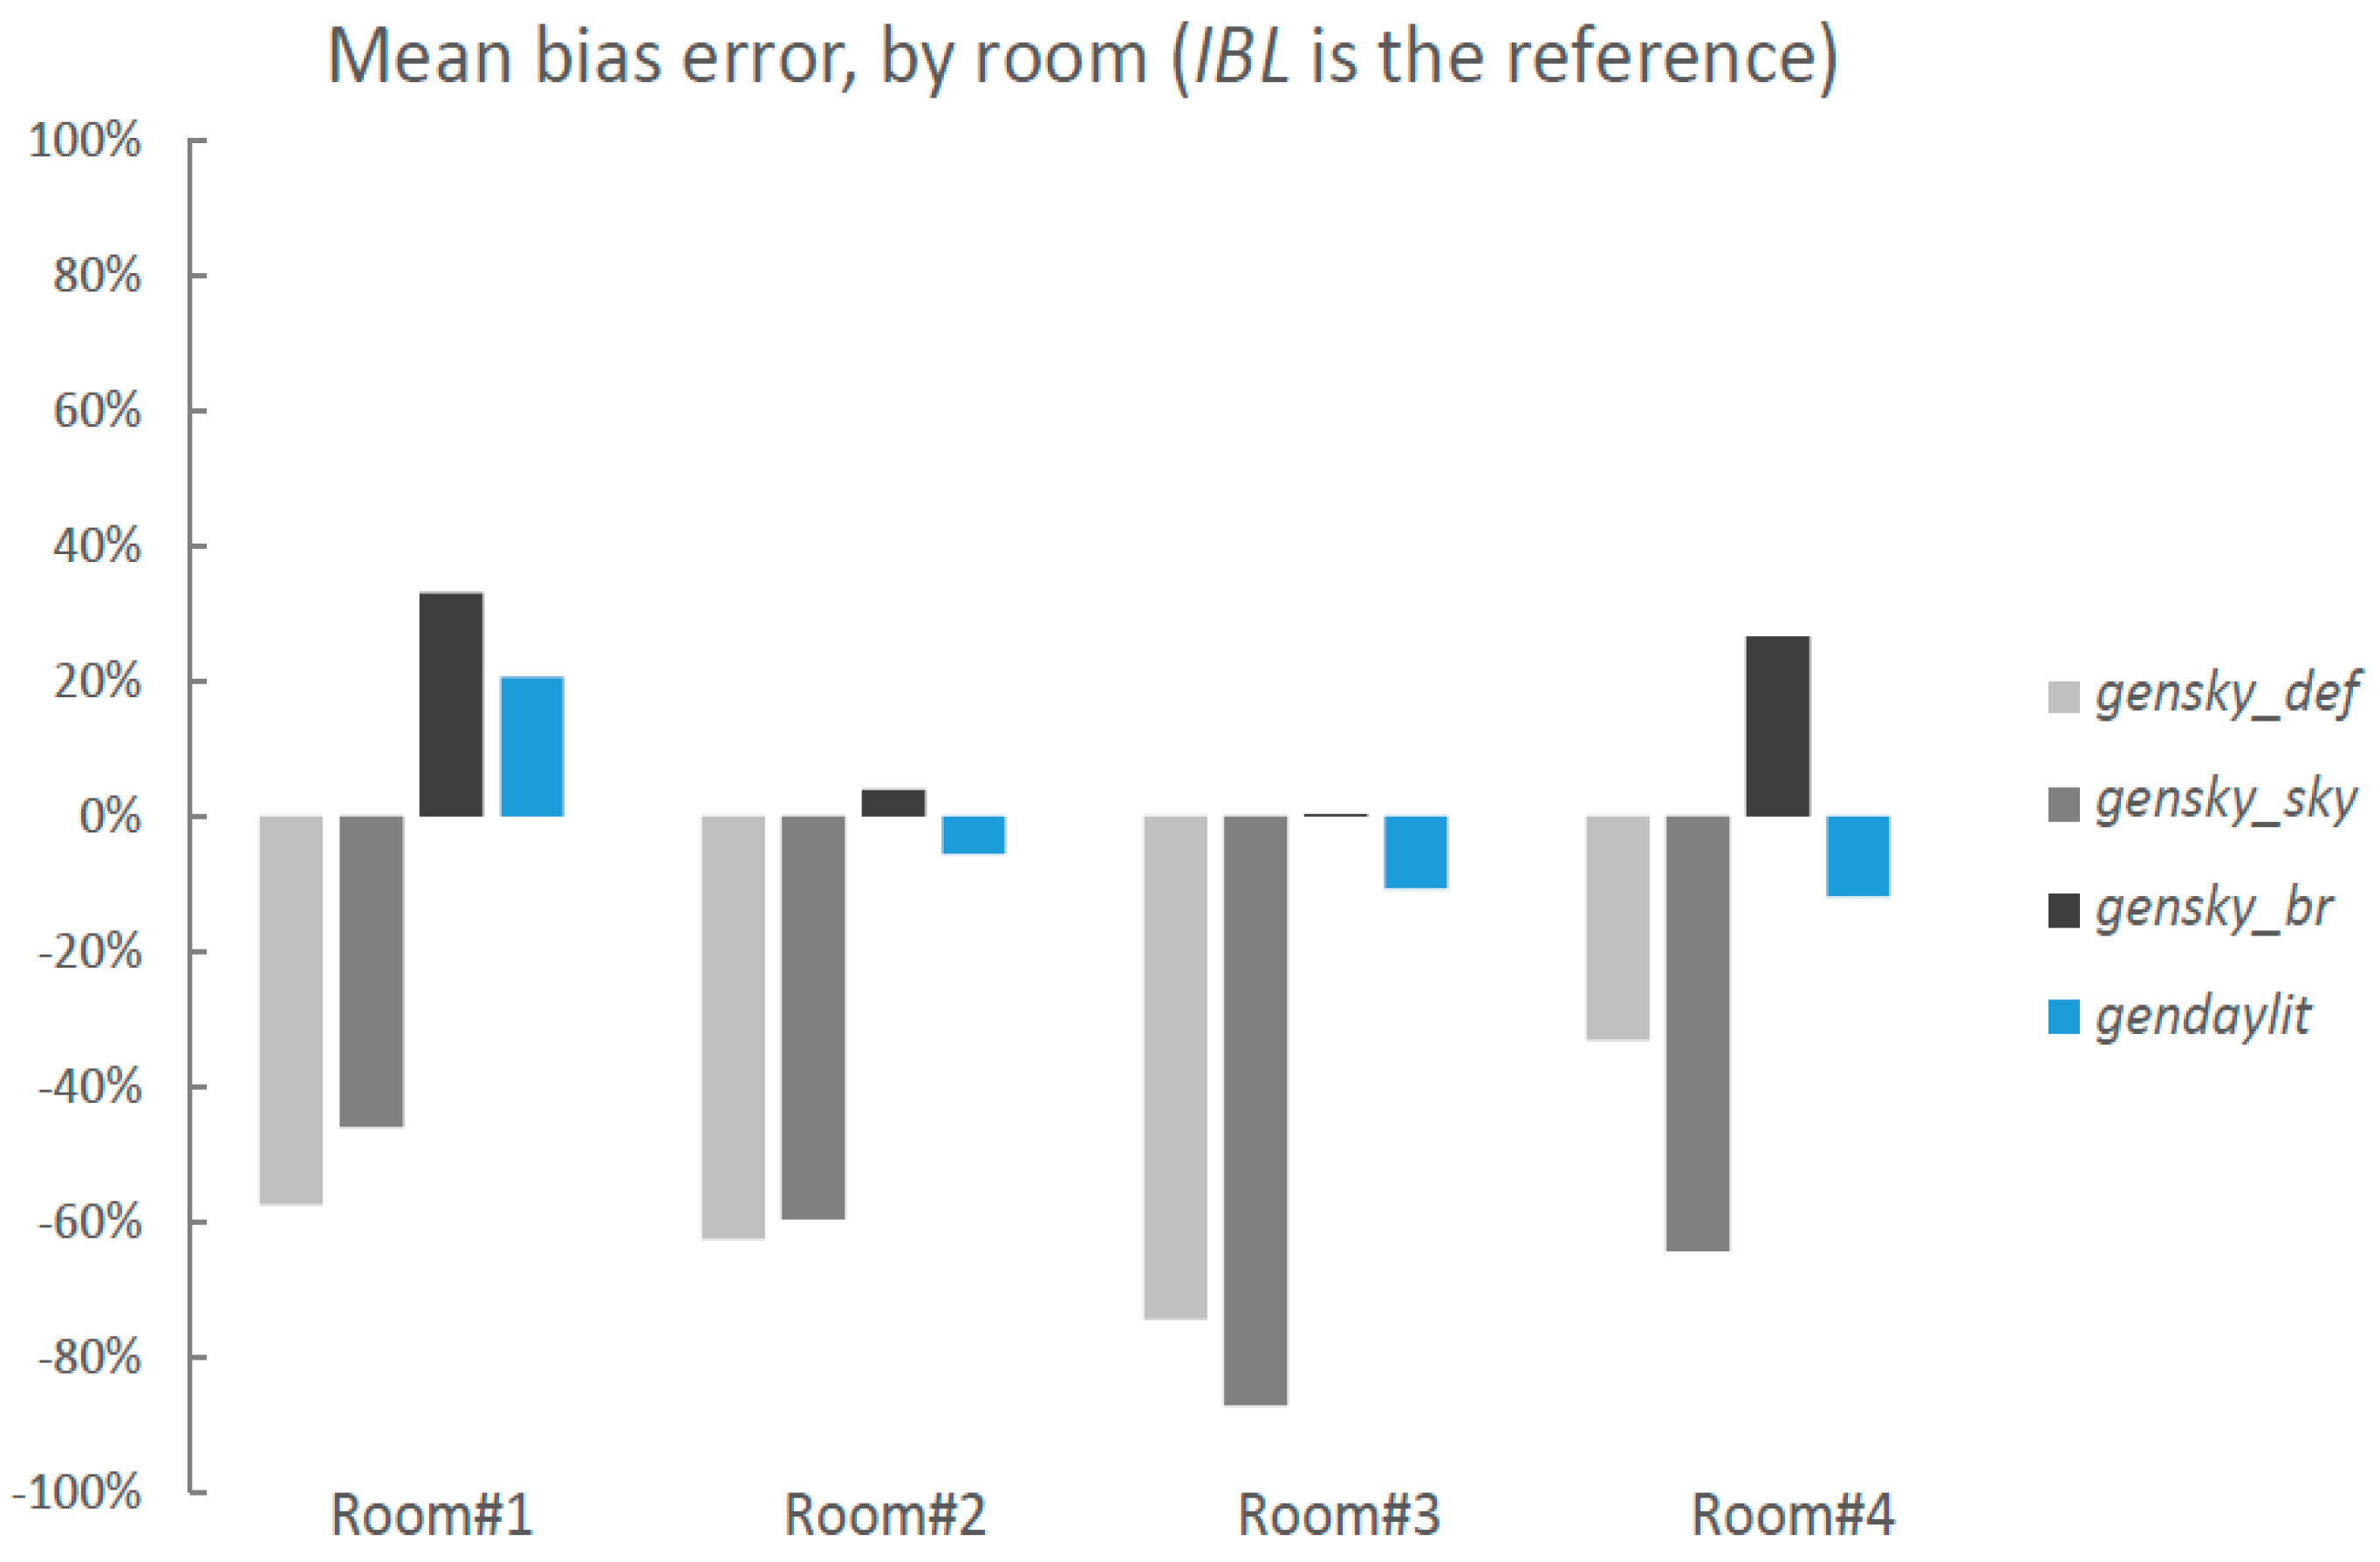
- Investigate the ability of IBL renderings to accurately predict luminance distributions, in indoor spaces, in comparison to more traditional ways to describe the light source in Radiance [24];
- Quantify the error between actual and rendered luminances.
2. Materials and Methods
2.1. Outdoor Illuminance Measurements
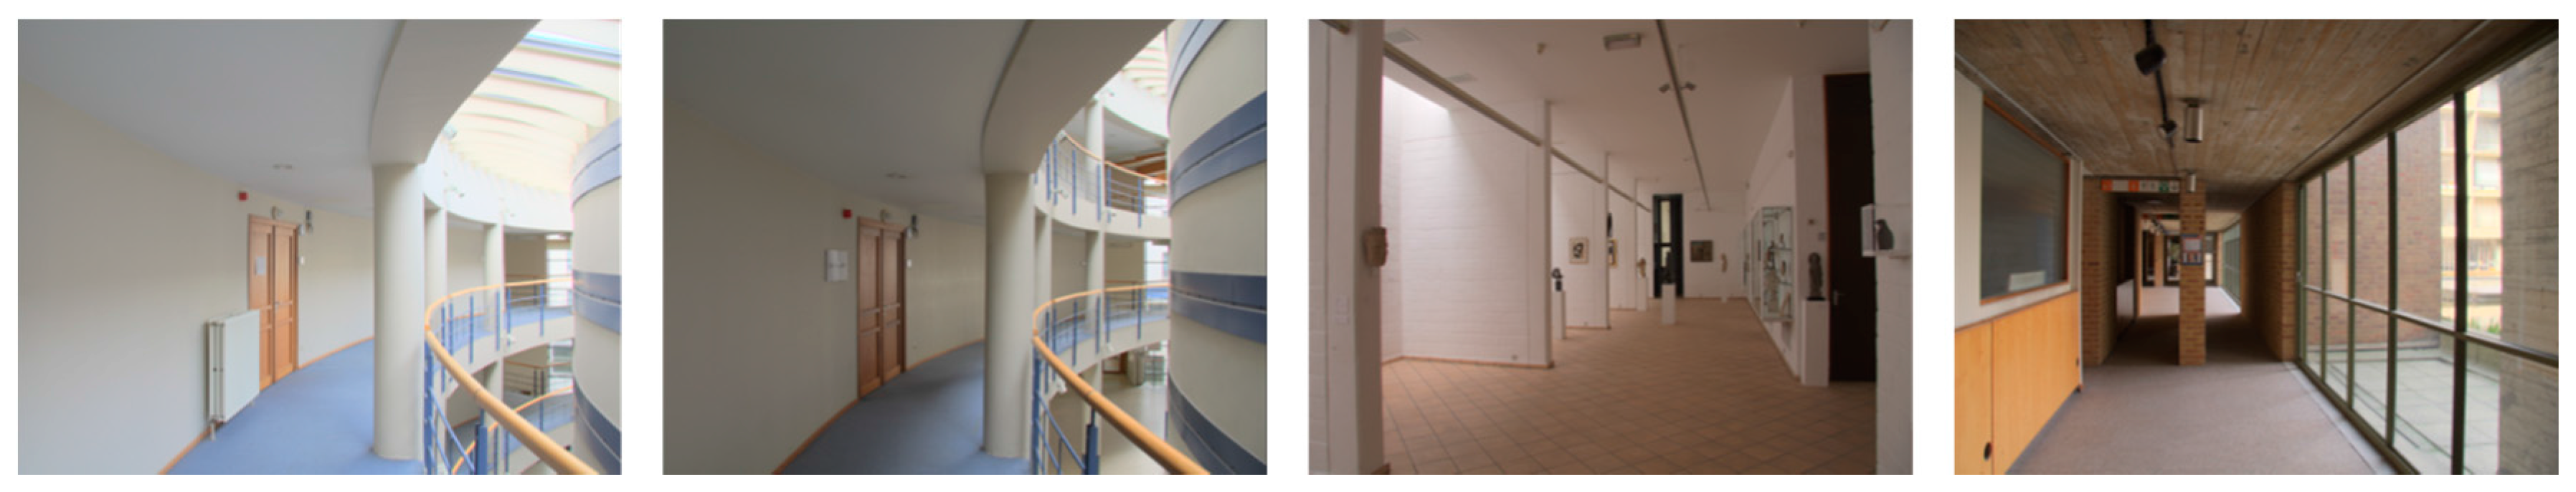
2.2. Real Rooms Luminance Acquisition
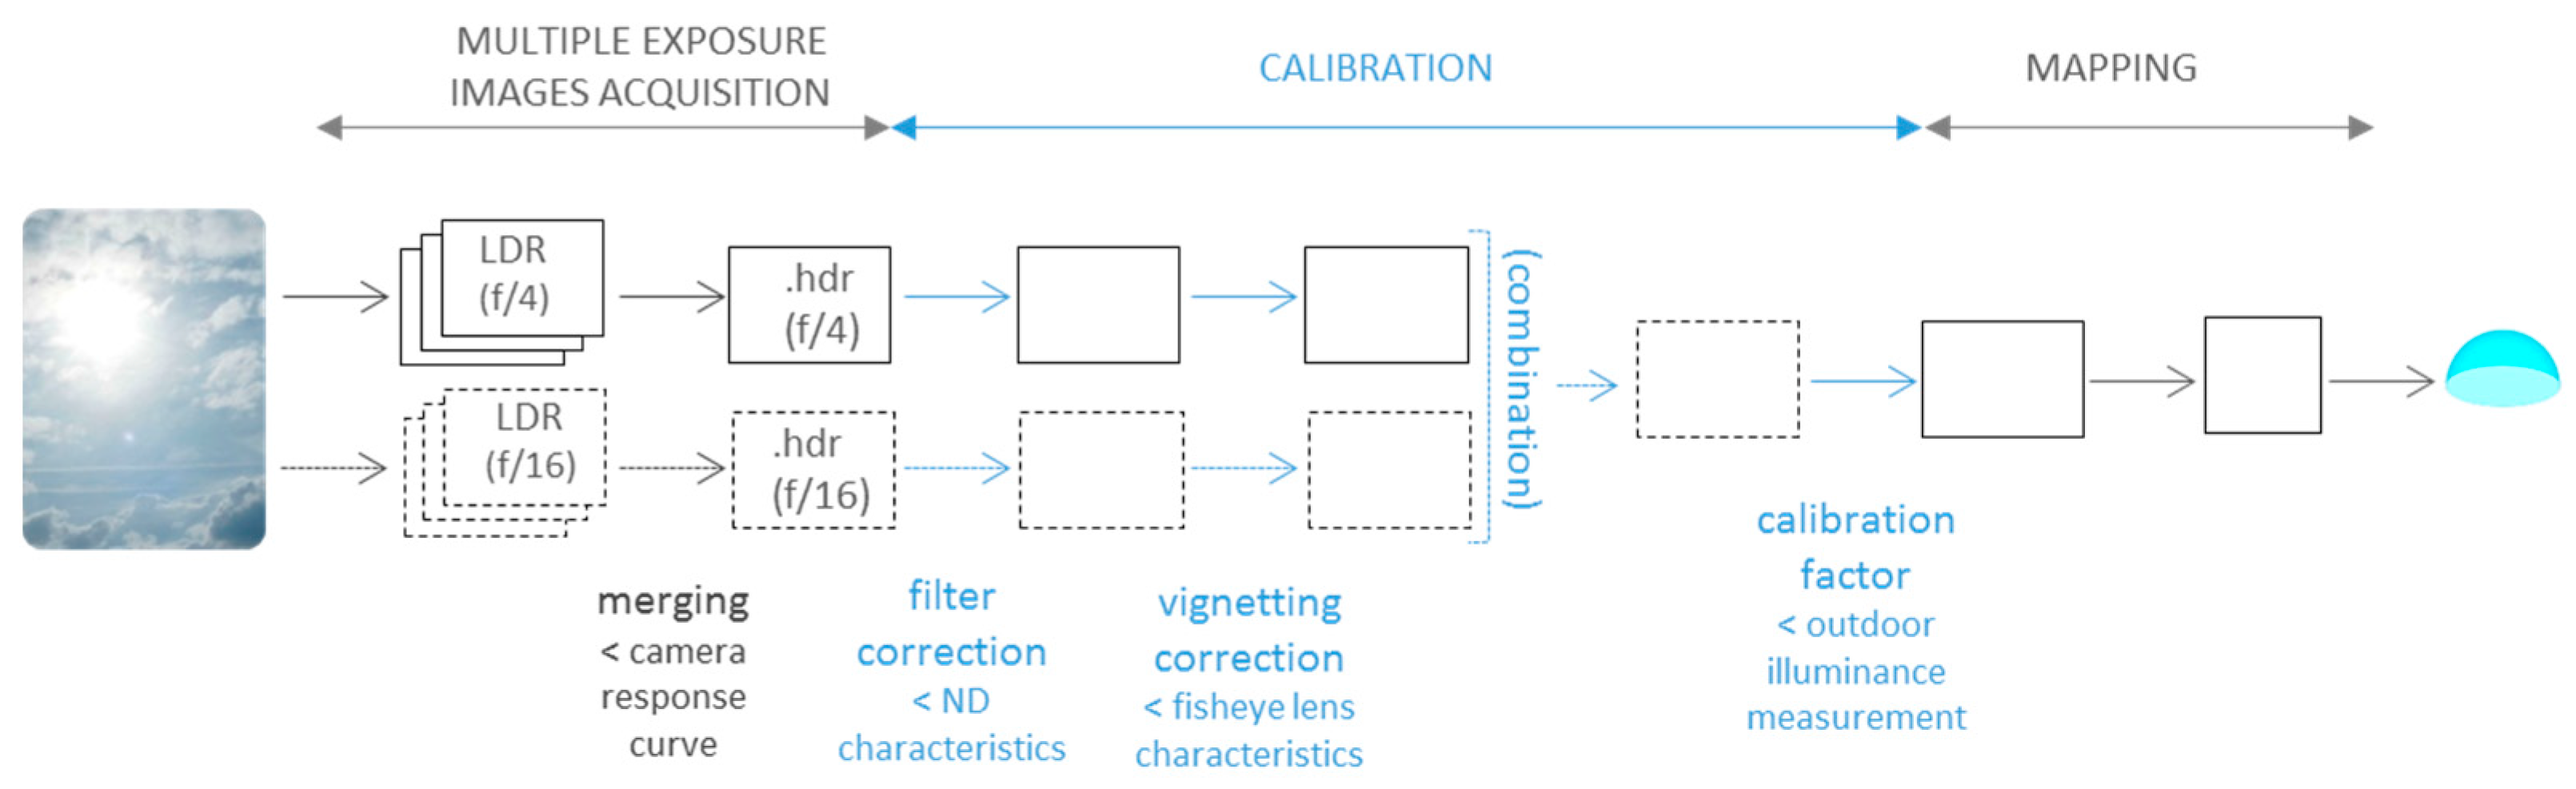
2.3. Sky Vault Luminance Acquisition
- A neutral density filter correction, determined as proposed by Stumpfel et al. [31] in photographing a Macbeth color chart with and without the ND filter;
- A vignetting correction for counteracting respectively the 50% and 4% losses of luminance observed at the periphery of the sky image with our device (CANON40D + Sigma 4.5 mm) and a f/16 or a f/4 aperture;
- A calibration of the resulting (combined) HDR image, based on the measurement of outdoor illuminance. To determine the calibration factor (see Equation (5)), outdoor global horizontal illuminance was compared to illuminance from HDR picture calculated with evalglare (a Radiance-based tool [33]) after modifying the projection type of the image from equisolid to equidistant (using the Radiance fisheye_corr.cal file).where E_glob_horiz is the outdoor global horizontal illuminance measured during the sky image capturing process and E_HDR is the illuminance calculated from the HDR image. Calibration factor vary between 0.95 and 1.41.
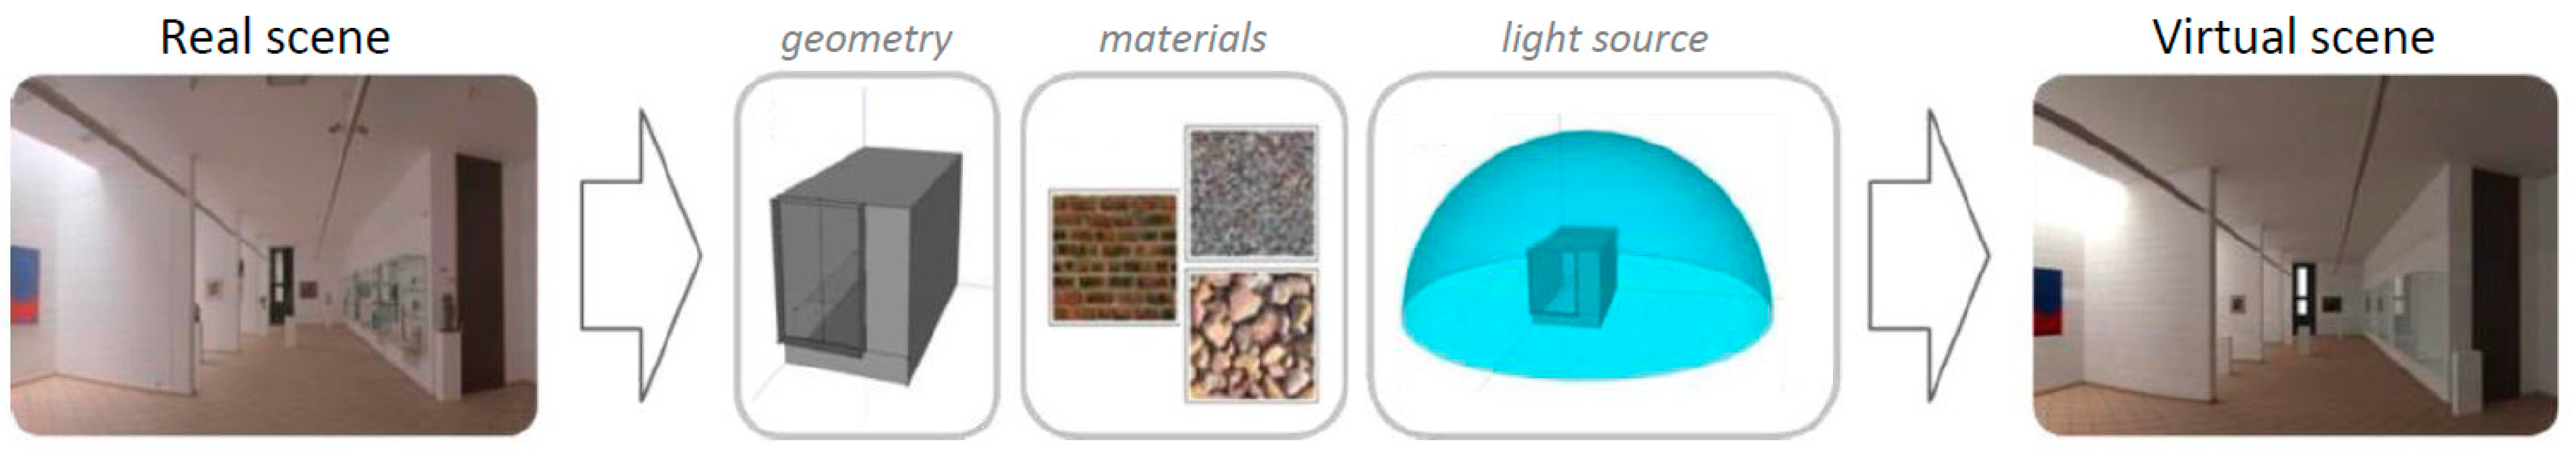
2.4. Renderings
- Gensky in specifying date, time, and location (gensky_def). This way to describe the light source is used by many novice users and practitioners unfamiliar with lighting simulations.
- Gensky in specifying date, time, location, and sky type (gensky_sky). The sky type was determined based on a subjective evaluation of the cloud layer.
- Gensky in specifying date, time, location, sky type, and horizontal diffuse and direct irradiances (gensky_br). Horizontal diffuse and direct irradiances were determined based on outdoor measurements.
- Gendaylit in specifying date, time, location, sky type, and direct normal and diffuse horizontal illuminances (gendaylit). Direct normal and diffuse horizontal illuminances were determined based on outdoor measurements.
3. Results
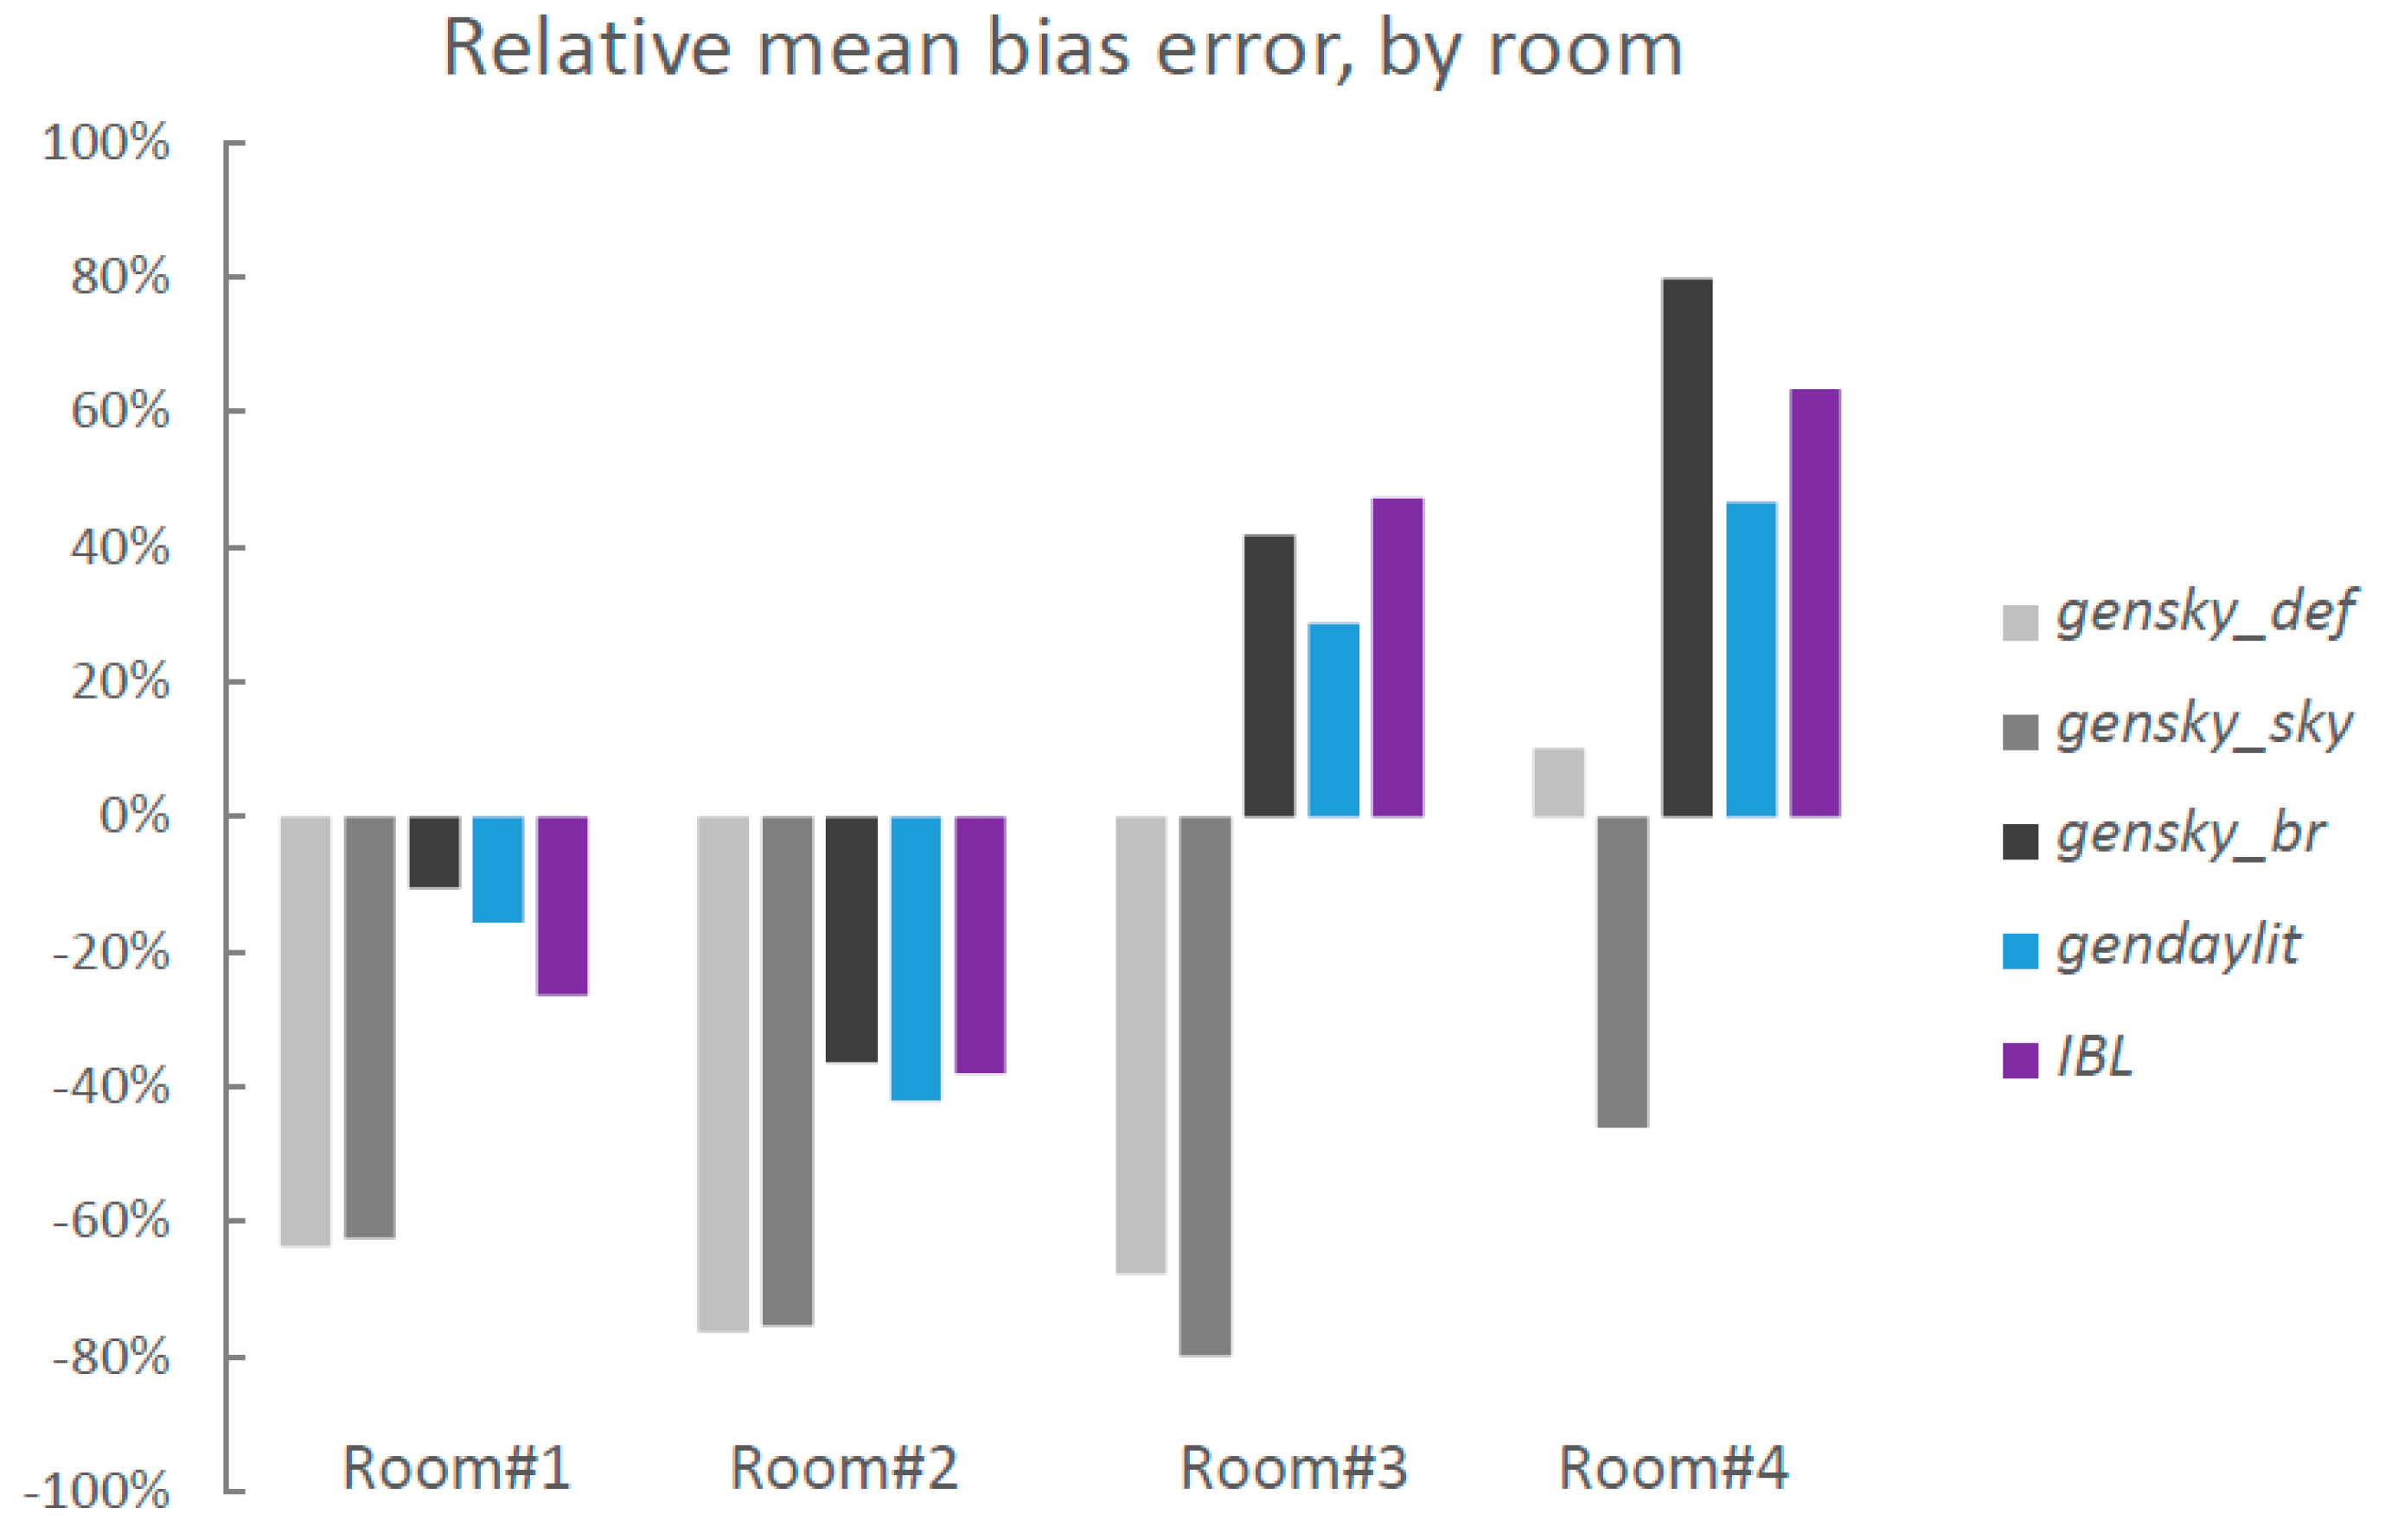
- The relative mean bias error (MBE) with respect to the mean luminance by surface in the real space. MBE is a measure of overall bias error and is defined as:
- The mean absolute percentage error (MAPE) with respect to the mean luminance by surface in the real space. MAPE is defined as:
- The relative root mean square error (RMSE), which gives a relatively high weight to large difference with real luminances, contrary to the other indicators. RMSE is calculated as:
3.1. Visual Comparison of Sky Maps
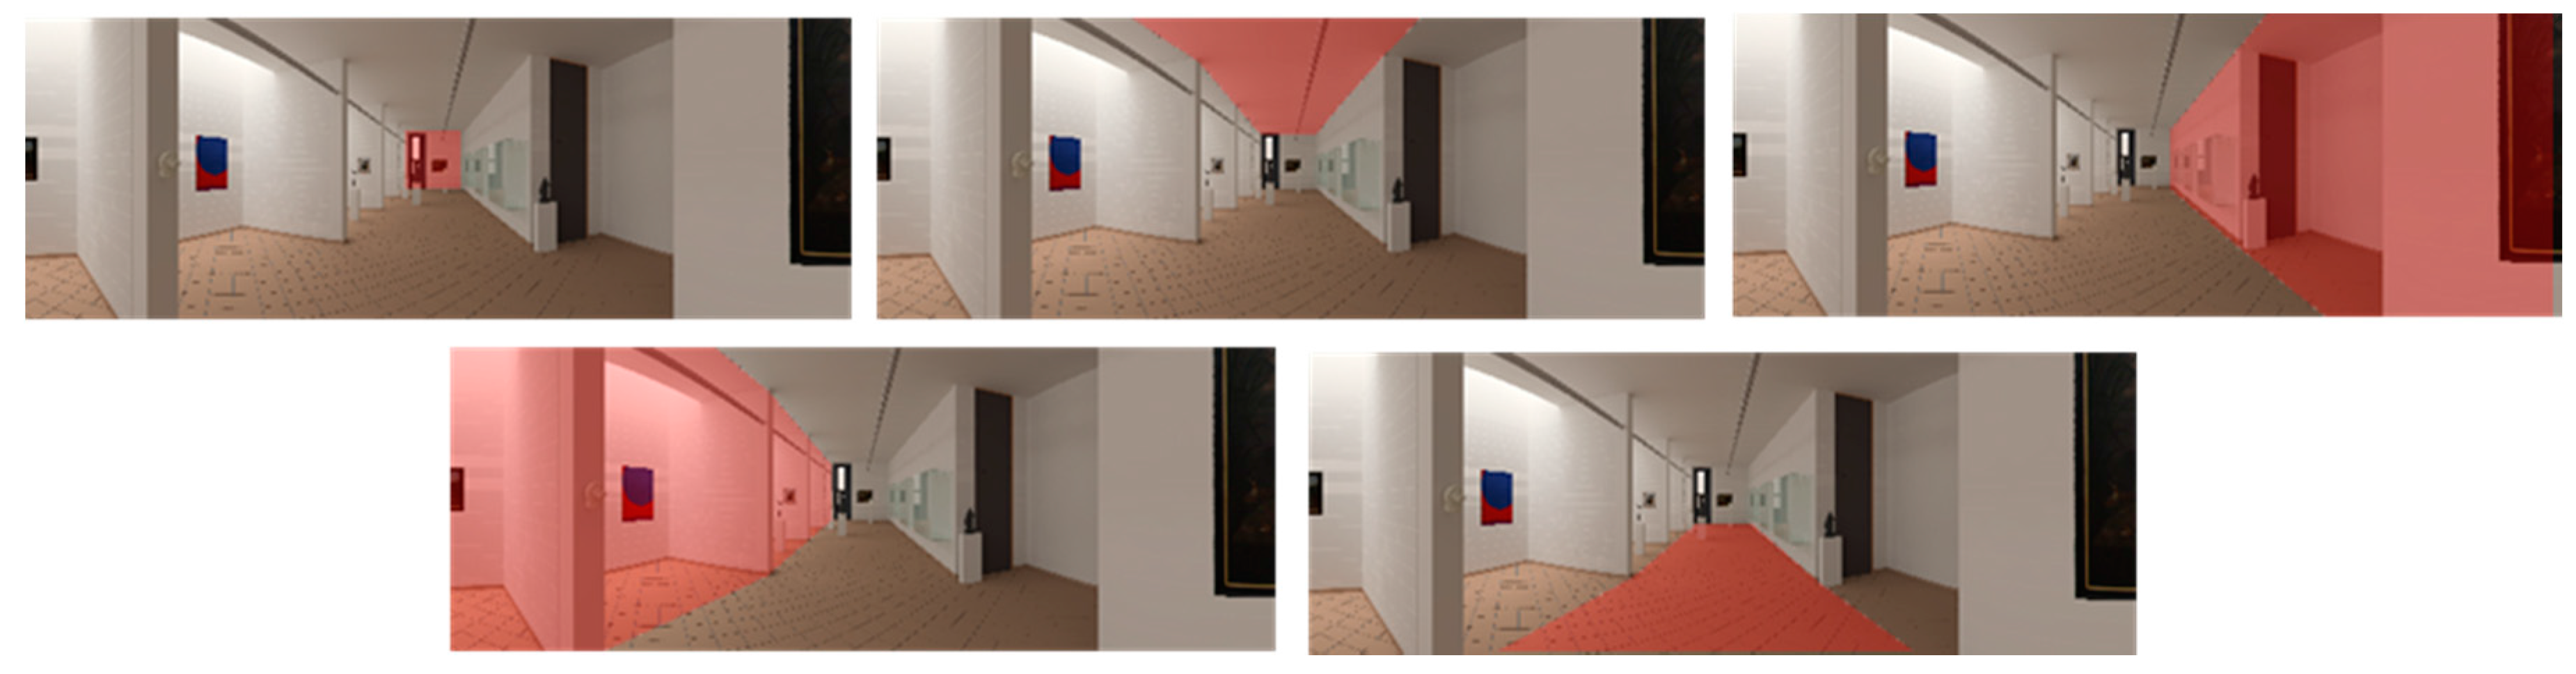
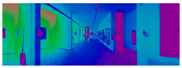
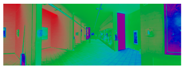
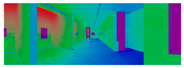
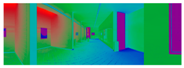
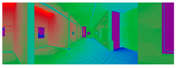
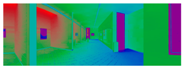
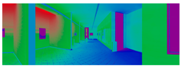
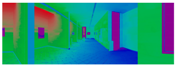
3.2. Visual Comparison of Indoor Spaces
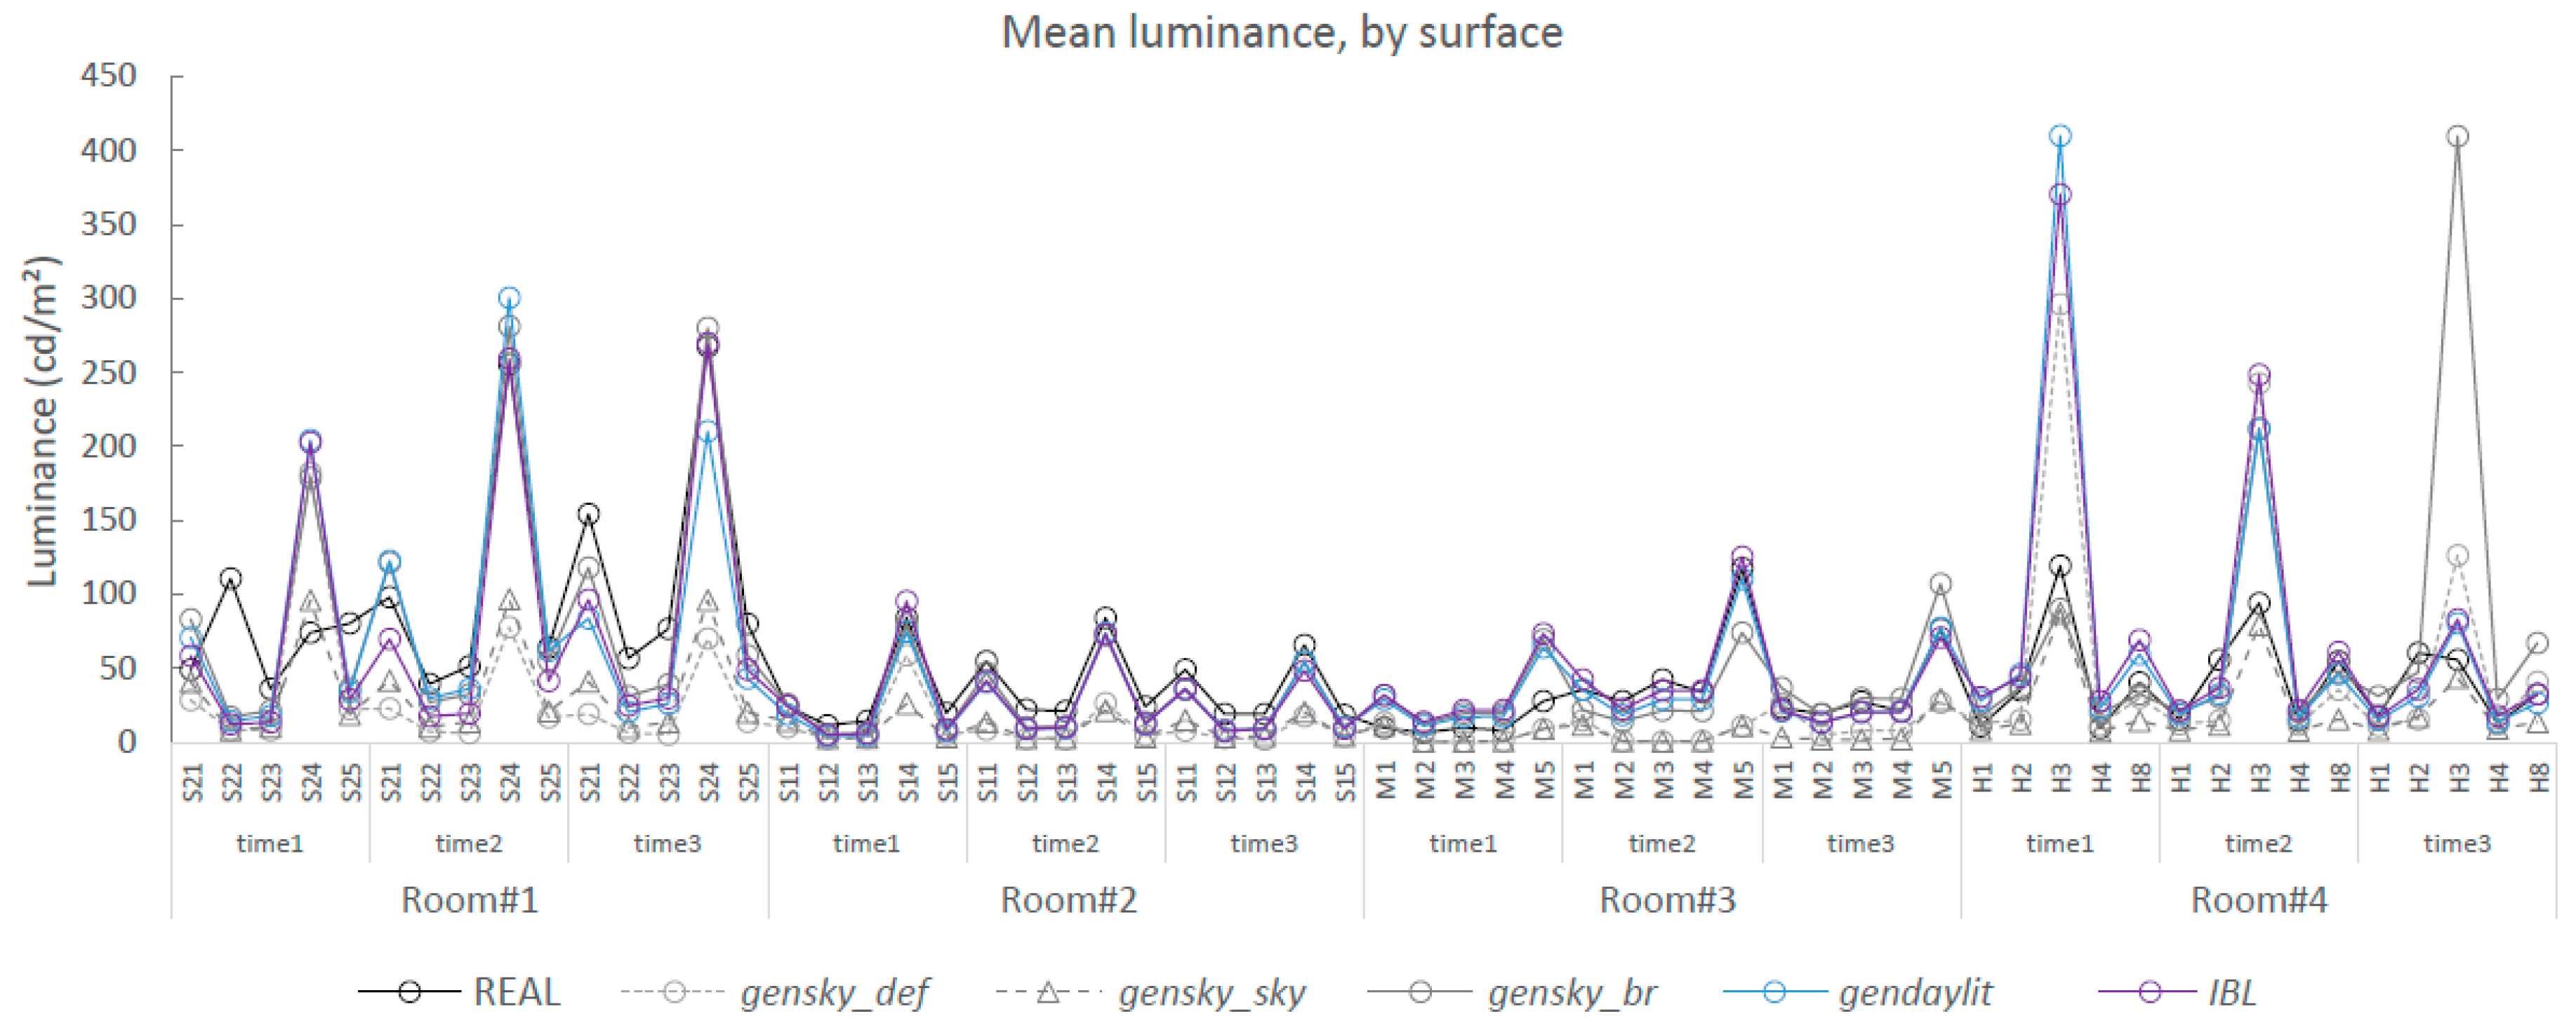
- Gensky_def and gensky_sky produce similar luminance maps underestimating real luminances;
- Gensky_br, gendaylit, and IBL are the second group. They produce luminance maps that seem closer to real luminances than those produced by the first group (gensky_def and gensky_sky). Nevertheless, Table 3 shows a slight underestimation of luminances in Room#1, in comparison with real luminances. This underestimation is slightly larger in Room#2 (see Table 4). In Room#3 at 11:25 (see Table 5), an overestimation by these three kinds of rendering is observed. Also, in Room#4 (see Table 6), the luminance of the ceiling seems overestimated by simulation.
3.3. Surface-to-Surface Comparison
4. Discussion
Acknowledgments
Author Contributions
Conflicts of Interest
References
- Rea, M.S. Iesna Lighting Handbook: Reference and Application, 9th ed.; Illuminating Engineering Society of North America: New York, NY, USA, 2000. [Google Scholar]
- Veitch, J.A.; Newsham, G.R. Determinants of Lighting Quality II: Research and Recommendations. In Proceedings of the 104th Annual Convention of the American Psychological Association, Toronto, ON, Canada, 9–12 August 1996. [Google Scholar]
- Reinhart, C.F.; Mardaljevic, J.; Rogers, Z. Dynamic daylight performance metrics for sustainable building design. Leukos 2006, 3, 7–31. [Google Scholar]
- Nabil, A.; Mardaljevic, J. Useful daylight illuminances: A replacement for daylight factors. Energy Build. 2006, 38, 905–913. [Google Scholar] [CrossRef]
- Cai, H.; Chung, T. Improving the quality of high dynamic range images. Light. Res. Technol. 2011, 43, 87–102. [Google Scholar] [CrossRef]
- Inanici, M. Evaluation of high dynamic range photography as a luminance data acquisition system. Light. Res. Technol. 2006, 38, 123–136. [Google Scholar] [CrossRef]
- Jakubiec, J.A.; Van Den Wymelenberg, K.; Inanici, M.; Mahic, A. Improving the accuracy of measurements in daylit interior scenes using high dynamic range photography. In Proceedings of the 32nd PLEA Conference, Los Angeles, CA, USA, 11–13 July 2016. [Google Scholar]
- Wienold, J.; Christoffersen, J. Evaluation methods and development of a new glare prediction model for daylight environments with the use of ccd cameras. Energy Build. 2006, 38, 743–757. [Google Scholar] [CrossRef]
- Pechacek, C.S.; Andersen, M.; Lockley, S.W. Preliminary method for prospective analysis of the circadian efficacy of (day) light with applications to healthcare architecture. Leukos 2008, 5, 1–26. [Google Scholar] [CrossRef]
- Webb, A.R. Considerations for lighting in the built environment: Non-visual effects of light. Energy Build. 2006, 38, 721–727. [Google Scholar] [CrossRef]
- Provencio, I.; Rodriguez, I.R.; Jiang, G.; Hayes, W.P.; Moreira, E.F.; Rollag, M.D. A novel human opsin in the inner retina. J. Neurosci. 2000, 20, 600–605. [Google Scholar] [PubMed]
- Berson, D.M.; Dunn, F.A.; Takao, M. Phototransduction by retinal ganglion cells that set the circadian clock. Science 2002, 295, 1070–1073. [Google Scholar] [CrossRef] [PubMed]
- Acosta, I.; Leslie, R.; Figueiro, M. Analysis of circadian stimulus allowed by daylighting in hospital rooms. Light. Res. Technol. 2017, 49, 49–61. [Google Scholar] [CrossRef]
- Konis, K. A novel circadian daylight metric for building design and evaluation. Build. Environ. 2017, 113, 22–38. [Google Scholar] [CrossRef]
- Amundadottir, M.L.; Rockcastle, S.; Sarey Khanie, M.; Andersen, M. A human-centric approach to assess daylight in buildings for non-visual health potential, visual interest and gaze behavior. Build. Environ. 2017, 113, 5–21. [Google Scholar] [CrossRef]
- Rockcastle, S.; Ámundadóttir, M.L.; Andersen, M. Contrast measures for predicting perceptual effects of daylight in architectural renderings. Light. Res. Technol. 2016. [Google Scholar] [CrossRef]
- Newsham, G.; Richardson, C.; Blanchet, C.; Veitch, J. Lighting quality research using rendered images of offices. Light. Res. Technol. 2005, 37, 93–112. [Google Scholar] [CrossRef]
- Cauwerts, C. Influence of Presentation Modes on Visual Perceptions of Daylit Spaces. Ph.D. Thesis, Université Catholique de Louvain, Louvain-la-Neuve, Belgium, 2013. [Google Scholar]
- Murdoch, M.J.; Stokkermans, M.G.; Lambooij, M. Towards perceptual accuracy in 3d visualizations of illuminated indoor environments. J. Solid State Light. 2015, 2, 12. [Google Scholar] [CrossRef]
- Debevec, P. Image-based lighting. IEEE Comput. Gr. Appl. 2002, 22, 26–34. [Google Scholar] [CrossRef]
- Inanici, M. Evaluation of high dynamic range image-based sky models in lighting simulation. Leukos 2010, 7, 69–84. [Google Scholar]
- Inanici, M. Applications of image based rendering in lighting simulation: Development and evaluation of image based sky models. In Proceedings of the International IBPSA Conference, Glasgow, UK, 27–30 July 2009. [Google Scholar]
- Inanici, M.; Hashemloo, A. An investigation of the daylighting simulation techniques and sky modeling practices for occupant centric evaluations. Build. Environ. 2017, 113, 220–231. [Google Scholar] [CrossRef]
- Ward, G.J. The radiance lighting simulation and rendering system. In Proceedings of the 21st Annual Conference on Computer Graphics and Interactive Techniques, Orlando, FL, USA, 24–29 July 1994; ACM: New York, NY, USA, 1994; pp. 459–472. [Google Scholar]
- Szokolay, S.V. Solar Geometry; PLEA(Passive and Low Energy Architecture International in assoc. with Department of Architecture, University of Queensland): Brisbane, Australia, 1996. [Google Scholar]
- Reinhard, E.; Ward, G.; Pattanaik, S.; Debevec, P. High Dynamic Range Imaging: Acquisition, Display and Image-Based Lighting; Elsevier: San Francisco, CA, USA, 2006; Volume 4. [Google Scholar]
- Greg Ward Anyhere Software. Available online: http://www.anyhere.com/ (accessed on 20 December 2017).
- Mitsunaga, T.; Nayar, S.K. Radiometric self calibration. In Proceedings of the IEEE Computer Society Conference on Computer Vision and Pattern Recognition, Fort Collins, CO, USA, 23–25 June 1999; IEEE: Piscataway, NJ, USA, 1999; pp. 374–380. [Google Scholar]
- Radiance software. Available online: https://radiance-online.org/ (accessed on 20 December 2017).
- Cauwerts, C.; Bodart, M.; Deneyer, A. Comparison of the vignetting effects of two identical fisheye lenses. Leukos 2012, 8, 181–203. [Google Scholar]
- Stumpfel, J.; Jones, A.; Wenger, A.; Tchou, C.; Hawkins, T.; Debevec, P. Direct HDR capture of the sun and sky. In Proceedings of the 3rd International Conference on Computer Graphics, Virtual Reality, Visualisation and Interaction in Africa, Stellenbosch, South Africa, 3–5 November 2004; pp. 145–149. [Google Scholar]
- Jacobs, A. High dynamic range imaging and its application in building research. Adv. Build. Energy Res. 2007, 1, 177–202. [Google Scholar] [CrossRef]
- Wienold, J. Evalglare 2.0—New features, faster and more robust HDR-image evaluation. In Proceedings of the 15th International Radiance Workshop, Padova, Italy, 29–31 August 2016. [Google Scholar]
- Mardaljevic, J. Daylight Simulation: Validation, Sky Models and Daylight Coefficients. Ph.D. Thesis, Loughborough University, Loughborough, UK, 2000. [Google Scholar]
- Karner, K.F.; Prantl, M. A Concept for Evaluating the Accuracy of Computer Generated Images. In Proceedings of the 12th Spring Conference on Computer Graphics (SCCG’96), Budmerice, Slovakia, 5–7 June 1996; Available online: www.cg.tuwien.ac.at/~wp/SCCG96-proceedings/papers/Karner.ps.gz (accessed on 29 November 2017).
- Chamilothori, K.; Wienold, J.; Andersen, M. Adequacy of immersive virtual reality for the perception of daylit spaces: Comparison of real and virtual environments. Leukos 2018, accepted. [Google Scholar]
- Villa, C.; Parent, E.; Labayrade, R. Calibrating a display device for subjective visual comfort tests: Selection of light simulation programs and post-production operations. In Proceedings of the International Commission on Illumination CIE 2010 Lighting Quality and Energy Efficiency, Vienna, Austria, 14–17 March 2010. [Google Scholar]
- Cauwerts, C.; Bodart, M.; Labayrade, R. Assessing perception of light level, glare and contrast in daylit rooms using pictures: Influence of tone-mapping parameters and lighting conditions in the visualization room. In Proceedings of the Cleantech for Smart Cities & Buildings: From Nano to Urban Scale (CISBAT), Lausanne, Switzerland, 4–6 September 2013. [Google Scholar]


| Time | E_glob_horiz (lx) | E_dif_horiz (lx) | theta_sun (Degree) | E_dir_norm (lx) | Sky Type | |
|---|---|---|---|---|---|---|
| Room#1 | 11:00 | 23,000 | 20,800 | 29.4 | 4478 | intermediate |
| 12:25 | 40,500 | 38,200 | 34.2 | 4094 | intermediate | |
| 13:40 | 29,250 | 29,250 | 33.6 | 0 | overcast | |
| Room#2 | 11:10 | 50,000 | 16,600 | 30.3 | 66,296 | intermediate |
| 12:35 | 55,650 | 40,150 | 34.4 | 27,457 | intermediate | |
| 13:50 | 24,300 | 24,300 | 33.2 | 0 | overcast | |
| Room#3 | 11:25 | 39,100 | 21,350 | 31.4 | 34,101 | intermediate |
| 12:50 | 35,050 | 30,350 | 34.5 | 8298 | intermediate | |
| 14:00 | 15,300 | 15,300 | 32.7 | 0 | overcast | |
| Room#4 | 11:50 | 71,700 | 36,900 | 32.9 | 64,114 | intermediate |
| 13:05 | 45,550 | 28,850 | 34.4 | 29,527 | intermediate | |
| 14:20 | 20,150 | 20,150 | 31.4 | 0 | overcast |
| Time (Sky) | REAL | Gensky_def | Gensky_sky | Gensky_br | Gendaylit | IBL | |
|---|---|---|---|---|---|---|---|
| 11:50 (i 1) | 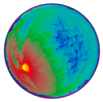 | 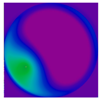 |  |  |  |  |  |
| 13:05 (i) |  | 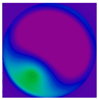 |  |  | 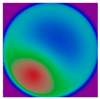 | 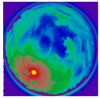 | |
| 14:20 (o 2) | 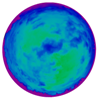 |  | 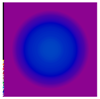 |  | 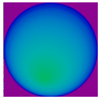 | 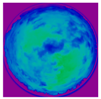 |
| Time (Sky) | REAL | Gensky_def | Gensky_sky | Gensky_br | Gendaylit | IBL | |
|---|---|---|---|---|---|---|---|
| 11:00 (i) | 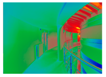 |  | 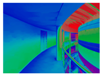 | 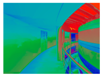 | 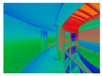 | 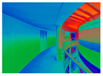 |  |
| 12:25 (i) | 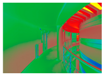 |  | 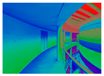 | 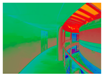 | 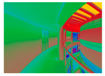 |  | |
| 13:40 (o) | 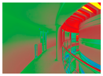 |  | 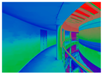 | 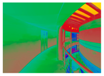 |  |  |
| Time (Sky) | REAL | Gensky_def | Gensky_sky | Gensky_br | Gendaylit | IBL | |
|---|---|---|---|---|---|---|---|
| 11:10 (i) | 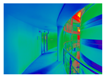 | 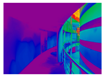 |  | 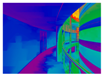 |  |  | 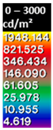 |
| 12:35 (i) | 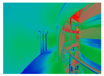 |  | 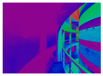 |  |  |  | |
| 13:50 (o) | 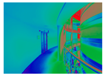 |  | 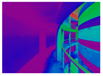 | 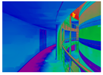 |  |  |
| Time (Sky) | ||||
|---|---|---|---|---|
| 11:25 (i) | REAL | Gensky_def | Gensky_sky |  |
 |  |  | ||
| Gensky_br | Gendaylit | IBL | ||
 |  |  | ||
| 12:50 (i) | REAL | Gensky_def | Gensky_sky | |
 |  |  | ||
| Gensky_br | Gendaylit | IBL | ||
 |  |  | ||
| 14:00 (o) | REAL | Gensky_def | Gensky_sky | |
 |  |  | ||
| Gensky_br | Gendaylit | IBL | ||
 |  |  | ||
| Time (Sky) | REAL | Gensky_def | Gensky_sky | Gensky_br | Gendaylit | IBL | |
|---|---|---|---|---|---|---|---|
| 11:50 (i) |  |  |  | 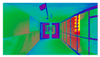 |  |  |  |
| 13:05 (i) |  |  |  |  |  |  | |
| 14:20 (o) |  |  |  |  |  |  |
© 2018 by the authors. Licensee MDPI, Basel, Switzerland. This article is an open access article distributed under the terms and conditions of the Creative Commons Attribution (CC BY) license (http://creativecommons.org/licenses/by/4.0/).
Share and Cite
Cauwerts, C.; Piderit, M.B. Application of High-Dynamic Range Imaging Techniques in Architecture: A Step toward High-Quality Daylit Interiors? J. Imaging 2018, 4, 19. https://doi.org/10.3390/jimaging4010019
Cauwerts C, Piderit MB. Application of High-Dynamic Range Imaging Techniques in Architecture: A Step toward High-Quality Daylit Interiors? Journal of Imaging. 2018; 4(1):19. https://doi.org/10.3390/jimaging4010019
Chicago/Turabian StyleCauwerts, Coralie, and María Beatriz Piderit. 2018. "Application of High-Dynamic Range Imaging Techniques in Architecture: A Step toward High-Quality Daylit Interiors?" Journal of Imaging 4, no. 1: 19. https://doi.org/10.3390/jimaging4010019
APA StyleCauwerts, C., & Piderit, M. B. (2018). Application of High-Dynamic Range Imaging Techniques in Architecture: A Step toward High-Quality Daylit Interiors? Journal of Imaging, 4(1), 19. https://doi.org/10.3390/jimaging4010019