1. Introduction
One of the first automated mapping algorithms for olive plantations was ‘Olicount’, a routine developed by the Joint Research Centre (JRC, Brussels, Belgium) in the context of the Common Agricultural Policy (CAP) of the European Union. ‘Olicount’ deployed 1-m grey tone orthophotos, but its performance was limited in cases of young trees or irregular groves. A new version of the routine (Olicount v2) has been upgraded to handle different types of imagery, such as QuickBird [
1] following the launch of very high resolution (VHR) multispectral (MS) satellite imagery, which opened up a new window in olive tree mapping.
Using pansharpened QuickBird imagery and relying on a combination of blob detection in the red band and NDVI (Normalised Difference Vegetation Index) thresholding, Reference [
2] achieved acceptable accuracy in detecting trees of different types in, including olive trees. Reference [
3] reached a user’s accuracy of 100% for olive tree canopies (although the producer’s accuracy was lower than 50%) with a fully-automated, multi-scale hierarchical classification algorithm applied on IKONOS pansharpened imagery (overall accuracy at the scale of trees was 74%).
Today, VHR aerial imagery from MS cameras mounted on Unmanned Aerial Vehicles (UAVs) has broadened the mapping of olive trees even further. Reference [
4] developed a method based on low-cost UAV MS imagery for the estimation of tree height and crown diameter in olive plantations, both on discontinuous and continuous canopy cropping systems; central to their methodology was the object-based classification of orthomosaics and tree height calculation from digital surface models. Beyond mapping tree macroscopic properties, though, VHR MS imagery allows the detection or even identification of tree stress or infections from a variety of sources. Reference [
5] realised a method able to recognise water availability and thus water stress in olive plantations using thermal aerial images from UAV; objects of interest were classified using programming in MatLab R2009a.
However, possible stress may take place in part of a tree instead of the entire tree, as a result of micro-climate, infestation characteristics, or inappropriate agronomic practices. In order to capture partial tree-stress effectively and timely, monitoring has to be conducted on a scale finer than that of a tree, from now on called a sub-tree scale. Sub-tree scale mapping has the potential to detect early indications of stress, which could be faded out if averaged on a tree scale.
The objective of this study was to develop a methodology for mapping olive plantations on a sub-tree scale. The method has to be rapid and objective, using the most precise, easily acquired, and standardised remote sensing datasets. Classification of MS imagery acquired by UAVs has the potential to meet the above requirements. It is expected that this method will increase the operational potential of monitoring olive plantations for stress caused by different sources.
2. Study Site and Dataset
The study site was a commercial olive plantation located 8.5 km southeast of Polygyros, the capital of Regional Unit of Chalkidiki, Greece. The climate of the area is Mediterranean, with July and August being the hottest months and mean highest daily temperatures at about 26 °C. The coolest months are February and March, without losses in olive orchards by frost, though. The mean annual rainfall, ranging between 500 and 600 mm, is within the typical limit of a Mediterranean area; most precipitation occurs during the cold period, ranging from October to April [
6,
7].
Chalkidiki dedicates 36,000 ha of land to olive groves, with edible olives being the main commodity product. In terms of annual production Chalkidiki can reach 80,000 tonnes, with about 60–70% being exported [
8]. The area is among the most infected by Verticillium wilt (VWO), as infections reach about 20% of the trees [
9].
The study site covers a net extent of 57.8 ha and contains more than 10,000 olive trees. The main variety of the plantation is the edible type of ‘Chondrolia’, which is surrounded by irregular patches of different types here and there. The plantation was imaged with a multiSPEC 4C camera mounted on an eBee UAV; both devices are manufactured by senseFly SA (Lausanne, Switzerland) [
10].
Originally, multiSPEC 4C camera has four bands centred at 550 nm (Band-1), 660 nm (Band-2), 735 nm (Band-3), and 790 nm (Band-4), corresponding to Green, Red, Red Edge, and Near Infrared (NIR) spectral wavelengths, respectively; the bandwidth of Band-1, -2, and -4 is 20 nm, whereas the bandwidth of Band-3 is 5 nm. However, the camera deployed in this study was modified for Band-1 (Green) and Band-3 (Red Edge) (by the manufacturer after request), so as that Band-1 is centred at 510 nm and Band-3 at 710 nm. This modification was necessary in order to capture wavelengths required for the calculation of CRI2 index (Carotenoid Reflectance Index-2) in addition to NDVI index; the latter was not affected by the modification, as it requires only Red and NIR bands (which were not modified). Compared to NDVI, CRI2 is reported to capture VWO at different infection stages [
11].
The multispectral image was acquired during a flight conducted on 15 June 2016. A set of 315 image tiles (of 10 cm pixel size) and corresponding digital surface models (DSMs) with 80% frontal and 65% side overlap was generated at a flight height of 120 m and flight speed of 35 km/h, during a flight time of 75 minutes. The camera was radiometrically calibrated just before the flight using a Teflon target supplied by the manufacturer. Then, the tiles were downloaded and mosaicked using Pix4D
® software [
12], thus resulting in an orthorectified reflectance map with the following properties:
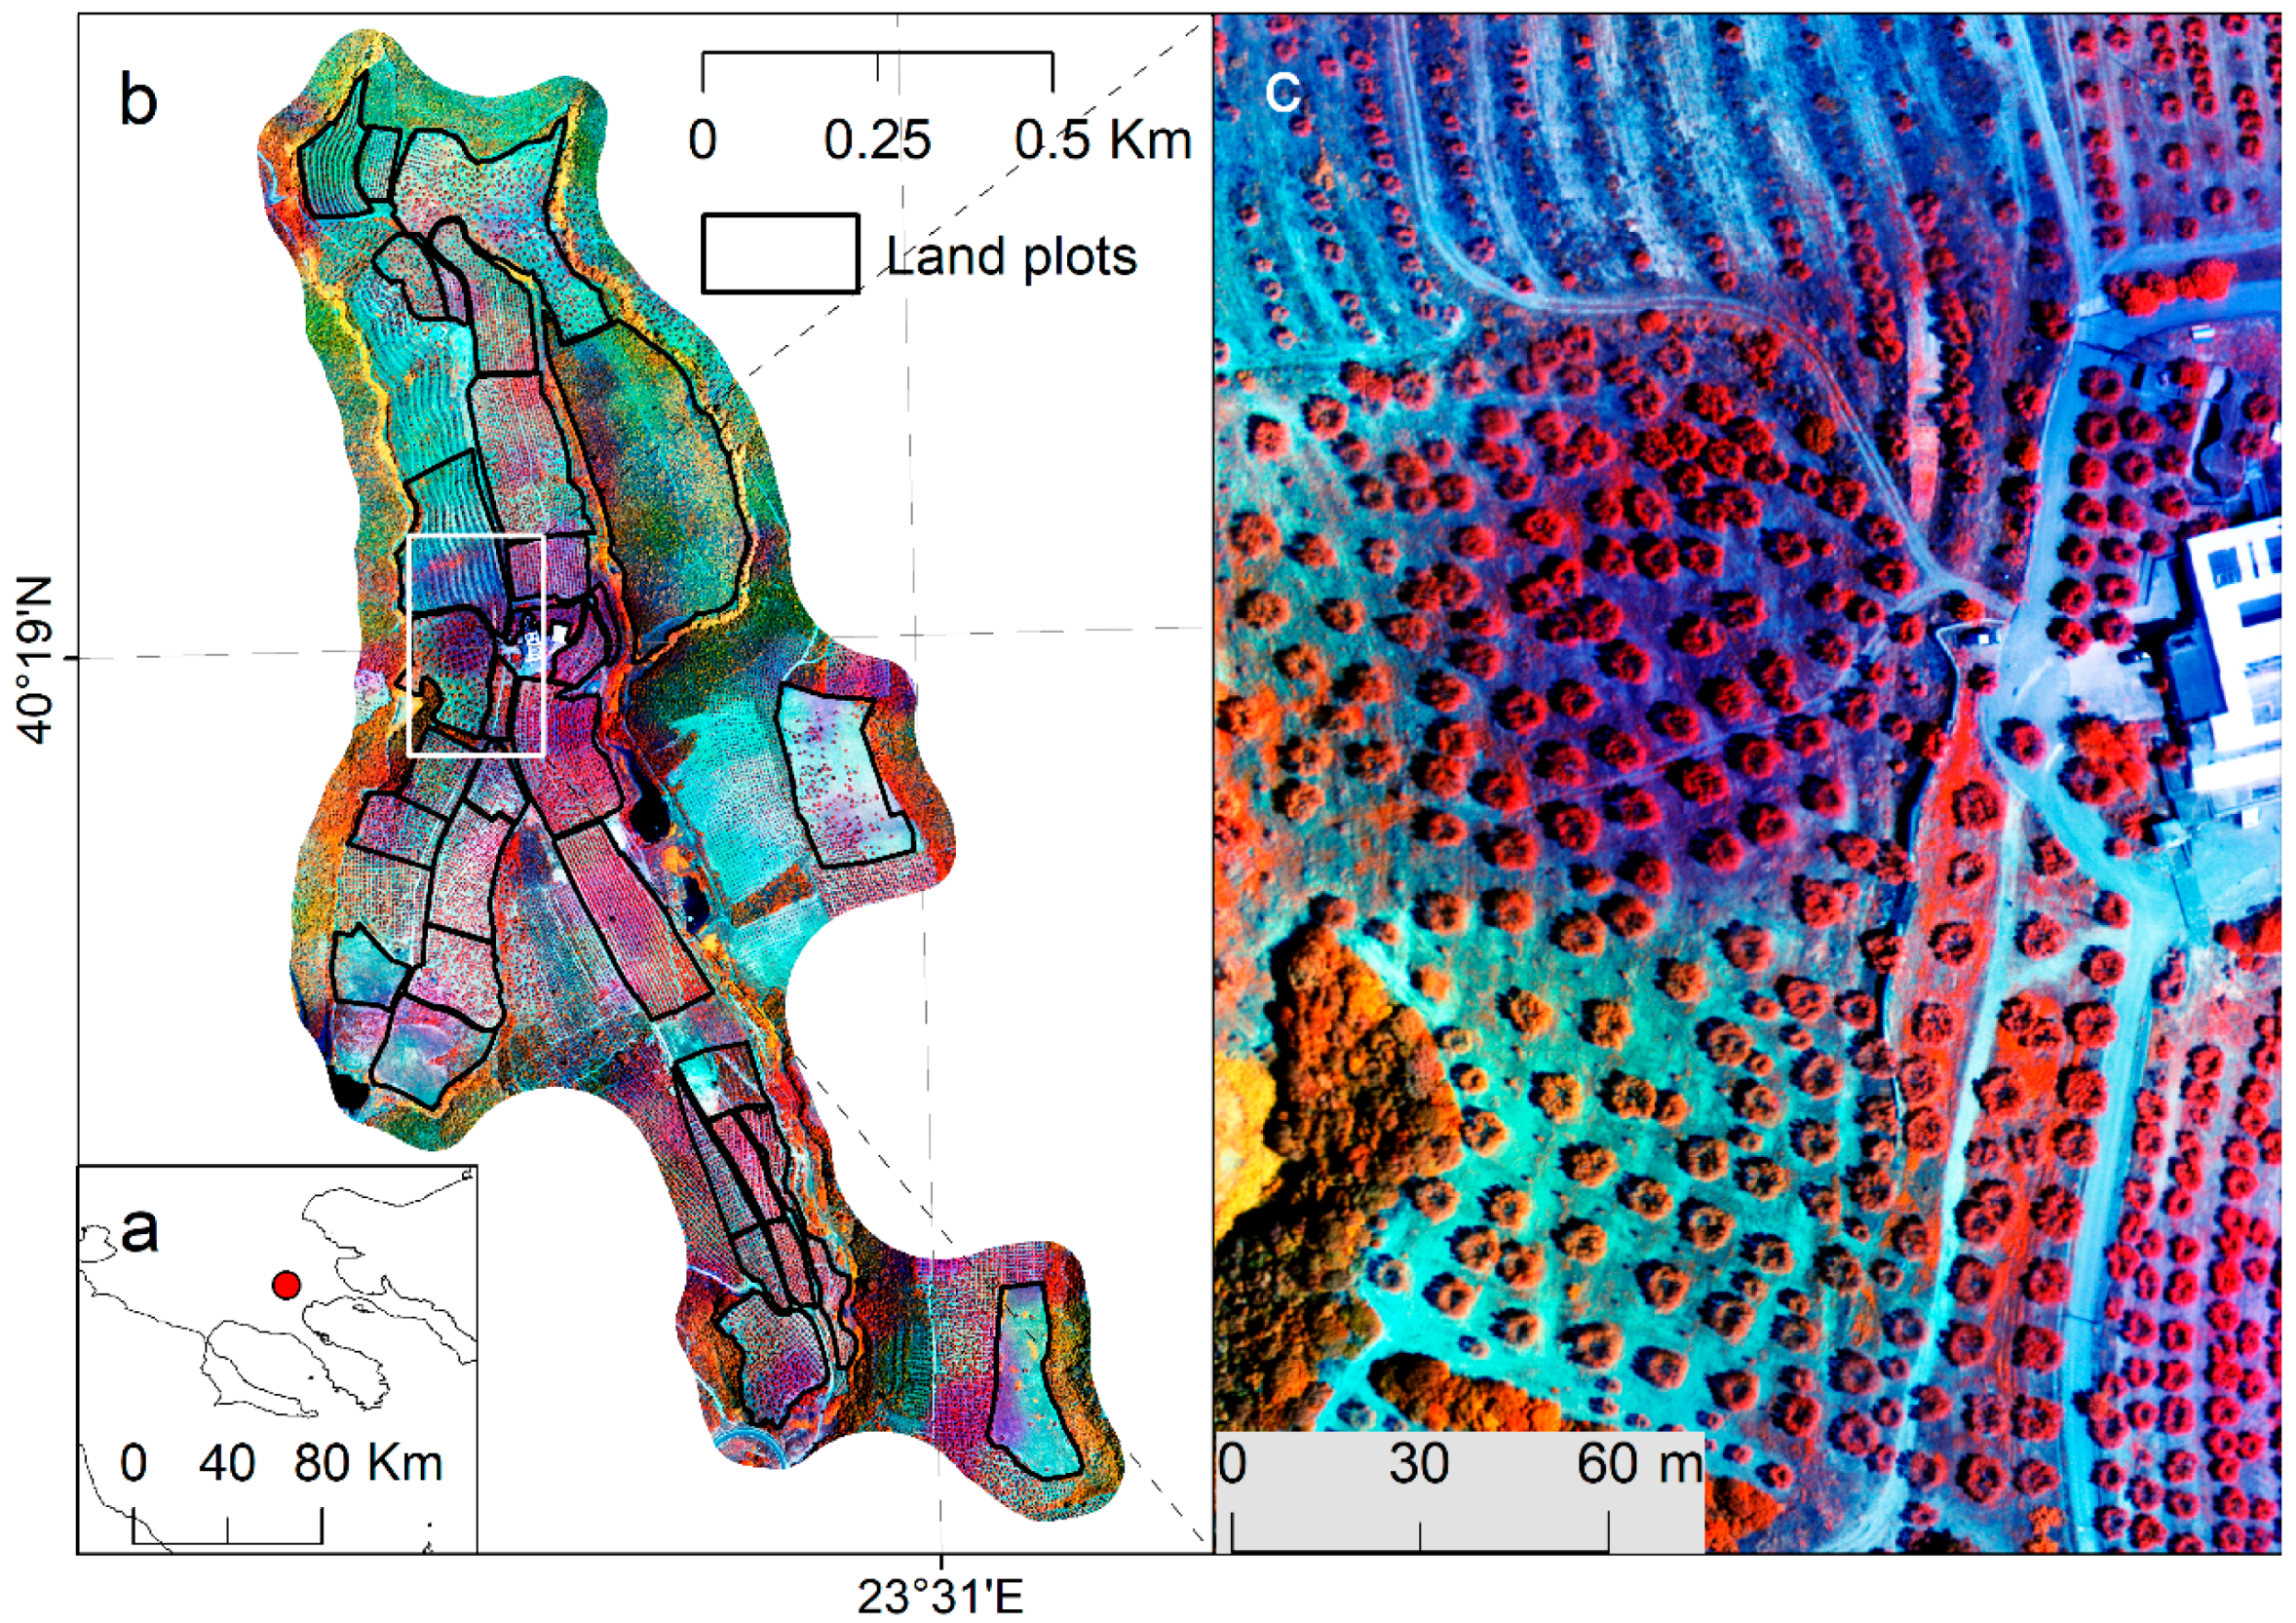
Finally, the image product was masked using a buffer zone of 100 m around the land plots, in order to reduce data volume for processing (
Figure 1).
3. Image Classification
The overall target of the image classification was to produce a binary map in which olive trees are discriminated from all other features of olive plantation environs, such as naked soil, grass, bushes, or different tree types.
The classification was implemented using object-based image analysis (OBIA), which focuses on analysing groups of pixels (called ‘image objects’ or simply ‘objects’), rather than single pixels alone. OBIA comprises two steps: (a) image segmentation for the creation of objects and (b) classification of the created objects [
13]. Reference [
14] reported that object-based classification approaches demonstrate, in general, better performance than pixel-based approaches when mapping individual landscape features.
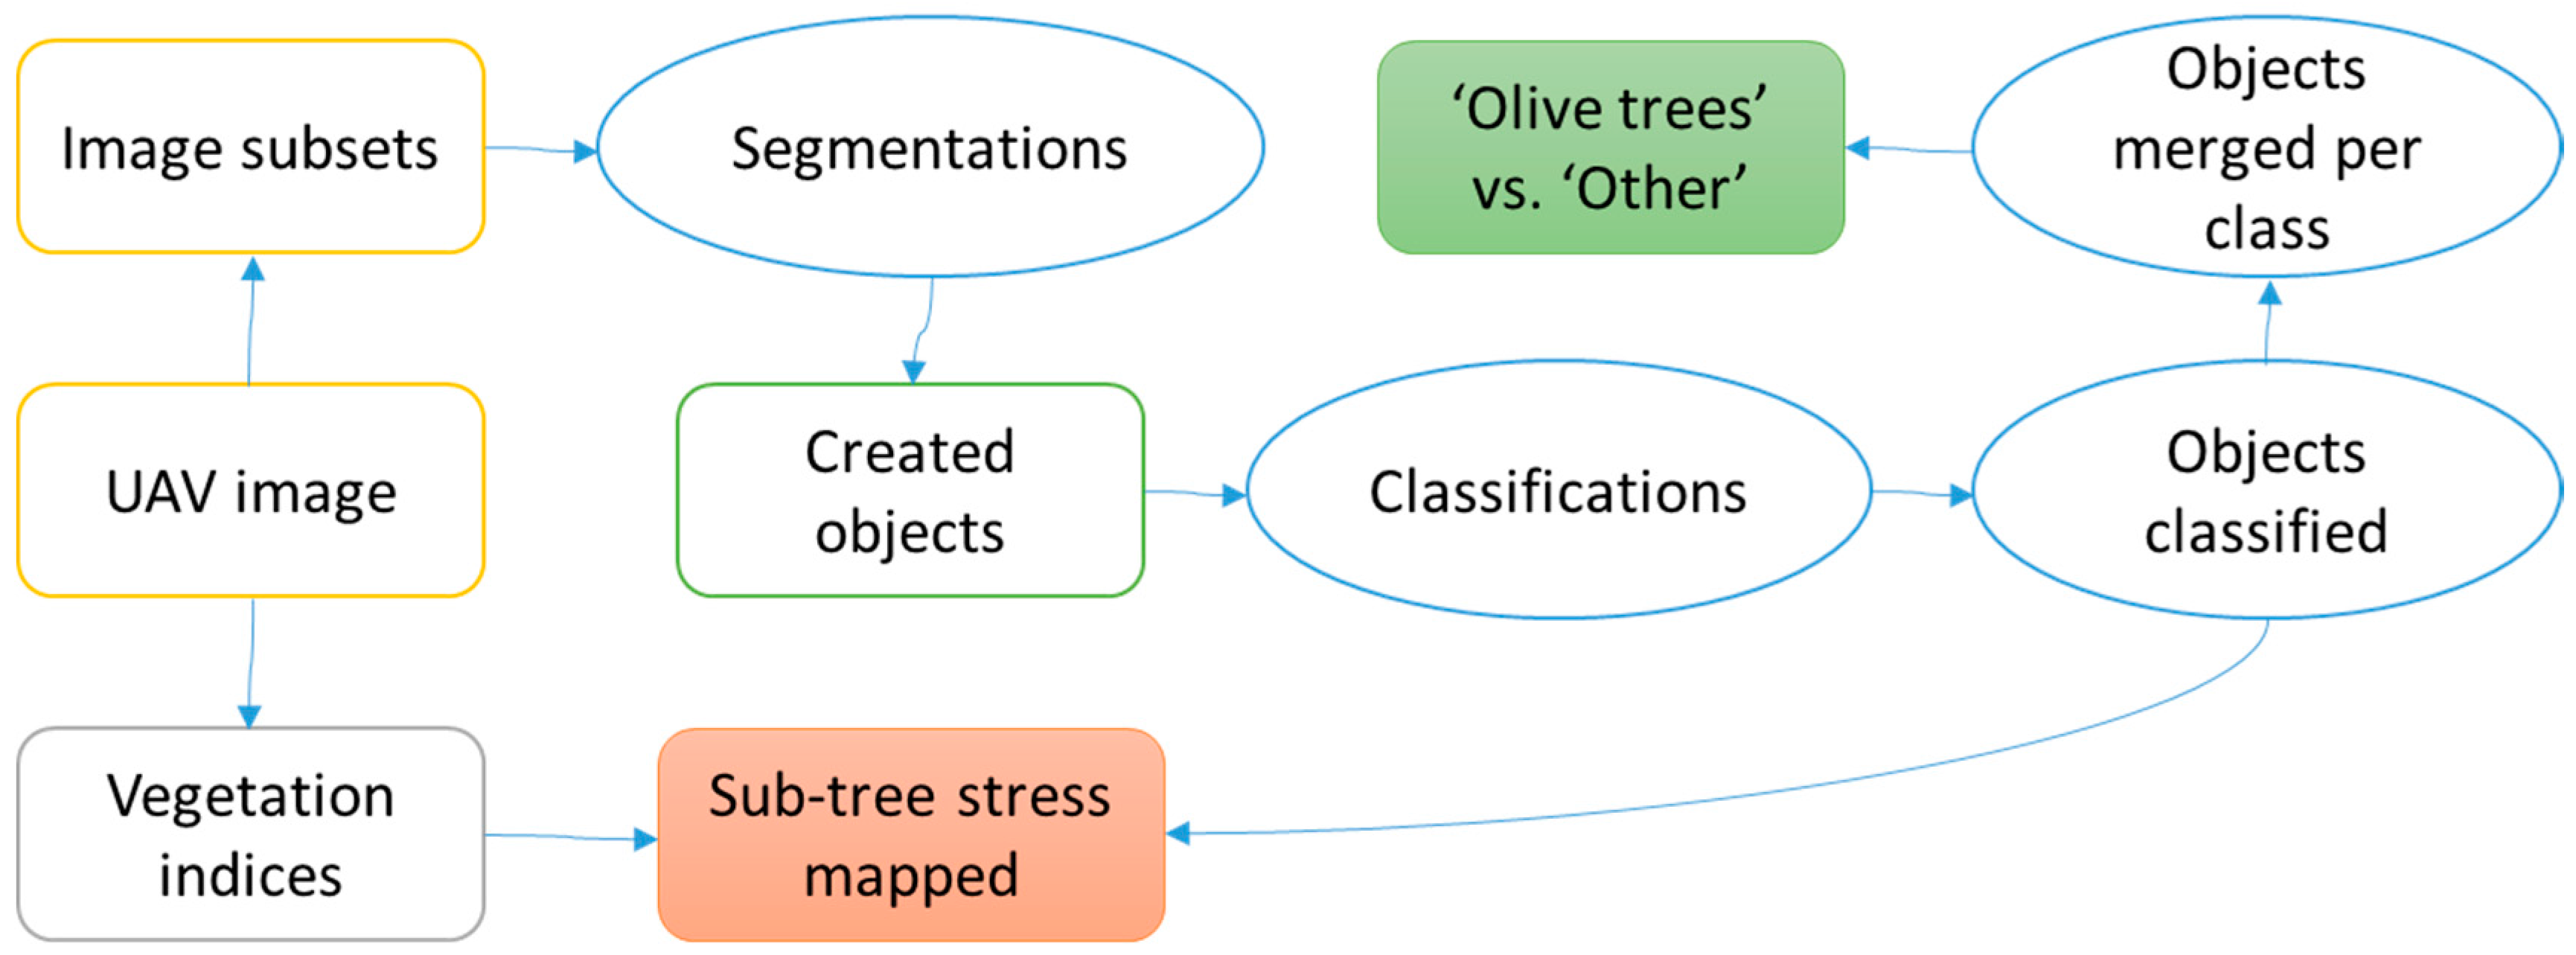
The segmentation targeted the creation of image objects corresponding to sub-tree features (rather than the entire tree crown), while the classification divided the produced objects into two categories, namely ‘Olive trees’ and ‘Other’. The objects classified as ‘Olive trees’ have the potential to be used as units of tree-stress assessment at a sub-tree scale, using vegetation indices suitable to indicate known stresses [
15,
16]. All the classified objects can be merged per class to create a binary classification map (
Figure 2).
OBIA was performed with the multiSPEC 4C image using eCognition Developer software®. For faster processing, however, the image was divided into 17 homogeneous subsets, according to some macroscopic properties of the trees, such as density, size, shape, and structure, assessed visually and by in situ observations. This division also allowed the calibration of the classification process according to the particularities of the plantation within every image subset.
The digital surface model (DSM) produced from the image dataset was excluded from analysis (both segmentation and classification), as preliminary tests indicated that there were not always clear differentiations between contiguous pixels of trees and ground (especially in densely planted sites).
A region-growing segmentation algorithm supported by eCognition Developer software
®, namely the Fractal Net Evolution Approach (FNEA, also known as Multiresolution Segmentation), was applied for the segmentation of the image subsets. The parameter with the greatest influence in determining the desired object size in FNEA is the scale parameter, while the object’s geometry is influenced by the ratio of the colour to shape factor and the ratio of compactness to smoothness factor [
17]; also, each layer may be weighted by different factors. According to a trial-and-error procedure, the parameters applied to the segmentation of all image subsets were the following:
Image layer weights: 1, 1, 1, and 2 for Band-1, -2, -3, and -4, respectively
Scale parameter: 5
Colour weight: 0.8 (Shape weight: 0.2)
Compactness weight: 0.5 (Smoothness weight: 0.5)
Considering that operational mapping should be rapid, objective, and repeatable, a semi-automated classification methodology was followed. Automated methods, especially when the early detection of plant infections is concerned, are critical for precision crop protection [
18]. In this study, automation was realised by using rules, in terms of sets of class assignment functions, while site-specific particularities were handled by calibrating the parameters of these functions. Based on a priori knowledge of the environment to be mapped, rules have high potential for operational mapping, as has been shown by a number of studies [
19,
20,
21]. On the contrary, statistical classification approaches are reported to be strongly influenced by sampling strategy and image interpreters’ skills; they are also scene-dependent and assume normal distribution of signature data [
22].
Initially, the selection of the most suitable input parameters in the class assignment functions that would separate ‘Olives trees’ from ‘Other’ was accomplished using ‘Feature Space Optimisation’, a sampling tool embedded in eCognition Developer software®. The five most suitable parameters (called ‘features’) indicated by the tool were: NDVI, Maximum Difference, Border Index, Elliptic Fit, and Roundness. The combination of these features resulted in a Euclidian distance of 2.31 in the feature space; for comparison, NDVI alone resulted in a Euclidian distance of 1.75.
However, a visual check of some preliminary, indicative classification results with the use of all predefined features showed that many objects clearly belonging to olive trees failed to classify as such. As an alternative solution, a trial-and-error procedure assisted in indicating an extra feature, namely Mean Value of Layer 4, which was shown to improve the classification substantially when used together with NDVI and Maximum Difference (i.e., the first two predefined features out of the five original ones).
As a result, the class description of ‘Olive trees’ contained three class assignment functions linked with the Boolean operator ‘AND’ (i.e. a true output is resulted only when all the functions are true); the description of ‘Other’ was simply the opposite of ‘Olive trees’ (i.e. NOT ‘Olive trees’). In order to define the thresholds of the features which result in true values in the class assignment functions of ‘Olive trees’, a new trial-and-error procedure was applied per image subset, resulting in the following values:
NDVI larger than 0.28 on average; in most cases the threshold was set to 0.30, in a few cases it was set to 0.25, and in one case to 0.175.
Maximum Difference larger than 87 on average, with thresholds ranging from 65 to 105 from subset to subset.
Mean Value of Layer 4 larger than 0.67 on average, with thresholds ranging from 0.38 to 1.13 from subset to subset.
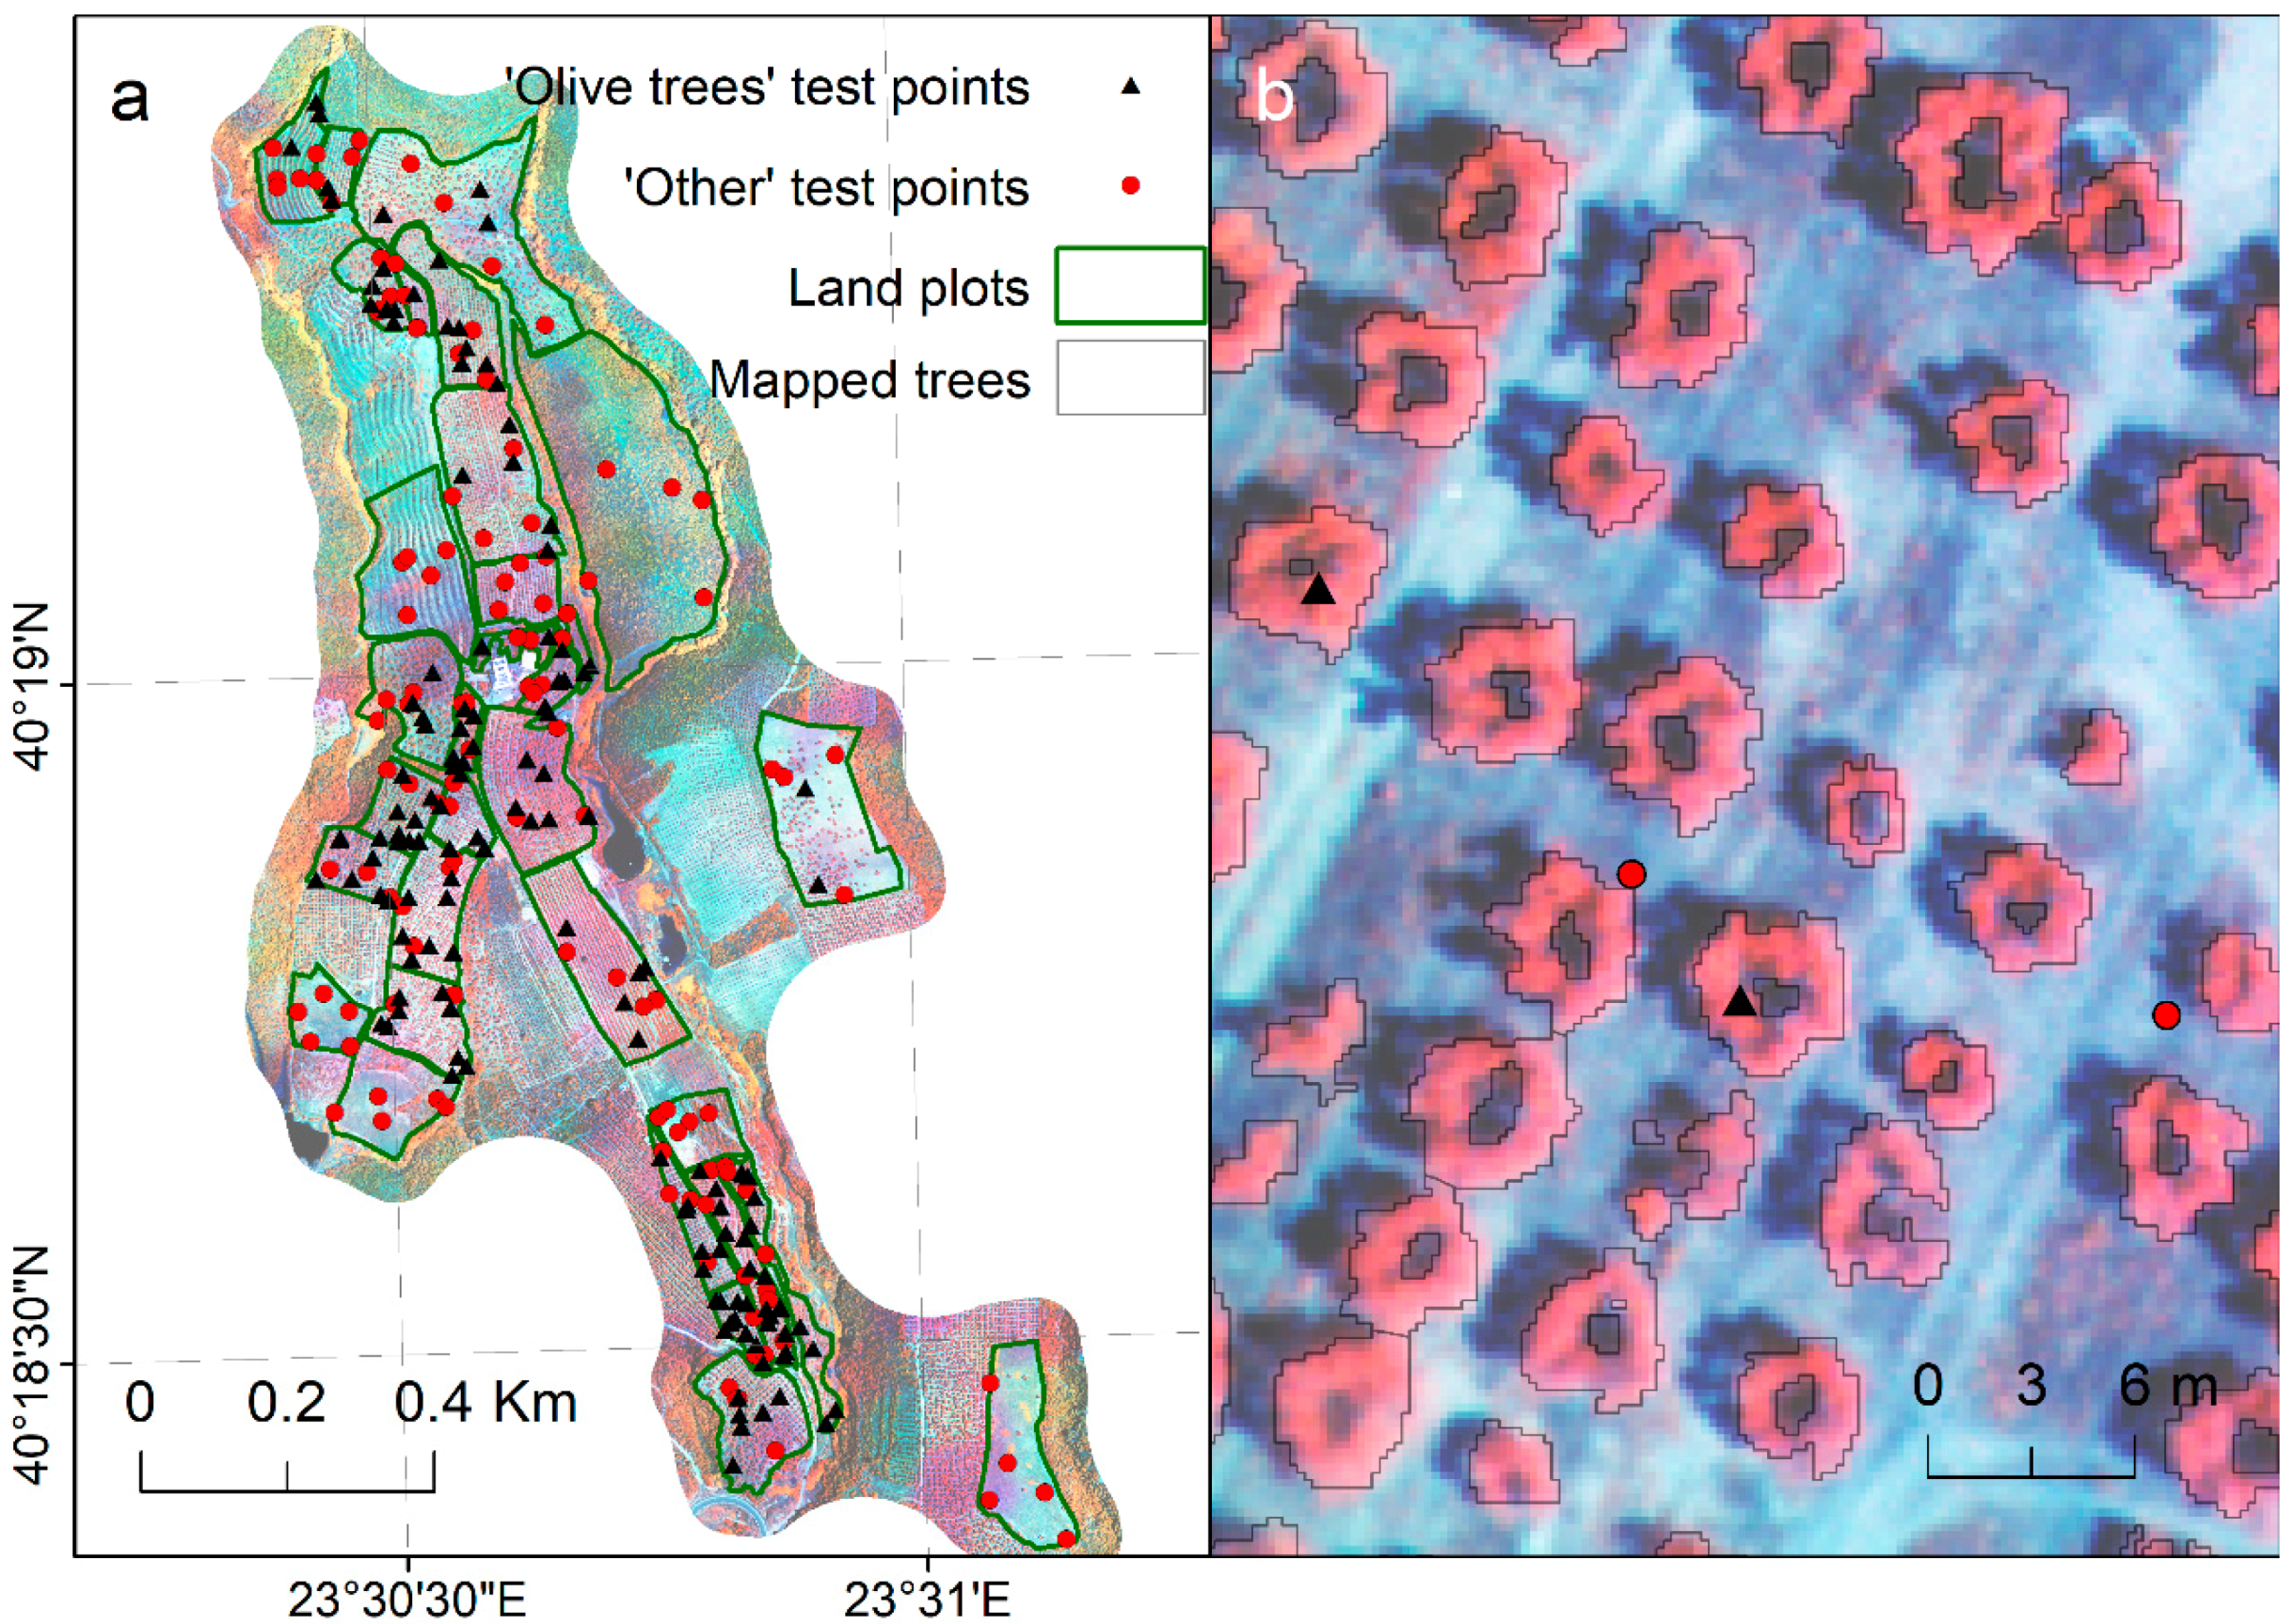
After limited manual corrections, the classification outputs were verified as accurate and realistic by visual assessments (
Figure 3).
The objects classified as ‘Olive trees’ were introduced to a Geographic Information System, where they were merged into continuous spatial features. In the new polygon layer resulted, the features corresponded either to single olive trees, or to olive trees connected to each other. Finally, connected olive tree features were manually split into single tree features.
A number of 10,310 olive trees were mapped in the study site covering 122,698 m2, with an average crown size of 11.9 m2 and a maximum of about 54 m2. Considering that the extent of the plantation was 578.551 m2, the portion of tree coverage was 21% of the plantation. Further agronomic details of the plantation per land plot and overall can be extracted according to the farmer’s requirements (e.g., tree density, distance between trees, etc.).
5. Monitoring Potential
The semi-automated classification method, accomplished by manual corrections of the output maps, may constitute an operational processing chain for mapping olive plantations on a sub-tree scale. This chain appears to perform generally better than on-screen digitisations applied in past tree-stress assessment projects. In those projects, thematic accuracies were quite lower than 100%, while geometric accuracies were very moderate (as tree shapes were over-simplified).
However, the proposed operational processing chain requires object-based image analysis software and relevant personnel skills, which are not necessary for on-screen digitisation. On the other hand, the latter requires about two man-months to complete a 100-ha project, whereas the current method requires approximately only 10 man-days (
Table 2).
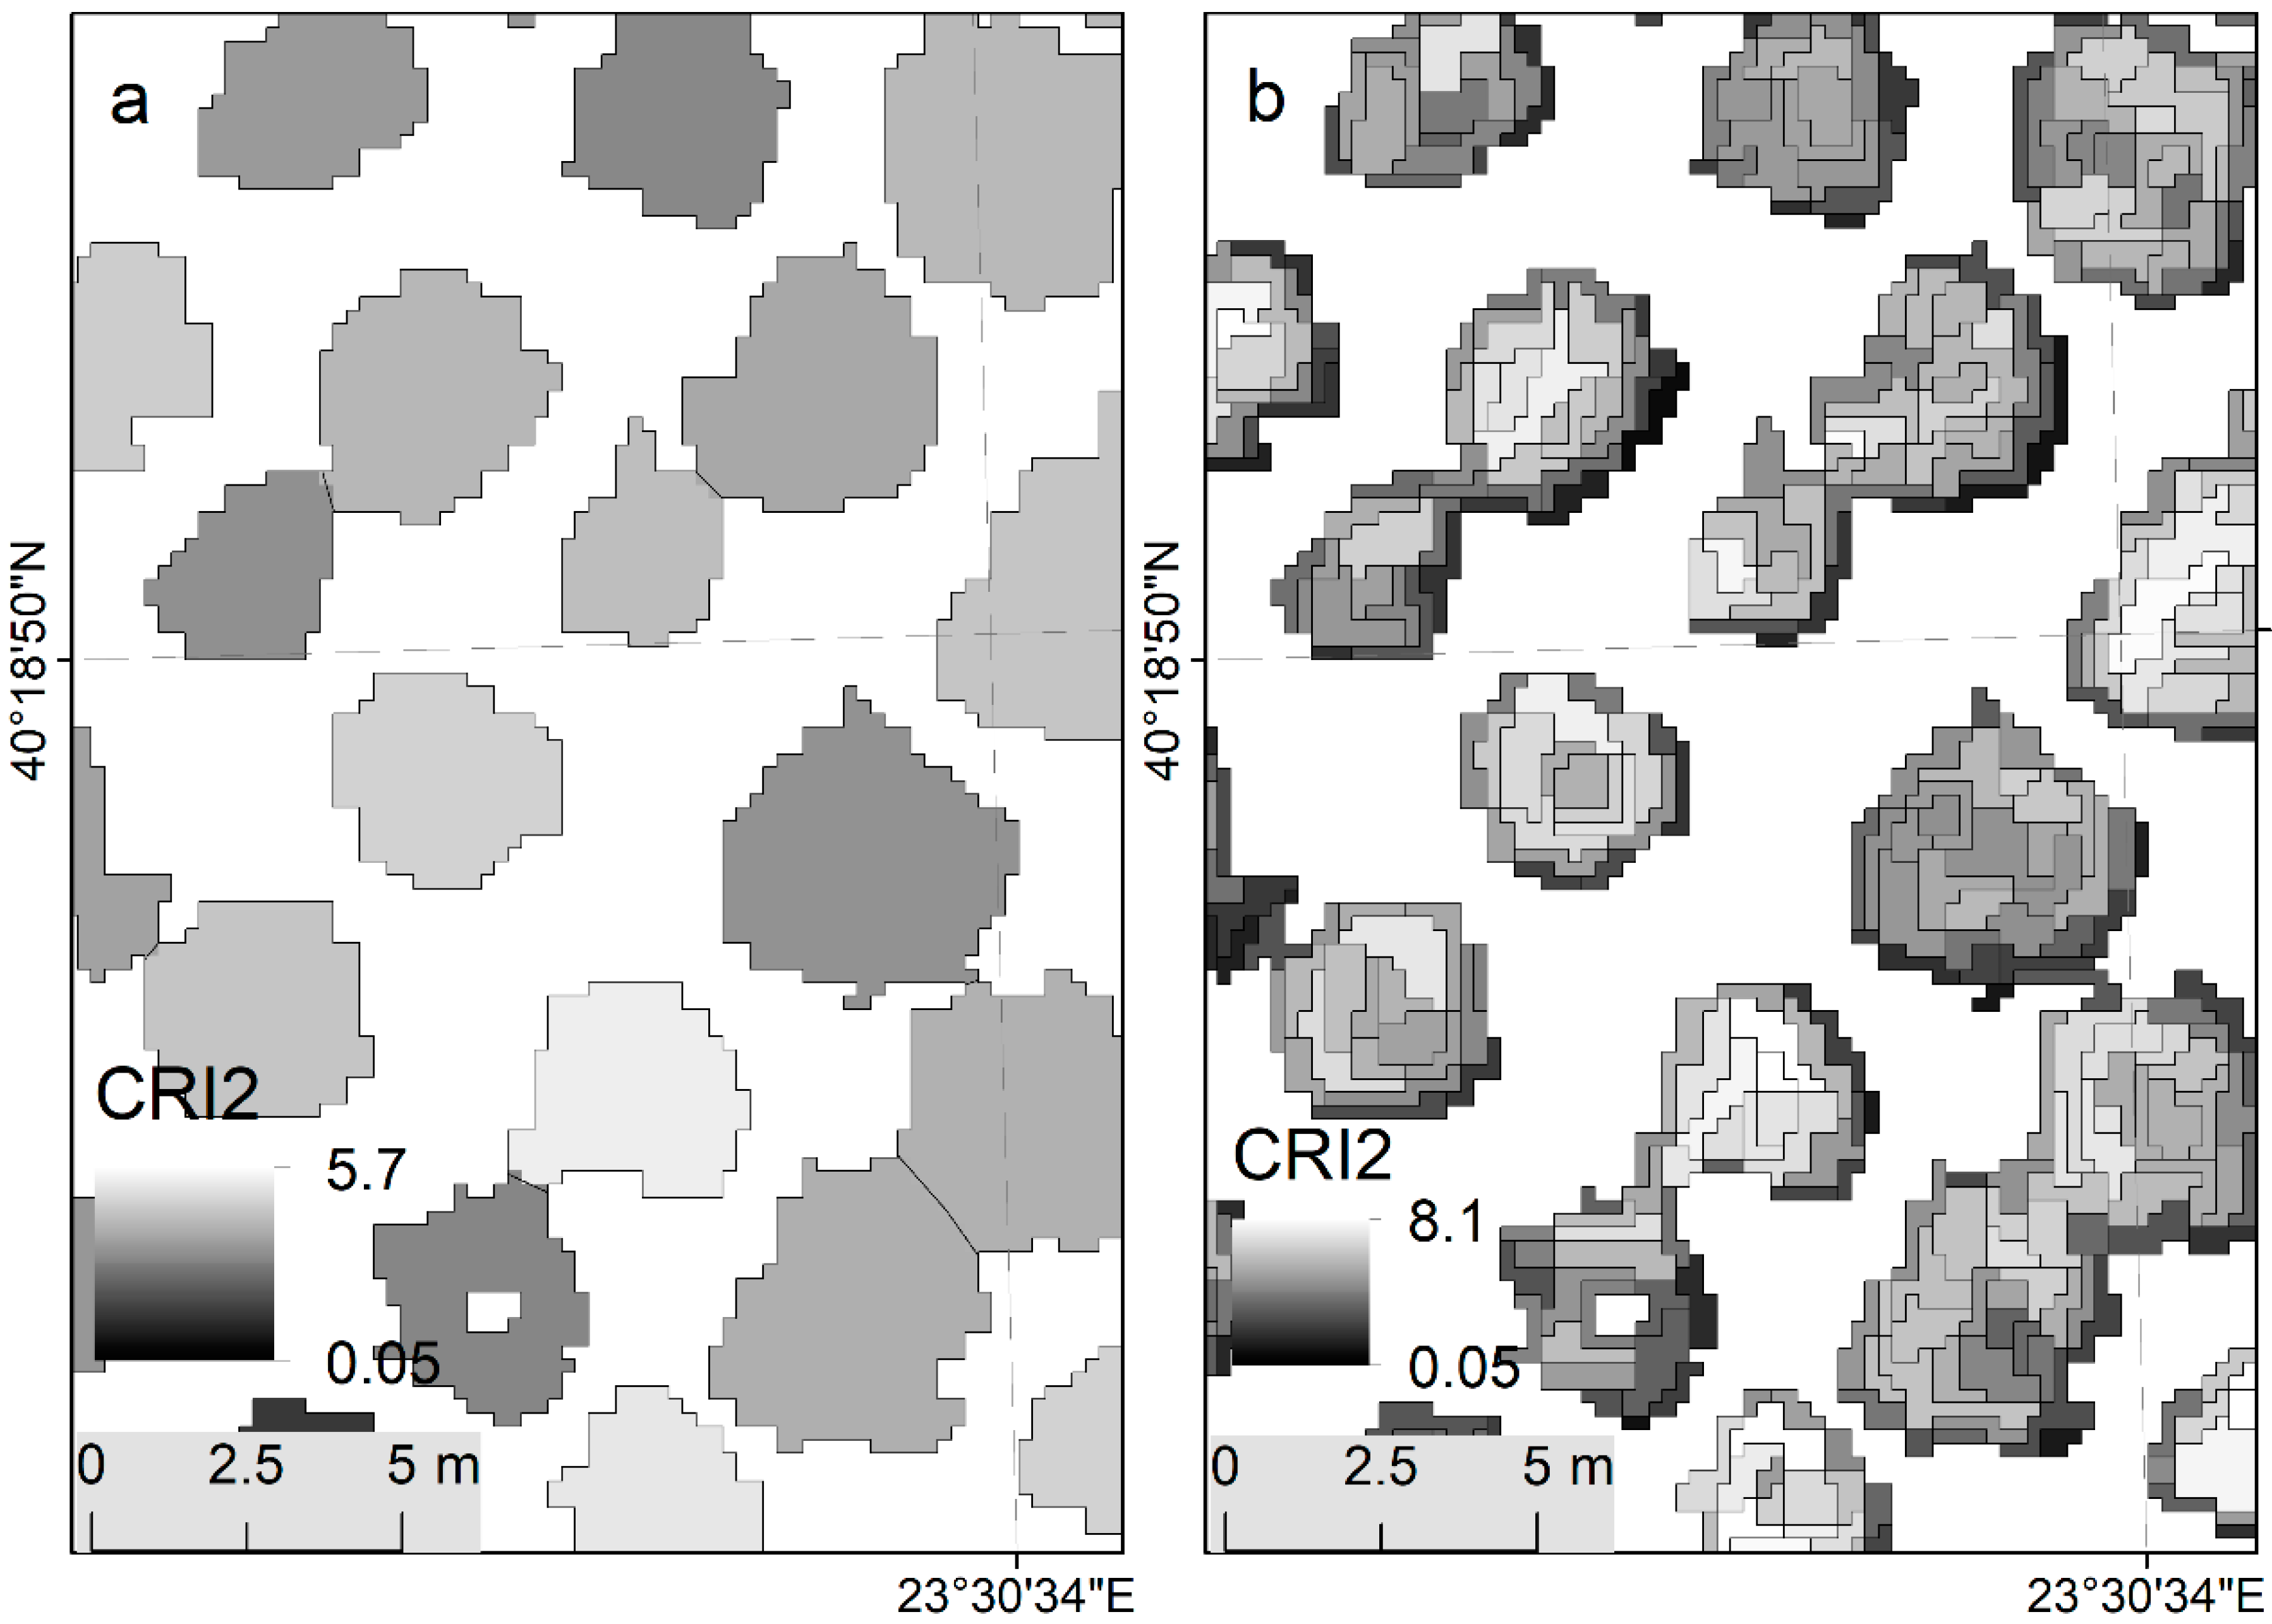
Moreover, the proposed methodology increases the possibility of detecting tree stress at earlier stages. This can be justified by the fact that sub-tree scale mapping may reveal extreme values of vegetation indices related to known stresses, which would be averaged to lower values if calculated on a tree scale. In the current study, a raise of the coefficient of variation of CRI2 values from 14.6% for the entire tree to 20.5% for the sub-tree objects is noticed, while the maximum of CRI2 value is raised by 40.3%, accordingly. Similarly, the NDVI statistics for the entire tree and the sub-tree scale show a raise from 11.4% to 19.8% and from 0.66 to 0.76 (i.e., by 15%), for the coefficient of variation and the maximum value, respectively (
Figure 5).
Up until now, no remote sensing studies have been conducted for stress detection in olive plantations on a sub-tree scale using UAV imagery. In relevant studies conducted in Spain and Greece, but on a tree scale, Reference [
18] achieved an overall accuracy of 79.2% in detecting Verticillium wilt in olives (VWO) using NDVI and other indices, while Reference [
11] showed that the combined use of CRI2 and NDVI for the detection of early and advanced VWO infection symptoms, respectively, were verified at a large degree.
6. Conclusions
This study showed that mapping olive trees with object-based classification of UAV multispectral imagery using rules can result in excellent thematic and geometric accuracies; here, an overall thematic accuracy of 93% and an excellent geometric accuracy were achieved.
It is suggested that an image capturing a large olive plantation (moreover, a heterogeneous one) should be divided into subsets, in order to speed up and facilitate parameter calibration within a semi-automated classification processing chain. Manual corrections can be accomplished in parallel with the required split of the connected olive trees into single ones.
The calibration of empirical class assignment functions in a baseline ruleset was necessary for the adaptation of the classification method to the site-specific conditions of the plantation; differentiations were due mainly to an irregular distribution of macroscopic tree properties (density, size, shape, structure, etc.) and possibly to the different varieties of the plantation.
In addition to the excellent classification results, mapping output on a sub-tree scale allows one to increase the early-detection potential of olive plantation monitoring for stress caused by unknown sources.
In summary, the proposed operational processing chain is considered to be superior in terms of cost, time, and performance compared to conventional methods conducted with on-screen digitisation of trees.

 ,
, 


