
A Foveon Sensor/Green-Pass Filter Technique for Direct Exposure of Traditional False Color Images

Abstract
:
1. Introduction
2. Background
3. Materials and Methods
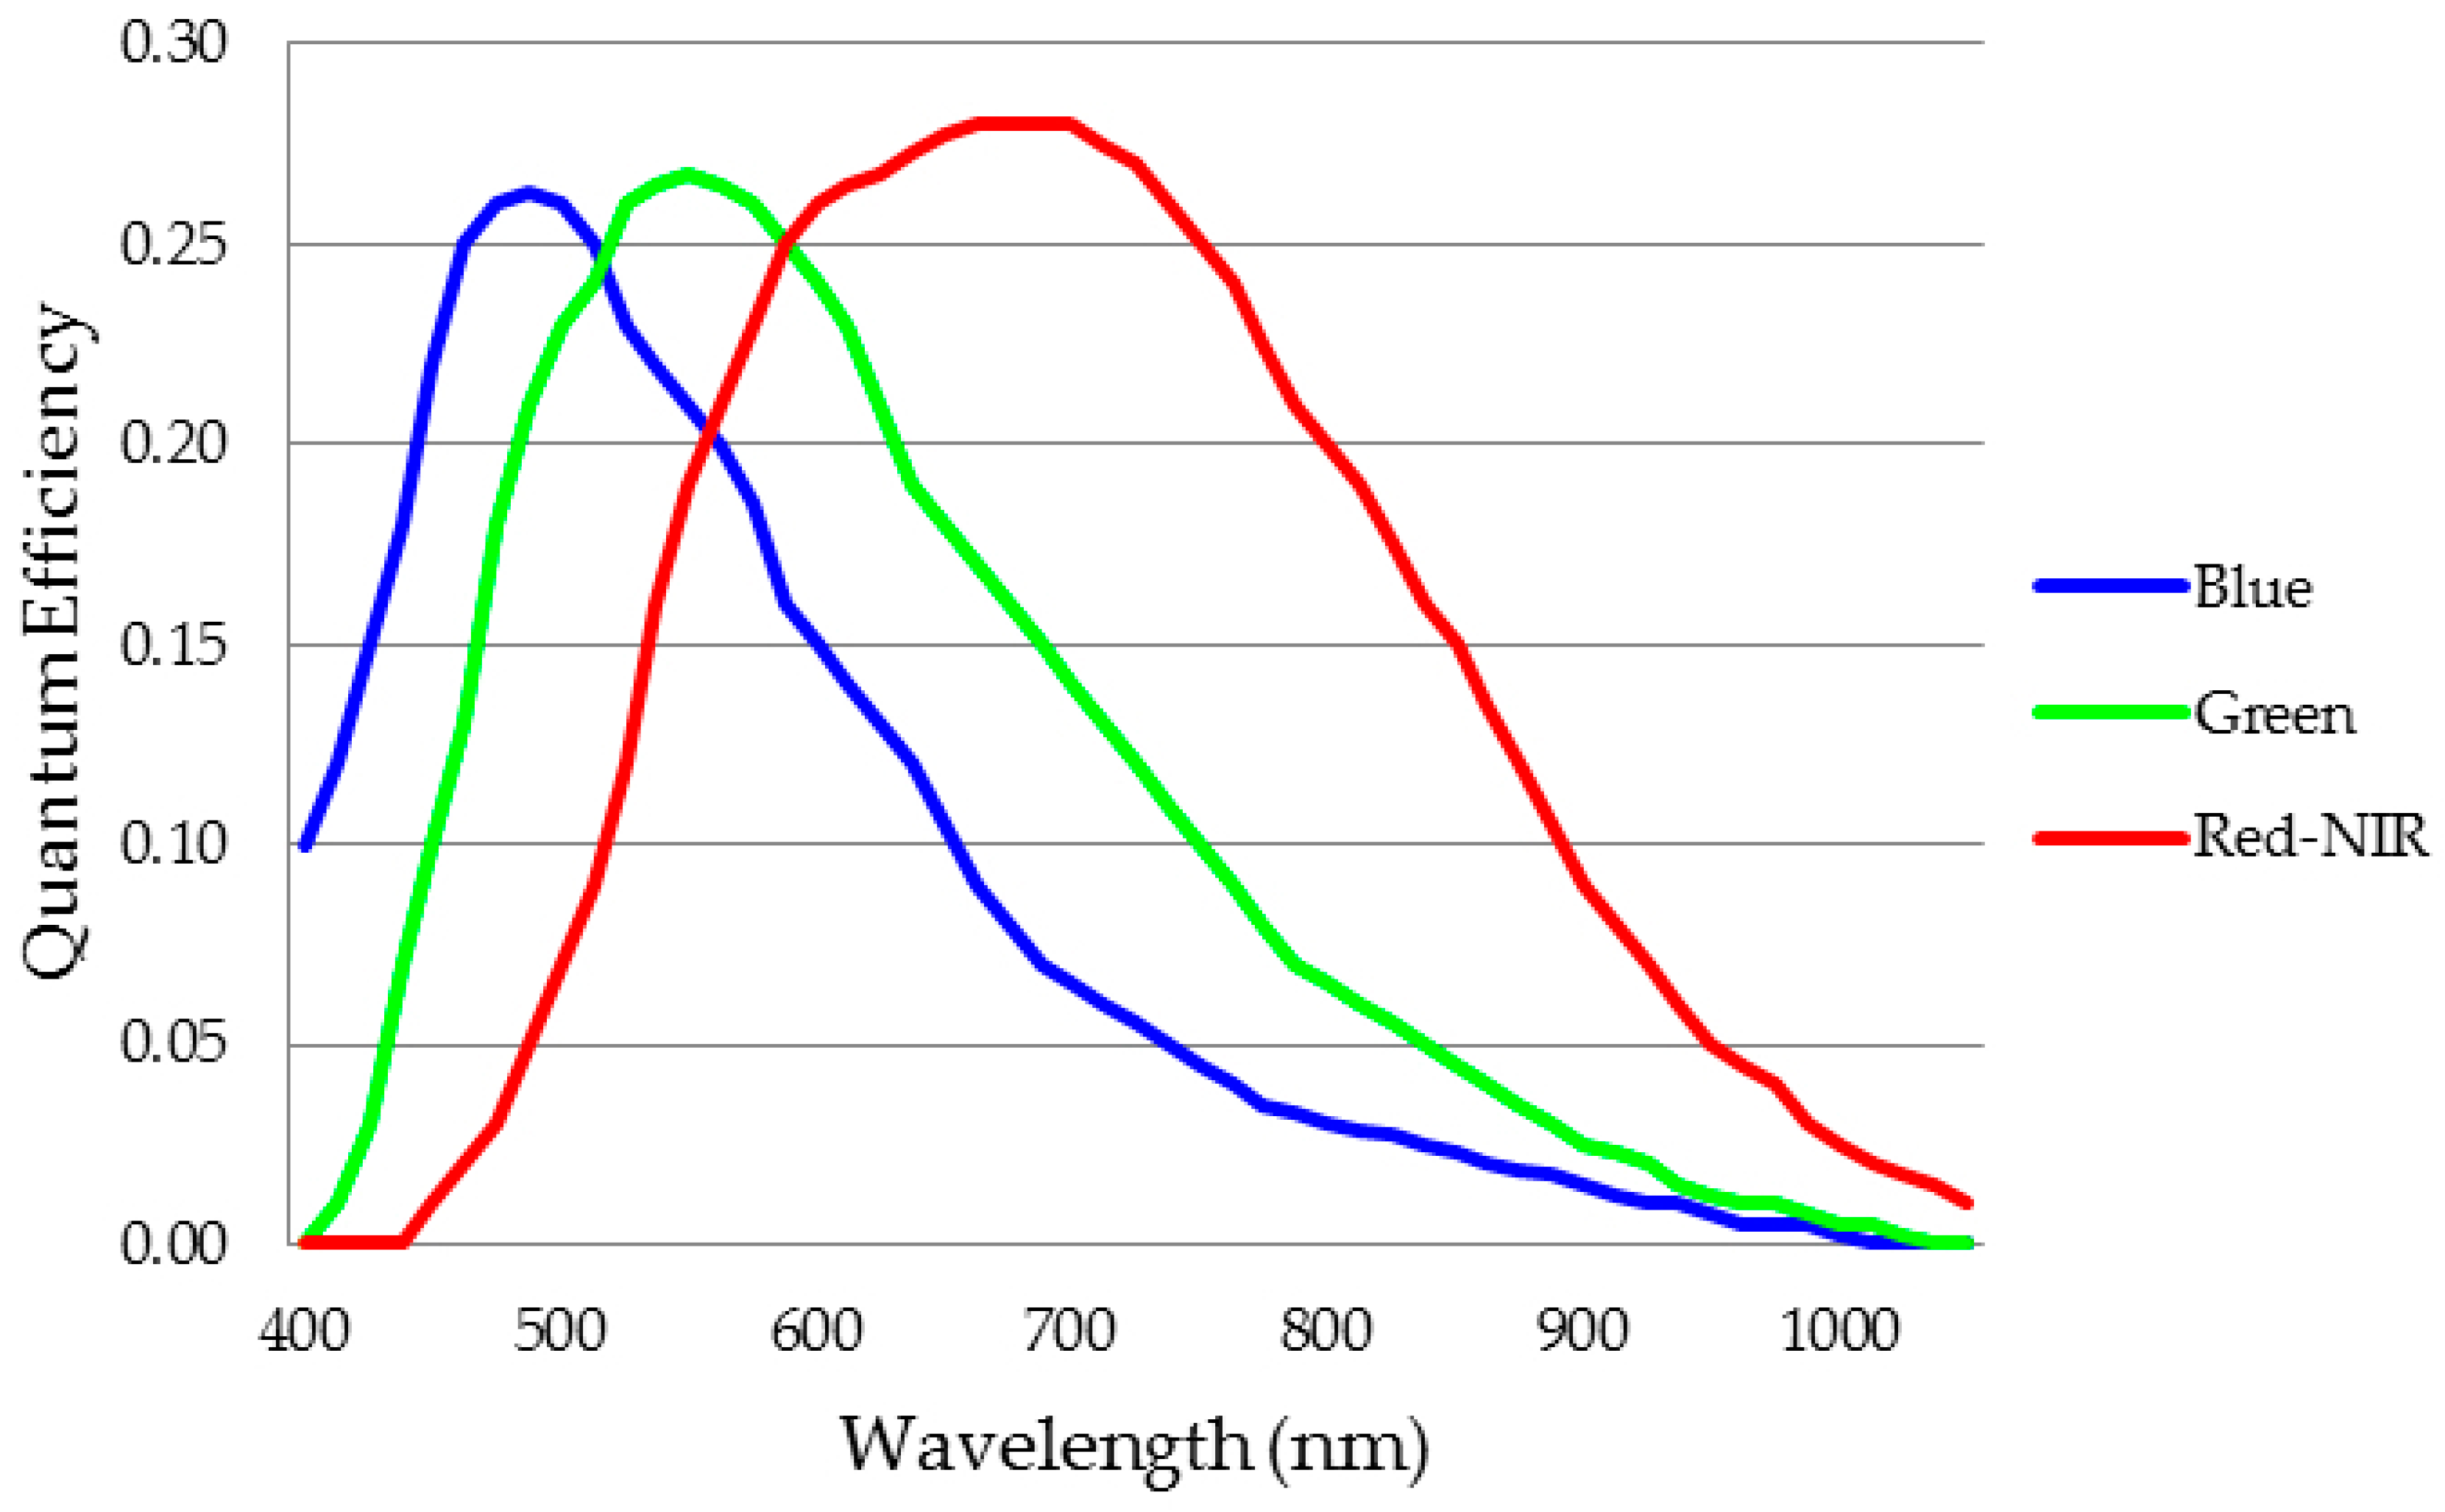
3.1. Camera/Sensor
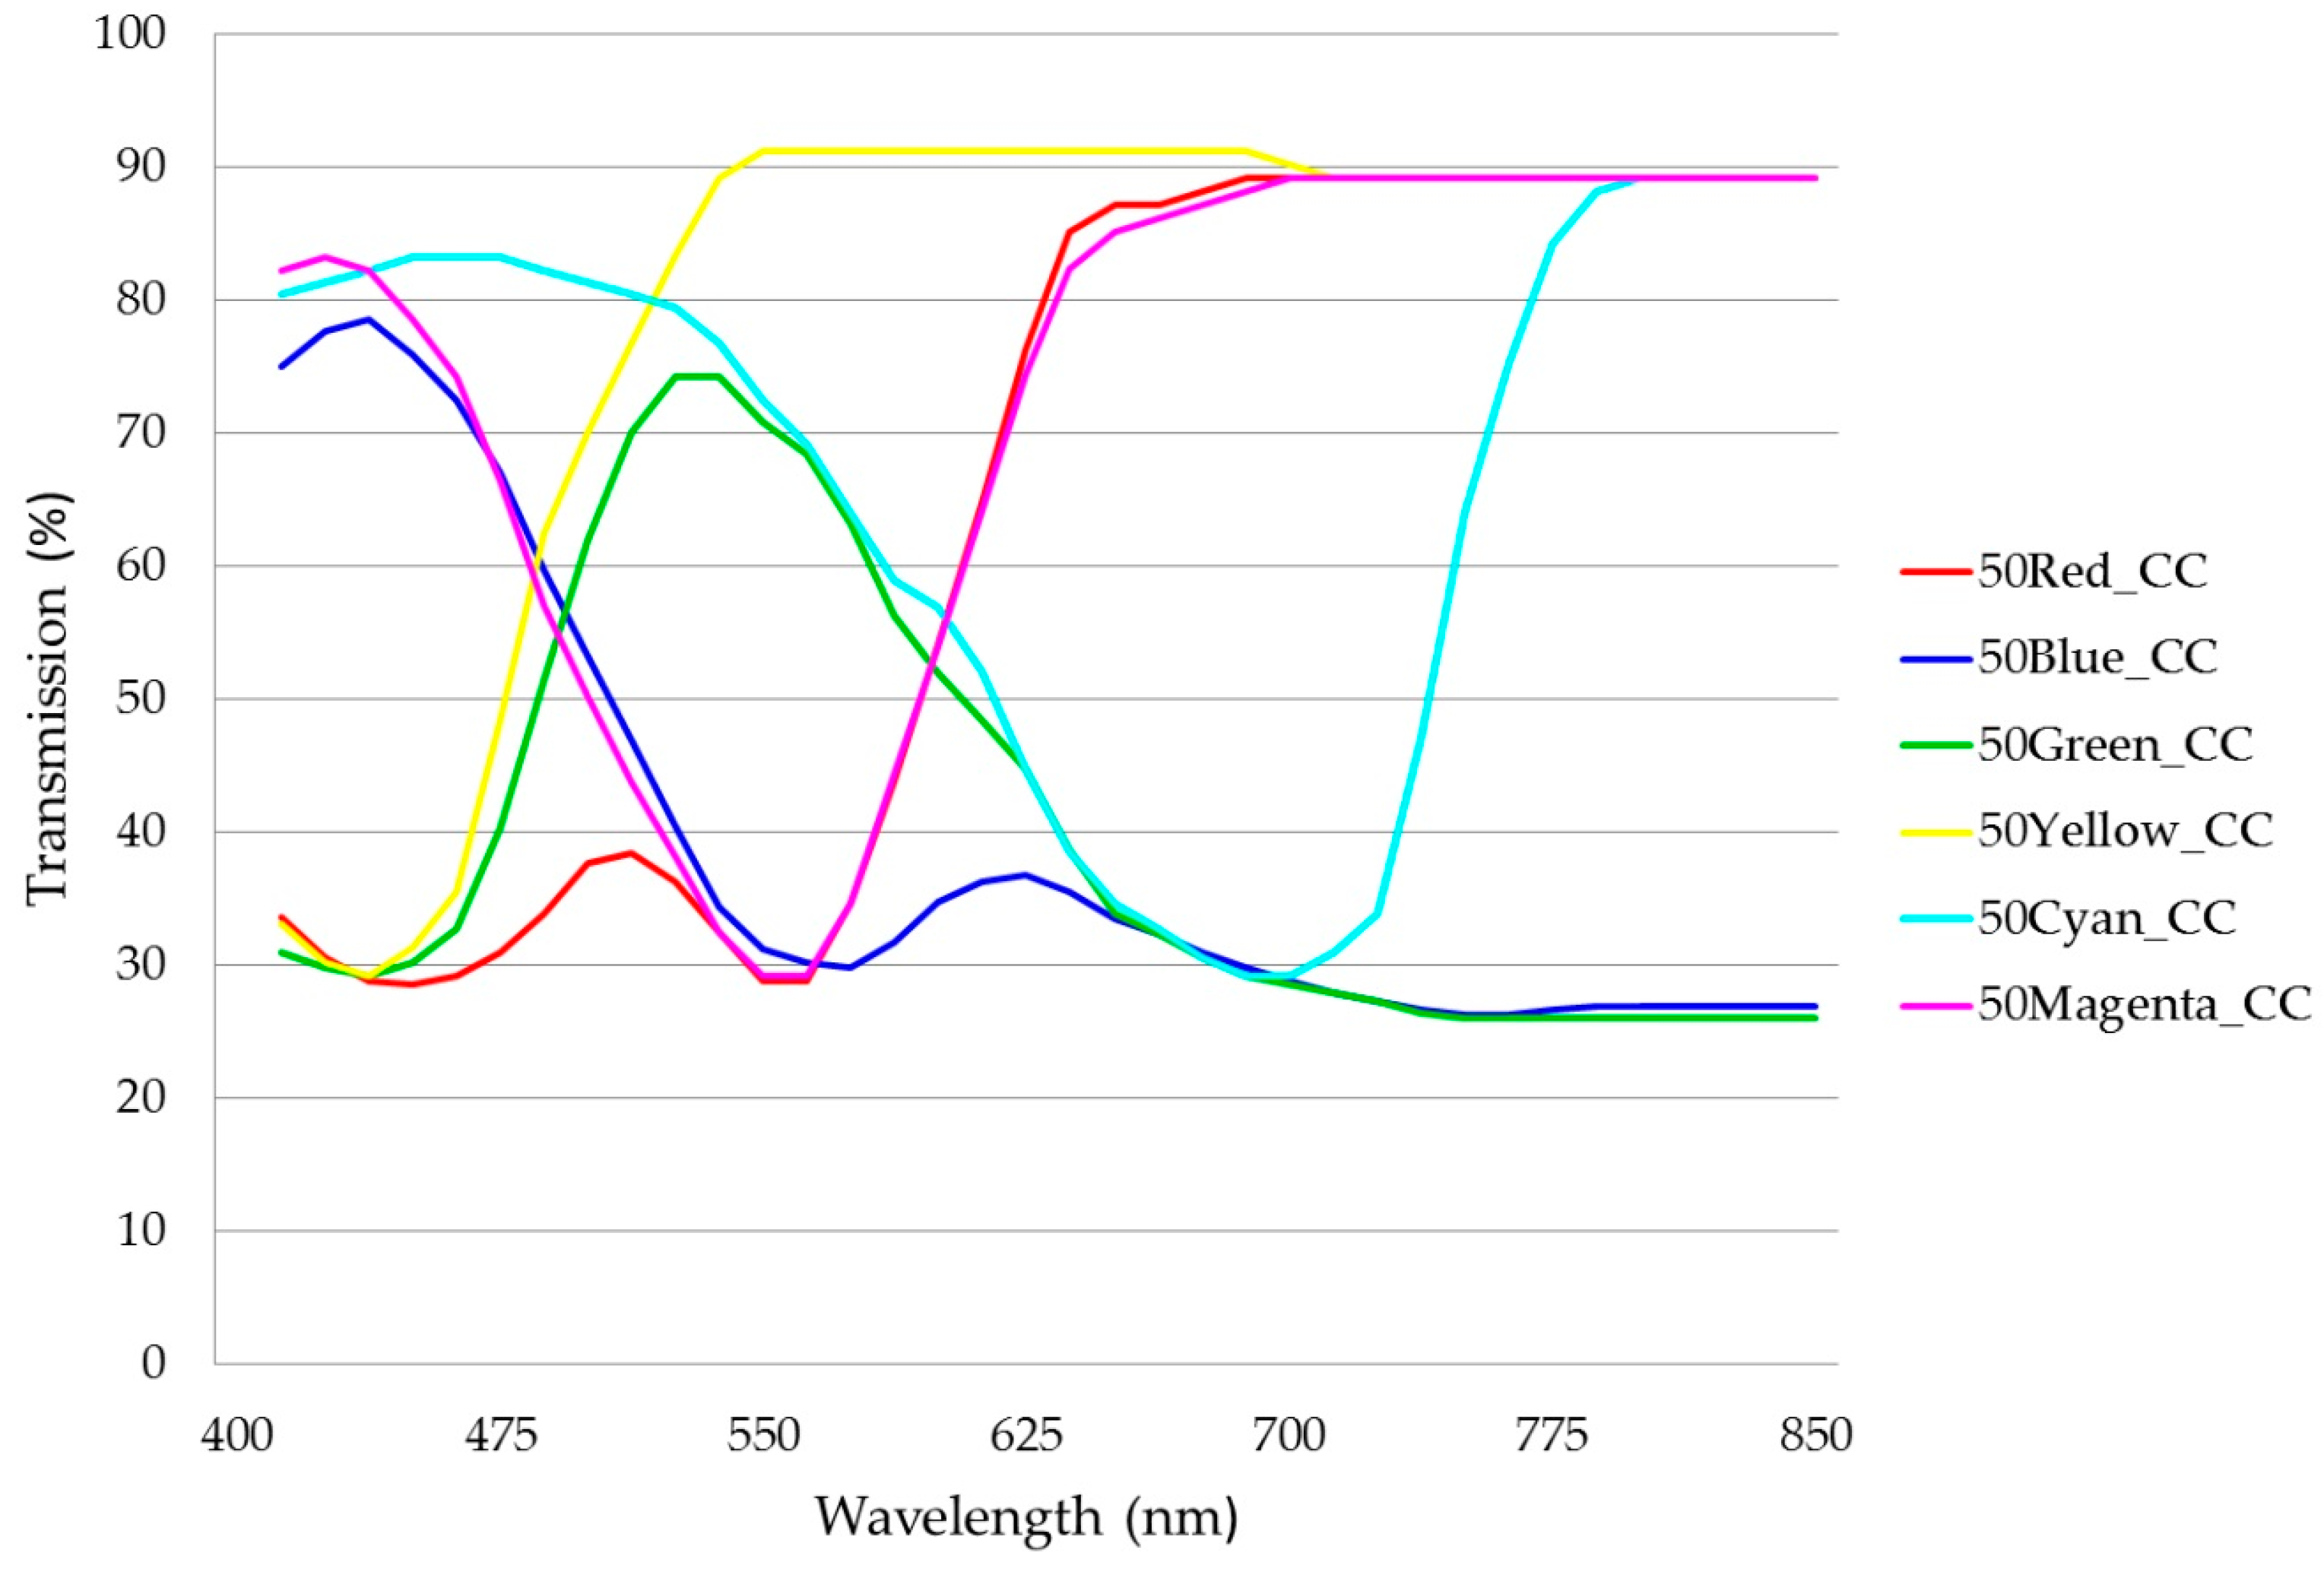
3.2. Green-Pass Filters
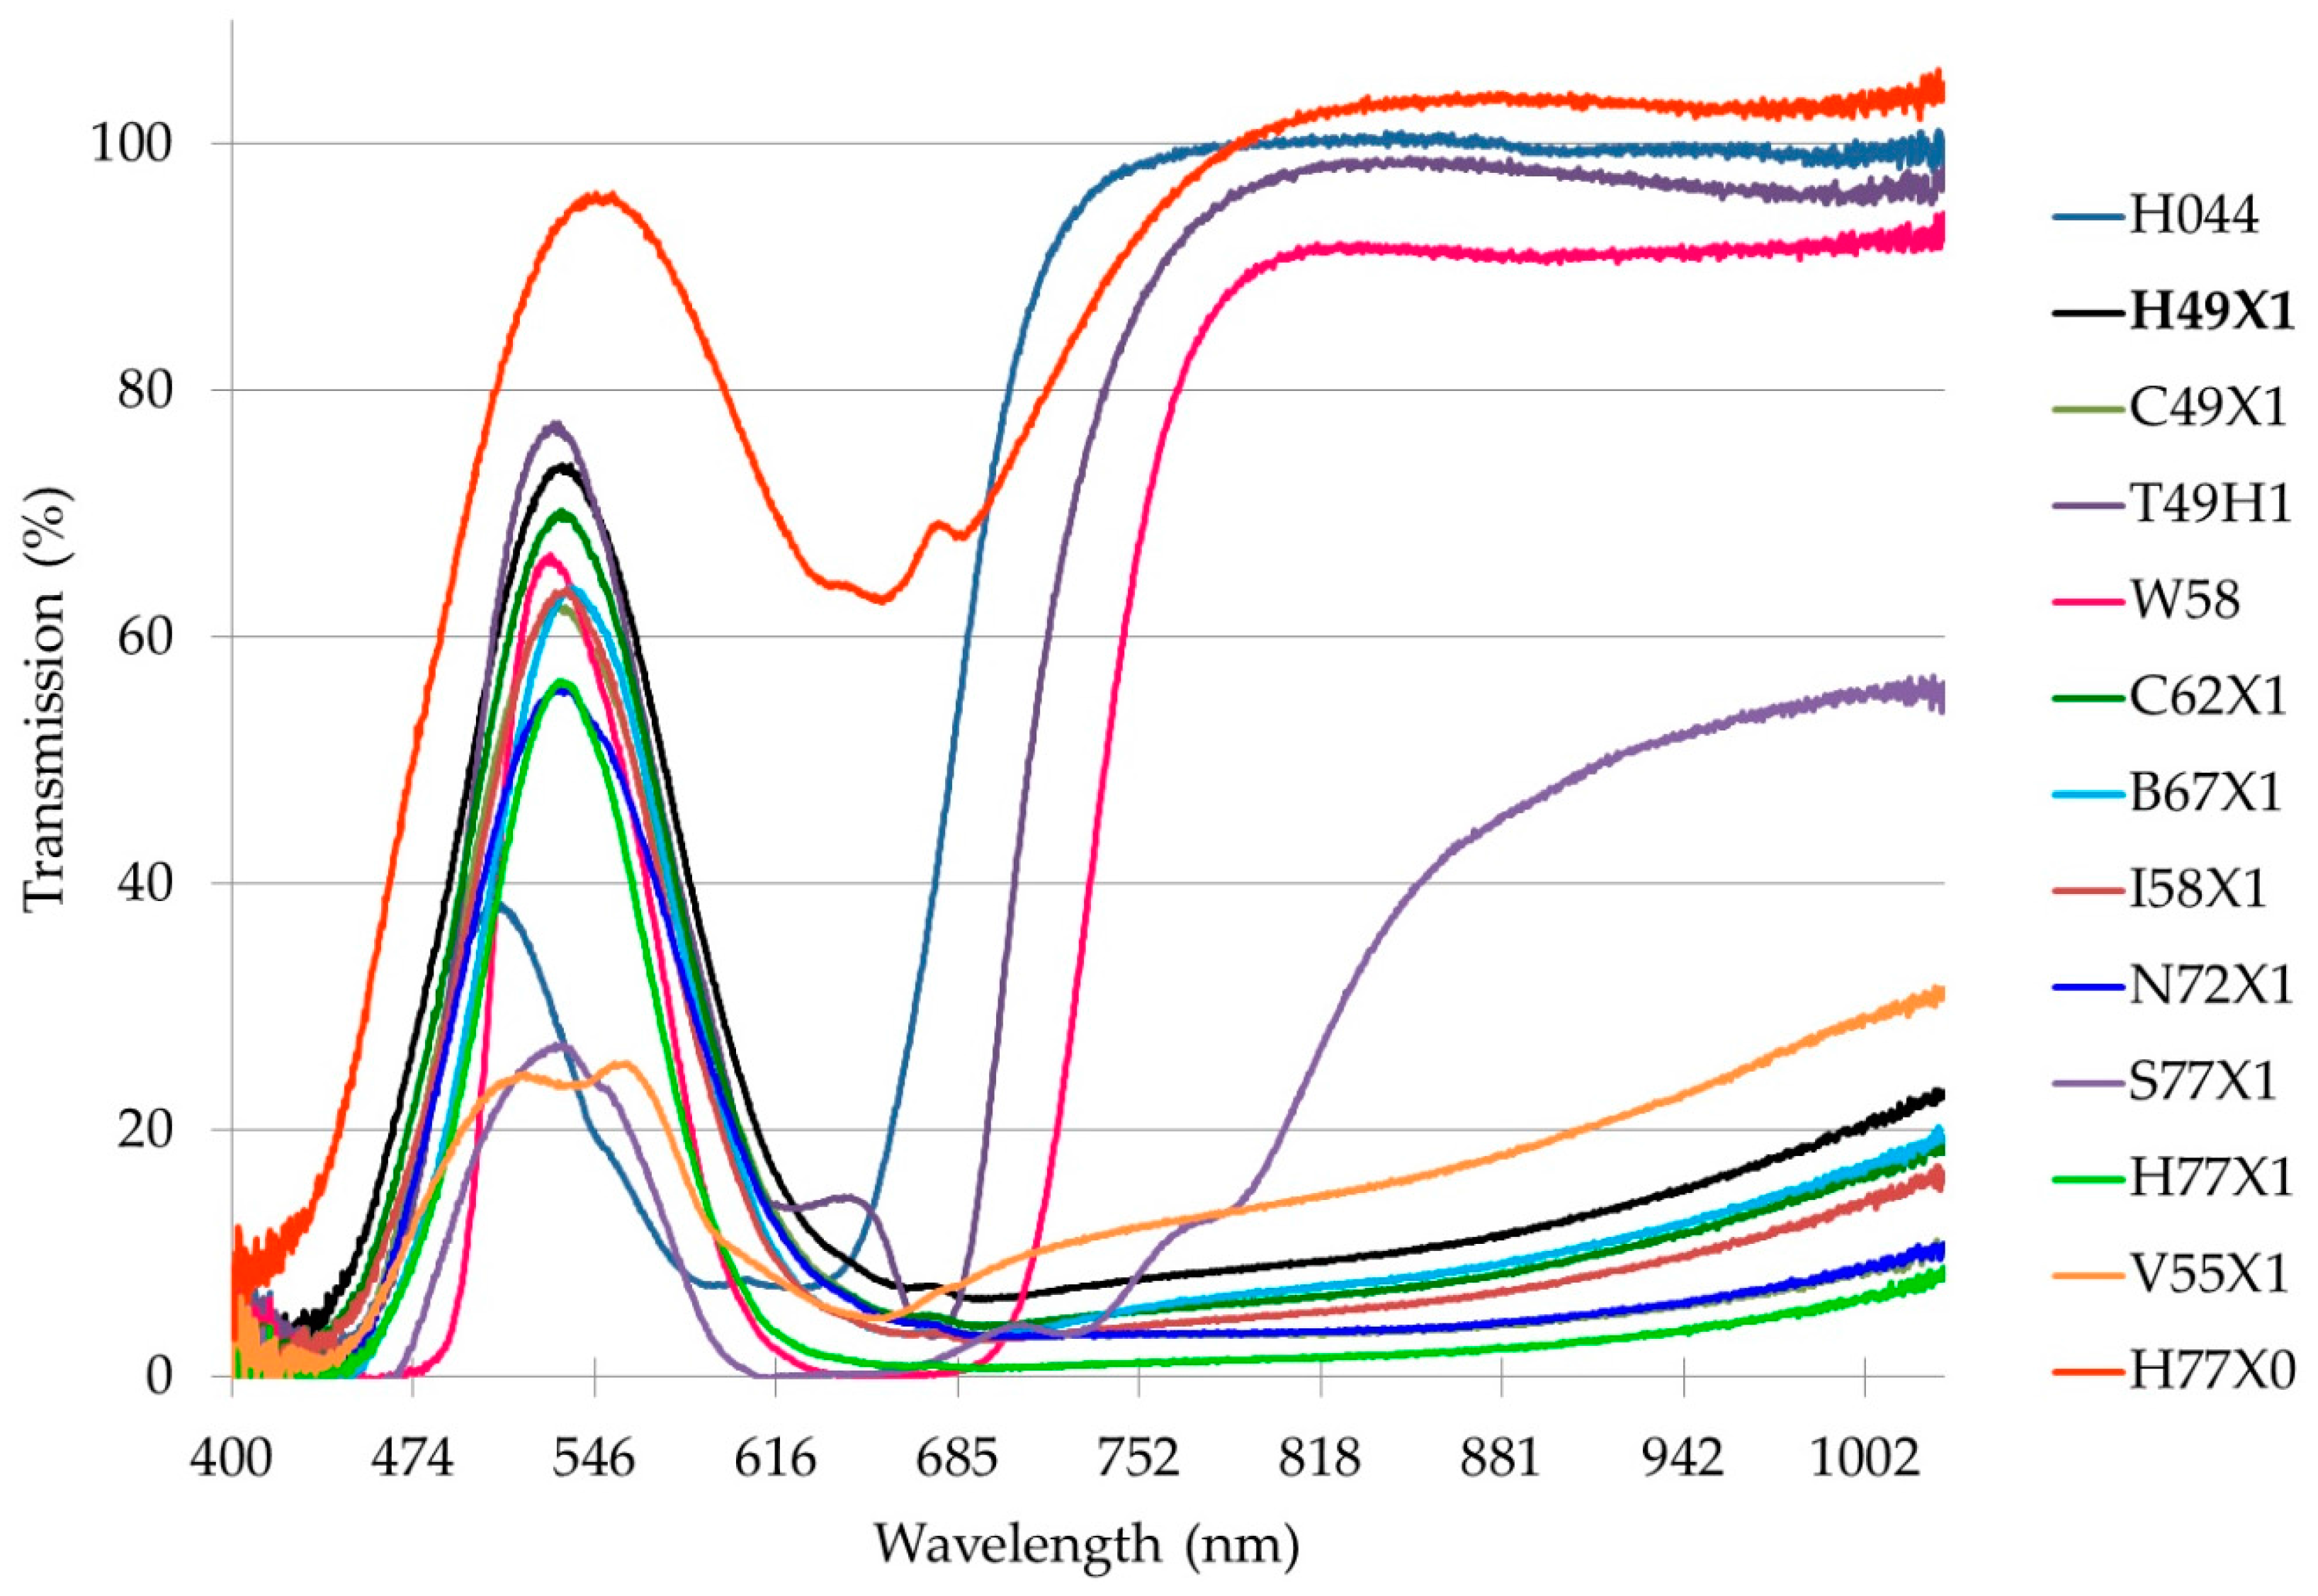
3.3. Green-Pass Filter Spectrophotometry
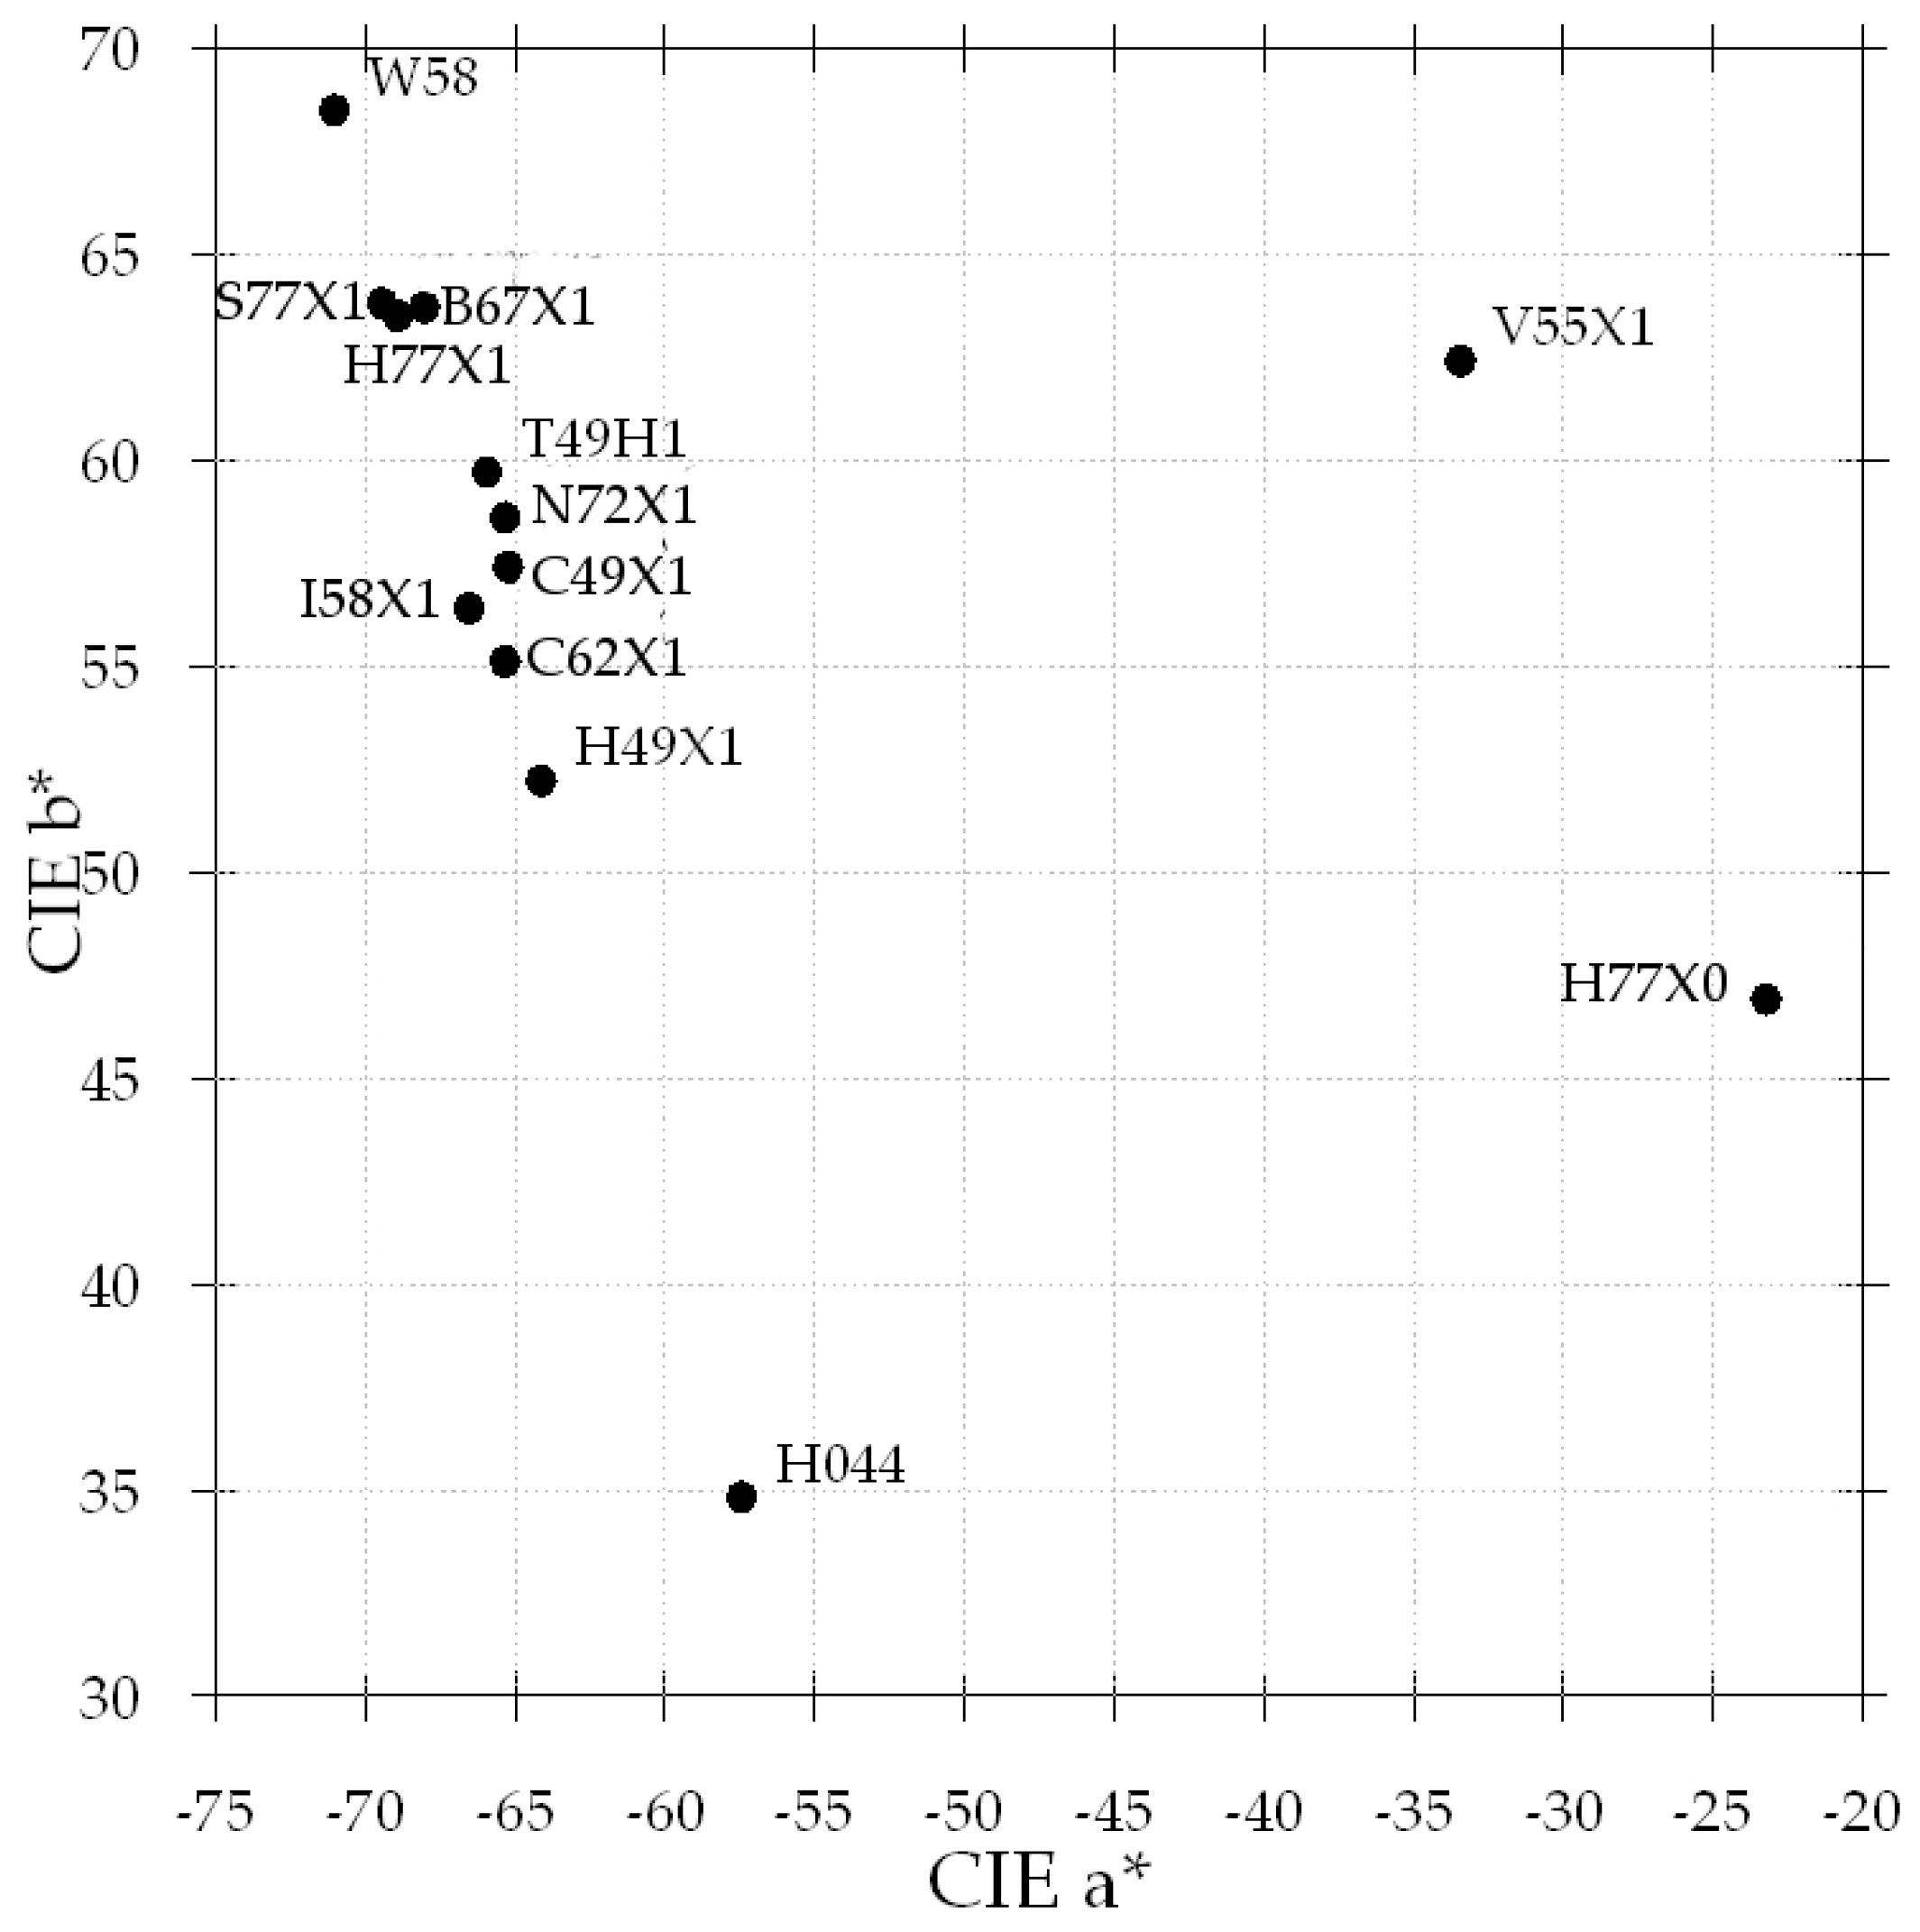
3.4. Green-Pass Filter Densitometry and Colorimetry
3.5. Calibration Procedure
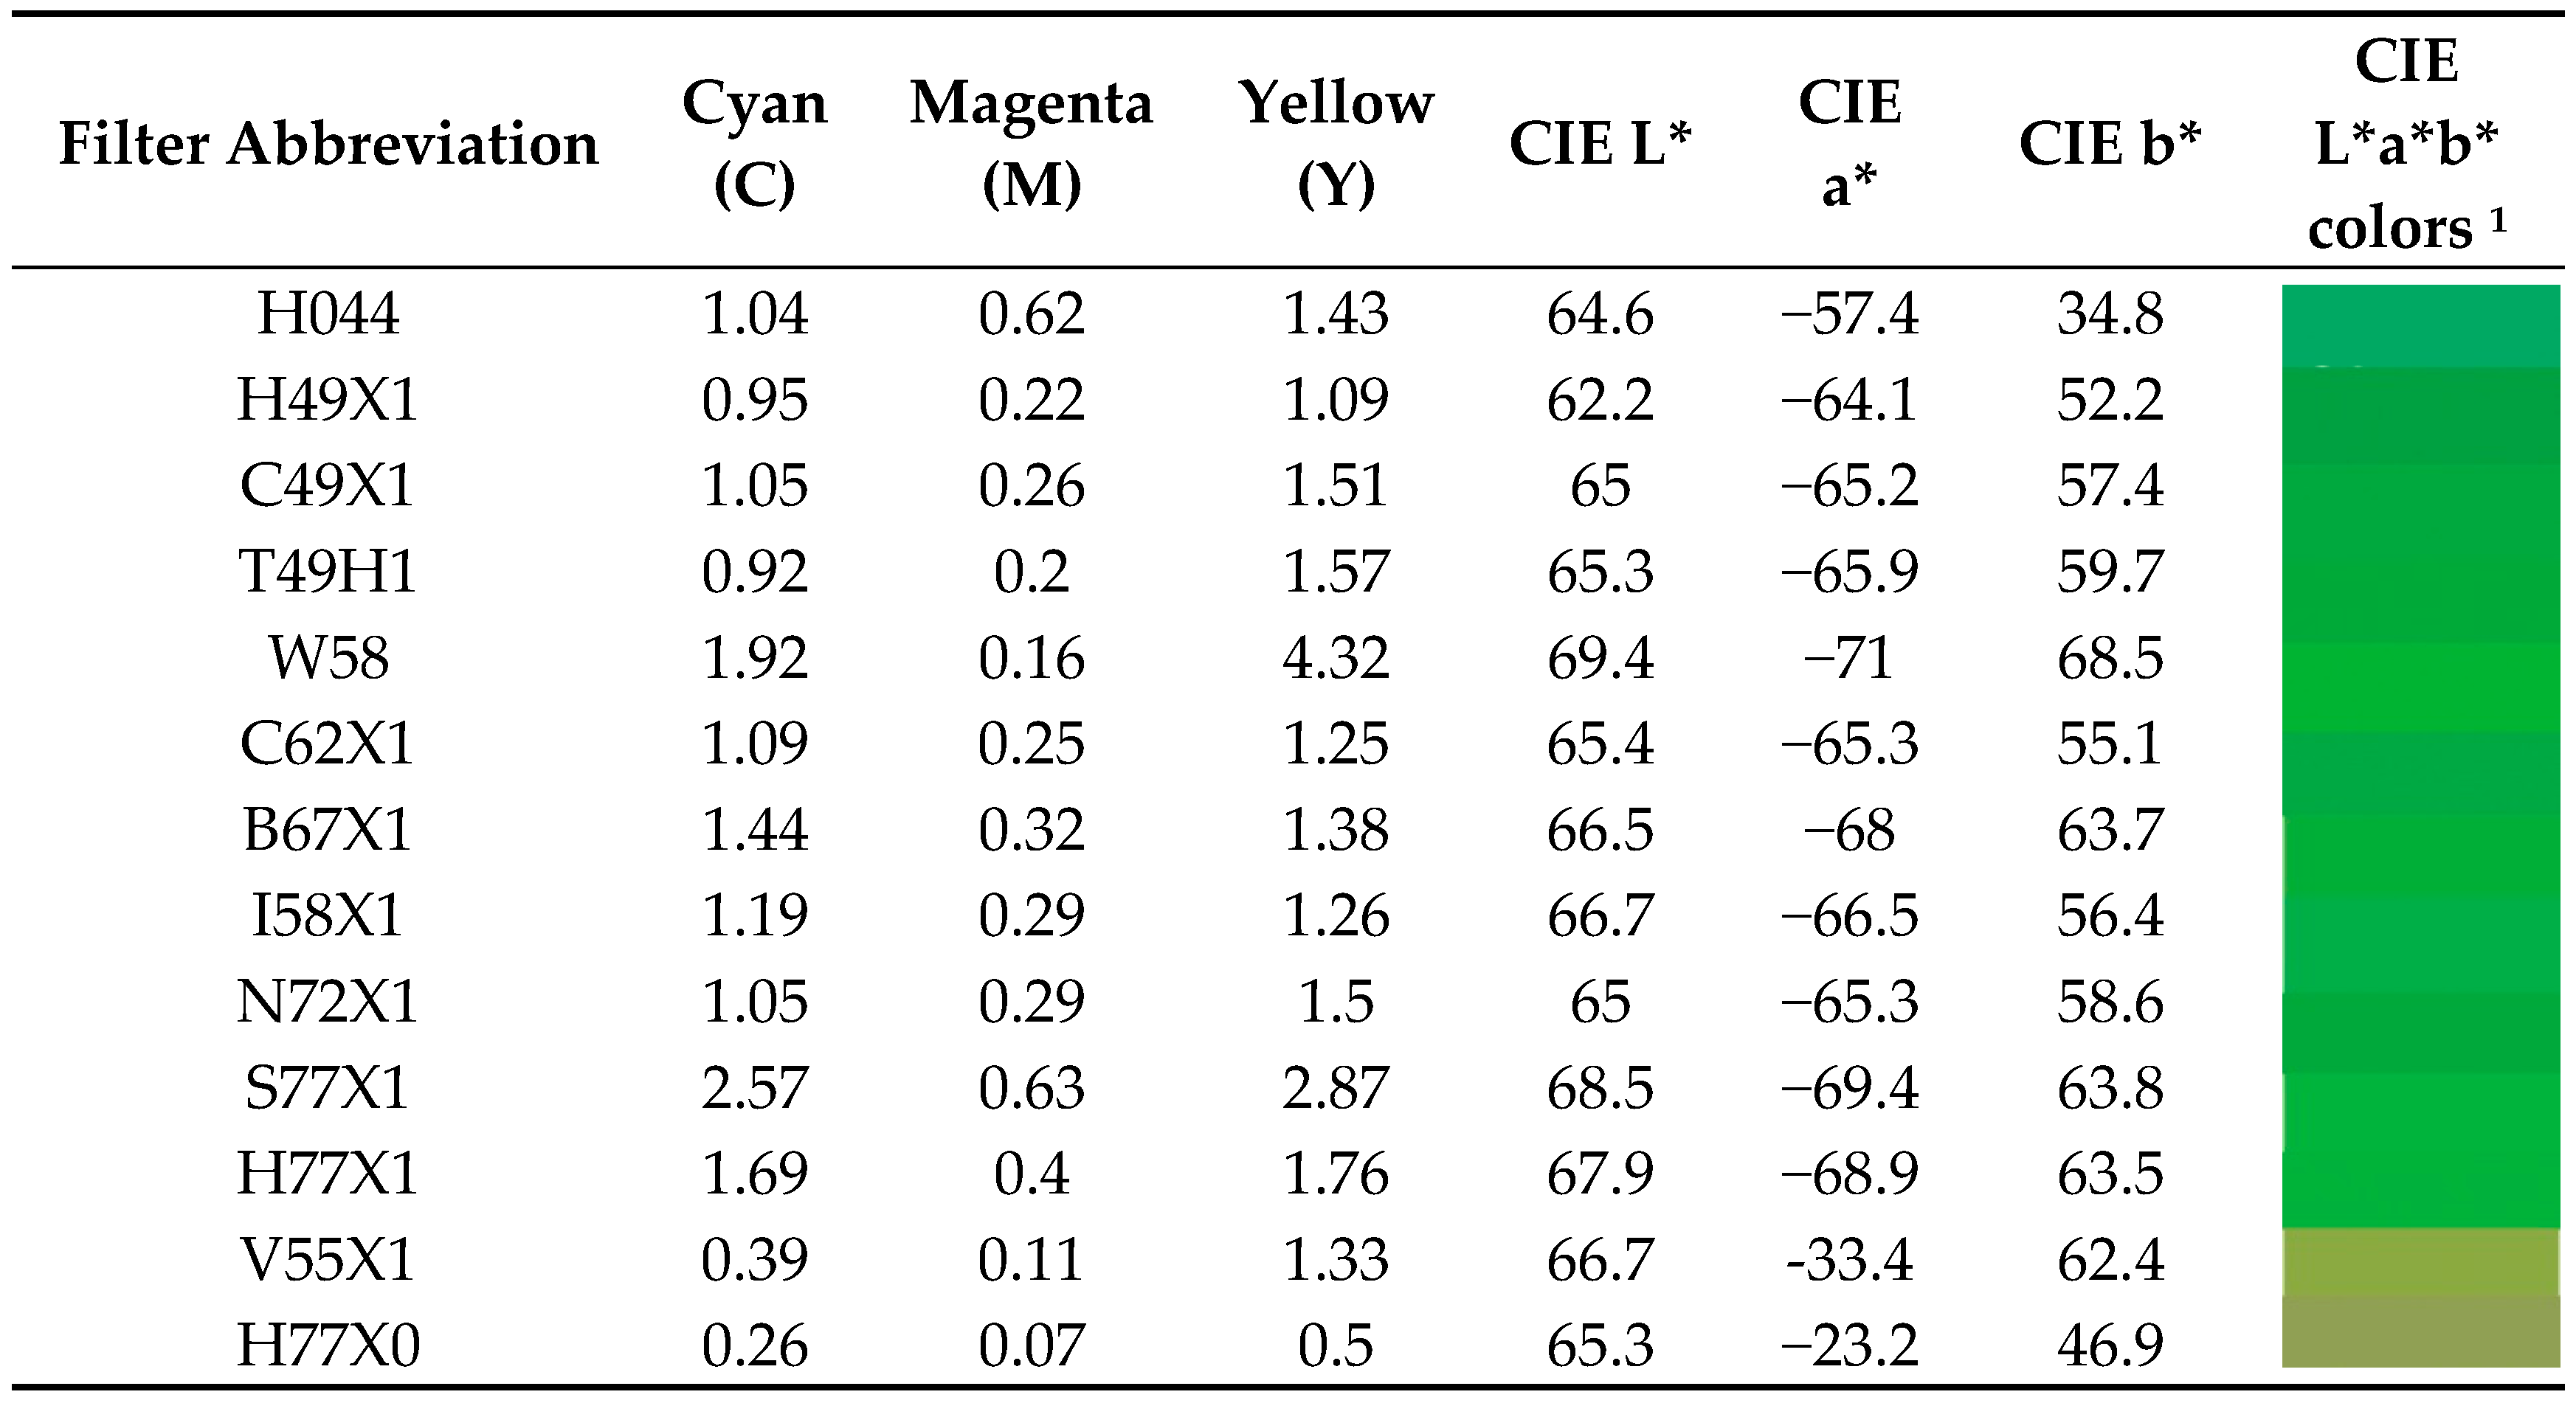
- Obtain transmission status A densitometry readings for cyan = 1.69, magenta = 0.40, and yellow = 1.76. Visually, this filter can be described by the colorimetric values L* = 67.9, a* = −68.9 and b* = 63.5, representing a slightly darker green-pass filter than the reference.
- Subtract the neutral density from each color i.e., the lowest common density value (M = 0.40), cyan = 1.29, magenta = 0.0, yellow = 1.36.
- Determine the base green density (cyan and yellow produce green) by taking the lowest of the cyan and yellow densities; 1.29 is the base green density for this filter and it has a slight yellow cast of 0.07 density (1.36 − 1.29 = 0.07).
- Determine the difference in the green transmission of this filter to that of the reference H49X1 green-pass filter (1.29 − 0.73 = 0.56). This filter is “greener” by 0.56 density units.
- Use magenta color compensating filters to absorb the extra green (50 M + 5 M = 55 M filter pack).
- Use blue color compensating filters to absorb the very slight 0.07 yellow (5 B).
4. Analysis and Discussion
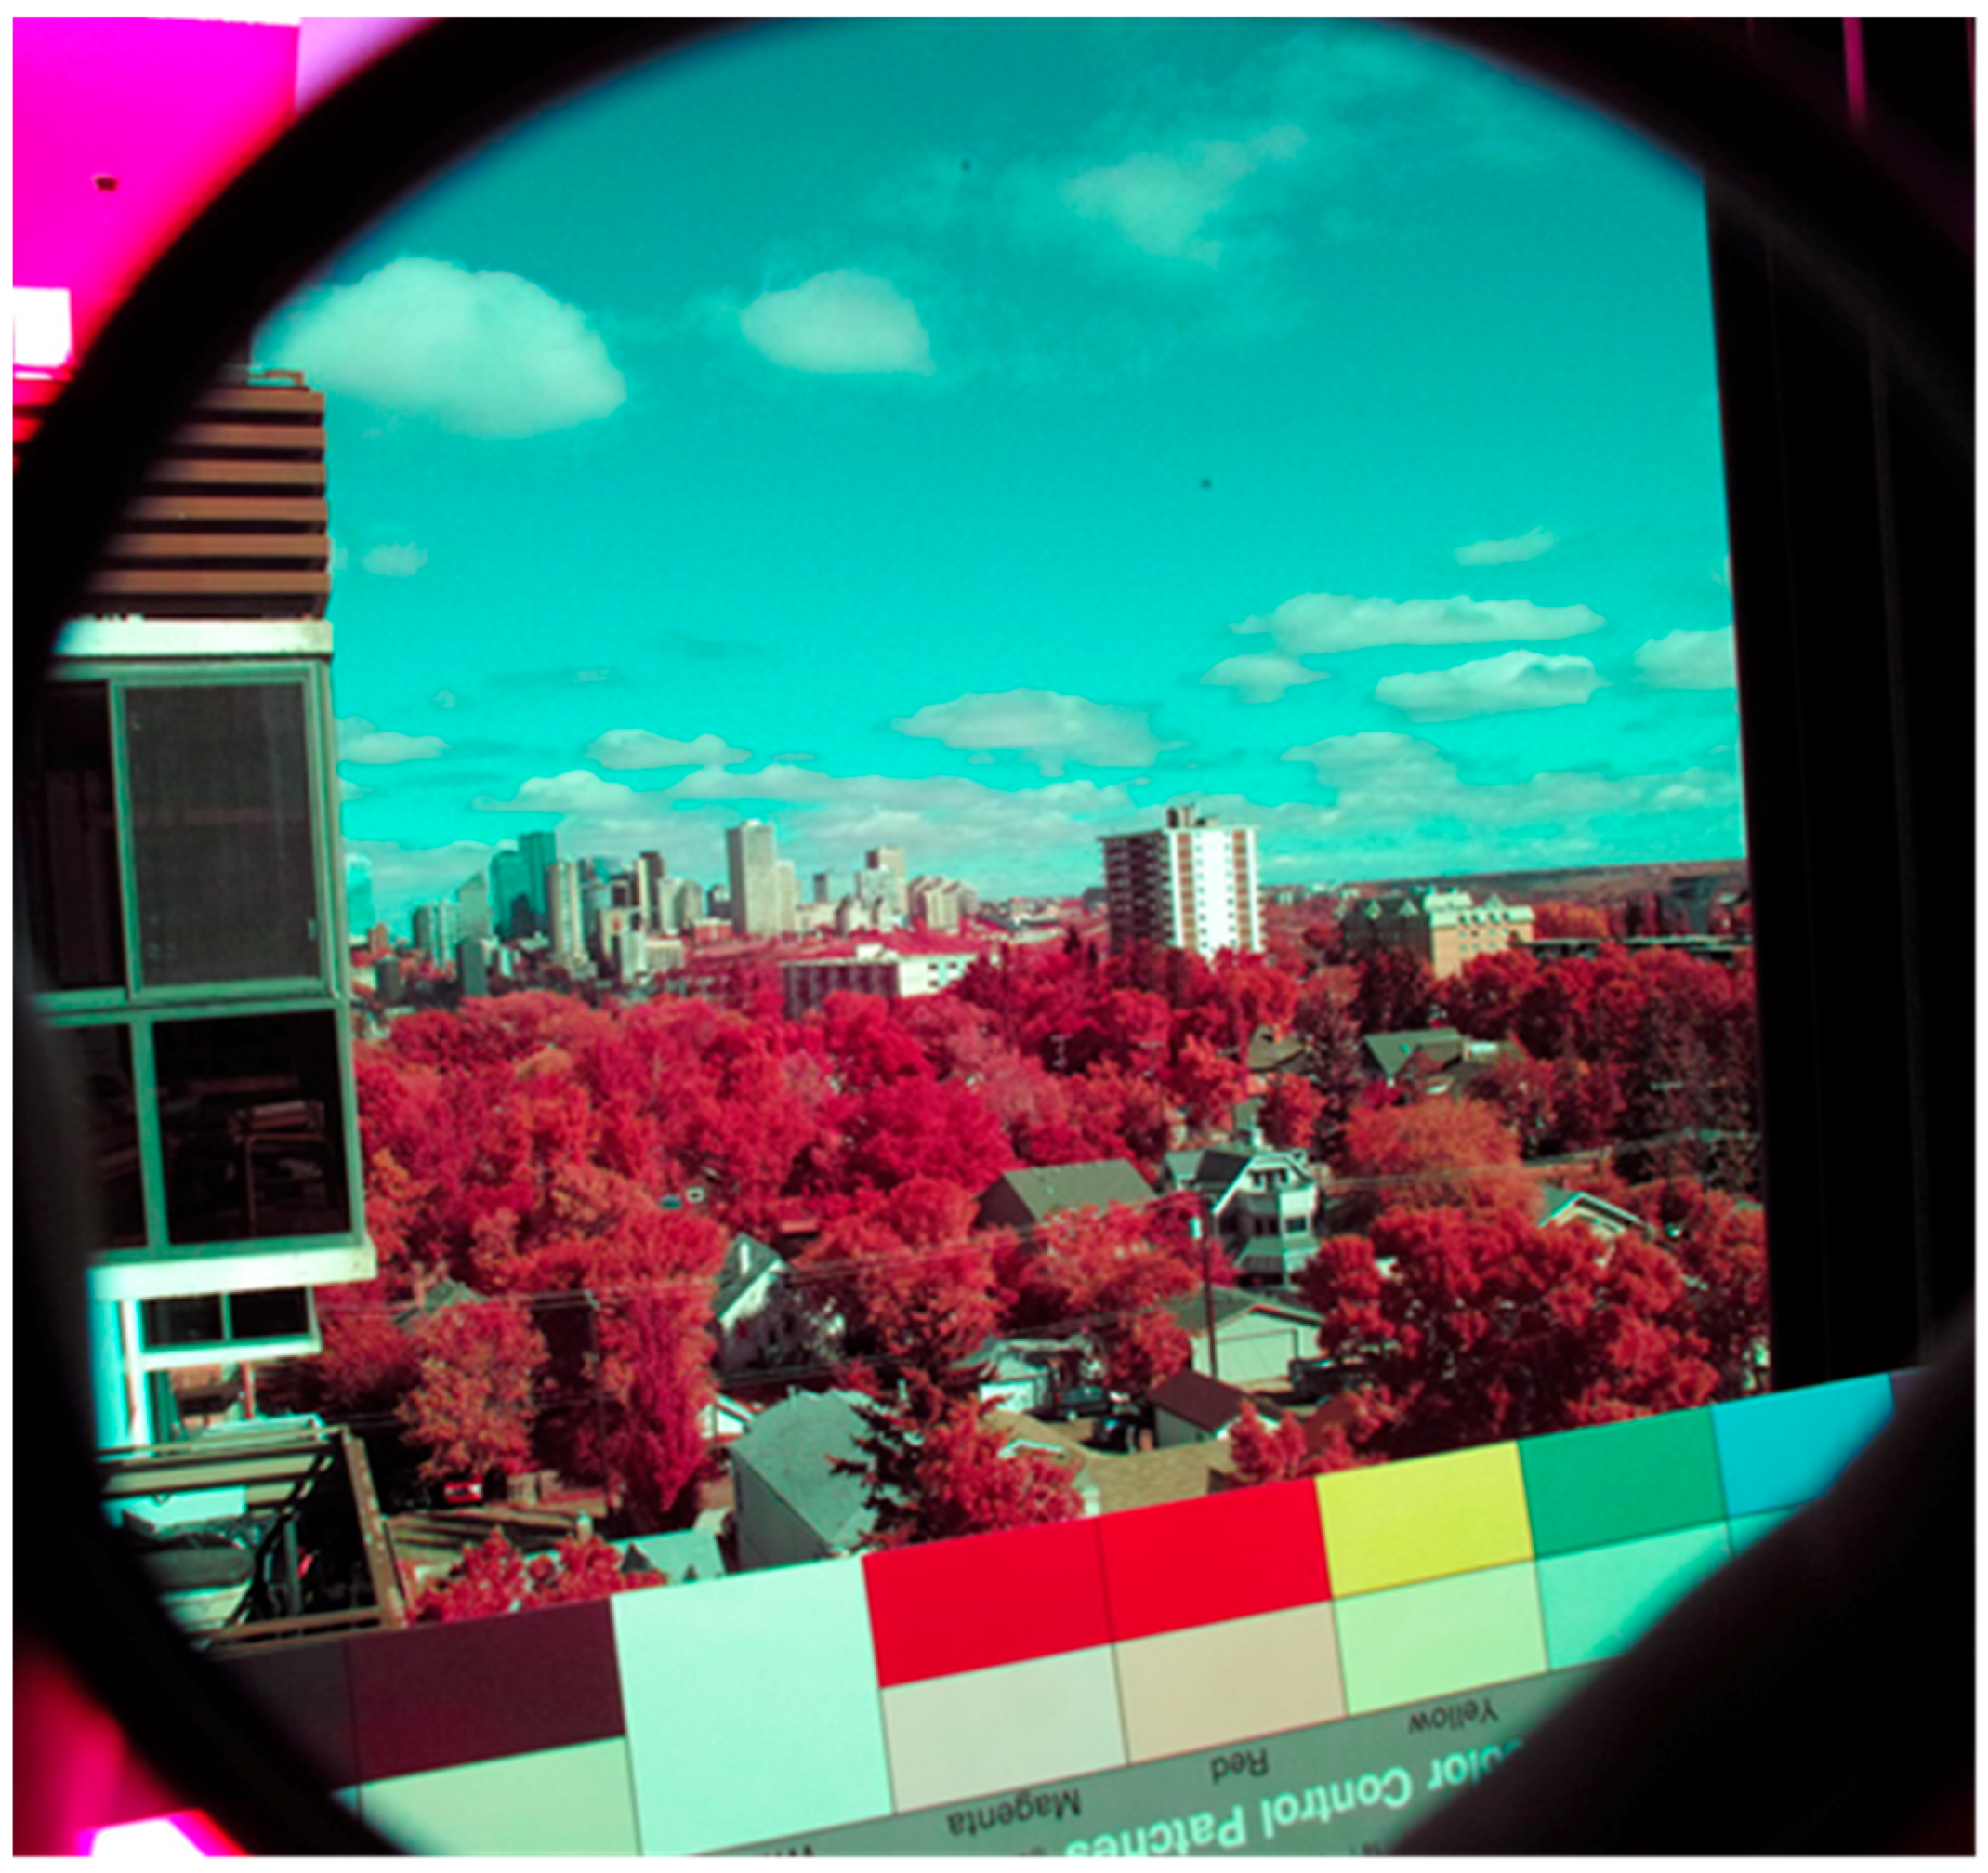
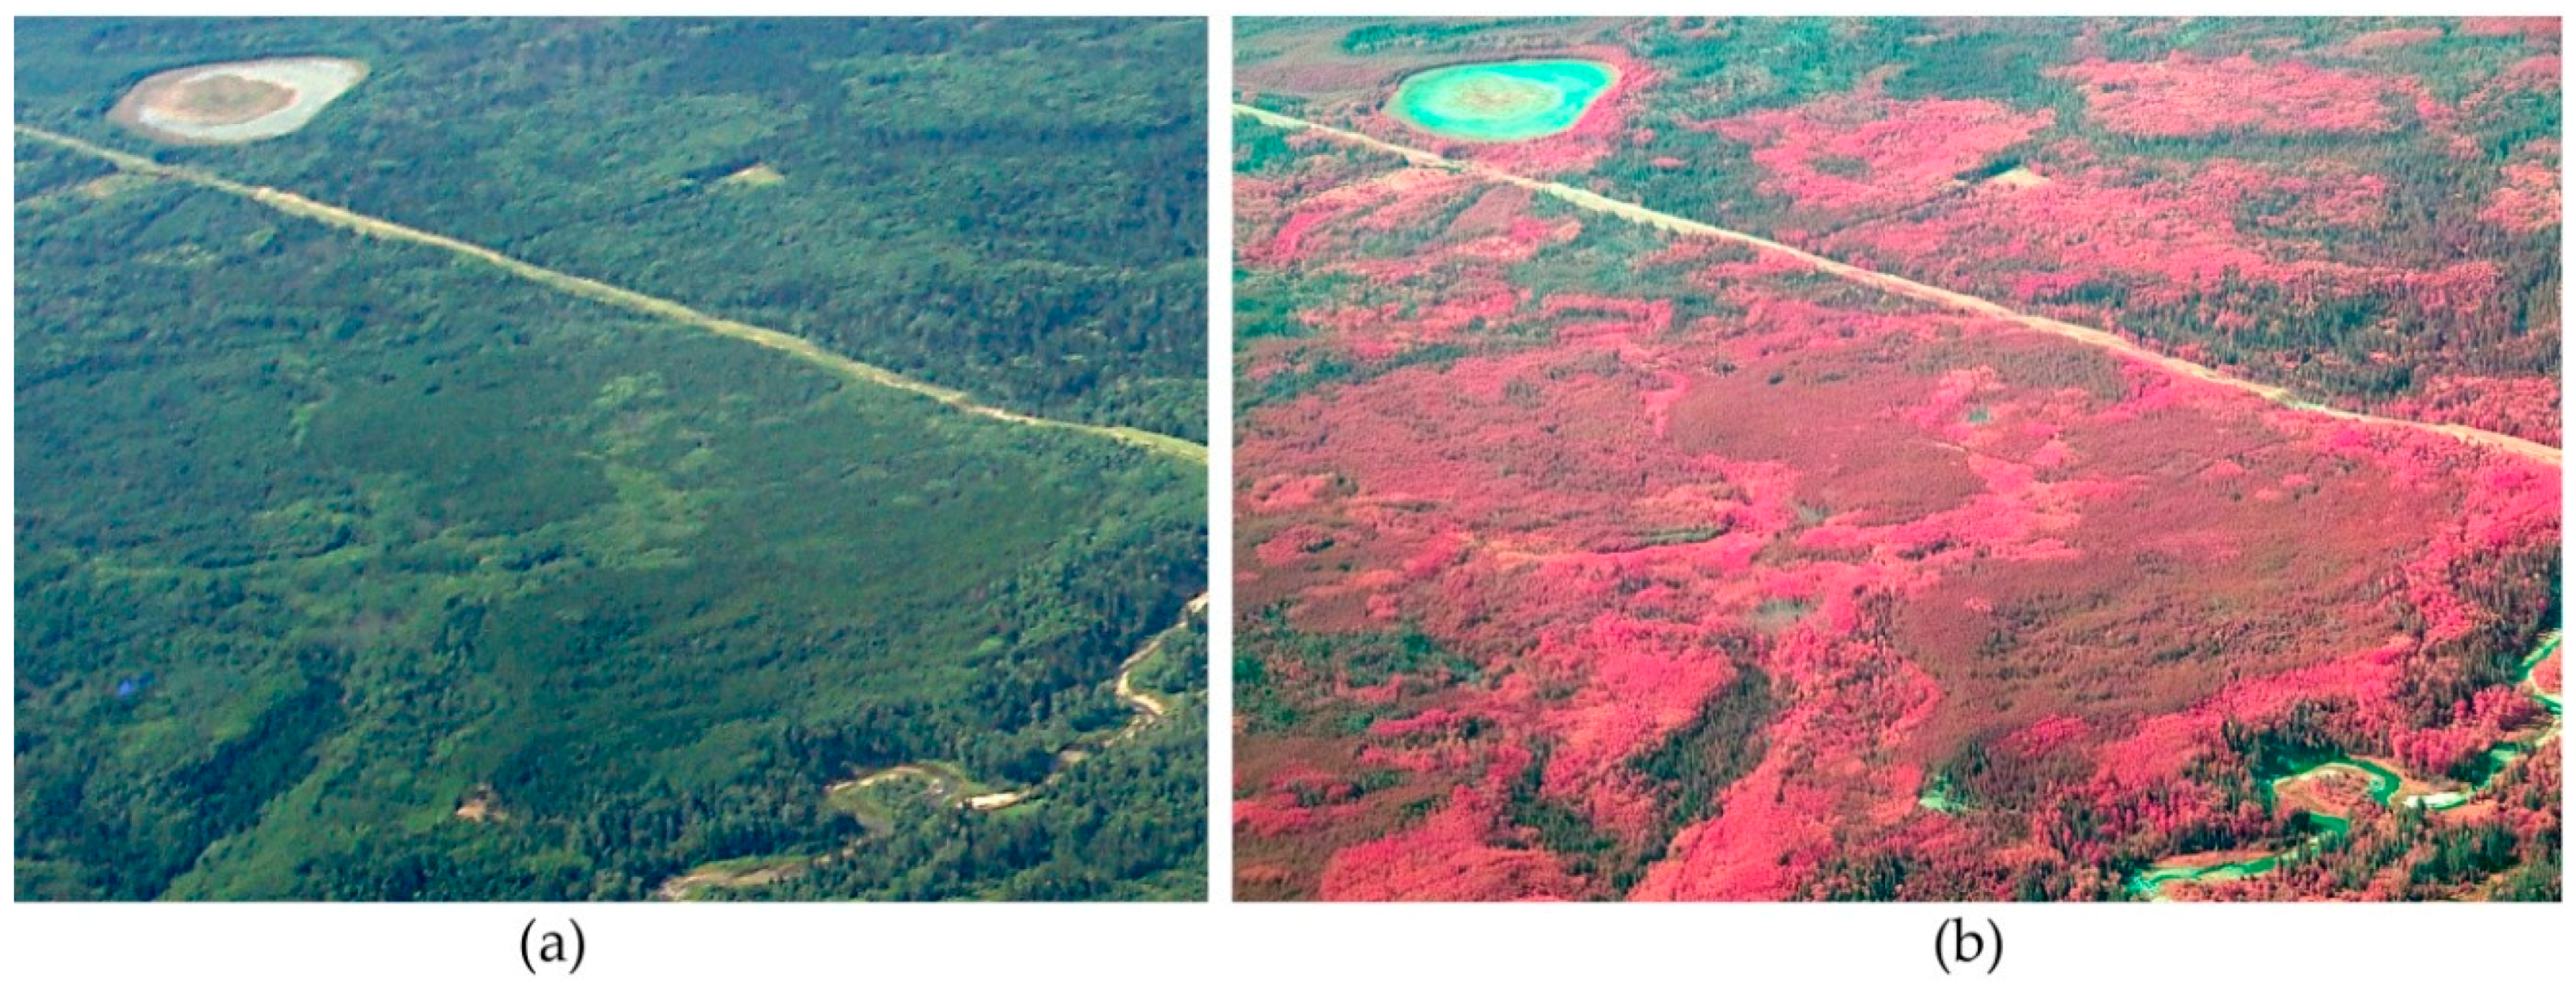
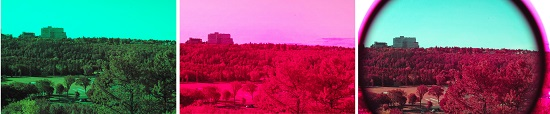
4.1. Kodak CIR Color Renditions
4.2. A Foveon/Green-Pass Filter Model
4.3. Color Compensation Filter Effects
4.4. Remote Sensing Applications
5. Conclusions
Acknowledgments
Author Contributions
Conflicts of Interest
Abbreviations
| CIR | Kodak Ektachrome Professional Infrared EIR film |
| UAV | Unmanned Aerial Vehicle |
| NIR | near-infrared |
| RGB | Red Green Blue |
| CC | Color Compensating |
| GSD | Ground Sample Distance |
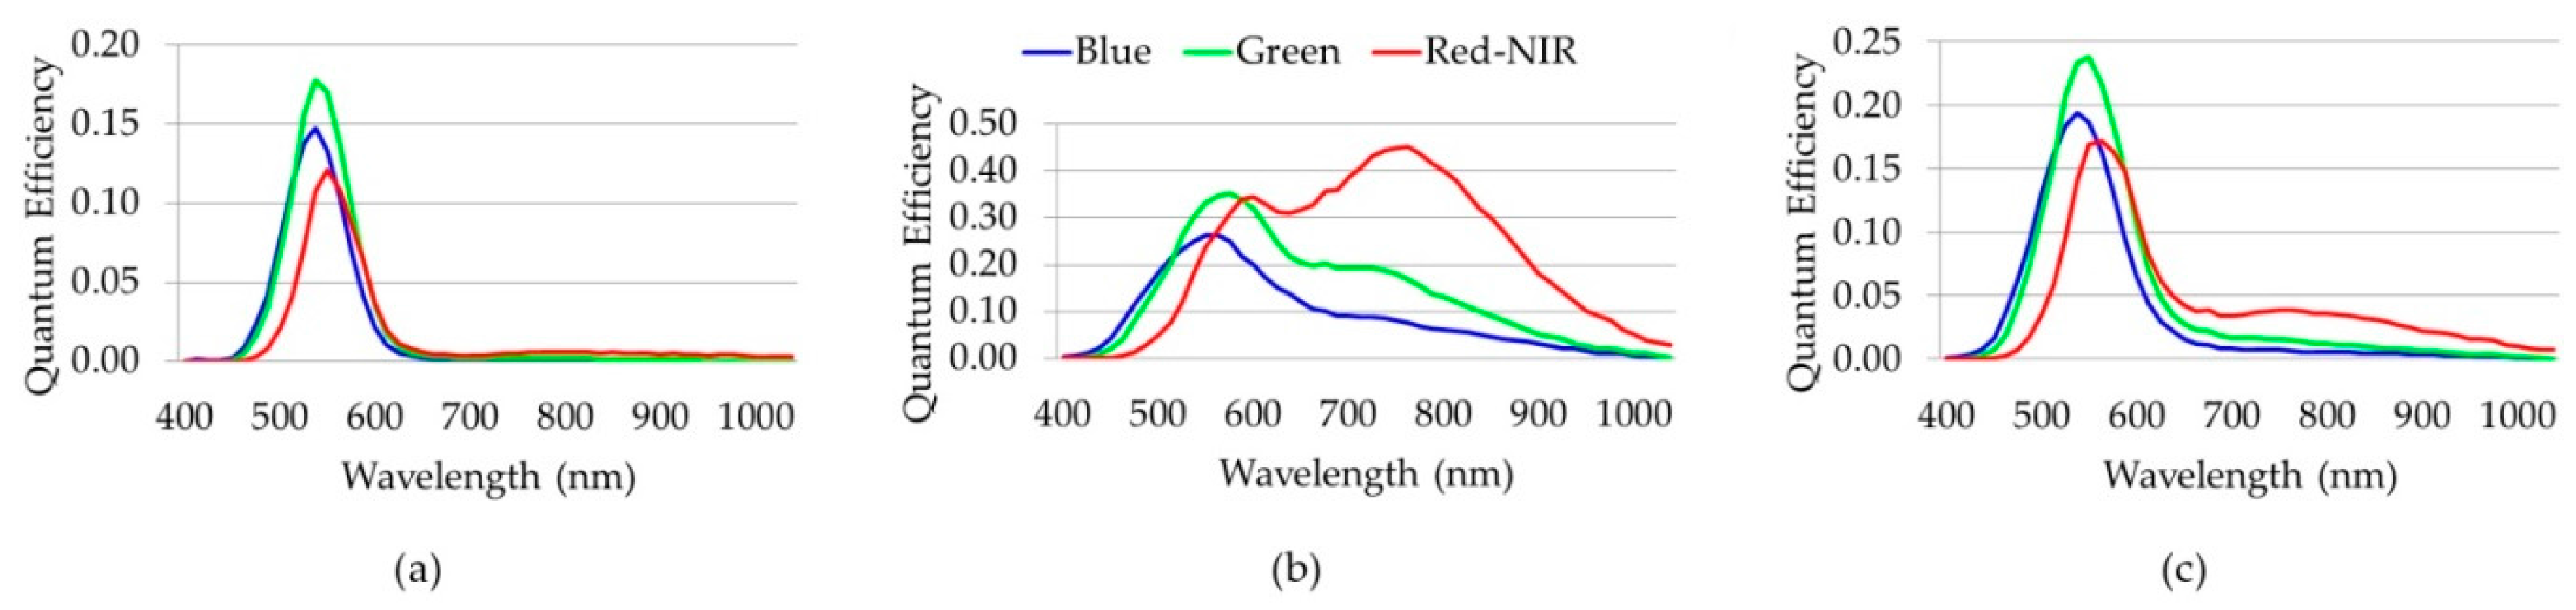
| QE | Quantum Efficiency |
References
- Eastman Kodak. Kodak Ektachrome Professional EIR Film; Technical Publication TI-2323; Eastman Kodak: Rochester, NY, USA, 2005. [Google Scholar]
- Eastman Kodak. Kodak Aerochrome III Infrared Film 1443; Kodak Publication AS-77; Eastman Kodak: Rochester, NY, USA, 2005. [Google Scholar]
- Richards, D. The new infrared revolution. Popul. Photogr. Imaging. 2008, 72, 90–96. [Google Scholar]
- Milton, E.J. Low-cost ground-based digital infra-red photography. Int. J. Remote Sens. 2002, 23, 1001–1007. [Google Scholar] [CrossRef]
- Jelly, E.E.; Wilder, L.S. Camouflage Detection. U.S. Patent US2,403,722 A, 9 July 1946. [Google Scholar]
- Verhoeven, G. Imaging the invisible using modified digital still cameras for straightforward and low-cost archaeological near-infrared photography. J. Archaeol. Sci. 2008, 35, 3087–3100. [Google Scholar] [CrossRef]
- Gini, R.; Passioni, D.; Pinto, L.; Sona, G. Aerial images from an UAV system: 3D modelling and tree classification in a park area. In Proceedings of the 2012 XXII ISPRS Congress on International Archives of Photogrammetry, Remote Sensing, and Spatial information Sciences, Melbourne, Australia, 25 August–1 September 2012; Volume XXXIX-B1, pp. 361–366.
- Gehrke, R.; Greiwe, A. RGBI Images with UAV and off-the-shelf compact cameras: An investigation of linear sensor characteristics. In Proceedings of the 34th EARSeL Symposium, Special Issue, Warsaw, Poland, 16–20 June 2014; pp. 53–58.
- Aden, S.T.; Bialas, J.P.; Champion, Z.; Levin, E.; McCarty, J.L. Low cost infrared and near-infrared sensors for UAVs. In Proceedings of the ISPRS Technical Commission I Symposium on International Archives of the Photogrammetry, Remote Sensing and Spatial Information Sciences, Denver, CO, USA, 17–20 November 2014; Volume XL-1, pp. 1–7.
- Lebourgeois, V.; Bégué, A.; Labbé, S.; Mallavan, B.; Prévost, L.; Roux, B. Can commercial digital cameras be used as multispectral sensors? A crop monitoring test. Sensors 2008, 8, 7300–7322. [Google Scholar] [CrossRef] [Green Version]
- Whitehead, K.; Hugenholtz, C.H. Remote sensing of the environment with small unmanned aircraft systems (UASs), part 1: A review of progress and challenges. J. Unmanned Veh. Syst. 2014, 2, 69–85. [Google Scholar] [CrossRef]
- Aber, J.S.; Aber, S.W.; Buster, L.; Jensen, W.E.; Sleezer, R.L. Challenge of infrared kite aerial photography: A digital update. Trans. Kansas Acad. Sci. 2009, 112, 31–39. [Google Scholar] [CrossRef]
- Drones Imaging. Available online: http://www.dronesimaging.com/en (accessed on 18 March 2016).
- Mosaicmill. Available online: http://www.mosaicmill.com/ (accessed on 18 March 2016).
- Lifepixel. Available online: http://www.lifepixel.com/ (accessed on 18 March 2016).
- LDP LLC—maxmax.com. Available online: http://www.maxmax.com/ (accessed on 18 March 2016).
- Kolari Vision. Available online: http://kolarivision.com/ (accessed on 18 March 2016).
- Busch, D. Digital Infrared Pro Secrets; Thompson Course Technology: Boston, MA, USA, 2007; pp. 217–220. [Google Scholar]
- Eyton, J.R. Color Infrared Imaging; Blurb Inc.: San Francisco, CA, USA, 2010. [Google Scholar]
- Gehrke, R.; Greiwe, A. Multispectral image capturing with Foveon sensors. In Proceedings of the International Archives of Photogrammetry, Remote Sensing, and Spatial Information Sciences, UAV g2013, Rostock, Germany, 4–6 September 2013; Volume XL-1/W2, pp. 151–156.
- Fai, C.S. Detecting near-UV and near-IR Wavelengths with the Foveon Image Sensor. Master’s Thesis, Naval Postgraduate School, Monterrey, CA, USA, 2004. [Google Scholar]
- Horne, J. Shooting Infrared with Sigma DSLRs. RPS J. 2007, 147, 225–225. [Google Scholar]
- Gilblom, D.L.; Ventura, P.; Yoo, S.K. Operation and performance of a color image sensor with layered diodes. Proc. SPIE 2003, 5074, 318–331. [Google Scholar]
- Lyon, R.F.; Hubel, P.M. Eyeing the camera: Into the next century. In Proceedings of the 10th Color Imaging Conference Final Program and Proceedings, Society for Imaging Science and Technology, Scottsdale, AZ, USA, 13–15 November 2003; pp. 349–355.
- Kennard, D. Filter Comparison for Infrared, False Colour IR, and Full Spectrum Photography. Available online: http://www.webcitation.org/6eIVE15OB (accessed on 4 January 2016).
- Peres, M.R. Focal Encyclopedia of Photography; Elsevier: Amsterdam, The Netherlands, 2007; p. 82. [Google Scholar]
- Photo.net—Green filter and Exposure Compensation. Available online: http://photo.net/black-and-white-photo-film-processing-forum/004tbS (accessed on 16 January 2016).
- Eastman Kodak Company. Kodak Filters for Scientific and Technical Uses B-3, 1st ed.; Eastman Kodak Company: Rochester, NY, USA, 1976. [Google Scholar]
- Berra, E.; Gibson-Poole, S.; Macarthur, A.; Gaulton, R.; Hamilton, A. Estimation of the spectral sensitivity functions of un-modified and modified commercial off-the-shelf digital cameras to enable their use as a multispectral imaging system for UAVs. In Proceedings of the International Conference on Unmanned Aerial Vehicles in Geomatics, the International Archives of the Photogrammetry, Remote Sensing and Spatial Information Sciences, Toronto, ON, Canada, 30 August–2 September 2015; Volume XL-1/W4-207-2015, pp. 207–214.
- Gilblom, D.; Alternate Vision Inc., Tuscon, AZ, USA. Personal communication, 2016.
- Darrodi, M.M.; Finlayson, G.; Goodman, T.; Mackiewicz, M. Reference data set for camera spectral sensitivity estimation. J. Opt. Soc. Am. A 2015, 32, 381–391. [Google Scholar] [CrossRef] [PubMed]
- Shyu, J.M.; Parkkinen, J. Fundamentals of Color. In Advanced Color Image Processing and Analysis; Fernandez-Maloigne, C., Ed.; Springer: New York, NY, USA, 2013; pp. 11–12. [Google Scholar]
- Paine, D.P.; Kiser, J.D. Aerial Photography and Image Interpretation; John Wiley and Sons Inc.: Hoboken, NJ, USA, 2012; Chapter 14.2.4. [Google Scholar]
- Eyton, J.R. Color Infrared; Blurb Inc.: San Francisco, CA, USA, 2010. [Google Scholar]
- Beneson, W.; Harris, J.W.; Stocker, H.; Lute, H. Handbook of Physics, 4th ed.; Springer-Verlag: New York, NY, USA, 2002; pp. 401–402. [Google Scholar]
- NOAA/NESDIS. Planck Calculator for Infrared Remote Sensing. Available online: http://www.webcitation.org/6hG8yyPya (accessed on 13 April 2016).
- Working Group for Orthophotography Planning. A Guide for Understanding, Interpreting and Benefiting from CIR Imagery; North Carolina Geographic Information Coordinating Council: North Carolina, USA, July 2011. [Google Scholar]
- Public Lab. Red Filter Rising. Available online: http://www.webcitation.org/6edvkji4T (accessed on 18 January 2016).
- Hunt, R.E.; Hively, D.W.; Fujikawa, S.J.; Linden, D.S.; Daughtry, C.S.T.; McCarty, G.W. Acquisition of NIR-Green-Blue digital photographs from unmanned aircraft for crop monitoring. Remote Sens. 2010, 2, 290–305. [Google Scholar] [CrossRef]
- Rabatel, G.; Gorretta, N.; Labbé, S. Getting NDVI spectral bands from a single standard RGB camera: A methodological approach. In Advances in Artificial Intelligence; Springer: Berlin/Heidelberg, Germany, 2011; pp. 333–342. [Google Scholar]


| Filter Description | Abbreviation | Material | Format |
|---|---|---|---|
| Hoyarex Green 044 | H044 | Polycarbonate | Square 75 mm |
| Hoya 49 mm X1 | H49X1 | Glass | Circular 49 mm |
| C-N.P.S 49 mm X1 | C49X1 | Glass | Circular 49 mm |
| Tiffen Green 1 49 mm | T49H1 | Glass | Circular 49 mm |
| Kodak Wratten 58 | W58 | Gel | Square 75 mm |
| Crown G 62 mm | C62X1 | Glass | Circular 62 mm |
| Berkeley 67 mm P01 | B67X1 | Glass | Circular 67 mm |
| Izumar 58 m X1 | I58X1 | Glass | Circular 58 mm |
| NDG 72 mm X1 | N72X1 | Glass | Circular 72 mm |
| Sing 77 mm X1 | S77X1 | Glass | Circular 77 mm |
| Hoya 77 mm X1 | H77X1 | Glass | Circular 77 mm |
| Vivitar 55 mm No. 11 X1 | V55X1 | Glass | Circular 55 mm |
| Hoya 77 mm G (X0) | H77X0 | Glass | Circular 77 mm |
| Filter Description | Abbreviation | Green Base | Green Final | Y or –C Difference | Zero Green | Zero Y or –C | Color Compensation Adjustments |
|---|---|---|---|---|---|---|---|
| Hoyarex Green 044 | H044 | 1.04 | 0.42 | 0.39 | −0.31 | 0.25 | 30 G + 25 B |
| Hoya 49mm X1 | H49X1 | 0.95 | 0.73 | 0.14 | 0.0 | 0.0 | None |
| C-N.P.S 49 mm X1 | C49X1 | 1.05 | 0.79 | 0.46 | 0.06 | 0.32 | 5 M + 30 B |
| Tiffen Green 1 49 mm | T49H1 | 0.92 | 0.72 | 0.65 | −0.01 | 0.51 | 0 M + 50 B |
| Kodak Wratten 58 | W58 | 1.92 | 1.76 | 2.4 | 1.03 | 2.26 | 100 M + 225 B |
| Crown G 62 mm | C62X1 | 1.09 | 0.84 | 0.16 | 0.11 | 0.02 | 10 M |
| Berkeley 67 mm P01 | B67X1 | 1.38 | 1.06 | −0.06 | 0.33 | −0.20 | 30 M + 20 R |
| Izumar 58 mm X1 | I58X1 | 1.19 | 0.9 | 0.07 | 0.17 | −0.07 | 15 M + 5 R |
| NDG 72 mm X1 | N72X1 | 1.05 | 0.76 | 0.45 | 0.03 | 0.31 | 5 M + 30 B |
| Sing 77 mm X1 | S77X1 | 2.57 | 1.94 | 0.3 | 1.21 | 0.16 | 120 M + 15 B |
| Hoya 77 mm X1 | H77X1 | 1.69 | 1.29 | 0.07 | 0.56 | −0.07 | 55 M + 5 B |
| Vivitar 55 mm No. 11 X1 | V55X1 | 0.39 | 0.28 | 0.94 | −0.45 | 0.80 | 45 G + 80 B |
| Hoya 77 mm G (X0) | H77X0 | 0.26 | 0.19 | 0.24 | −0.54 | 0.10 | 55 G + 10 B |
| Filter | Spectral Intervals (nm) | Blue Foveon Layer | Green Foveon Layer | Red-NIR Foveon Layer | Resultant Color |
|---|---|---|---|---|---|
| H77X1 | 420–490 | 1.0 | 0.7 | 0.2 | |
| H77X1 | 500–575 | 7.3 | 9.1 | 6.1 | |
| H77X1 | 600–675 | 0.2 | 0.3 | 0.4 | |
| H77X1 | 600–1050 | 0.8 | 1.4 | 2.8 | |
| H77X0 | 420–490 | 5.3 | 3.4 | 0.6 | |
| H77X0 | 500–575 | 15.3 | 19.4 | 13.6 | |
| H77X0 | 600–675 | 7.5 | 13.0 | 19.7 | |
| H77X0 | 600–1050 | 28 | 53.6 | 120.1 | |
| H49X1 | 420–490 | 2.8 | 1.9 | 0.4 | |
| H49X1 | 500–575 | 10.6 | 13.2 | 9.0 | |
| H49X1 | 600–675 | 1.1 | 1.9 | 2.8 | |
| H49X1 | 600–1050 | 4.0 | 7.3 | 14.6 |
| Green-Pass Filter | Spectral Wavelength Interval | Non-Adjusted Colors 1 | CC Filter 2 Adjusted Colors | H49X1 Reference Colors |
|---|---|---|---|---|
| H77X1 | 420–490 | |||
| H77X1 | 500–575 | |||
| H77X1 | 600–675 | |||
| H77X1 | 600–1050 | |||
| H77X0 | 420–490 | |||
| H77X0 | 500–575 | |||
| H77X0 | 600–675 | |||
| H77X0 | 600–1050 |
© 2016 by the authors; licensee MDPI, Basel, Switzerland. This article is an open access article distributed under the terms and conditions of the Creative Commons Attribution (CC-BY) license (http://creativecommons.org/licenses/by/4.0/).
Share and Cite
Fent, L.; Meldrum, A. A Foveon Sensor/Green-Pass Filter Technique for Direct Exposure of Traditional False Color Images. J. Imaging 2016, 2, 14. https://doi.org/10.3390/jimaging2020014
Fent L, Meldrum A. A Foveon Sensor/Green-Pass Filter Technique for Direct Exposure of Traditional False Color Images. Journal of Imaging. 2016; 2(2):14. https://doi.org/10.3390/jimaging2020014
Chicago/Turabian StyleFent, Livio, and Al Meldrum. 2016. "A Foveon Sensor/Green-Pass Filter Technique for Direct Exposure of Traditional False Color Images" Journal of Imaging 2, no. 2: 14. https://doi.org/10.3390/jimaging2020014