
A Kinect-Based System for Upper-Body Function Assessment in Breast Cancer Patients


Abstract
:
1. Introduction
2. Related Work
2.1. Upper-Limb Volume Measurements
2.1.1. Traditional Methods

| System | Time to Operate | Home/Travel | Accuracy | Cost | Complex |
|---|---|---|---|---|---|
| Water Displacement: The limb is immersed into a container, and the amount of the displaced water represents the volume [19]. | High | No | High | Low | Medium |
| Circumferential Measurements: The volume can be estimated assuming cylindrical/conic volumes between several measures taken along the limb [20]. | High | Yes | Low | Low | Low |
| Perometer ®: The device scans the limb with IR light and assesses the volume at small intervals [21]. | Medium | No | High | Medium | High |
| CT: Determines the overall cross-section area and quantifies the density of the tissues [22]. | Low | No | High | High | High |
| BIS: A small current passes through the body; it measures volumes by comparing the impedance values of both arms [20]. | Medium | No | Medium | High | Medium |
2.1.2. Three-Dimensional Scanners
2.2. Upper-Limb Motion Evaluation
2.2.1. Subjective Methods
| Scale | Paper | Type of Measure | Description | Clinical interpretation | Comments |
|---|---|---|---|---|---|
| PSFS | Stratford et al. [26] | Clinical measure of function | 3 items; 11-point scale | Higher score, better function | For use in the clinical setting: measures the change in function specific to the individual survivor. |
| DASH | Hudak et al. [27] | Pain-related upper extremity disability | 30 items; 5-point scale | Higher score, poorer function | Has not been validated in breast cancer patients. |
| UEFI | Stratford et al. [28] | Upper-body function | 20 items; 5-point scale | Higher score, better function | Valid and sensitive to changes in the breast cancer population. |
| KAPS | Kwan et al. [29] | Upper-body symptoms and function | 13 items; 5-point scale | Higher score, poorer function | Developed to identify shoulder and arm problems during breast cancer treatment. |
2.2.2. Objective Methods
2.3. Summary
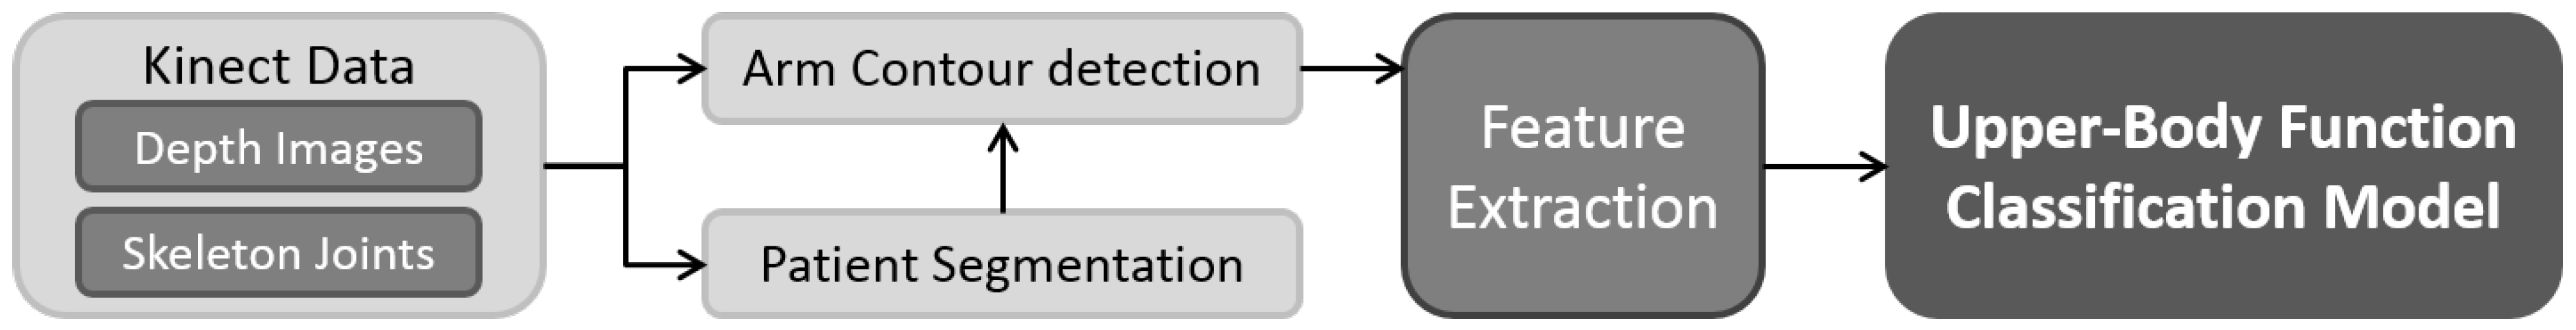
3. An Upper-Body Function Evaluation System

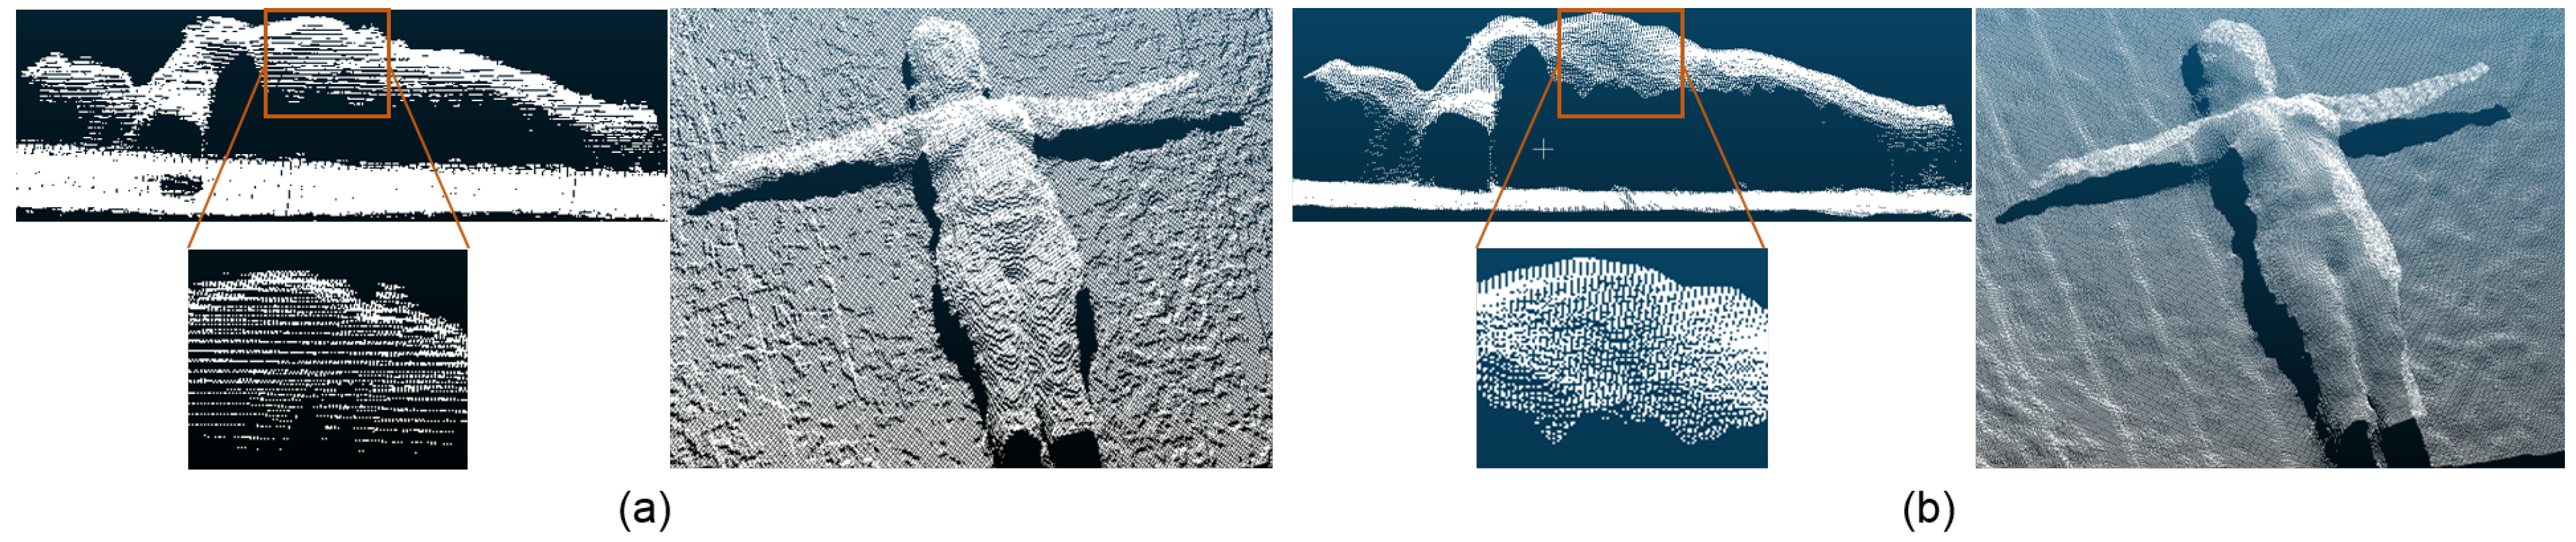
3.1. Depth-Map Noise Reduction
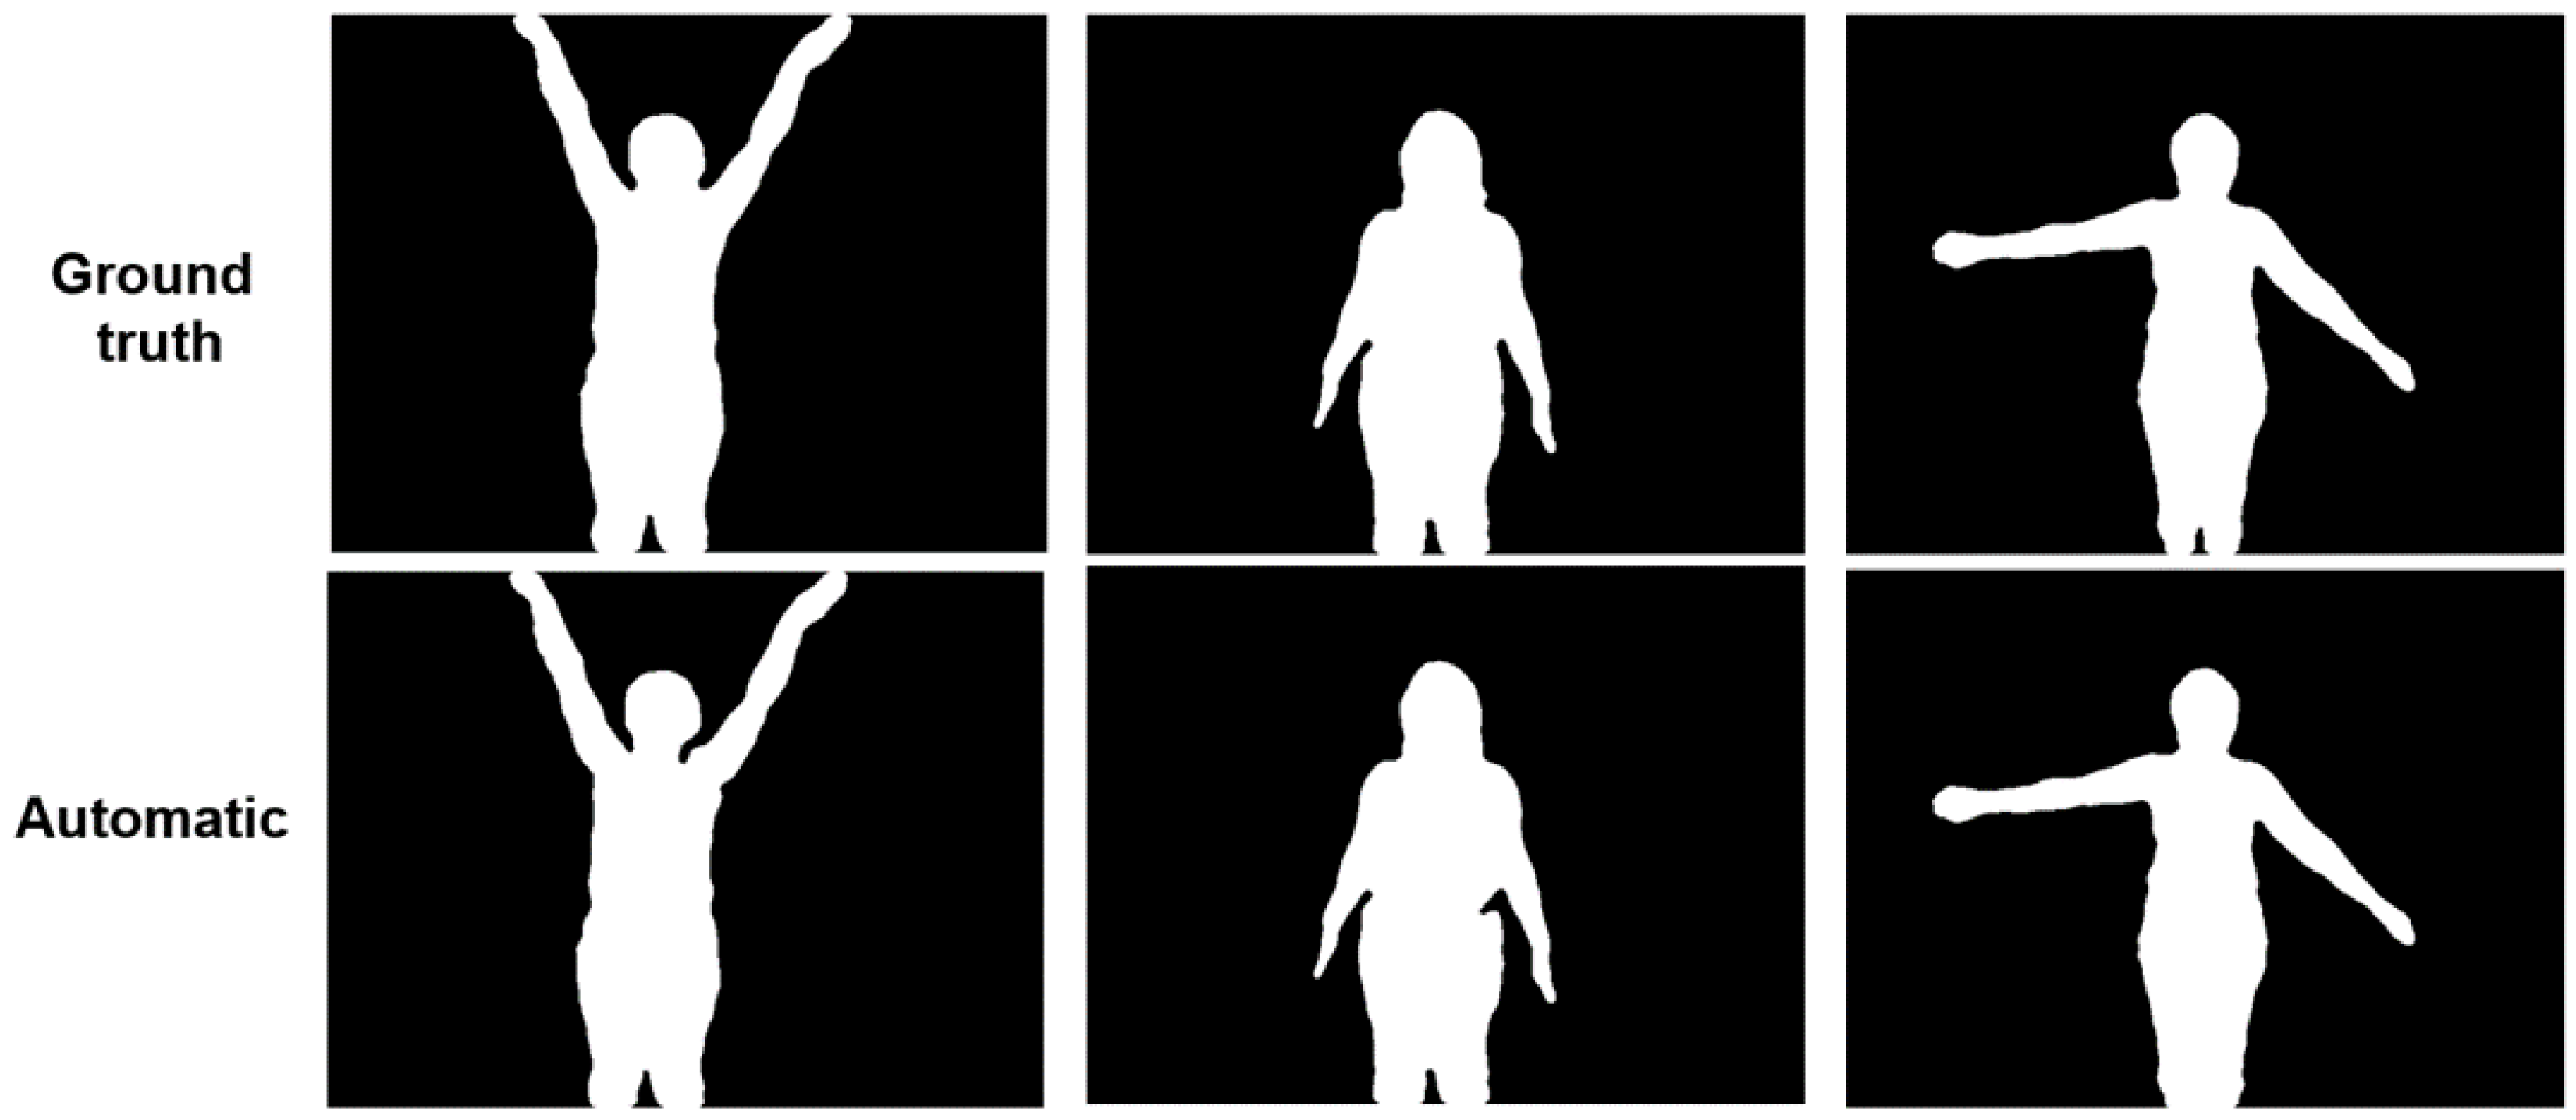
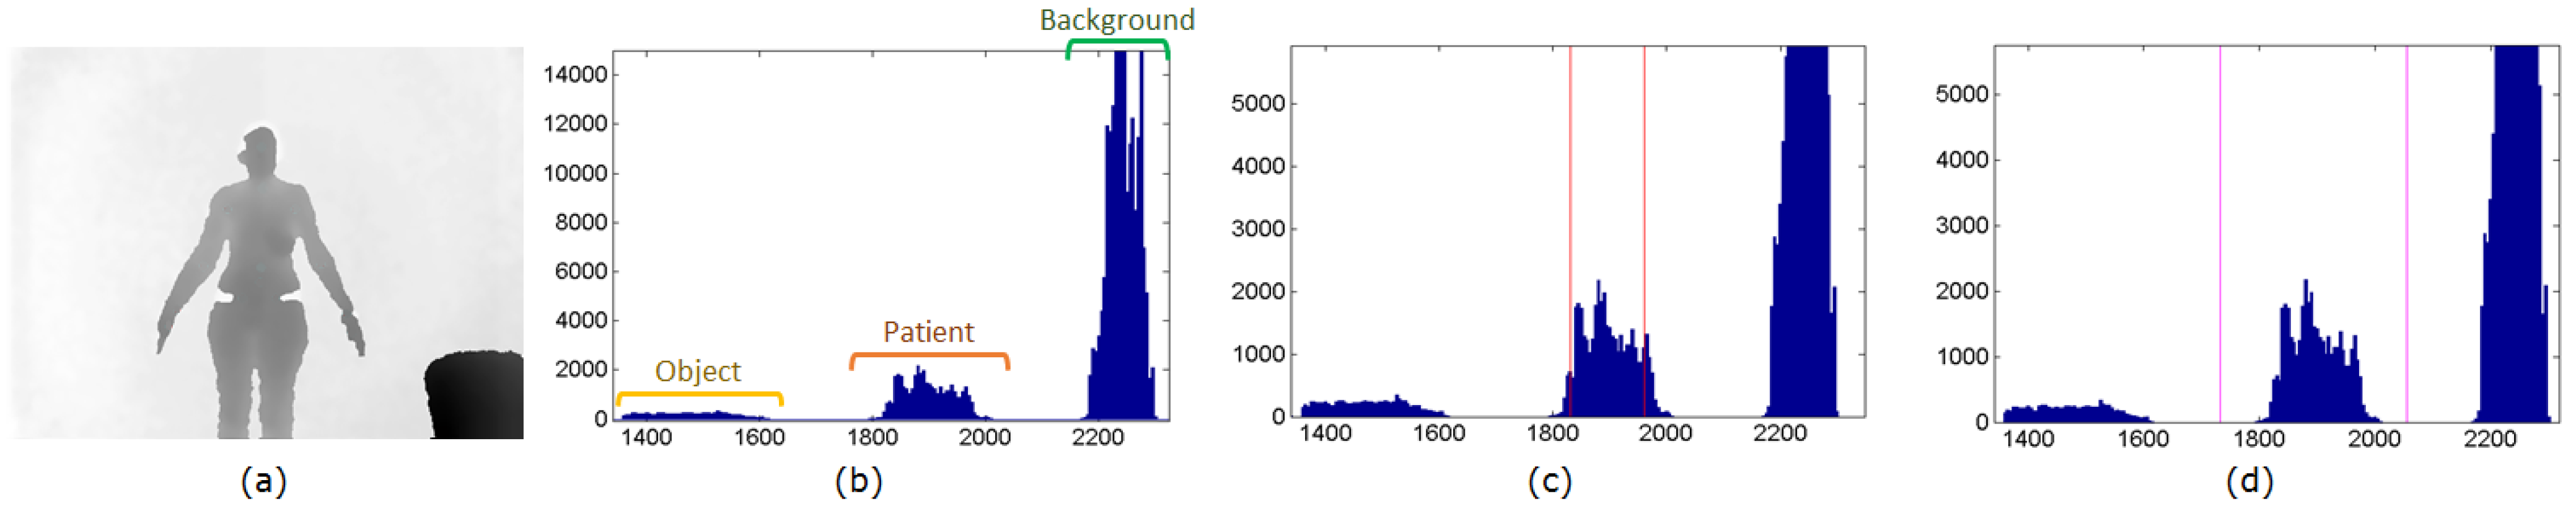
3.2. Patient Segmentation
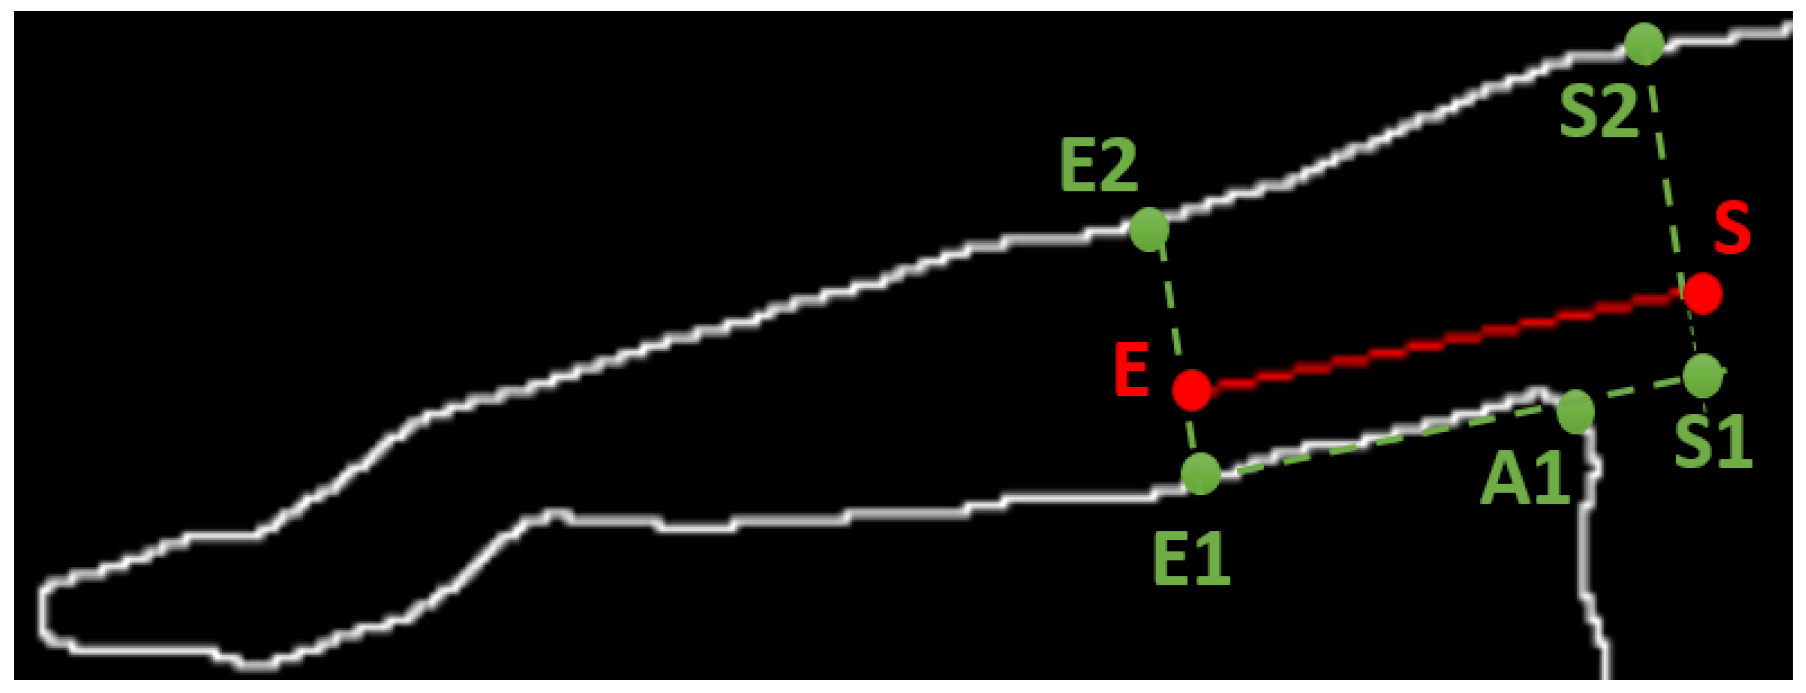
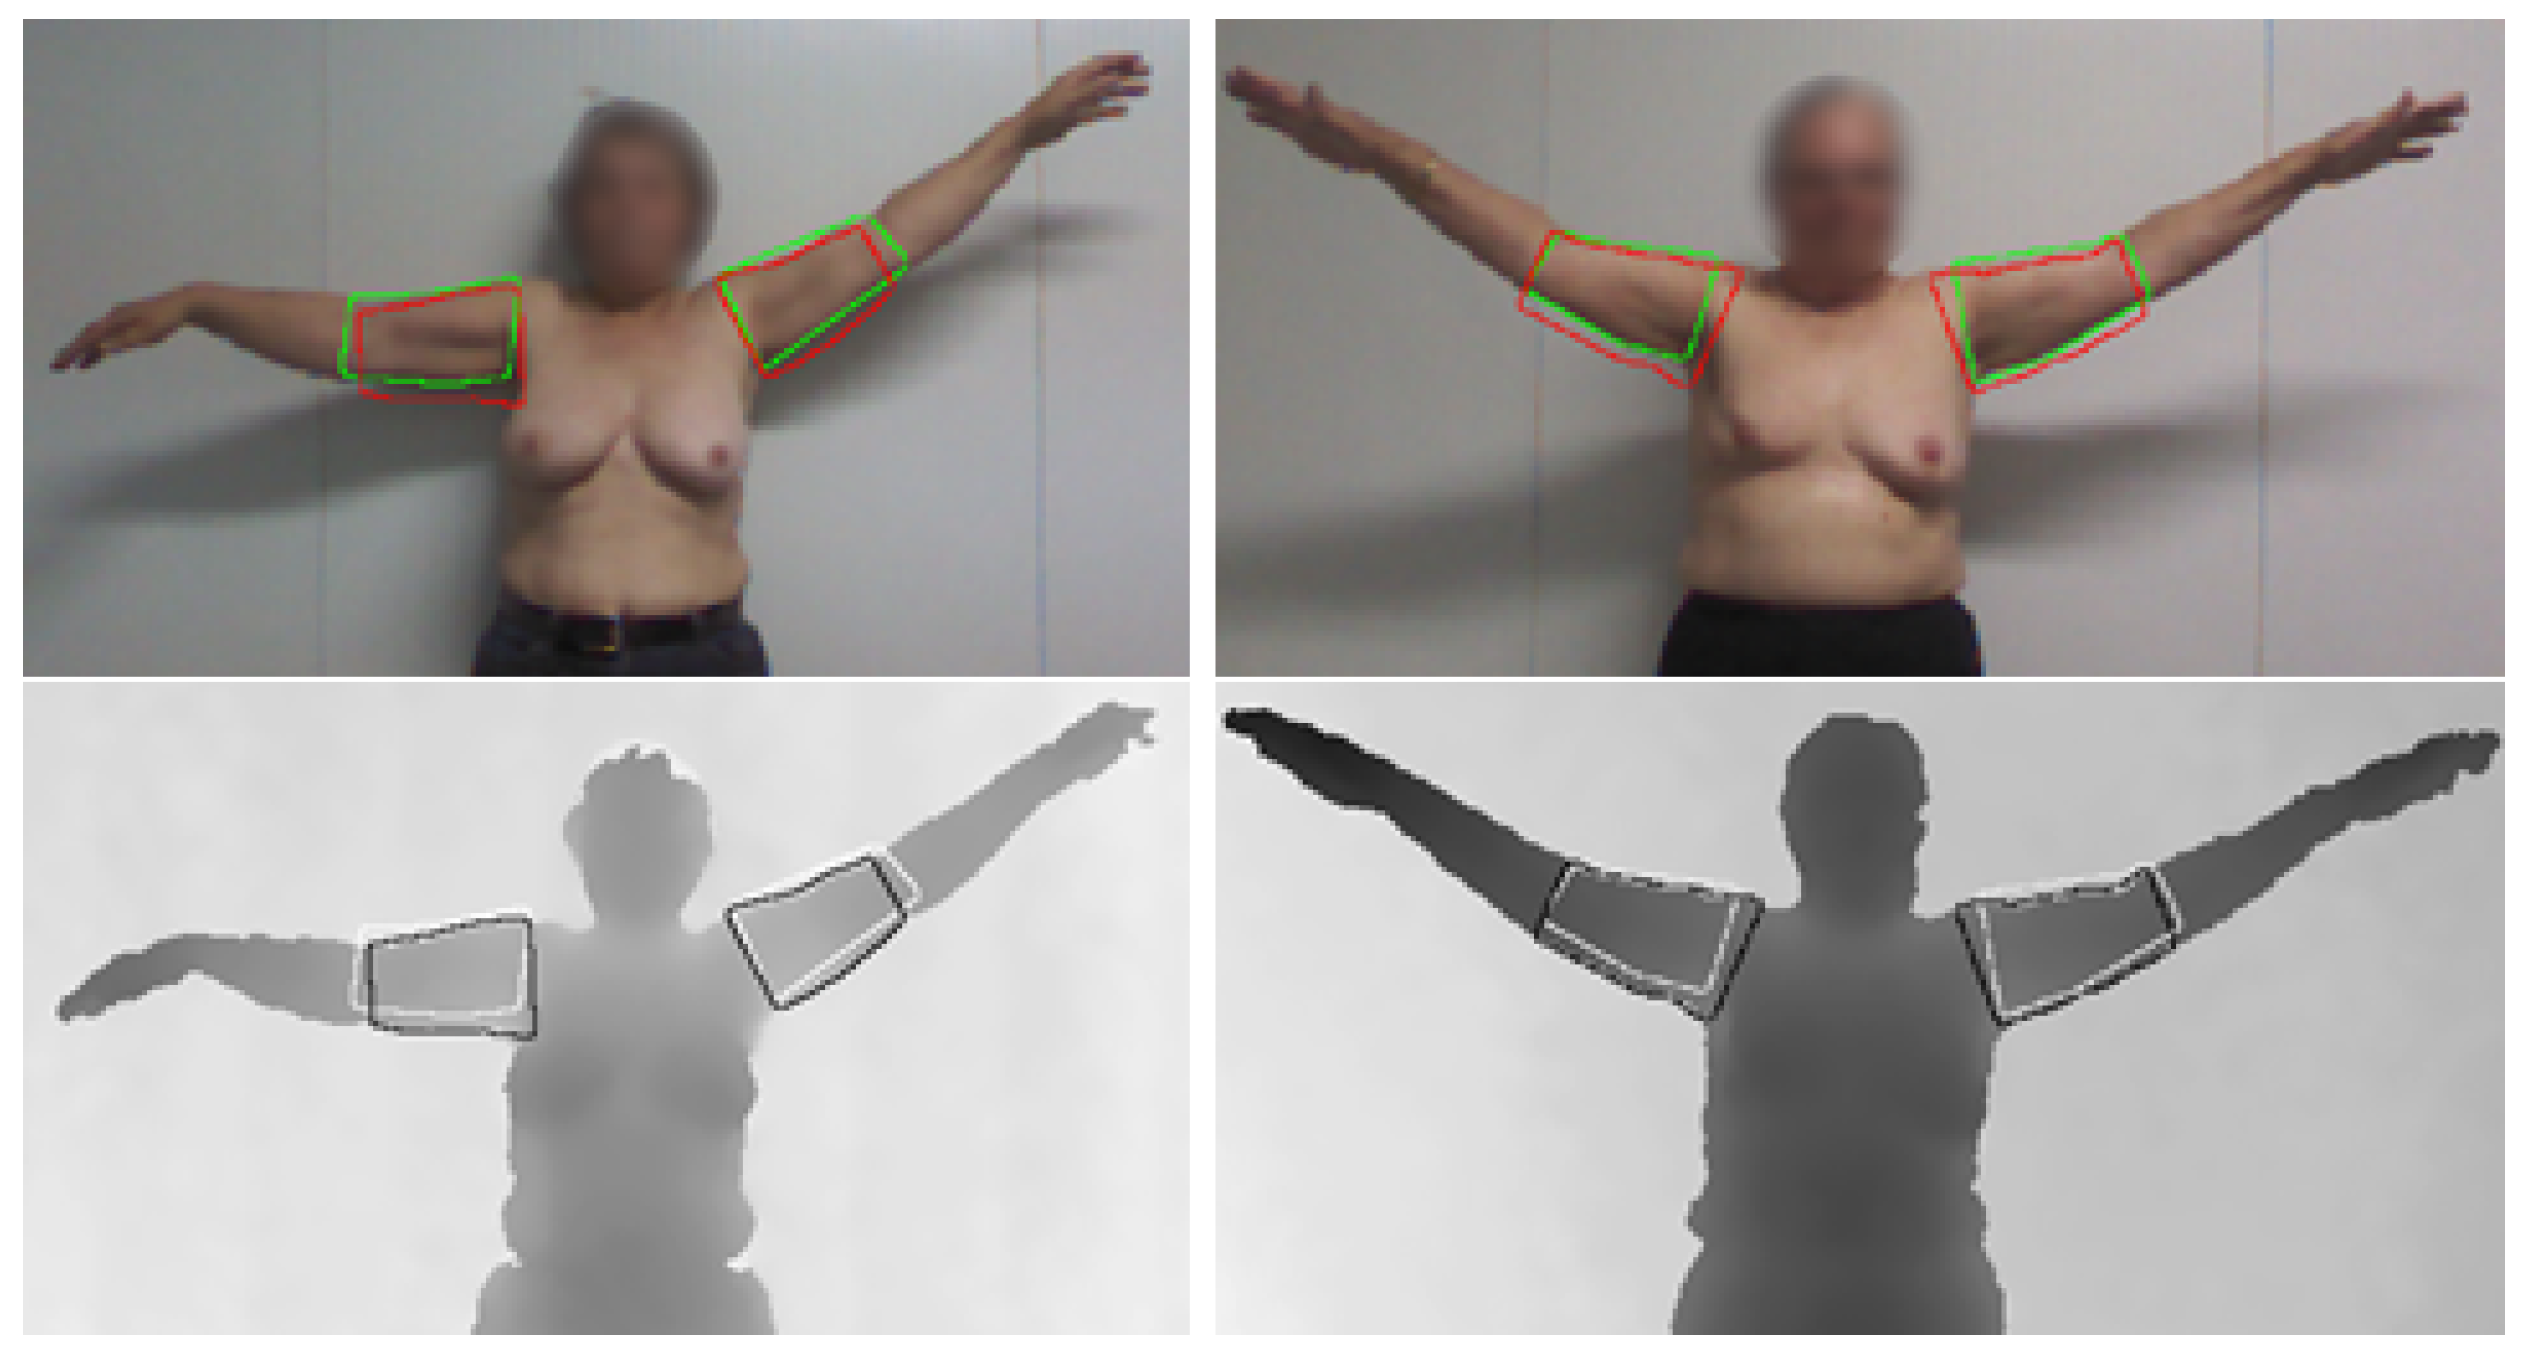
3.3. Arm Point Detection
3.4. Feature Extraction
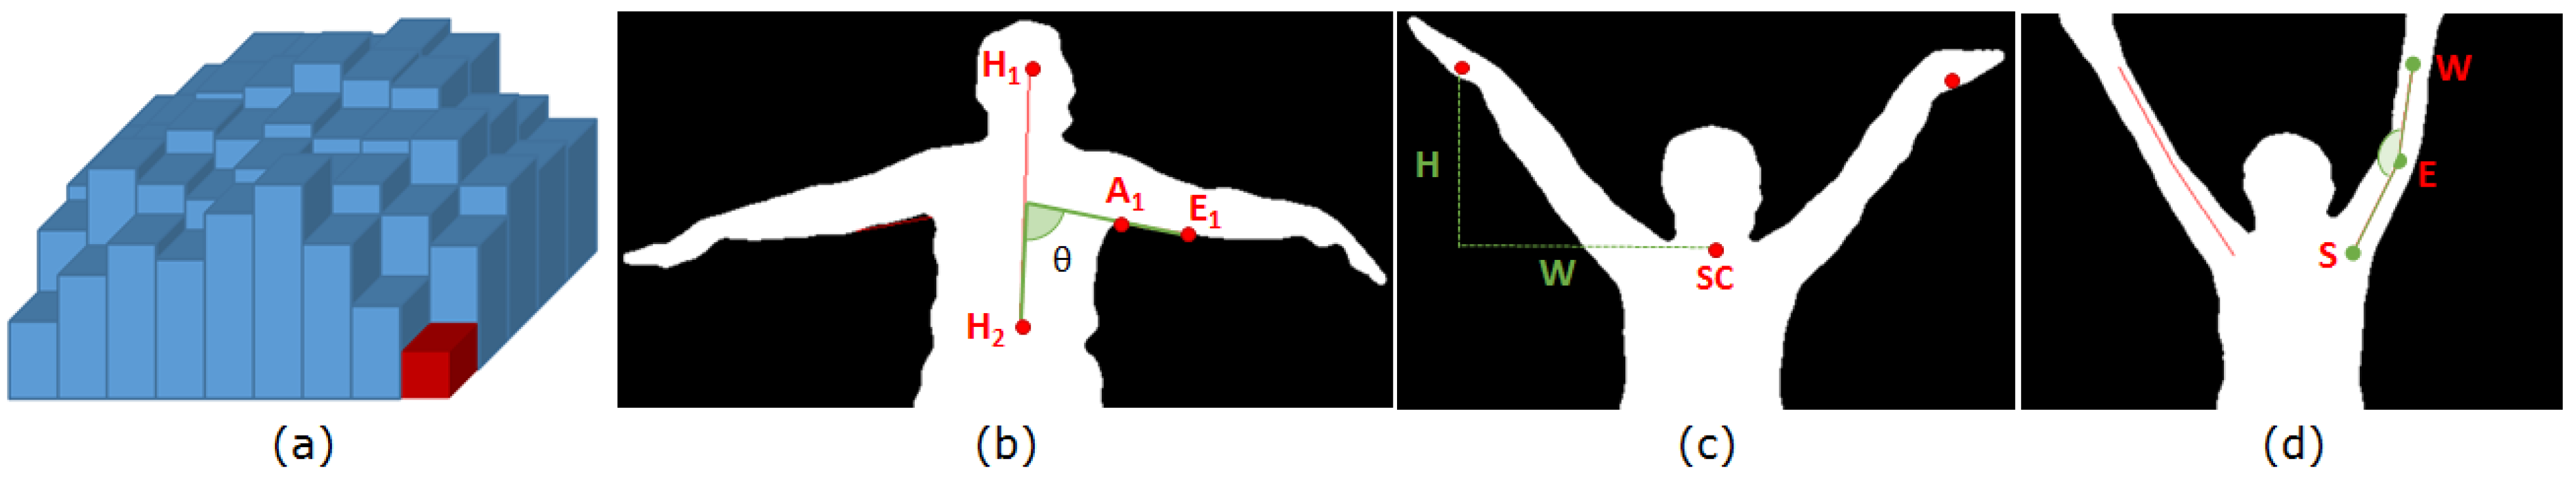
3.4.1. Volume
3.4.2. Range of Motion
- the ratio of the maximum ROM, obtained at the maximum height achieved by the hand ().
- the average of the ROM ratio along all movement ().
3.4.3. Hand Height and Hand Width
- the ratio of the maximum height achieved by the hand ().
- the width at the maximum height point ().
- the average of the height ratio along all movement ().
- the average of the width ratio along all movement ().
3.4.4. Elbow Flexion
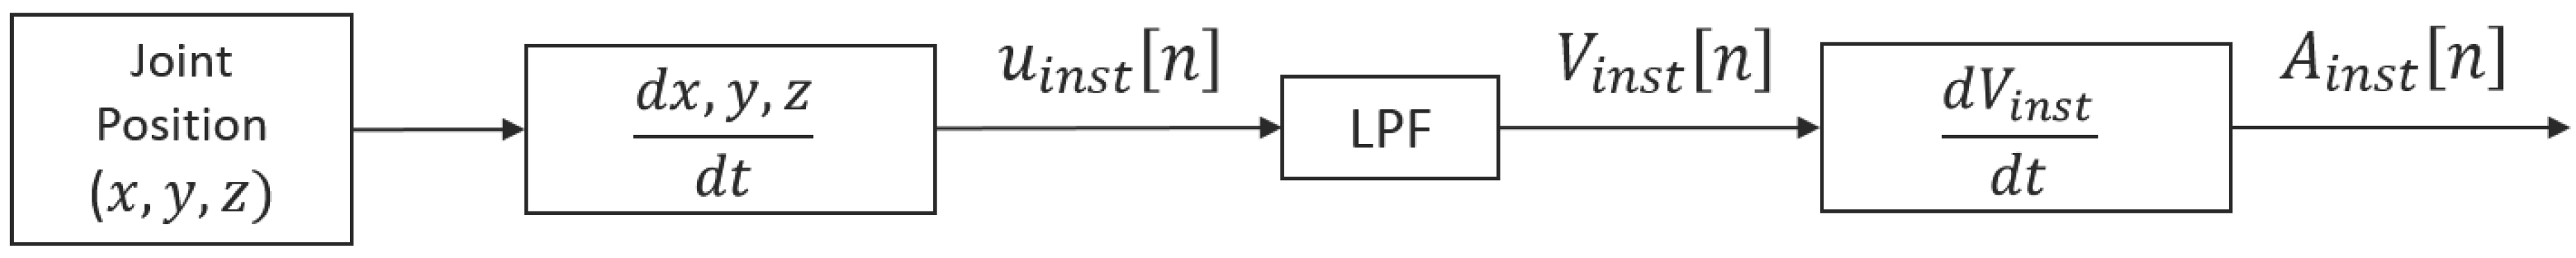
3.4.5. Hand Acceleration

3.5. Classification Models
| - | Acronym | Description |
|---|---|---|
| 1 | Average of the volume ratio. | |
| 2 | ROM at the maximum height achieved by the hand. | |
| 3 | Maximum height achieved by the hand. | |
| 4 | Width at the maximum height point. | |
| 5 | Average of the right and left ratio of the elbow angle. | |
| 6 | Average of the hand instantaneous acceleration. | |
| 7 | Average of the height ratio along the movement. | |
| 8 | Average of the width ratio along the movement. | |
| 9 | Average of the ROM ratio along the movement. |
4. Results
4.1. Database
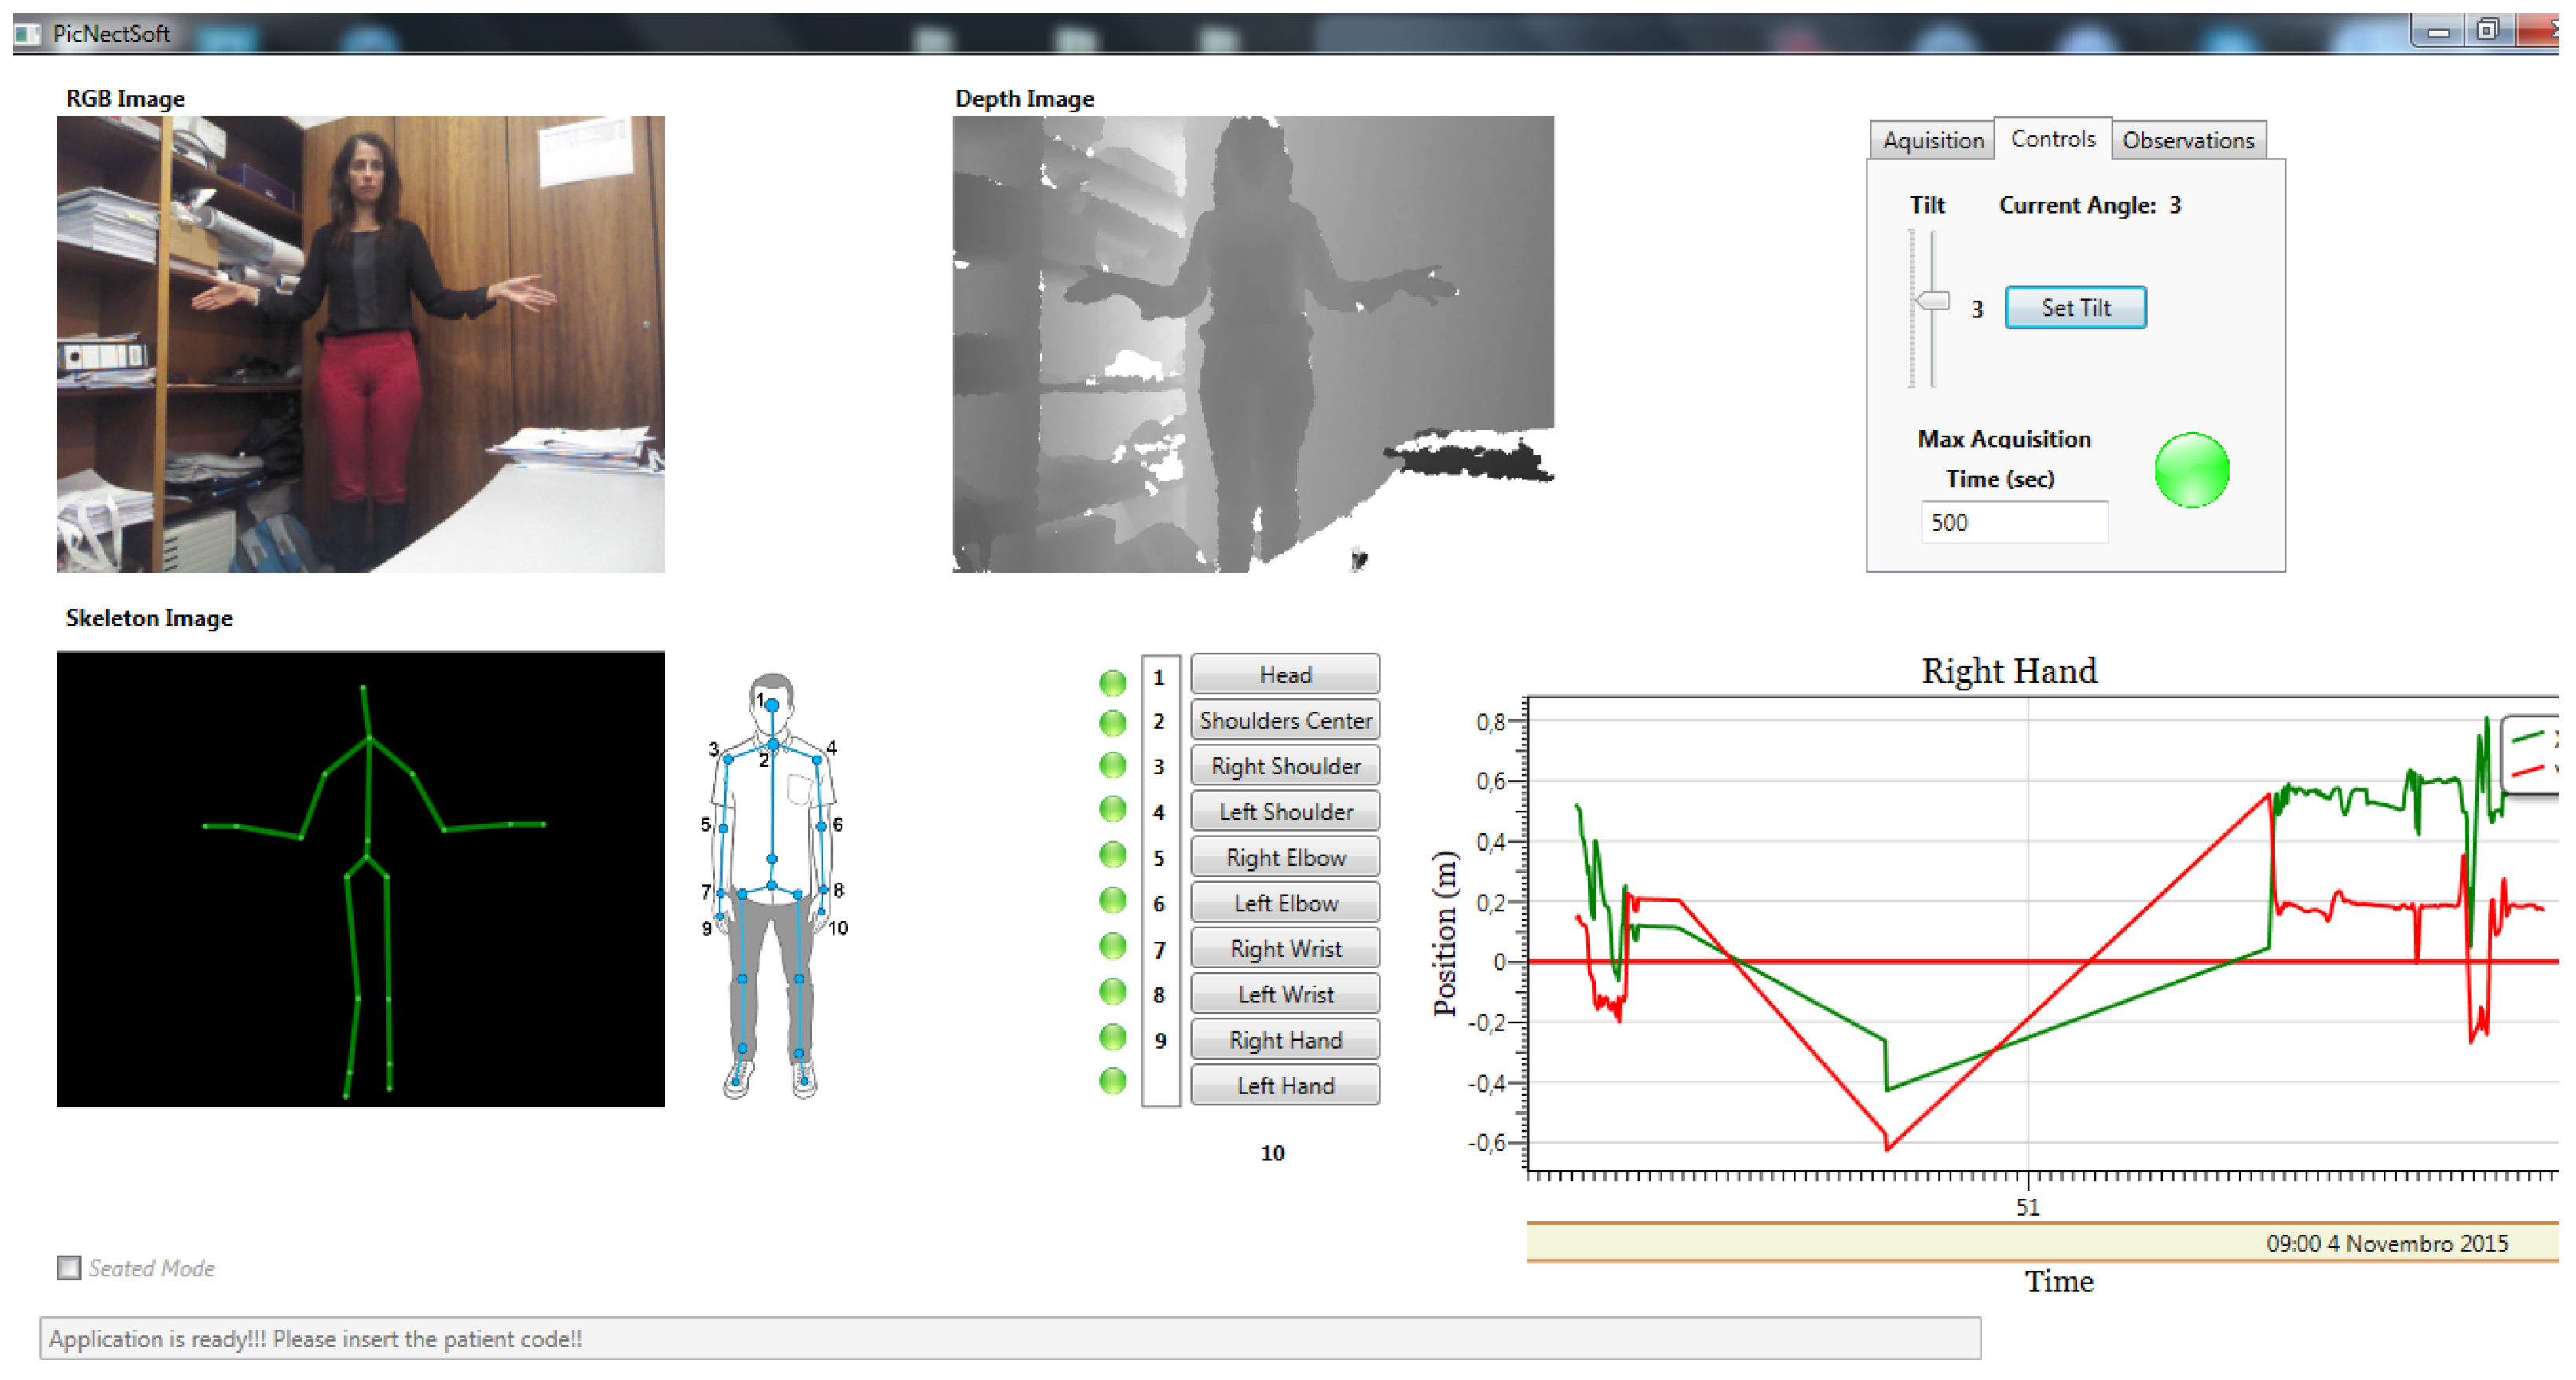
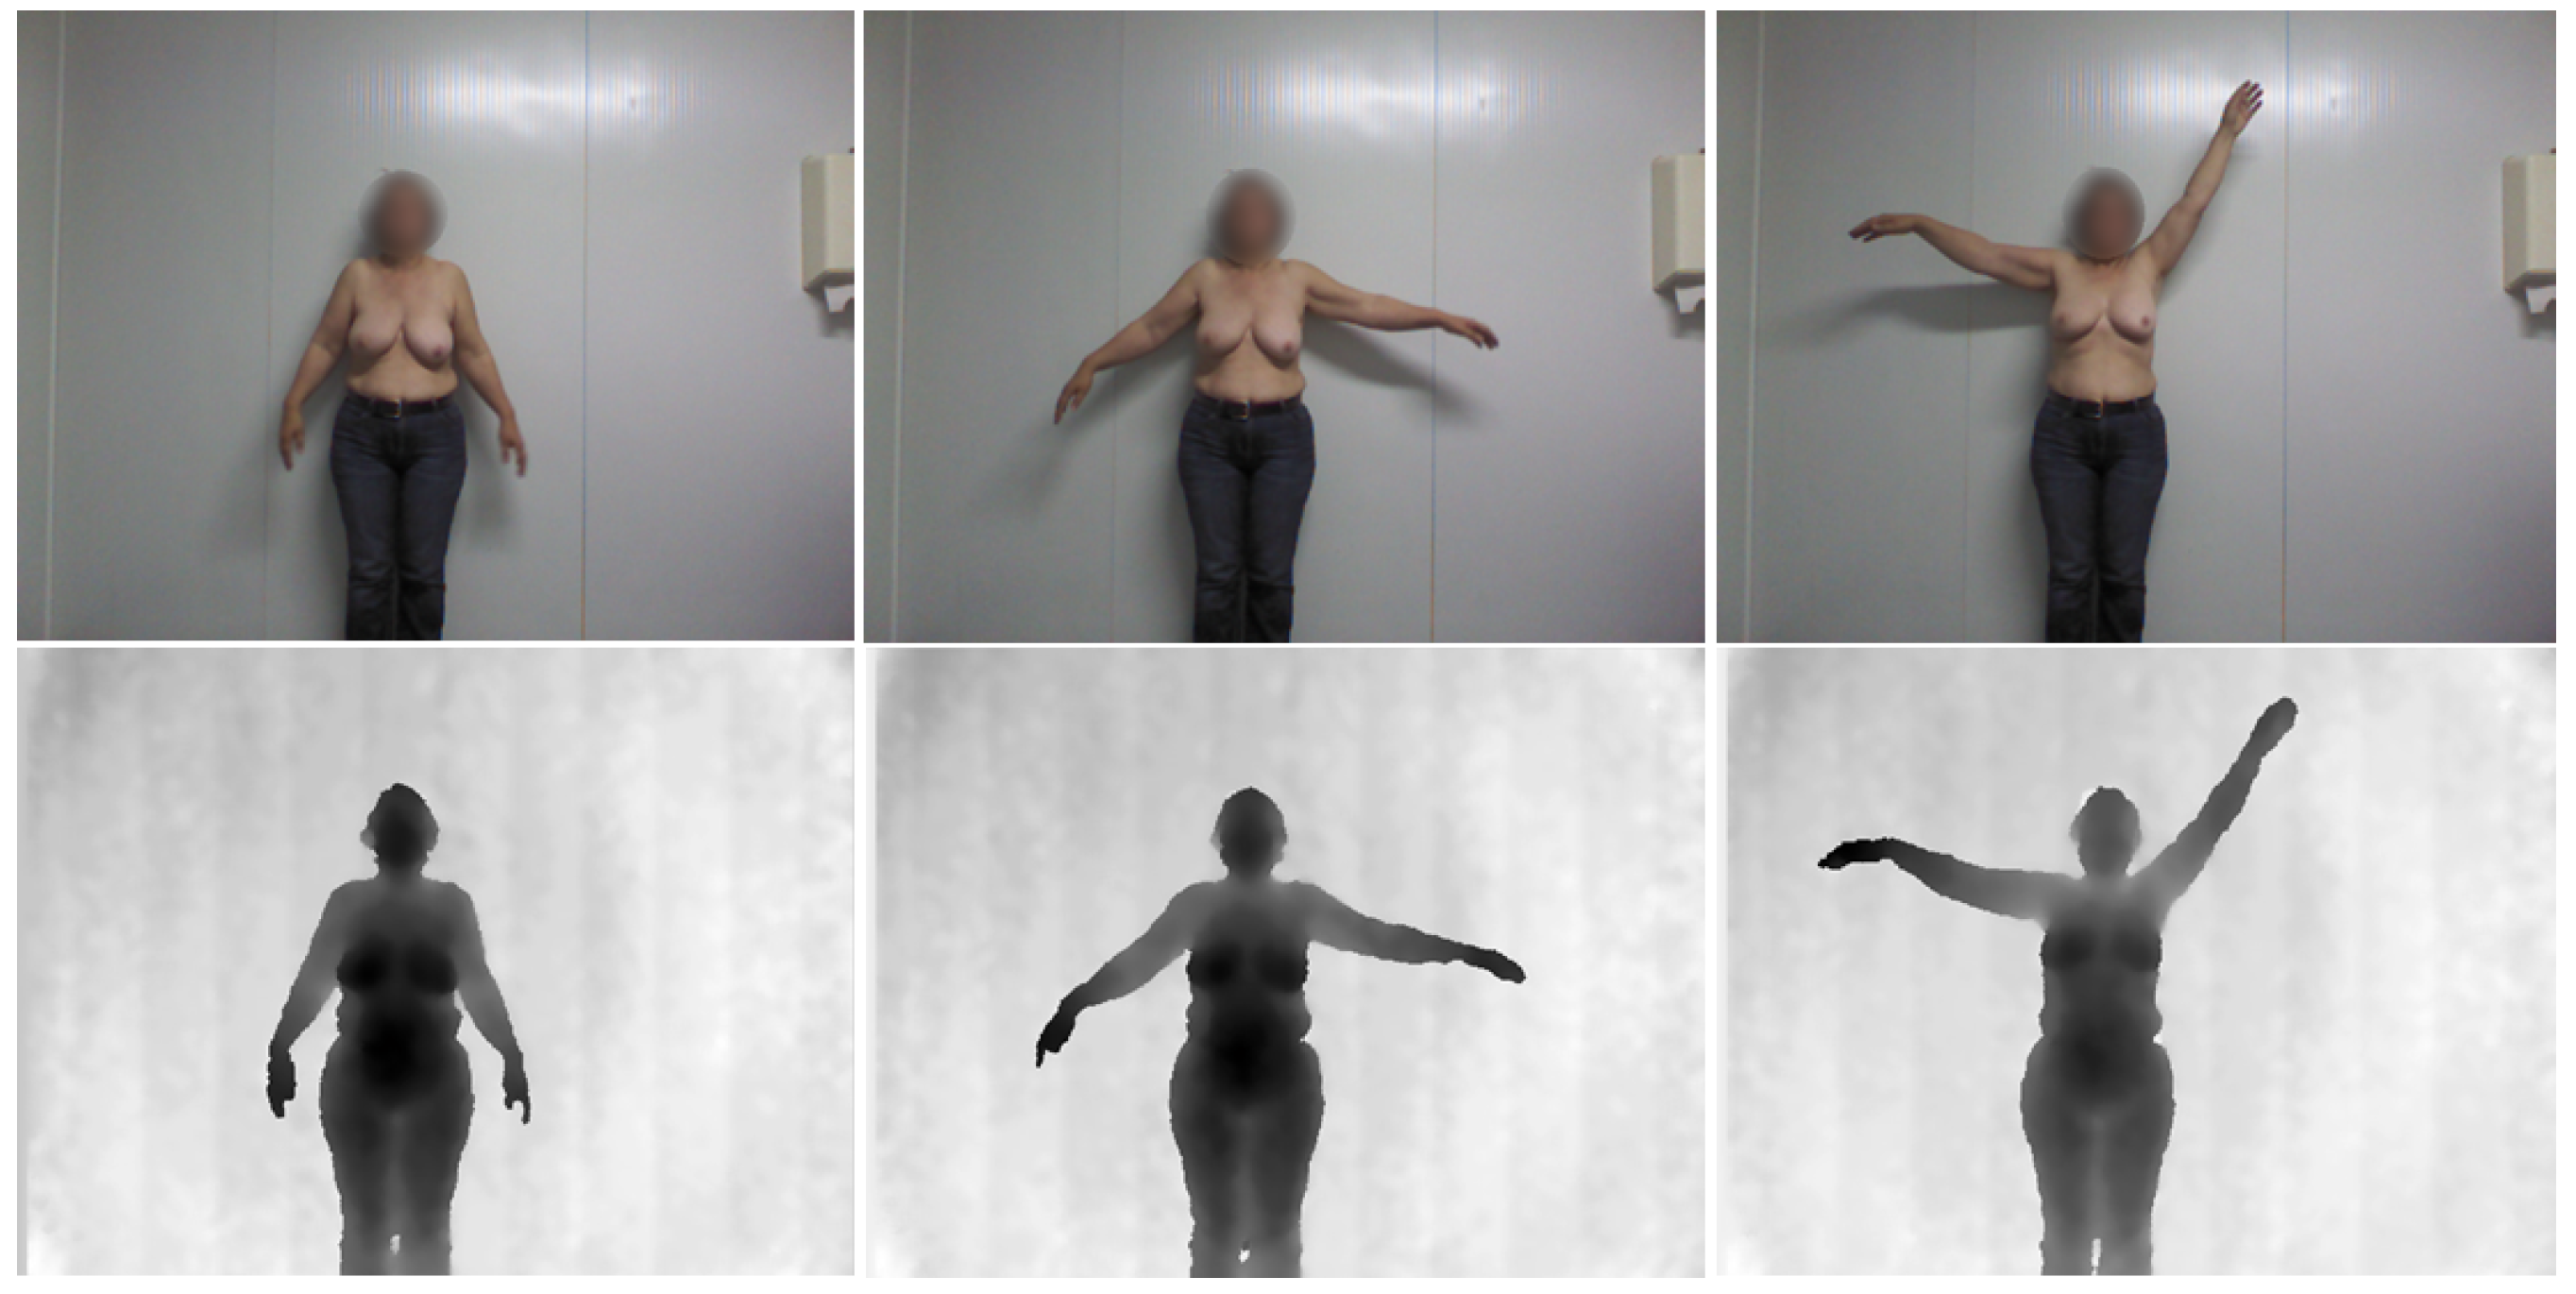
4.1.1. Database Acquisition
4.1.2. Database Analysis
4.2. Depth Map Noise Reduction
4.3. Patient Segmentation
| Name | Equation | - |
|---|---|---|
| Dice coefficient (D) | Equation (6) | Measures the extent of spatial overlap between two binary images. It gives more weighting to instances where the two images agree. Its values range between 0 (no overlap) and 1 (perfect agreement). |
| Jaccard index (J) | Equation (7) | Measures similarity between finite sample sets and is defined as the number of attributes shared divided by the total number of attributes present in either of them. Its values range between 0 (no similarity) and 1 (equal). |
| - | Body Segmentation | Arm Segmentation | ||
|---|---|---|---|---|
| Mean | SD | Mean | SD | |
| Dice coefficient (D) | 0.999 | 0.003 | 0.783 | 0.048 |
| Jaccard index (J) | 0.997 | 0.005 | 0.646 | 0.066 |
| - | Detected ⇒ GT | GT ⇒ Detected | |||||||
|---|---|---|---|---|---|---|---|---|---|
| Mean | SD | Max | Min | Mean | SD | Max | Min | ||
| Body | h | 3.99 | 7.31 | 42.76 | 0 | 3.60 | 7.42 | 38.60 | 0 |
| Avg | 0.09 | 0.21 | 1.28 | 0 | 0.11 | 0.33 | 2.16 | 0 | |
| Arm | h | 12.90 | 2.80 | 18.60 | 6.00 | 12.70 | 4.25 | 22.00 | 5.83 |
| Avg | 4.82 | 1.03 | 7.28 | 2.67 | 4.91 | 1.18 | 7.20 | 2.83 | |
4.4. Arm Segmentation

4.5. Upper-Body Functional Evaluation
| Classifier | Kernel | C | Order | γ | MER | Feat. Set |
|---|---|---|---|---|---|---|
| LDA | - | - | - | - | 0.29 | [, ] |
| Naive Bayes | - | - | - | - | 0.27 | [, , ] |
| SVM | Linear | - | - | 0.25 | [, , ] | |
| SVM | Polynomial | 4 | - | 0.19 | [, ] | |
| SVM | RBF | - | 0.75 | 0.19 | [, , ] |
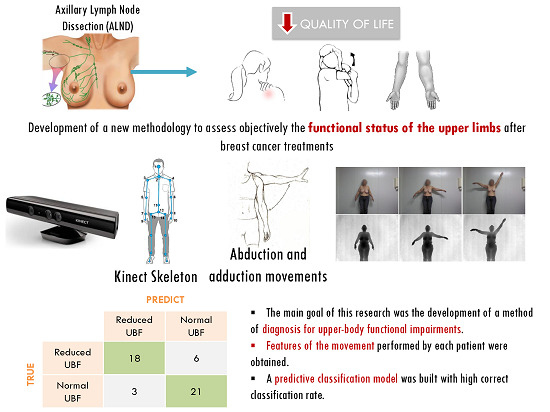
| True Prediction | Reduced UBF | Normal UBF |
|---|---|---|
| Reduced UBF | 18 | 6 |
| Normal UBF | 3 | 21 |
| Classifier | Precision | Recall | Specificity |
|---|---|---|---|
| LDA | 0.92 | 0.46 | 0.96 |
| Naive Bayes | 0.92 | 0.50 | 0.96 |
| Linear SVM | 1.00 | 0.50 | 1.00 |
| Polynomial SVM | 0.86 | 0.75 | 0.88 |
| RBF SVM | 0.86 | 0.75 | 0.88 |
5. Conclusions
Acknowledgments
Author Contributions
Conflicts of Interest
References
- Ferlay, J.; Shin, H.; Bray, F.; Forman, D.; Mathers, C.; Parkin, D. GLOBOCAN 2008 v2.0, Cancer Incidence and Mortality Worldwide: IARC CancerBase No. 10. Available online: http://globocan.iarc.fr (accessed on 27 October 2010).
- Goyal, A.; Newcombe, R.; Chhabra, A.; Mansel, R. Morbidity in Breast Cancer Patients with Sentinel Node Metastases Undergoing Delayed Axillary Lymph Node Dissection (ALND) Compared with Immediate ALND. Ann. Surg. Oncol. 2008, 15, 262–267. [Google Scholar] [CrossRef] [PubMed]
- Donker, M.; van Tienhoven, G.; Straver, M.E.; Meijnen, P.; van de Velde, C.J.H.; Mansel, R.E.; Cataliotti, L.; Westenberg, A.H.; Klinkenbijl, J.H.G.; Orzalesi, L.; et al. Radiotherapy or surgery of the axilla after a positive sentinel node in breast cancer (EORTC 10981-22023 AMAROS): A randomised, multicentre, open-label, phase 3 non-inferiority trial. Lancet Oncol. 2014, 15, 1303–1310. [Google Scholar] [CrossRef]
- Nesvold, I.; Reinertsen, K.; Fossa, S.; Dahl, A. The relation between arm/shoulder problems and quality of life in breast cancer survivors: A cross-sectional and longitudinal study. J. Cancer Surviv. 2011, 5, 62–72. [Google Scholar] [CrossRef] [PubMed]
- Stanton, A.; Krishnan, L.; Collins, C. Form or function? Part 1. Subjective cosmetic and functional correlates of quality of life in women treated with breast-conserving surgical procedures and radiotherapy. Cancer 2001, 91, 2273–2281. [Google Scholar] [CrossRef]
- Oliveira, H.P.; Cardoso, J.S.; Magalhaes, A.; Cardoso, M.J. Methods for the aesthetic evaluation of Breast Cancer Conservation Treatment: A Technological Review. Curr. Med. Imaging Rev. 2013, 9, 32–46. [Google Scholar] [CrossRef]
- Cardoso, M.J.; Oliveira, H.P.; Cardoso, J.S. Assessing Cosmetic Results after Breast Conserving Surgery. J. Surg. Oncol. 2014, 110, 37–44. [Google Scholar] [CrossRef] [PubMed]
- Bulley, C.; Coutts, F.; Blyth, C.; Jack, W.; Chetty, M.; Barber, M.; Tan, C. Prevalence and Impacts of Upper Limb Morbidity after Treatment for Breast Cancer: A Cross-Sectional Study of Lymphedema and Function. Cancer Oncol. Res. 2013, 1, 30–39. [Google Scholar]
- McNeely, M.; Campbell, K.; Ospina, M.; Rowe, B.; Dabbs, K.; Klassen, T.; Mackey, J.; Courneya, K. Exercise interventions for upper-limb dysfunction due to breast cancer treatment. Cochrane Database Syst. Rev. 2010, 6. [Google Scholar] [CrossRef]
- De Backer, I.; Schep, G.; Backx, F.; Vreugdenhil, G.; Kuipers, H. Resistance Training in Cancer Survivors: A Systematic review. Int. J. Sports Med. 2009, 30, 703–712. [Google Scholar] [CrossRef] [PubMed]
- Cheema, B.; Gaul, C.; Lane, K.; Singh, M. Progressive resistance training in breast cancer: A systematic review of clinical trials. Breast Cancer Res. Treat. 2008, 109, 9–26. [Google Scholar] [CrossRef] [PubMed]
- McNeely, M.; Campbell, K.; Rowe, B.; Klassen, T.; Mackey, J.; Courneya, K. Effects of exercise on breast cancer patients and survivors: A systematic review and meta-analysis. Can. Med. Assoc. J. 2006, 175, 34–41. [Google Scholar] [CrossRef] [PubMed]
- Speck, R.; Courneya, K.; Mâsse, L.; Duval, S.; Schmitz, K. An update of controlled physical activity trials in cancer survivors: A systematic review and meta-analysis. J. Cancer Surviv. 2010, 4, 87–100. [Google Scholar] [CrossRef] [PubMed]
- Moreira, R.; Magalhães, A.; Oliveira, H.P. A Kinect-Based System to Assess Lymphedema Impairments in Breast Cancer Patients. In Proceedings of the 7th Iberian Conference on Pattern Recognition and Image Analysis, Santiago, Spain, 17–19 June 2015; pp. 228–236.
- Hayes, S.; Janda, M.; Cornish, B.; Battistutta, D.; Newman, B. Lymphedema After Breast Cancer: Incidence, Risk Factors, and Effect on Upper Body Function. J. Clin. Oncol. 2008, 26, 3536–3542. [Google Scholar] [CrossRef] [PubMed]
- Armer, J.; Radina, M.; Porock, D.; Culbertson, S. Predicting Breast Cancer-Related Lymphedema Using Self-Reported Symptoms. Nurs. Res. 2003, 52, 370–379. [Google Scholar] [CrossRef] [PubMed]
- Bulley, C.; Gaal, S.; Coutts, F.; Blyth, C.; Jack, W.; Chetty, M.; Barber, M.; Tan, C. Comparison of Breast Cancer-Related Lymphedema (Upper Limb Swelling) Prevalence Estimated Using Objective and Subjective Criteria and Relationship with Quality of Life. BioMed Res. Int. 2013, 2013. [Google Scholar] [CrossRef] [PubMed]
- Lu, G.; DeSouza, G.; Armer, J.; Anderson, B.; Shyu, C. A system for limb-volume measurement using 3D models from an infrared depth sensor. In Proceedings of IEEE Symposium on Computational Intelligence in Healthcare and e-Health, Singapore, Singapore, 16–19 April 2013; pp. 64–69.
- Taylor, R.; Jayasinghe, U.; Koelmeyer, L.; Ung, O.; Boyages, J. Reliability and validity of arm volume measurements for assessment of lymphedema. Phys. Ther. 2006, 86, 205–214. [Google Scholar] [PubMed]
- Stanton, A.; Badger, C.; Sitzia, J. Non-invasive assessment of the lymphedematous limb. Lymphology 2000, 33, 122–135. [Google Scholar] [PubMed]
- Pero-System Messgerate GmbH. Available online: http://www.pero-system.de/ (accessed on 3 November 2015).
- Dixon, A.; Wheeler, T.; Lomas, D.; Mackenzie, R. Computed tomography or magnetic resonance imaging for axillary symptoms following treatment of breast carcinoma? A randomized trial. Clin. Radiol. 1993, 48, 371–376. [Google Scholar] [CrossRef]
- Vukotich, C.; Geyer, M.; Erdeljac, F. Use of a Laser Scanning System to Measure Limb Volume in Chronic Edema. Available online: http://www.resna.org/sites/default/files/legacy/conference/proceedings/2011/RESNA_ICTA/vukotich-69743.pdf (accessed on 3 November 2015).
- Trombetta, C.; Abundo, P.; Felici, A.; Ljoka, C.; di Cori, S.; Rosato, N.; Foti, C. Computer Aided Measurement Laser (CAML): Technique to quantify post-mastectomy lymphoedema. J. Phys. Conf. Ser. 2012, 383. [Google Scholar] [CrossRef]
- Campbell, K.; Pusic, A.; Zucker, D.; McNeely, M.; Binkley, J.; Cheville, A.; Harwood, K. A prospective model of care for breast cancer rehabilitation: Function. Cancer 2012, 118, 2300–2311. [Google Scholar] [CrossRef] [PubMed]
- Stratford, P. Assessing Disability and Change on Individual Patients: A Report of a Patient Specific Measure. Physiother. Can. 1995, 47, 258–263. [Google Scholar] [CrossRef]
- Hudak, P.; Amadio, P.; Bombardier, C.; Beaton, D.; Cole, D.; Davis, A.; Hawker, G.; Katz, J.; Makela, M.; Marx, R.G.; et al. Development of an upper extremity outcome measure: The DASH (disabilities of the arm, shoulder, and head). Am. J. Ind. Med. 1996, 29, 602–608. [Google Scholar] [CrossRef]
- Stratford, P.; Binkley, J.; Stratford, D. Development and initial validation of the upper extremity functional index. Physiother. Can. 2001, 53, 259–267. [Google Scholar]
- Kwan, W.; Jackson, J.; Weir, L.; Dingee, C.; McGregor, G.; Olivotto, I. Chronic Arm Morbidity After Curative Breast Cancer Treatment: Prevalence and Impact on Quality of Life. J. Clin. Oncol. 2002, 20, 4242–4248. [Google Scholar] [CrossRef] [PubMed]
- Freitas-Silva, R.; Conde, D.; Freitas-Júnior, R.; Martinez, E. Comparison of quality of life, satisfaction with surgery and shoulder-arm morbidity in breast cancer survivors submitted to breast-conserving therapy or mastectomy followed by immediate breast reconstruction. Clinics 2010, 65, 781–787. [Google Scholar] [CrossRef] [PubMed] [Green Version]
- Hayes, S.; Rye, S.; Battistutta, D.; DiSipio, T.; Newman, B. Upper-body morbidity following breast cancer treatment is common, may persist longer-term and adversely influences quality of life. Health Qual. Life Outcomes 2010, 8, 92–98. [Google Scholar] [CrossRef] [PubMed] [Green Version]
- Tomasi, C.; Manduchi, R. Bilateral filtering for gray and color images. In Proceedings of the Sixth International Conference on Computer Vision, Bombay, India, 4–7 January 1998.
- Oliveira, H.; Cardoso, J.; Magalhaes, A.; Cardoso, M. A 3D low-cost solution for the aesthetic evaluation of breast cancer conservative treatment. Comput. Methods Biomech. Biomed. Eng. Imaging Vis. 2014, 2, 90–106. [Google Scholar] [CrossRef]
- Drake, R.; Vogl, A.; Mitchell, A. Gray’s Anatomy for Students; Churchill Livingstone: London, UK, 2009. [Google Scholar]
- Duda, R.O.; Hart, P.E.; Stork, D.G. Pattern Classification, 2nd ed.; Wiley Interscience Publication: Hoboken, NJ, USA, 2000. [Google Scholar]
© 2015 by the authors; licensee MDPI, Basel, Switzerland. This article is an open access article distributed under the terms and conditions of the Creative Commons Attribution license (http://creativecommons.org/licenses/by/4.0/).
Share and Cite
Moreira, R.; Magalhães, A.; Oliveira, H.P. A Kinect-Based System for Upper-Body Function Assessment in Breast Cancer Patients. J. Imaging 2015, 1, 134-155. https://doi.org/10.3390/jimaging1010134
Moreira R, Magalhães A, Oliveira HP. A Kinect-Based System for Upper-Body Function Assessment in Breast Cancer Patients. Journal of Imaging. 2015; 1(1):134-155. https://doi.org/10.3390/jimaging1010134
Chicago/Turabian StyleMoreira, Rita, André Magalhães, and Hélder P. Oliveira. 2015. "A Kinect-Based System for Upper-Body Function Assessment in Breast Cancer Patients" Journal of Imaging 1, no. 1: 134-155. https://doi.org/10.3390/jimaging1010134