
Method for Benchmarking Li Metal Anodes: A Mandatory Step toward Reliable Lithium Metal Batteries
 , ,
, ,
Abstract
:1. Introduction
- A benchmarking method to evaluate Li anodes performance was proposed.
- In total, 285 coin-cells were assembled to compare three Li anodes.
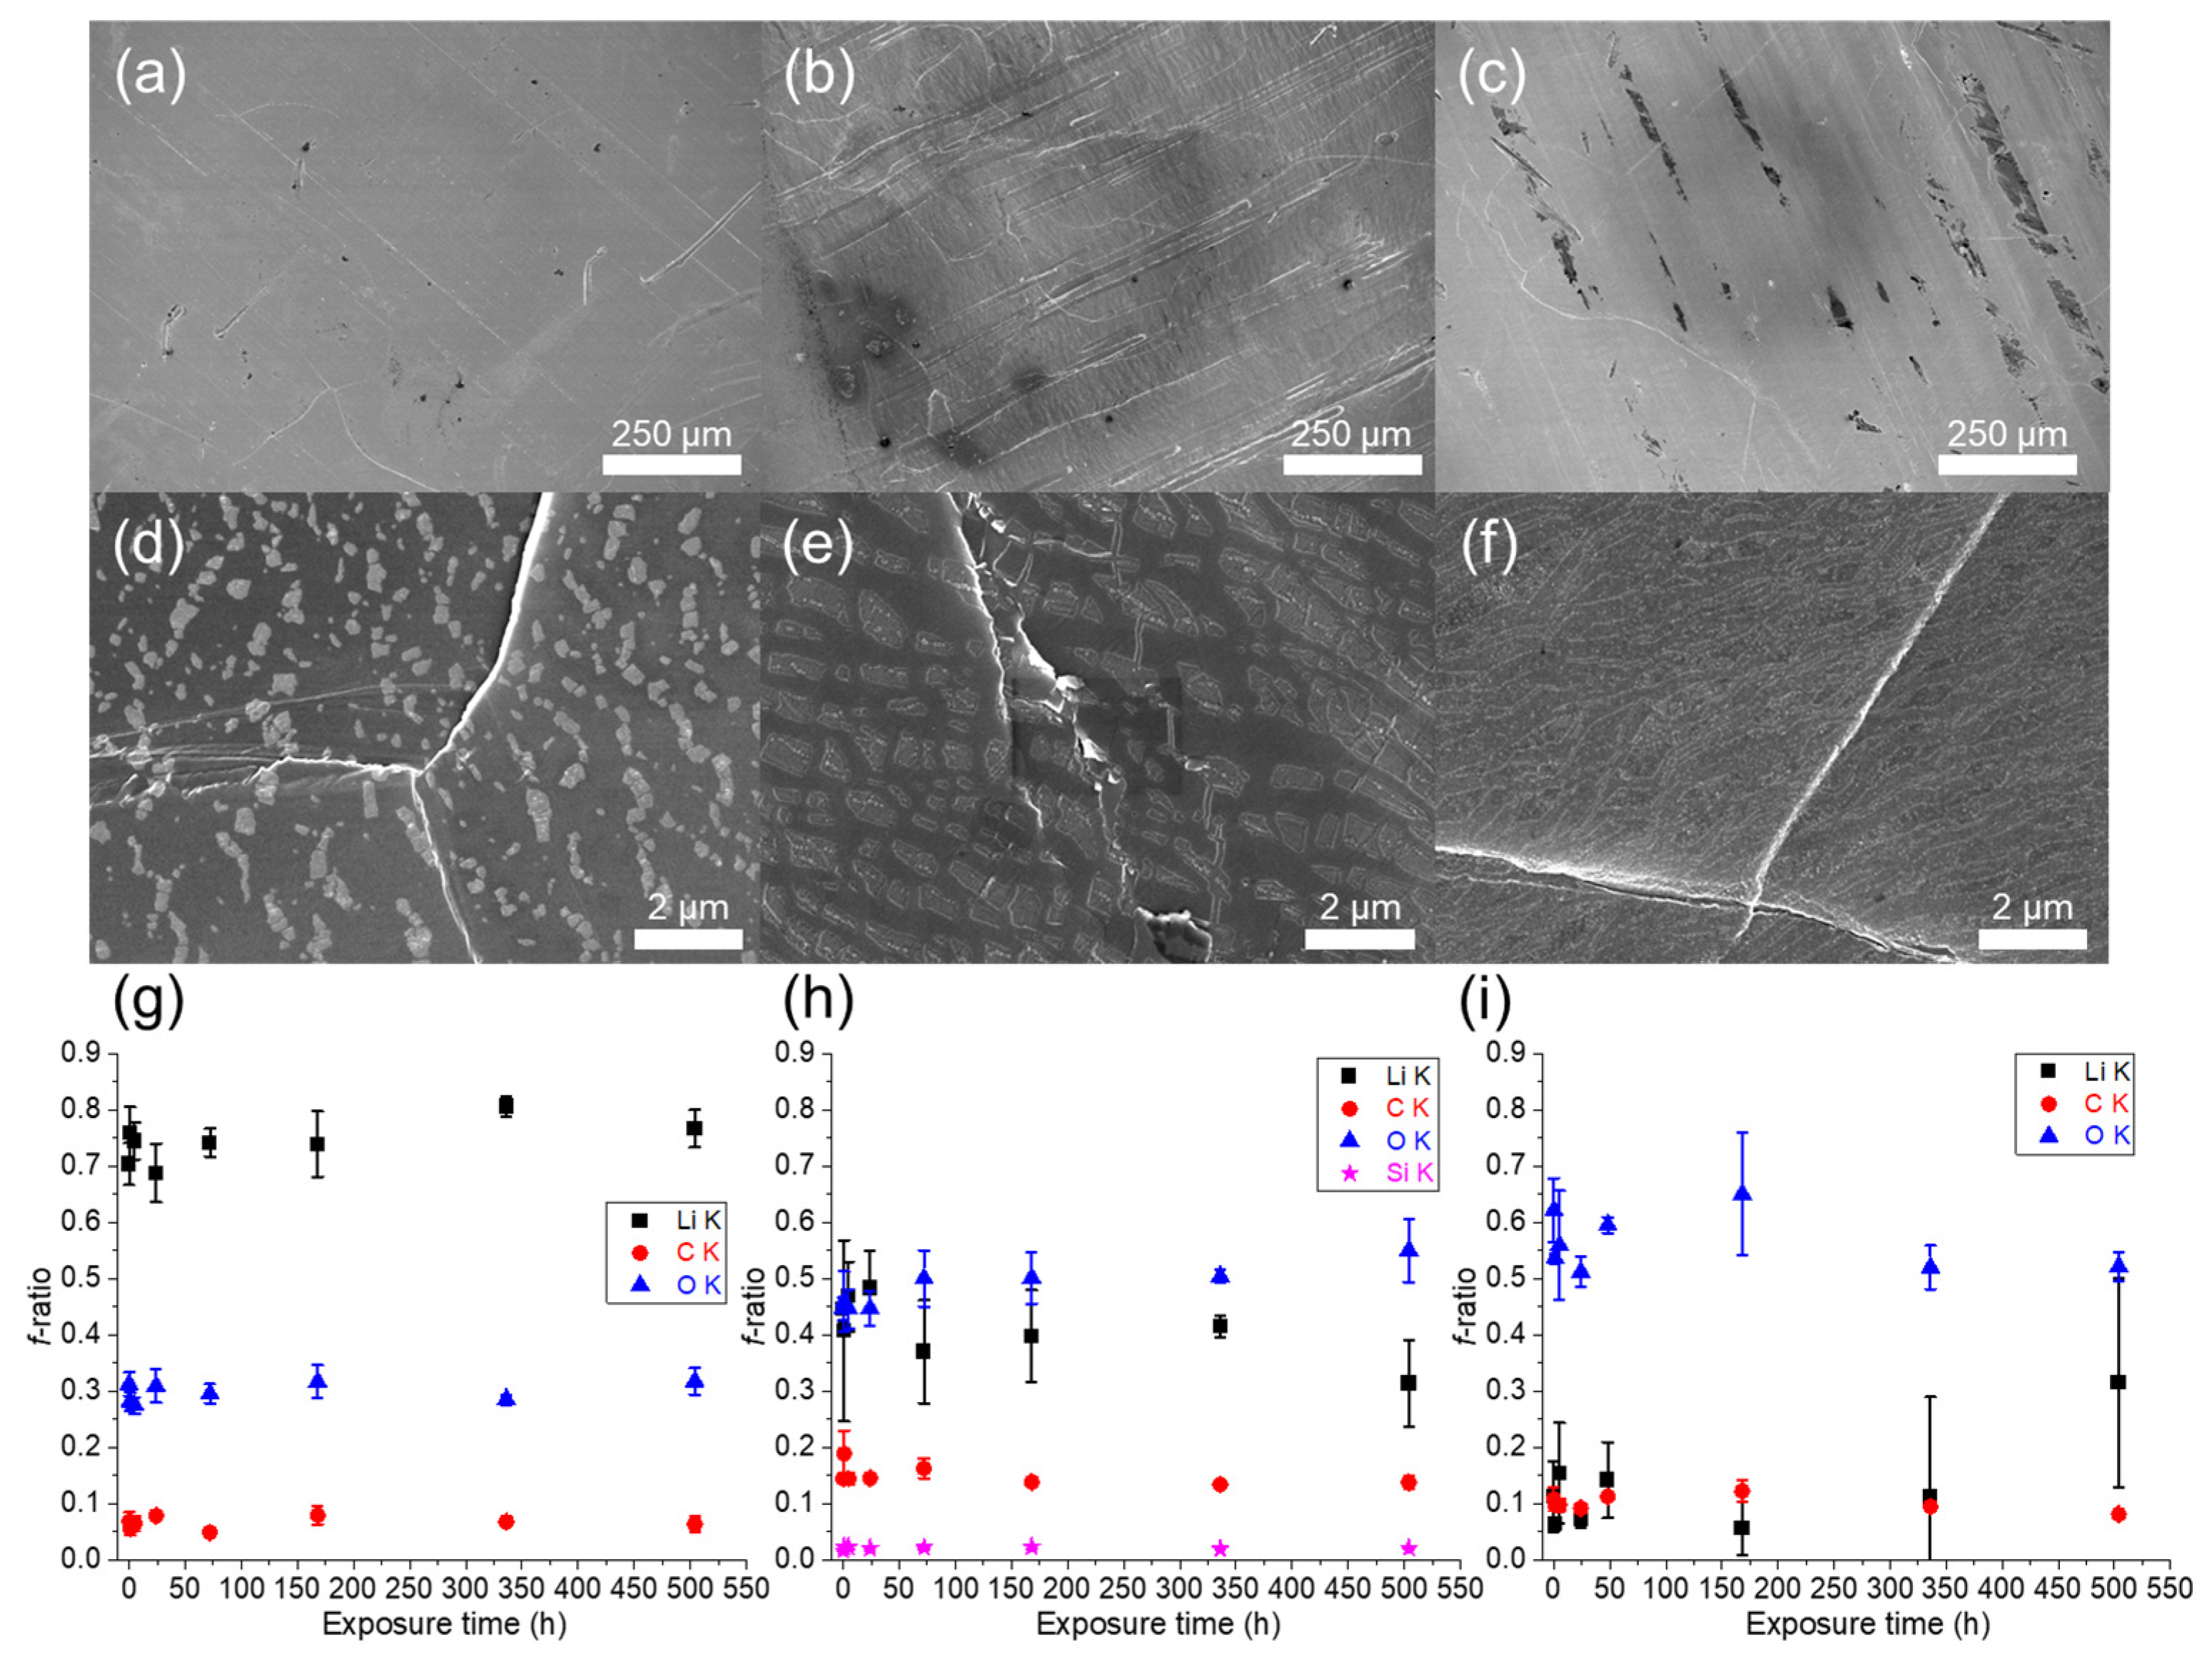
- Physical characterizations revealed the better surface quality of the in-house Li.
- The cells performance is related to the quality and uniformity of the Li surface.
2. Experimental Section
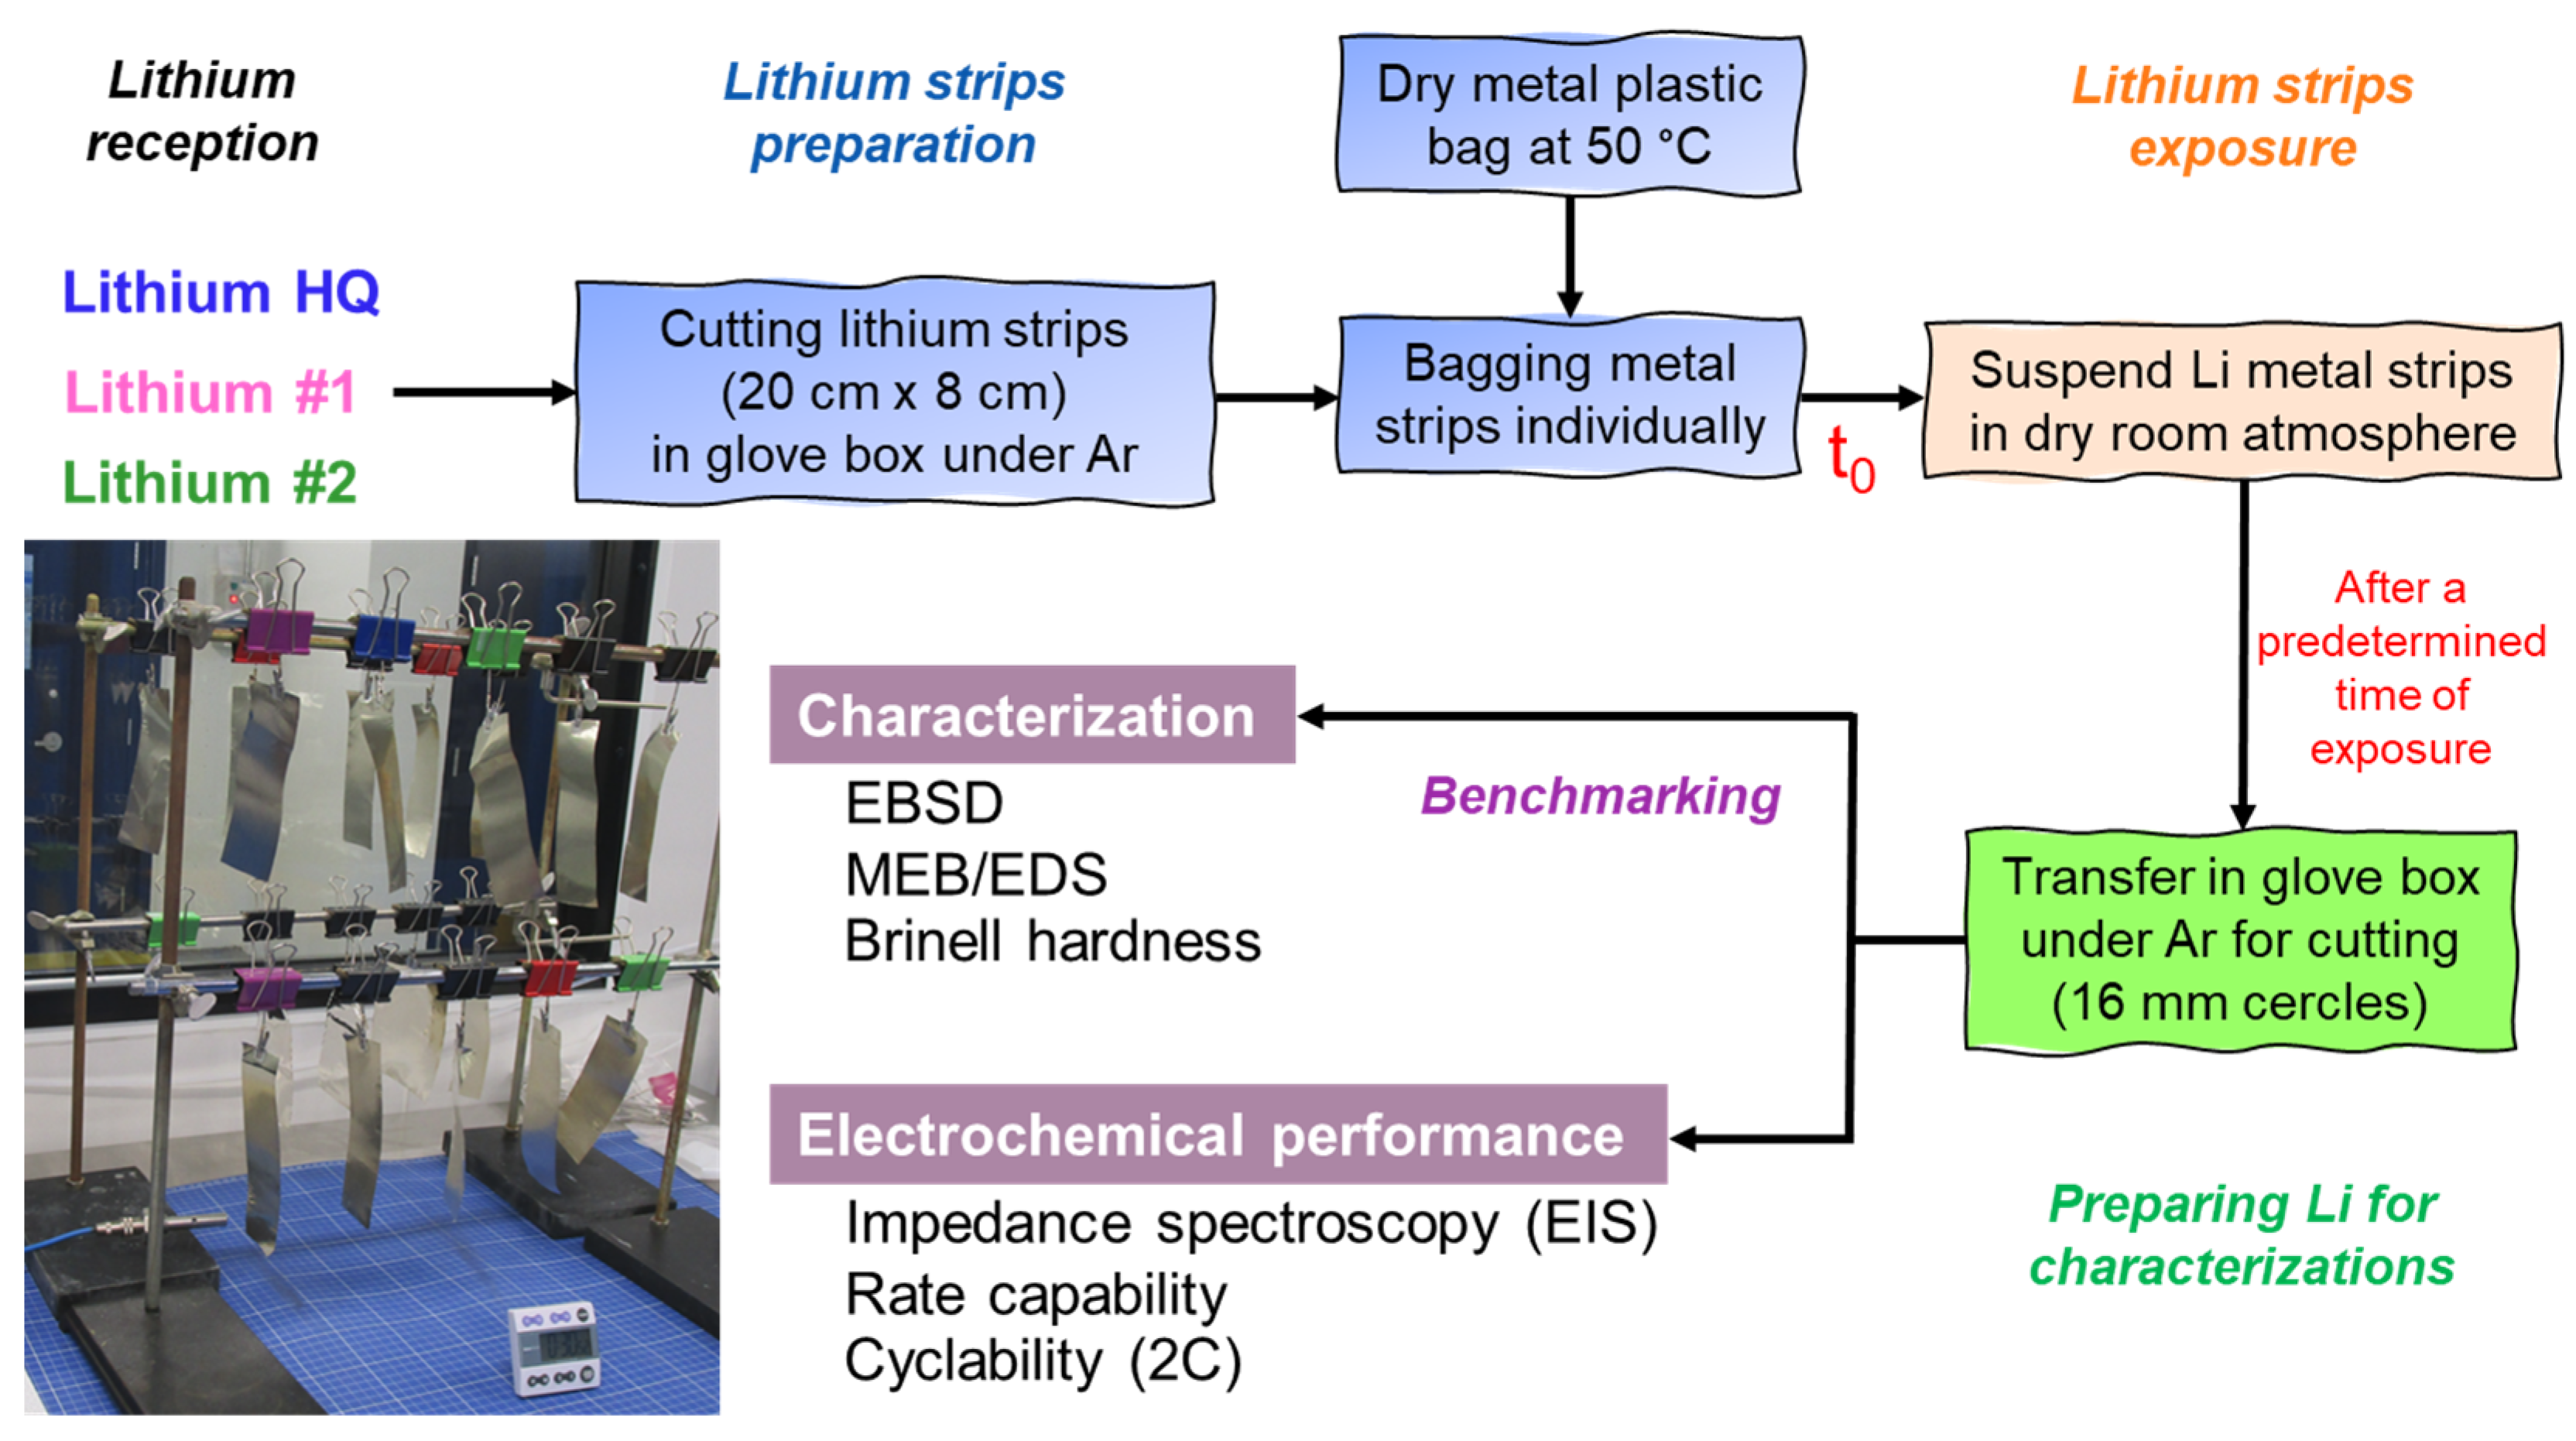
2.1. Method Proposed for Benchmarking Li Metal Anodes
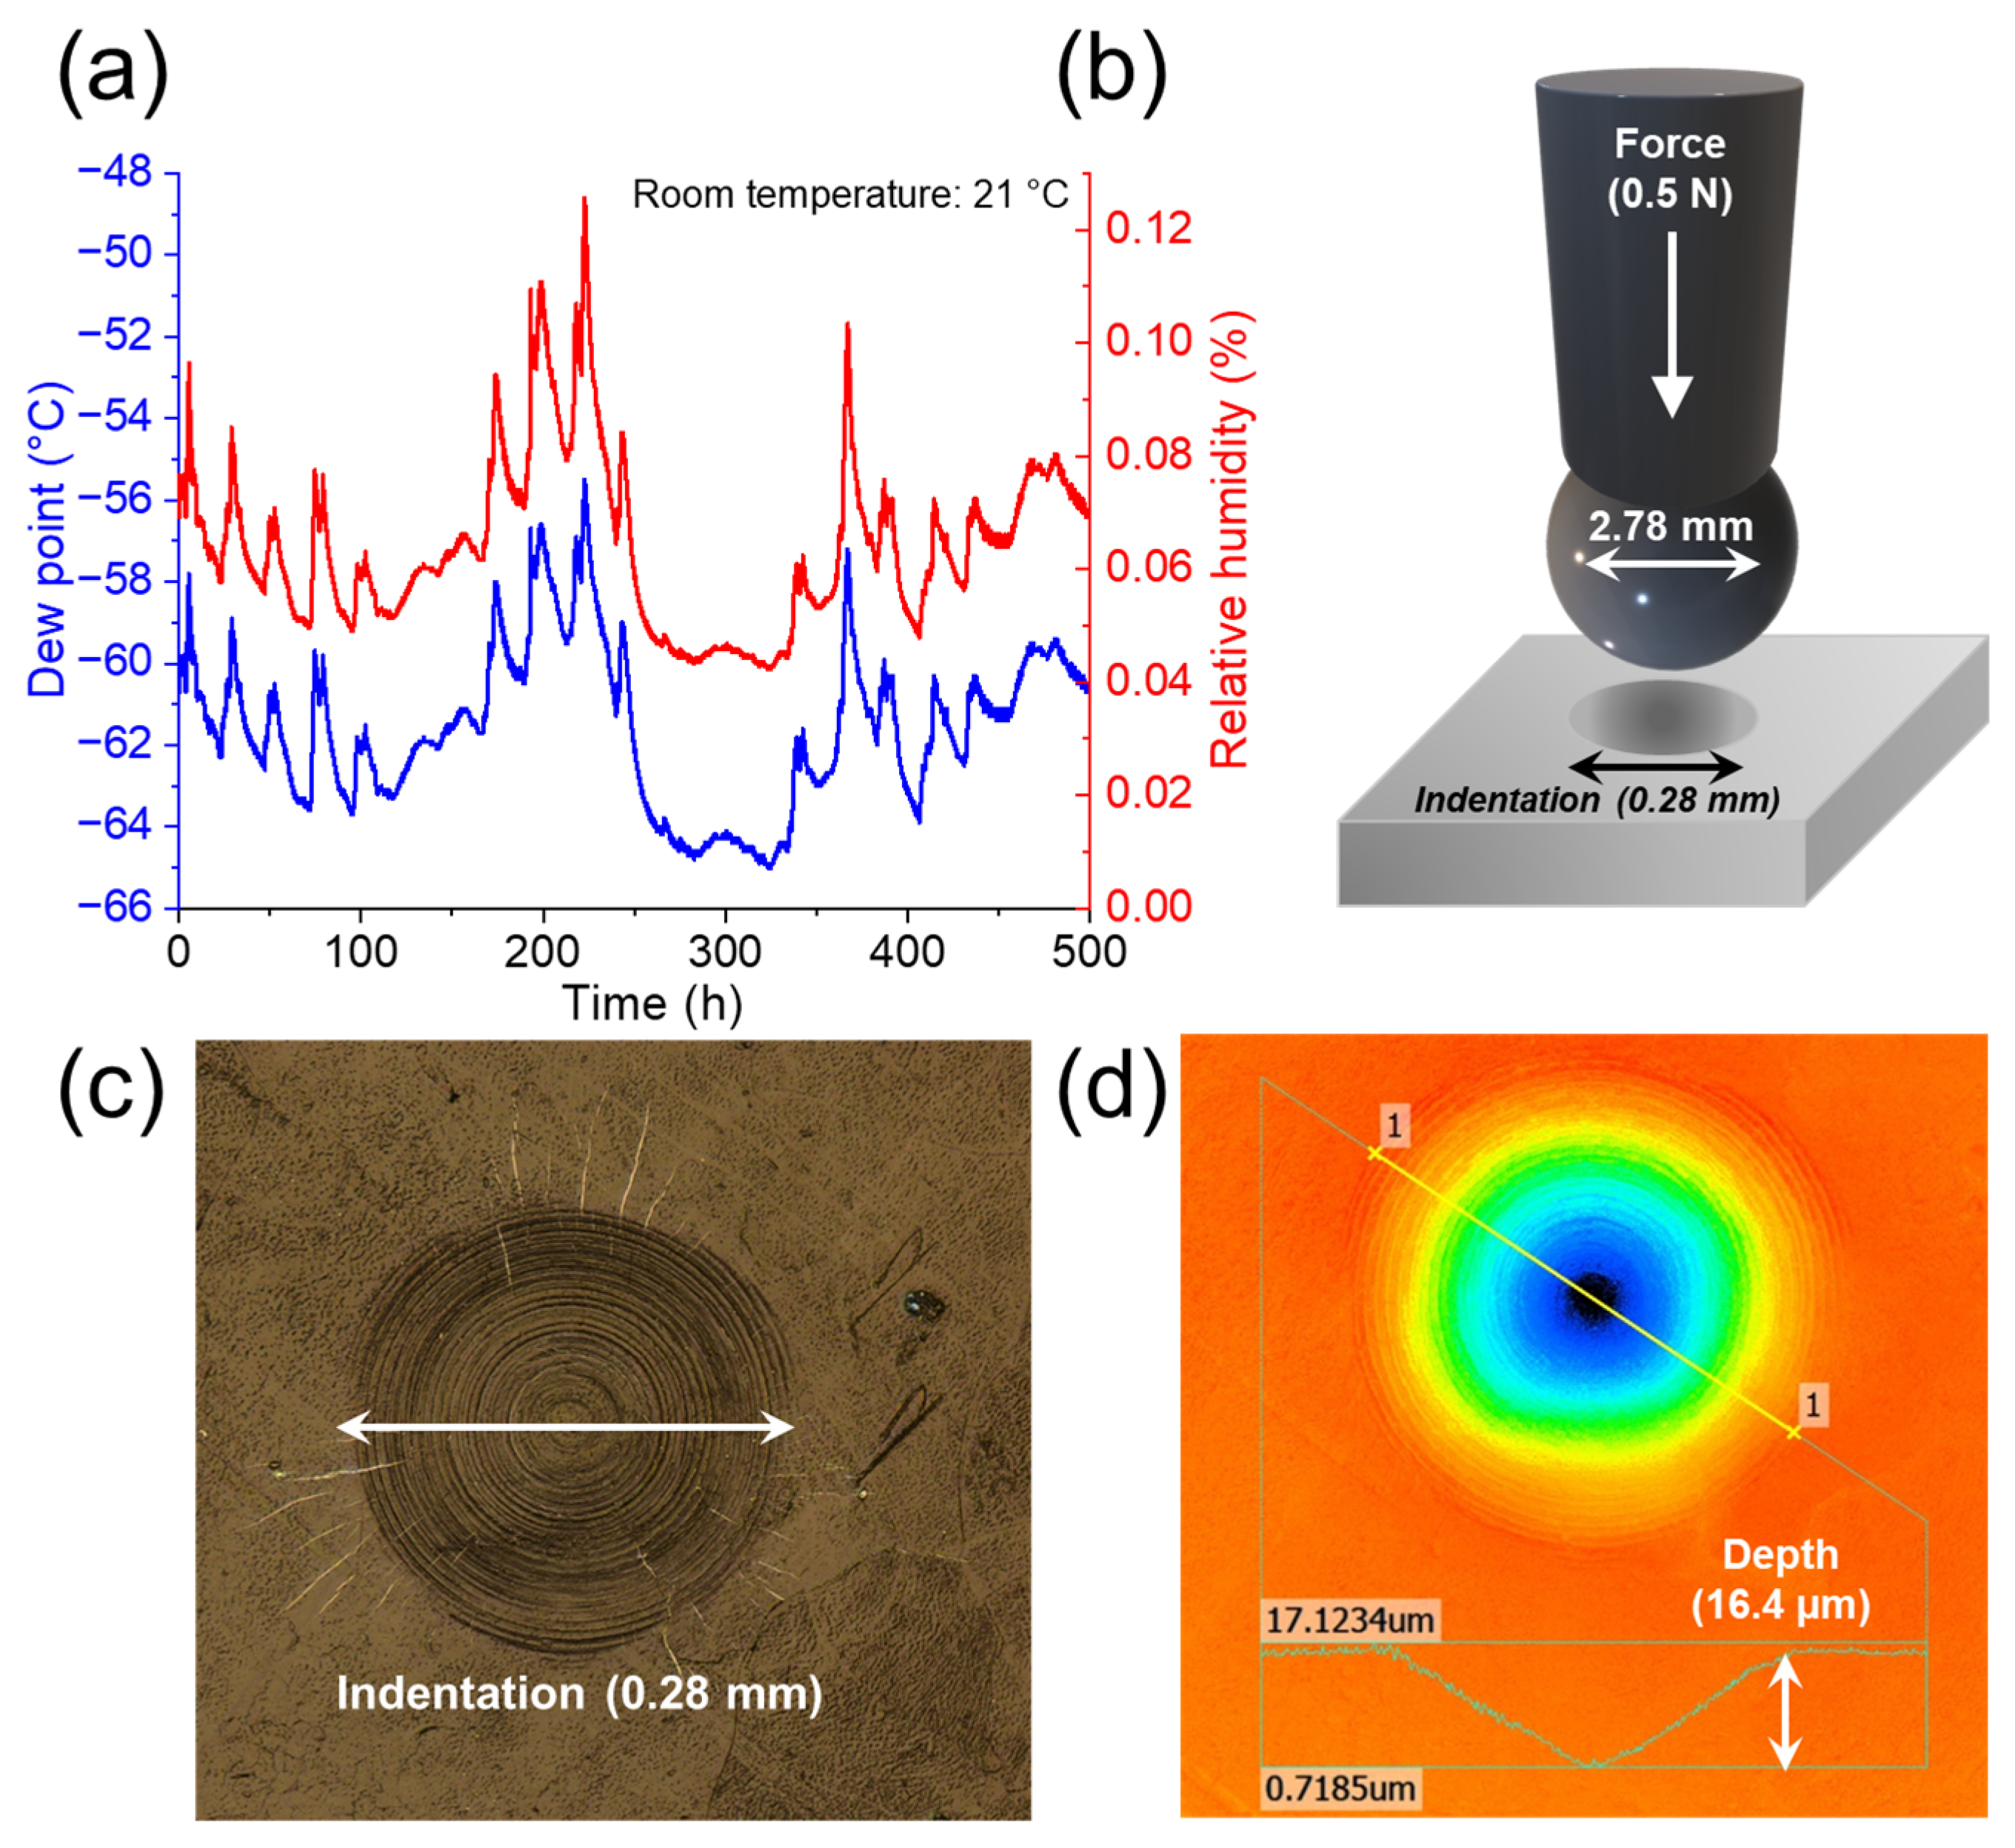
2.2. Characterizations
2.3. Assembly of Coin Cells and Electrochemical Characterization
3. Results and Discussion
3.1. Physical Characterizations of Li Foils
3.2. Electrochemical Results and Cell Performance Comparison of Li Foils
3.2.1. Electrochemical Impedance Spectroscopy
3.2.2. Rate Capability
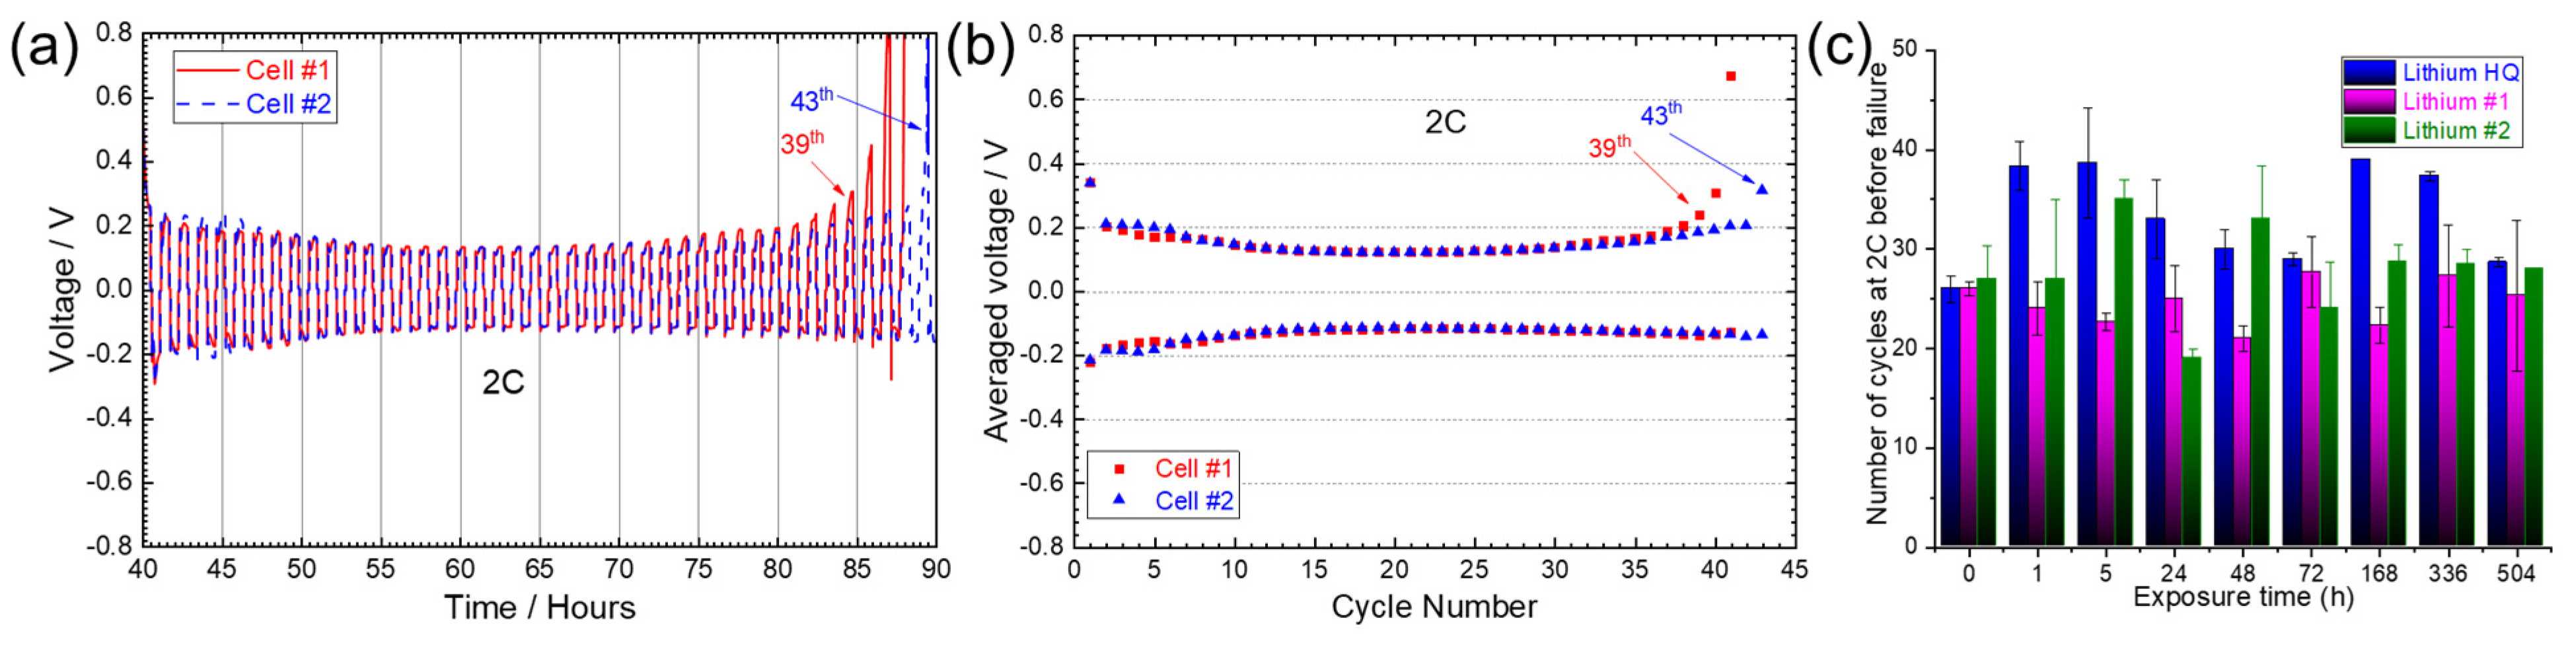
3.2.3. Long-Term Cycling
4. Perspectives
5. Conclusions
Supplementary Materials
Author Contributions
Funding
Data Availability Statement
Acknowledgments
Conflicts of Interest
References
- Stéphanie, B.; Fernandez, P.A.; Christophe, M.; Uwe, R.; Brent, W.; Laszlo, V.; Davide, D.A.; Thomas, S. Net Zero by 2050. A Roadmap for the Global Energy Sector; International Energy Agency: Paris, France, 2021; Available online: http://iea.li/nzeroadmap (accessed on 6 May 2023).
- Doughty, D.H.; Roth, E.P. A General Discussion of Li Ion Battery Safety. Electrochem. Soc. Interface 2012, 21, 37–44. [Google Scholar] [CrossRef] [Green Version]
- Sun, Y.-K. Promising All-Solid-State Batteries for Future Electric Vehicles. ACS Energy Lett. 2020, 5, 3221–3223. [Google Scholar] [CrossRef]
- Rosso, M.; Brissot, C.; Teyssot, A.; Dollé, M.; Sannier, L.; Tarascon, J.-M.; Bouchet, R.; Lascaud, S. Dendrite Short-Circuit and Fuse Effect on Li/Polymer/Li Cells. Electrochim. Acta 2006, 51, 5334–5340. [Google Scholar] [CrossRef]
- Zhang, Y.; Zuo, T.-T.; Popovic, J.; Lim, K.; Yin, Y.-X.; Maier, J.; Guo, Y.-G. Towards Better Li Metal Anodes: Challenges and Strategies. Mater. Today 2020, 33, 56–74. [Google Scholar] [CrossRef]
- Otto, S.K.; Fuchs, T.; Moryson, Y.; Lerch, C.; Mogwitz, B.; Sann, J.; Janek, J.; Henss, A. Storage of Lithium Metal: The Role of the Native Passivation Layer for the Anode Interface Resistance in Solid State Batteries. ACS Appl. Energy Mater. 2021, 4, 12798–12807. [Google Scholar] [CrossRef]
- Porthault, H.; Decaux, C. Electrodeposition of Lithium Metal Thin Films and Its Application in All-Solid-State Microbatteries. Electrochim. Acta 2016, 194, 330–337. [Google Scholar] [CrossRef]
- Vanleeuw, D.; Sapundjiev, D.; Sibbens, G.; Oberstedt, S.; Salvador Castiñeira, P. Physical Vapour Deposition of Metallic Lithium. J. Radioanal. Nucl. Chem. 2014, 299, 113–1120. [Google Scholar] [CrossRef]
- Hovsepian, B. Rolling of Lithium. U.S. Patent 3721113A, 20 March 1973. [Google Scholar]
- Somekawa, H.; Nishikawa, K.; Moronaga, T.; Ohmura, T. Fabrication of Li Anode Metal via Bulk Mechanical Property Analysis. J. Power Source 2023, 569, 233019. [Google Scholar] [CrossRef]
- Saager, S.; Decker, L.; Kopte, T.; Scheffel, B.; Zimmermann, B. High-Performance Anodes Made of Metallic Lithium Layers and Lithiated Silicon Layers Prepared by Vacuum Technologies. Batteries 2023, 9, 75. [Google Scholar] [CrossRef]
- Aspinall, J.; Armstrong, D.E.J.; Pasta, M. EBSD-Coupled Indentation: Nanoscale Mechanics of Lithium Metal. Mater. Today Energy 2022, 30, 101183. [Google Scholar] [CrossRef]
- Niu, C.; Liu, D.; Lochala, J.A.; Anderson, C.S.; Cao, X.; Gross, M.E.; Xu, W.; Zhang, J.-G.; Whittingham, M.S.; Xiao, J.; et al. Balancing Interfacial Reactions to Achieve Long Cycle Life in High-Energy Lithium Metal Batteries. Nat. Energy 2021, 6, 723–732. [Google Scholar] [CrossRef]
- Hovington, P.; Timoshevskii, V.; Burgess, S.; Demers, H.; Statham, P.; Gauvin, R.; Zaghib, K. Can We Detect Li K X-ray in Lithium Compounds Using Energy Dispersive Spectroscopy? Scanning 2016, 38, 571–578. [Google Scholar] [CrossRef] [Green Version]
- Brodusch, N.; Demers, H.; Gauvin, R. Developments in Field Emission Gun Technologies and Advanced Detection Systems. In Field Emission Scanning Electron Microscopy; SpringerBriefs in Applied Sciences and Technology; Springer: Berlin, Germany, 2018. [Google Scholar]
- Jiang, Q.; Lu, D.; Liu, C.; Liu, N.; Hou, B. The Pilling-Bedworth Ratio of Oxides Formed From the Precipitated Phases in Magnesium Alloys. Front. Mater. 2021, 8, 761052. [Google Scholar] [CrossRef]
- Song, B.M.; Park, H.E.; Yoon, W.Y. Surface Control of Lithium Powder by Use of a DET. J. Korean Phys. Soc. 2009, 54, 1136–1140. [Google Scholar] [CrossRef]
- Zeng, R.-C.; Sun, L.; Zheng, Y.-F.; Cui, H.-Z.; Han, E.-H. Corrosion and Characterisation of Dual Phase Mg–Li–Ca Alloy in Hank’s Solution: The Influence of Microstructural Features. Corros. Sci. 2014, 79, 69–82. [Google Scholar] [CrossRef]
- Teng, C.; Gauvin, R. The F-Ratio Model for Quantitative X-Ray Microanalysis. Talanta 2021, 235, 122765. [Google Scholar] [CrossRef]
- Zhuang, G.; Chen, Y.; Ross, P.N., Jr. The Reaction of Lithium with Carbon Dioxide Studied by Photoelectron Spectroscopy. Surf. Sci. 1998, 418, 139–149. [Google Scholar] [CrossRef]
- Carneiro, I.; Simões, S. Recent Advances in EBSD Characterization of Metals. Metals 2020, 10, 1097. [Google Scholar] [CrossRef]
- Mehdi, B.L.; Stevens, A.; Qian, J.; Park, C.; Xu, W.; Henderson, W.A.; Zhang, J.-G.; Mueller, K.T.; Browning, N.D. The Impact of Li Grain Size on Coulombic Efficiency in Li Batteries. Sci. Rep. 2016, 6, 34267. [Google Scholar] [CrossRef] [Green Version]
- Shubha, N.; Prasanth, R.; Hoon, H.H.; Srinivasan, M. Plastic Crystalline-Semi Crystalline Polymer Composite Electrolyte Based on Non-Woven Poly(Vinylidenefluoride-Co-Hexafluoropropylene) Porous Membranes for Lithium Ion Batteries. Electrochim. Acta 2014, 125, 362–370. [Google Scholar] [CrossRef]
- Nie, M.; Demeaux, J.; Young, B.T.; Heskett, D.R.; Chen, Y.; Bose, A.; Woicik, J.C.; Lucht, B.L. Effect of Vinylene Carbonate and Fluoroethylene Carbonate on SEI Formation on Graphitic Anodes in Li-Ion Batteries. J. Electrochem. Soc. 2015, 162, A7008–A7014. [Google Scholar] [CrossRef] [Green Version]
- Wellmann, J.; Brinkmann, J.-P.; Wankmiller, B.; Neuhaus, K.; Rodehorst, U.; Hansen, M.R.; Winter, M.; Paillard, E. Effective Solid Electrolyte Interphase Formation on Lithium Metal Anodes by Mechanochemical Modification. ACS Appl. Mater. Interfaces 2021, 13, 34227–34237. [Google Scholar] [CrossRef] [PubMed]
- Chen, K.-H.; Wood, K.N.; Kazyak, E.; LePage, W.S.; Davis, A.L.; Sanchez, A.J.; Dasgupta, N.P. Dead Lithium: Mass Transport Effects on Voltage, Capacity, and Failure of Lithium Metal Anodes. J. Mater. Chem. A 2017, 5, 11671–11681. [Google Scholar] [CrossRef]
- Yang, M.; Jue, N.; Chen, Y.; Wang, Y. Improving Cyclability of Lithium Metal Anode via Constructing Atomic Interlamellar Ion Channel for Lithium Sulfur Battery. Nanoscale Res. Lett. 2021, 16, 52. [Google Scholar] [CrossRef]
- Dai, H.; Gu, X.; Dong, J.; Wang, C.; Lai, C.; Sun, S. Stabilizing Lithium Metal Anode by Octaphenyl Polyoxyethylene-Lithium Complexation. Nat. Commun. 2020, 11, 643. [Google Scholar] [CrossRef] [PubMed] [Green Version]
- Zou, P.; Wang, Y.; Chiang, S.-W.; Wang, X.; Kang, F.; Yang, C. Directing Lateral Growth of Lithium Dendrites in Micro-Compartmented Anode Arrays for Safe Lithium Metal Batteries. Nat. Commun. 2018, 9, 464. [Google Scholar] [CrossRef] [Green Version]
- Han, X.; Gong, Y.; Fu, K.; He, X.; Hitz, G.T.; Dai, J.; Pearse, A.; Liu, B.; Wang, H.; Rubloff, G.; et al. Negating Interfacial Impedance in Garnet-Based Solid-State Li Metal Batteries. Nat. Mater. 2017, 16, 572–579. [Google Scholar] [CrossRef]
- Luo, W.; Gong, Y.; Zhu, Y.; Li, Y.; Yao, Y.; Zhang, Y.; Fu, K.; Pastel, G.; Lin, C.-F.; Mo, Y.; et al. Reducing Interfacial Resistance between Garnet-Structured Solid-State Electrolyte and Li-Metal Anode by a Germanium Layer. Adv. Mater. 2017, 29, 1606042. [Google Scholar] [CrossRef]
- Delaporte, N.; Guerfi, A.; Demers, H.; Lorrmann, H.; Paolella, A.; Zaghib, K. Facile Protection of Lithium Metal for All-Solid-State Batteries. ChemistryOpen 2019, 8, 192–195. [Google Scholar] [CrossRef] [Green Version]
- Huang, C.-J.; Hsu, Y.-C.; Shitaw, K.N.; Siao, Y.-J.; Wu, S.-H.; Wang, C.-H.; Su, W.-N.; Hwang, B.J. Lithium Oxalate as a Lifespan Extender for Anode-Free Lithium Metal Batteries. ACS Appl. Mater. Interfaces 2022, 14, 26724–26732. [Google Scholar] [CrossRef]


| Electrochemical Results | Characterizations | ||||||
|---|---|---|---|---|---|---|---|
| Rate Capability | 2 C Stability | Total Resistance (Ω) | Brinell Hardness (MPa) | Surface Roughness | Surface Aspect | Surface Composition | |
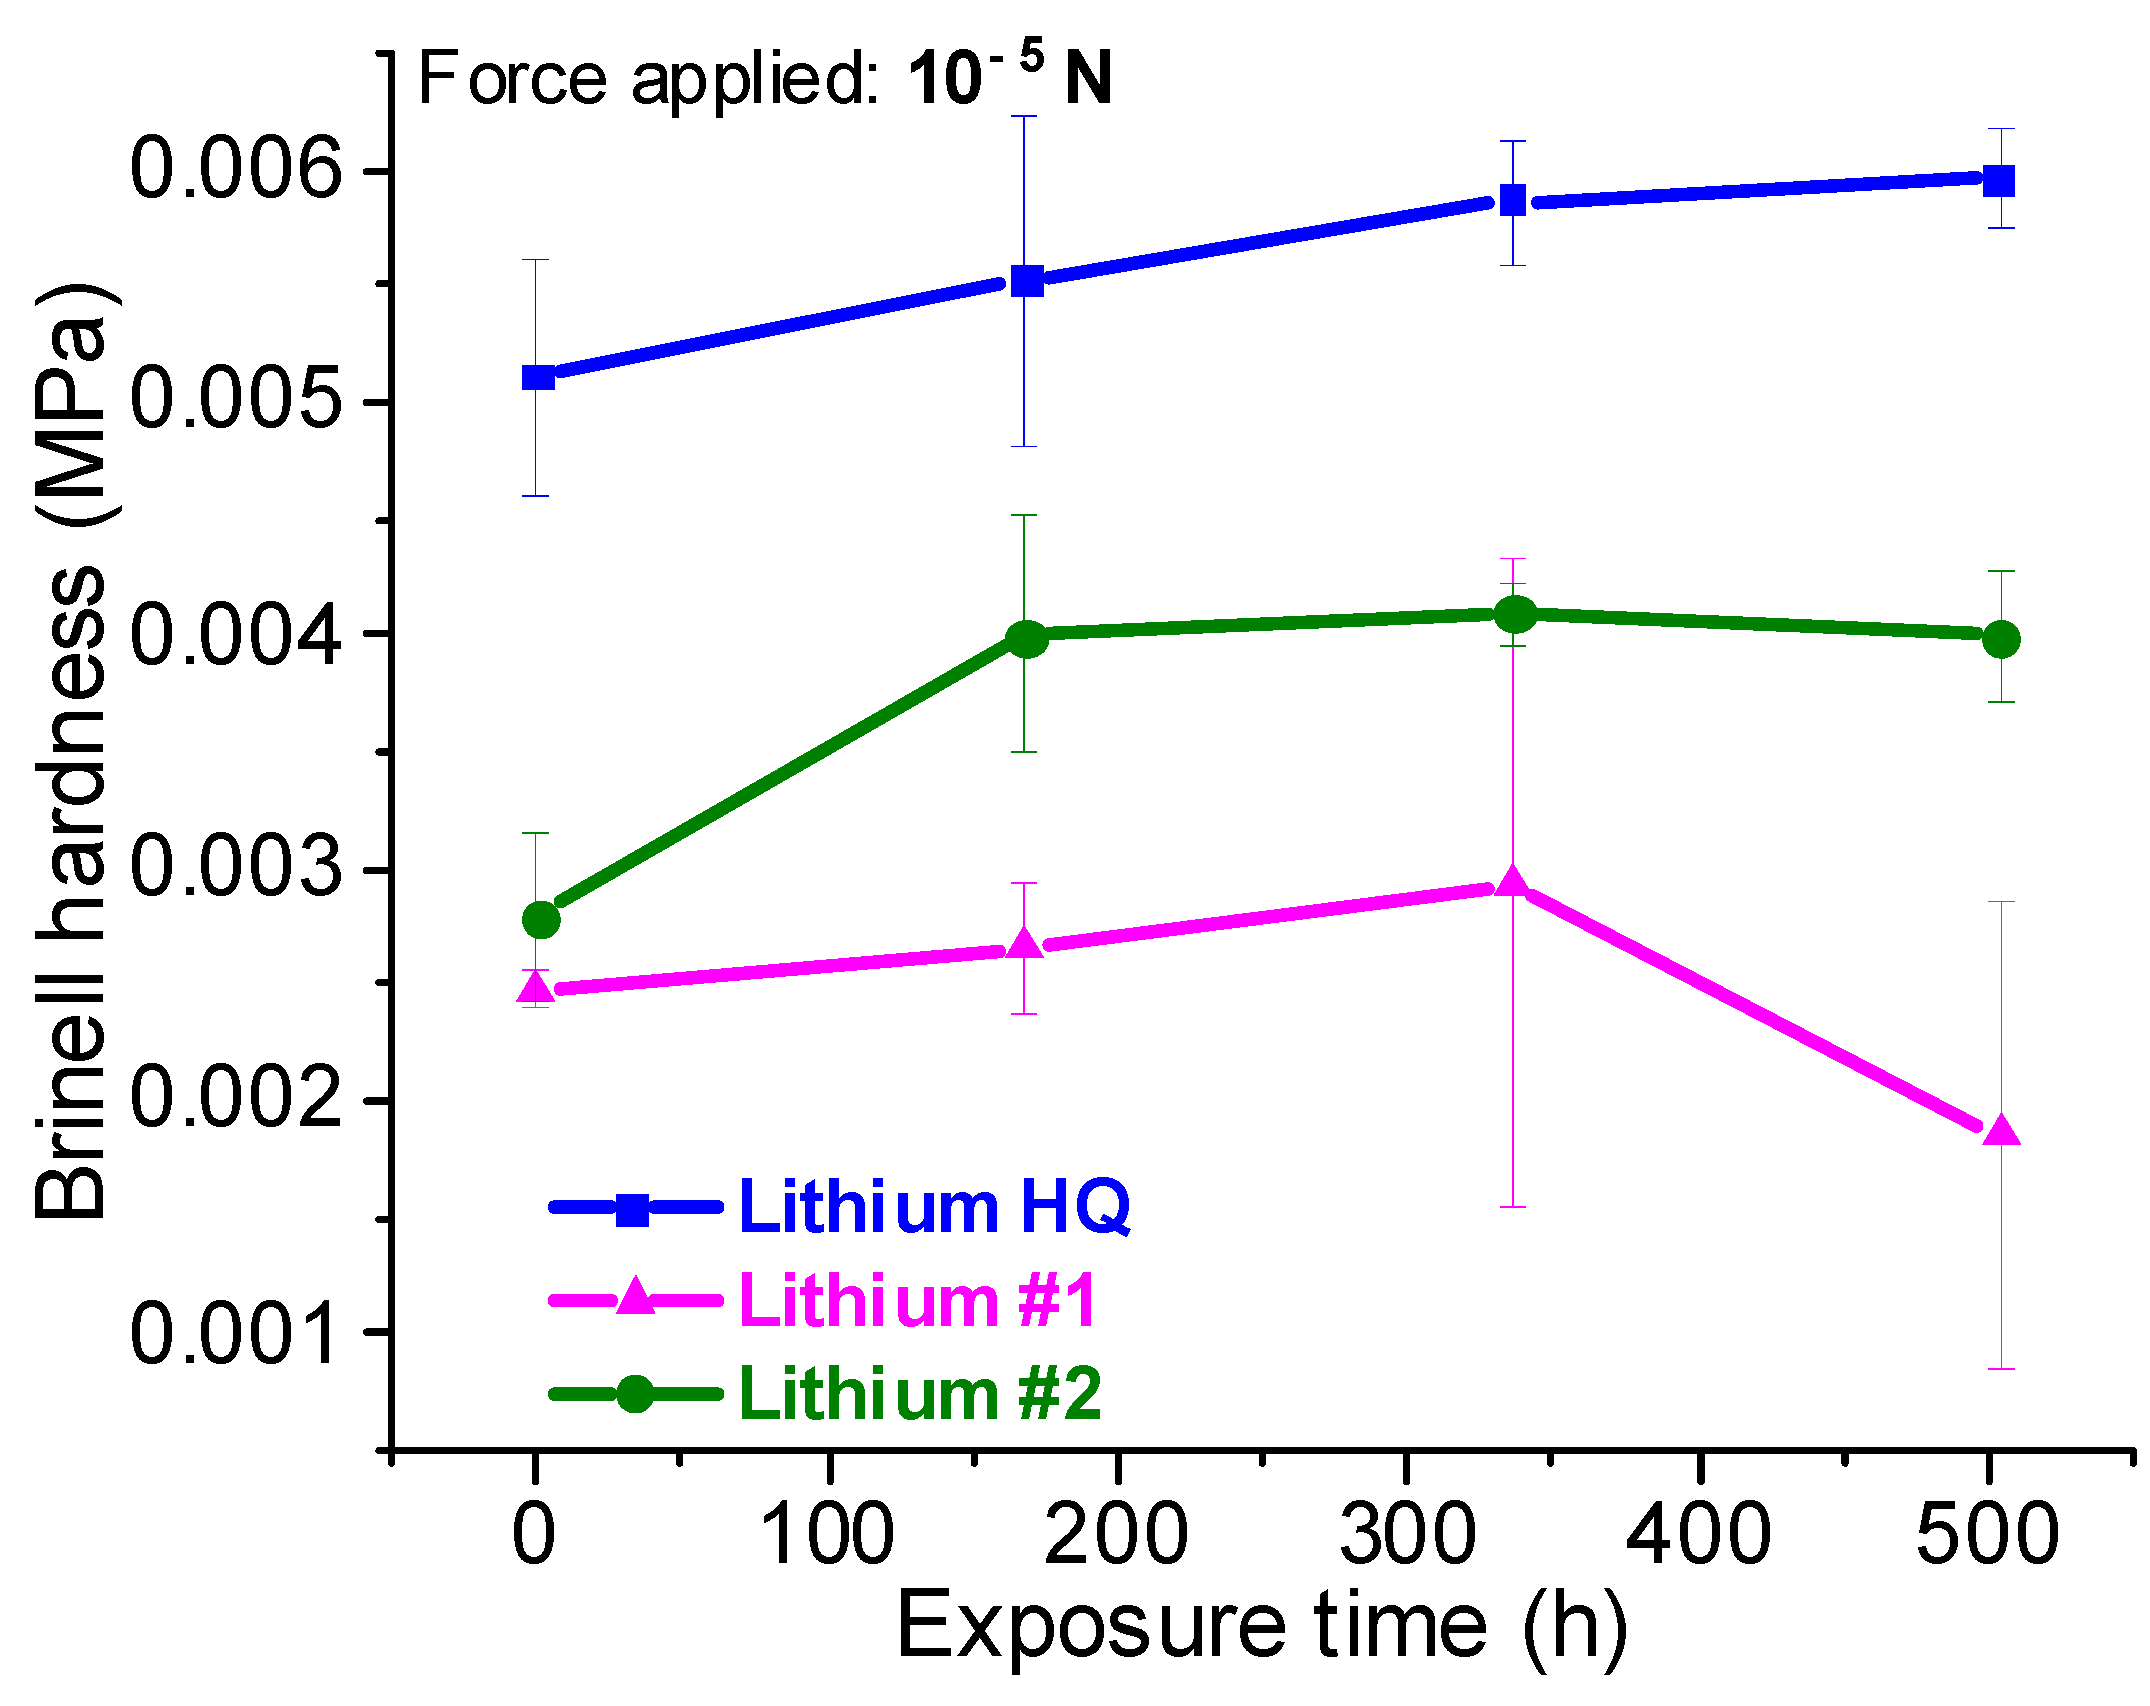
| Lithium HQ | 10 C | 45 (34) | 680–1200 | 5.5 × 10⁻³ | ±1.5 µm | Smooth surface, well-defined Li grain boundaries | Homogeneous, mainly composed of Li, small quantity of oxygen |
| Lithium #1 | 1 C | 32 (25) | 1020–1500 | 2.5 × 10⁻³ | ±5.5 µm | Accidented and brittle surface, no Li grains visible | Inhomogeneous, high concentration of oxygen and carbon, silicon as an impurity, unknown contaminants |
| Lithium #2 | 5 C | 38 (28) | 1430–3530 | 3.7 × 10⁻³ | ±4.5 µm | Large furrows and lamination marks, fractures, Li grains hardly visible | Inhomogeneous, high concentration of oxygen, unknown contaminants |
Disclaimer/Publisher’s Note: The statements, opinions and data contained in all publications are solely those of the individual author(s) and contributor(s) and not of MDPI and/or the editor(s). MDPI and/or the editor(s) disclaim responsibility for any injury to people or property resulting from any ideas, methods, instructions or products referred to in the content. |
© 2023 by the authors. Licensee MDPI, Basel, Switzerland. This article is an open access article distributed under the terms and conditions of the Creative Commons Attribution (CC BY) license (https://creativecommons.org/licenses/by/4.0/).
Share and Cite
Delaporte, N.; Perea, A.; Léonard, M.; Matton, J.; Demers, H.; Collin-Martin, S.; Rozon, D.; Clément, D.; Guerfi, A.; Kim, C. Method for Benchmarking Li Metal Anodes: A Mandatory Step toward Reliable Lithium Metal Batteries. Batteries 2023, 9, 368. https://doi.org/10.3390/batteries9070368
Delaporte N, Perea A, Léonard M, Matton J, Demers H, Collin-Martin S, Rozon D, Clément D, Guerfi A, Kim C. Method for Benchmarking Li Metal Anodes: A Mandatory Step toward Reliable Lithium Metal Batteries. Batteries. 2023; 9(7):368. https://doi.org/10.3390/batteries9070368
Chicago/Turabian StyleDelaporte, Nicolas, Alexis Perea, Mireille Léonard, Julie Matton, Hendrix Demers, Steve Collin-Martin, David Rozon, Daniel Clément, Abdelbast Guerfi, and Chisu Kim. 2023. "Method for Benchmarking Li Metal Anodes: A Mandatory Step toward Reliable Lithium Metal Batteries" Batteries 9, no. 7: 368. https://doi.org/10.3390/batteries9070368