Article

Photothermal-Conversion-Enhanced LiMn2O4 Pouch Cell Performance for Low-Temperature Resistance: A Theoretical Study

1
Key Laboratory of Materials Design and Quantum Simulation, College of Science, Changchun University, Changchun 130022, China
2
Key Laboratory of Advanced Structural Materials, Ministry of Education & Advanced Institute of Materials Science, Changchun University of Technology, Changchun 130012, China
3
State Key Laboratory of Luminescence and Applications, Changchun Institute of Optics, Fine Mechanics and Physics, Chinese Academy of Sciences, Changchun 130033, China
*
Authors to whom correspondence should be addressed.
Batteries 2023, 9(7), 366; https://doi.org/10.3390/batteries9070366
Submission received: 12 May 2023 / Revised: 23 June 2023 / Accepted: 27 June 2023 / Published: 8 July 2023

Abstract

:
Lithium-ion batteries (LIBs) suffer from charging difficulties, capacity decay, and severe ageing in a low-temperature environment. In this work, we suggest a theoretical study and strategy for improving the low-temperature resistance of LiMn2O4(LMO) pouch cells, by introducing a photothermal conversion layer composed of copper and single-walled carbon nanotubes. A three-dimensional electrochemical–thermal coupling model for a lithium manganate battery is established, in which the photothermal conversion layer is attached on the surface of the cathode collector, and the effect of lug design is also discussed. The changes in the battery temperature field, and improvements in electrochemical performance before and after light preheating, are analyzed. The results show that, when the photothermal conversion film is applied, the LMO pouch cell’s temperature rises 2.7 °C/min in a −5 °C environment, and the surface-temperature averaging is improved. The concentration of lithium embedded in the anode is significantly increased, and the charging speed is enhanced by 20%. The batteries with a single-sided lug design exhibit better performance compared with those with a two-sided lug design. Validation of the presented model is performed, by comparing it with the experimental Panasonic UF653445ST commercial battery datasheet. This work provides theoretical guidance on improving the low-temperature performance of pouch cells, based on the photothermal conversion method.

Graphical Abstract

1. Introduction

In recent years, pure electric vehicles (PEVs) and plug-in hybrids vehicles (PHVs) have been occupying a growing market share [1]. As a representative of clean energy, lithium-ion batteries (LIBs) have become the leading choice for electric vehicles (EVs). The popularity of electric vehicles has increased the requirements for LIBs to a greater mileage per charge, faster charging, and greater low-temperature stability. Specifically, low-temperature resistance is the primary limitation for EVs in cold regions, which suffer from charging difficulties, energy and power loss, lifetime decay, and increased safety hazards [2]. The electrolyte viscosity and the internal resistance increase at a lower temperature, and the ionic conductivity of the electrolyte decreases [3], which affects battery performance.
Due to the long-term characteristics, and difficulty, of studying low-temperature electrolyte and electrode materials, researchers have adopted preheating methods for low-temperature LIBs, including internal self-heating and external heating. Ji et al. [4] compared the three preheating schemes of pulse charging, internal self-discharge, and external heating, with different charging and discharging methods, by establishing an electrochemical–thermal model. They found a high-pulse-current charging safety, with an improved temperature. Shang et al. [5] improved the speed and efficiency of LIB preheating, by varying the AC frequency through a high-frequency preheating model, based on ohmic resistance heating and lithium-ion transfer. Zhang et al. [5] embedded nickel foil as a heating element in different positions inside the LIBs, to heat the battery to 0 °C within 19.5 and 29.6 s, at temperatures of −20 °C and −30 °C, respectively. However, preheating methods have problems such as uneven heating, complex heating circuit design, and slow heating speeds.
Preheating utilizes the photo-thermal conversion (PTE) ability and high thermal conductivity of carbon nanotubes to heat across their thickness, by controlling the external radiation intensity, and optimizing the lug design. This work proposes a low-temperature radiation per-heating strategy that attaches a single-walled carbon nanotube film (SWCNT) to the pouch cell’s surface, to address the problem of low-temperature preheating, and to improve the low-temperature resistance of LMO (LiMn2O4) pouch cells. Existing photothermal conversion materials have been widely used in electrodeless materials (precious metals and semiconductors) and organic materials (carbon-based materials, dyes and conjugated polymers) [6]. Carbon nanotube materials have high stiffness, high strength and elasticity, high electrical and thermal conductivities, high visible light transparency [7], good near-infrared light absorption and conversion to heat, and other advantages. These materials are widely used in heaters [6], biomedicine, photocatalysis, and other fields [8,9,10,11,12], in addition to the energy field (supercapacitors, LIBs [13], solar photovoltaic equipment).
Yang et al. [14] simulated the heat conduction and temperature change of single carbon nanotubes, nanotube arrays, and nanomatrix composites using the finite element method (FEM) with three-dimensional anisotropic heat transfer. Jin et al. [15] prepared PTE thin-film carbon nanotubes with a pseudobilayer structure on substrates, to generate a temperature difference of 25.68 °C without external cooling. This generated an open-circuit voltage of 1.5 mV under infrared light illumination (83.12 mW/cm2). Yu et al. [16] added silver nanowires to carboxytrimamine sponges (AgNWs @CMF), as a photothermal conversion material. The materials covered the surface of the flexible supercapacitors, and increased the specific capacity by factors of 3.48 and 6.69, at −20 °C and −50 °C, respectively. However, these works have not combined the photothermal conversion films with LIBs for preheating, meaning that it is necessary to explore new ways to integrate this photothermal effect.
Due to the large span of LIB research, it is difficult to analyze the temperature and predict the performance experimentally, as many of the electrochemical parameters inside the lithium battery are unknown. Therefore, LIB mechanisms and experiments have led to the establishment of a reasonable equivalent electrochemical model, to simulate and predict battery performance. This has been applied to LIB thermal runaway [17], electrochemical performance analysis [18], and nanofluid heat transfer [19,20,21].
In the present work, a schematic diagram of the preheating for the photothermal conversion film, with low-temperature pouch cells of different lug designs, is shown in Figure 1a. Considering the evenness of the thermal distribution in LMO pouch cells, as well as the good heat dissipation and averaging of the electrode current density, improved SOC distribution and, ultimately, longer cell life, these properties can be achieved, to some extent, by optimizing the lug design through three different lug positions and sizes, as shown in Figure 1a. Different lug designs further relieve the heat build-up in advance, due to outer local heating via irradiation and, ultimately, achieve the best pre-heating effect at low temperatures. Figure 1b shows a schematic diagram of the LMO pouch cell under illumination, and simulation, using the Vis-NIR light source illumination test. In the preparation method for the Cu/SWCNT coating on the SiO2 substrate, as shown in Figure 1c, the COMSOL deformation geometry interface was used to simulate the formation of regular holes in the copper nanosheets using laser ablation, followed by the CVD deposition of SWCNT films on top, resulting in Cu/SWCNT films. Figure 1d is a proof of the concept presented, and a pouch cell composed of a collector, anode, and cathode, separator. The positive collector was coated with Cu/SWCNT. The heat-flow direction under illumination is from the top of the Cu/SWCNT to the bottom of the pouch cell. The simulation results show that the photothermal conversion capability of the Cu/SWCNT surface plasmons provides a temperature increase rate of 2.7 °C/min. The average surface temperature is improved, the embedded lithium concentration in the anode increases significantly, and the charging speed improves by 20% in a low-temperature environment of −5 °C. This guides the development of photothermal conversion materials for LIBs, and the optimization of the electrochemical parameters.

2. Model Description

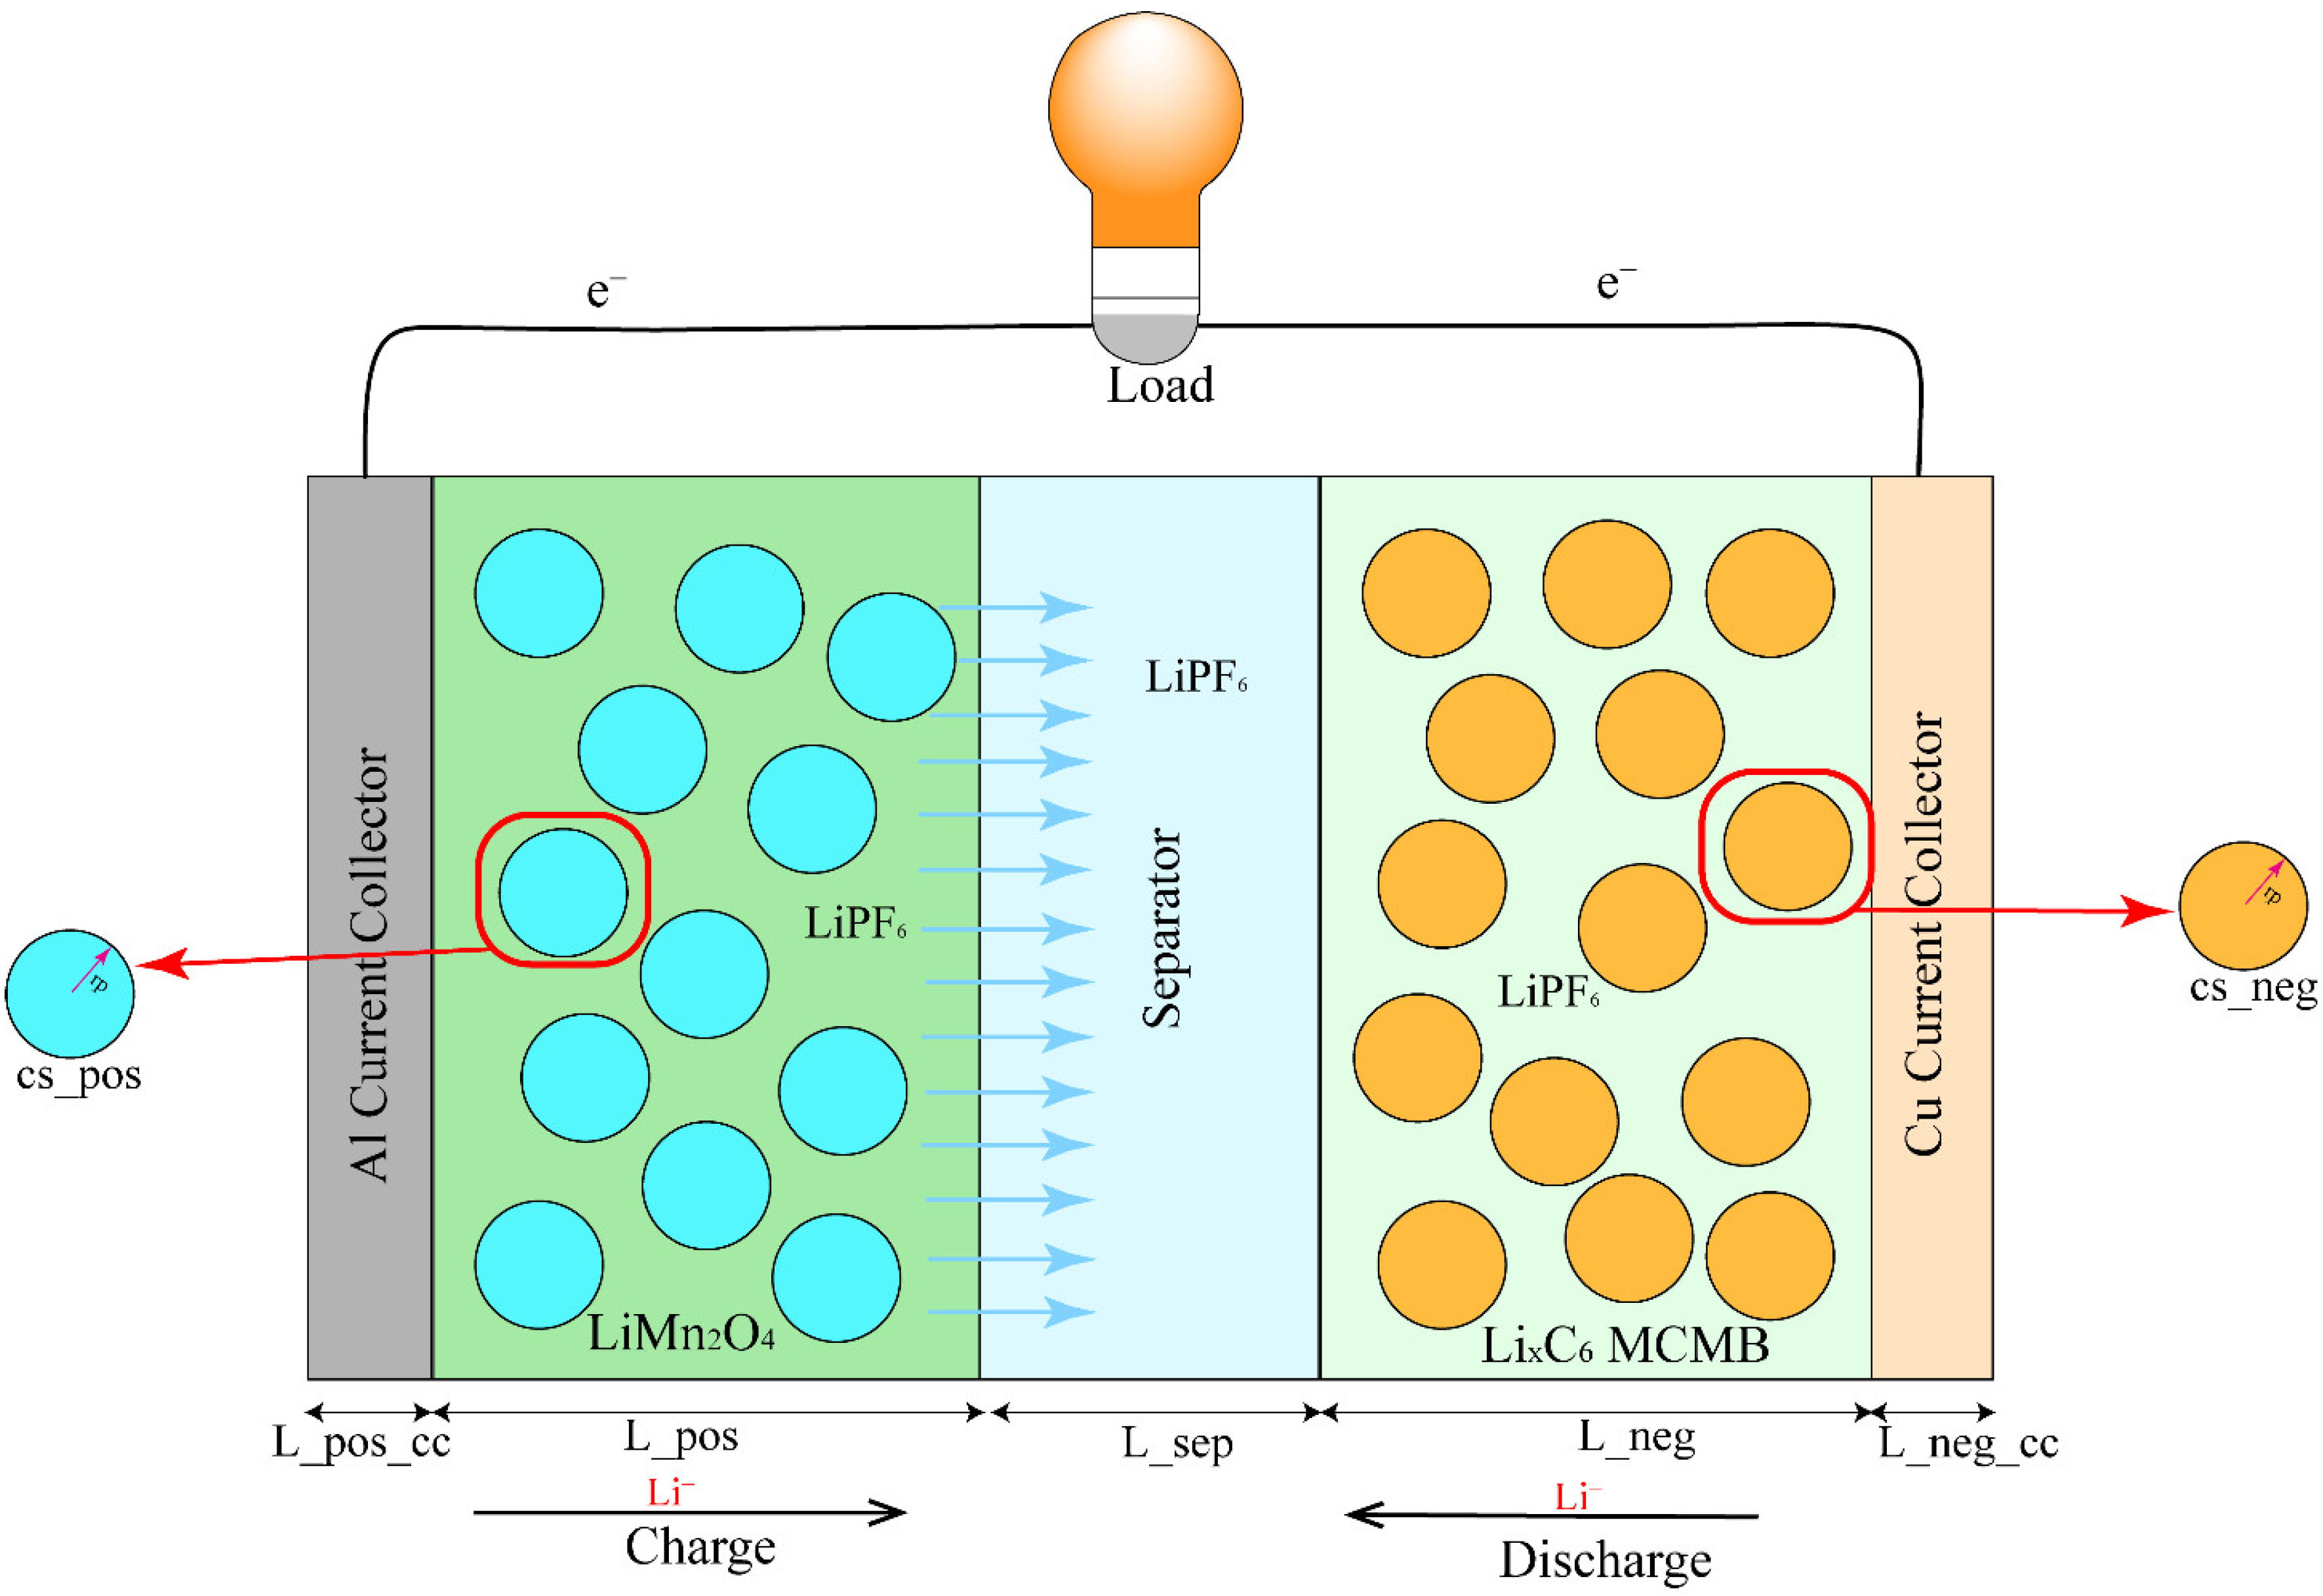
2.1. Electrochemical–Thermal Coupling Model

The established model is based on experiments. LiMn2O4 was used as the cathode. To enhance the specific capacity and multiplicative performance of the LMO pouch cell, micron-sized spherical-carbon-material MCMB intermediate-phase carbon microspheres, with a layered stacking structure made from bitumen or petroleum residual oil, were used as the anode material. LixC6 MCMB was the anode, lithium hexafluorophosphate (dissolved in 3:7 EC (vinyl carbonate): EMC (methyl ethyl carbonate)) was the electrolyte, porous polymer film was the diaphragm, aluminum foil and copper foil were the positive and negative collectors, a carbon nanotube heating film was attached to the positive collector side outside the aluminum–plastic film, and an external beam was employed for irradiation. The capacity of the LIB was 1506 mAh, and it was 200 mm long, and 100 mm wide. The outer side of the aluminum–plastic film was covered with a 5-μm-thick carbon nanotube, heating the film near the cathode collector side. The 2D SWCNTs materials had a refractive index n of 2.5411 [22], an extinction coefficient k of 0.020388, a density of 3.25 g/cm3, a specific heat capacity of 700 J/kg∙k, and a thermal conductivity of 5800 W/(m∙K). To achieve a higher light modulation range in the photothermal film, SWCNT and metal were combined, and prepared for growth on SiO2 via chemical vapor deposition (CVD) [23] at 293.15 K, and attached to the surface of the pouch cell collector, as shown in Figure 1c.
The pseudo-two-dimensional (P2D) model established in COMSOL was developed by Doyle and Newman, using porous electrodes and concentrated solution theory [24]. Figure 2 shows a schematic diagram of the model, which contains the collector, anode and cathode, and separator. This model assumes that the active material in the electrolyte is the spherical particles. The bilayer effect is not considered, the electrolyte is regarded as a binary dilute solution, and the battery is internally divided into solid phase and liquid phase. The liquid phase diffusion is along the LMO pouch-cell-thickness direction, and the diffusion and the electromigration of the ions are considered as two parts. The solid-phase particle diffusion is along the particle-size direction. The model is used to analyze the diffusion migration of lithium ions, electrochemical reactions, and conservation phenomena.

2.2. Mathematic Models

The charge-discharge process of the LIBs is realized through the insertion and detachment of lithium ions. The electrochemical reaction occurs at the interface between the active particles of the electrode and the electrolyte. The battery reaction equation is:
Cathode: LiMn2O4 ⇔ Li(1−x)Mn2O4 + xLi + xe (0 < x < 1)
Anode: xLi+ + xe + 6C ⇔ LixC6

2.2.1. Mass Conservation Equation

The influencing factors of the electrolyte potential, electrolyte salt concentration, and potential are considered. The electrolyte is a single solvent, based on the Nernst–Planck mass transfer equation of the diffusion bilayer. The material transport contains diffusion and electromigration, where the liquid phase mass conservation equation can be expressed as Equations (1) and (2):
J l = R l
J l = D l c l + i l t + F
where i l t + F is the total molar volume of the migration process reaction, and D l is the liquid-phase diffusion coefficient.

2.2.2. Charge Conservation Equation

In the P2D model of the pouch cell, the current i expresses the sum of the internal liquid-phase current density Q l and the solid-phase current density Q s . The charge conservation equation can be expressed as Equations (3)–(5):
i = Q l + Q s
Q l = i l
Q s = i s
where the liquid-phase current i l and the solid-phase current i s can be expressed as the liquid-phase diffusion current density Equation (6) and the solid-phase Ohm’s law current density Equation (7):
i l = σ l ϕ l + 2 σ l R T F 1 + l n f ln c l 1 t + ln c l
i s = σ s ϕ s = σ e f f ϕ s x
where the local current density i l o c or the reaction rate at the intersection of the solid and liquid phases can be analyzed using the Butler–Volmer kinetic Equation (8) [25]. The local current density of the porous electrode is expressed by Equation (8), where i 0 is the exchange current density expressed by the anodic and cathodic reactions when the electrode reaction is in equilibrium, and α a and α c , respectively, represent the transfer coefficients of the anode and cathode:
i l o c = i 0 exp α a F η R T exp α c F η R T
The activation overpotential η on the particle surface can be expressed as Equation (9), which represents deviations of the electrode potential from the equilibrium potential of the electrode reaction, due to the activation reaction. The U is the open-circuit voltage, j L i R S E I is the potential drop due to the SEI (Solid electrolyte phase interface) membrane, and R S E I is the resistance of the SEI:
η = ϕ s ϕ e U j L i R S E I

2.2.3. Transfer Equation

The diffusion phenomenon and the electromigration phenomena exist in the cathode, anode, and lithium-ion electrolyte. Fick’s second law diffusion equation represents the solid- and liquid-phase diffusion process as Equations (10) and (11), respectively. The particle diffusion process is described by the Baker–Verbrugge law as being modified by the electrolyte salt diffusion. This process considers the lithium ions as spherical particles with diffusion for the change process of the electrode interlayer concentration:
c s t = 1 r 2 r D s r 2 c s r = D s 2 r c s r + 2 c s r 2
The diffusion process of lithium ions in the electrolyte can be expressed as:
ε e c e t = x D e e f f c c x + a 1 t + 0 j r
where x D e e f f c c x is the diffusion process along the LIB thickness direction, and a 1 t + 0 j r is the migration between the solid surface of the particle, and the liquid phase. The electromigration phenomenon is the lithium-ion transport process due to charge and discharge, which results in varying concentrations on the inner and outer surfaces of the particles. The lithium-ion migration number t + is given by Equation (12), which represents the ratio of the positive ion diffusion coefficient to the overall ion diffusion coefficient:
t + = D + D + D +
Low temperatures can affect the migration number of the lithium ions. Equation (13) gives the ion diffusion rate equation that determines the potential of the liquid phase of the electrochemical rate [26]:
D = v 0 l 2 exp E a K B T
τ = L 2 2 D
In Equations (13) and (14), τ is the lithium-ion diffusion time, D is the diffusion coefficient, L is the diffusion length, v 0 is the lithium-ion vibrational frequency, l represents the lithium-ion jump distance, Ea represents the ion migration energy barrier, K B is Boltzmann’s constant, and T represents the absolute temperature.

2.2.4. Heat Transfer Equation

The law of conversation of energy as given by Equations (15) and (16) represents the relationship between the heat source and the heat, while charging and discharging the pouch cell:
ρ C p T T + q + ρ C p u T = Q + Q t e d
ρ C p u T = k T + Q g e n
In Equation (17), the heat Q g e n generated by the battery during the operation of charging and discharging can be expressed as the Joule heat Q J H , activation reaction loss heat Q m , and mixing heat Q m i x :
Q g e n = Q J h + m a v , m Q m + Q m i x
Q J H = i s ϕ s + i l ϕ l
The Joule heat Q J H during the reaction process represents the heat generated by the current flowing through the electrode, diaphragm, electrolyte, and other parts of the Li-ion with an internal resistance. This includes both the solid phase s and the liquid phase l . The heat generated by n mol of the substances involved in the reaction process, including the activation loss and reaction heat Q m , is expressed by Equation (19). This includes lithium-ion embedding and de-embedding from the irreversible heat ( ϕ s ϕ l E e q , m ) i l o c , m generated by the potential, and the reversible entropic heat i l o c , m T E e q , m T due to the equilibrium potential, and E e q , m T is obtained experimentally:
Q m = ϕ s ϕ l E e q , m + T E e q , m T i l o c , m
There is also a mixing heat Q mix   , generated when the lithium ion is mixed with the solid phase during the reaction, which can be expressed as Equation (20), the specific meaning of the letters is explained in Equations (21) and (22).
Q mix   = 3 ϵ s 0 1   q m i x X 2 X
q m i x = F D s E e q , thermal   c s c s c s
E eq , therm   = E e q E e q T
where the specific surface-area-based heat source for the LMO pouch cell is shown in Equation (23):
W = Q V t = n Q r = z F n T E T V t
Because the battery also dissipates heat with the surrounding environment, the LIB temperature field variations include convective and conductive heat caused by external heat sources. The heat dissipation between the battery and the surrounding environment can be expressed by Equation (24), with Newton’s cooling law, and the radiative heat transfer equation in Equation (25). The h represents the convective heat transfer coefficient, T e x t and T a represent the external and ambient temperatures, respectively, T and T s are the battery temperature, and Q 0 represents the convective heat flux. According to the Stefan–Boltzmann law, the radiative heat transfer heat flux between the LIB and the outside world Q r a d is expressed as Equation (25), where ε represents the emissivity (0~1), and σ represents the Boltzmann constant:
Q 0 = A h T e x t T
Q r a d = ε σ A T s 4 T a 4

2.2.5. External Radiation Equation

In the radiation simulation, CNT photothermal film is used as the preheat source of the battery. The external deposition beam irradiation is used as the heat source, to analyze the temperature increase and heat flux in the LMO pouch cell. The radiation energy equation is given by Equation (26). In the simulation, the beam direction is set to (0, −1, 0), with vertical incidence along the y-axis, and the deposited beam power P 0 is 10 W. The beam origin O is (0, −0.1, 0), and the beam profile is of a top-hat disk distribution. The laser beam radius R is 100 mm, and the transition zone size R is 5 mm:
f O , e = 1 π R 2 ,   if   d R 0 ,   if   d > R , d = e × x O e
The model parameters and symbols used in the simulation are shown in the Supplementary Materilas.

3. Results and Discussion

A three-dimensional electrochemical–thermal coupling model is established, to simulate the charge/discharge performance and temperature field of the battery at various temperatures. The results are compared with the Panasonic UF653445ST commercial battery datasheet (Figure S1). The simulation construct is given as follows.
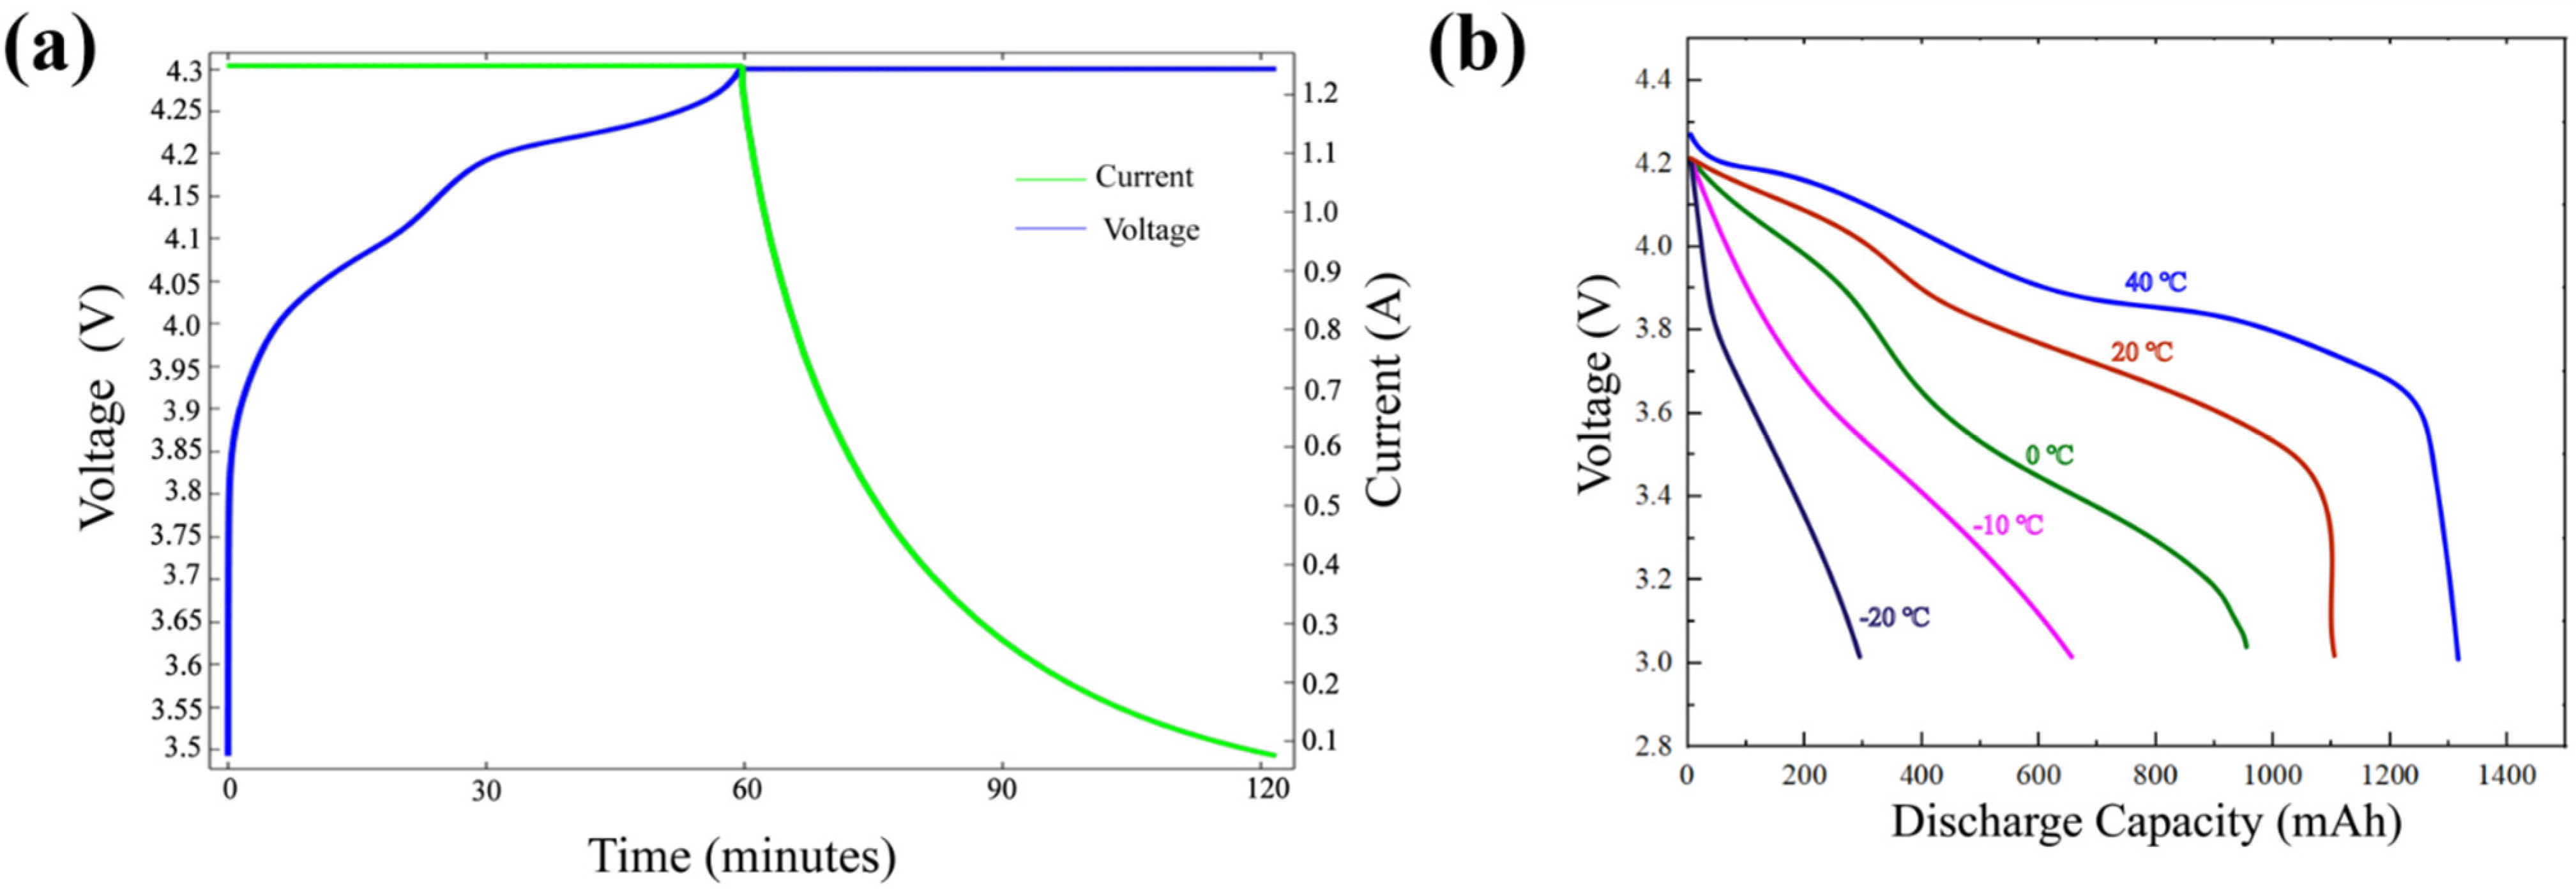
  • The established battery model includes relevant electrochemical and thermal parameters, and comparisons of the battery charge and discharge process, to verify the accuracy of the model.
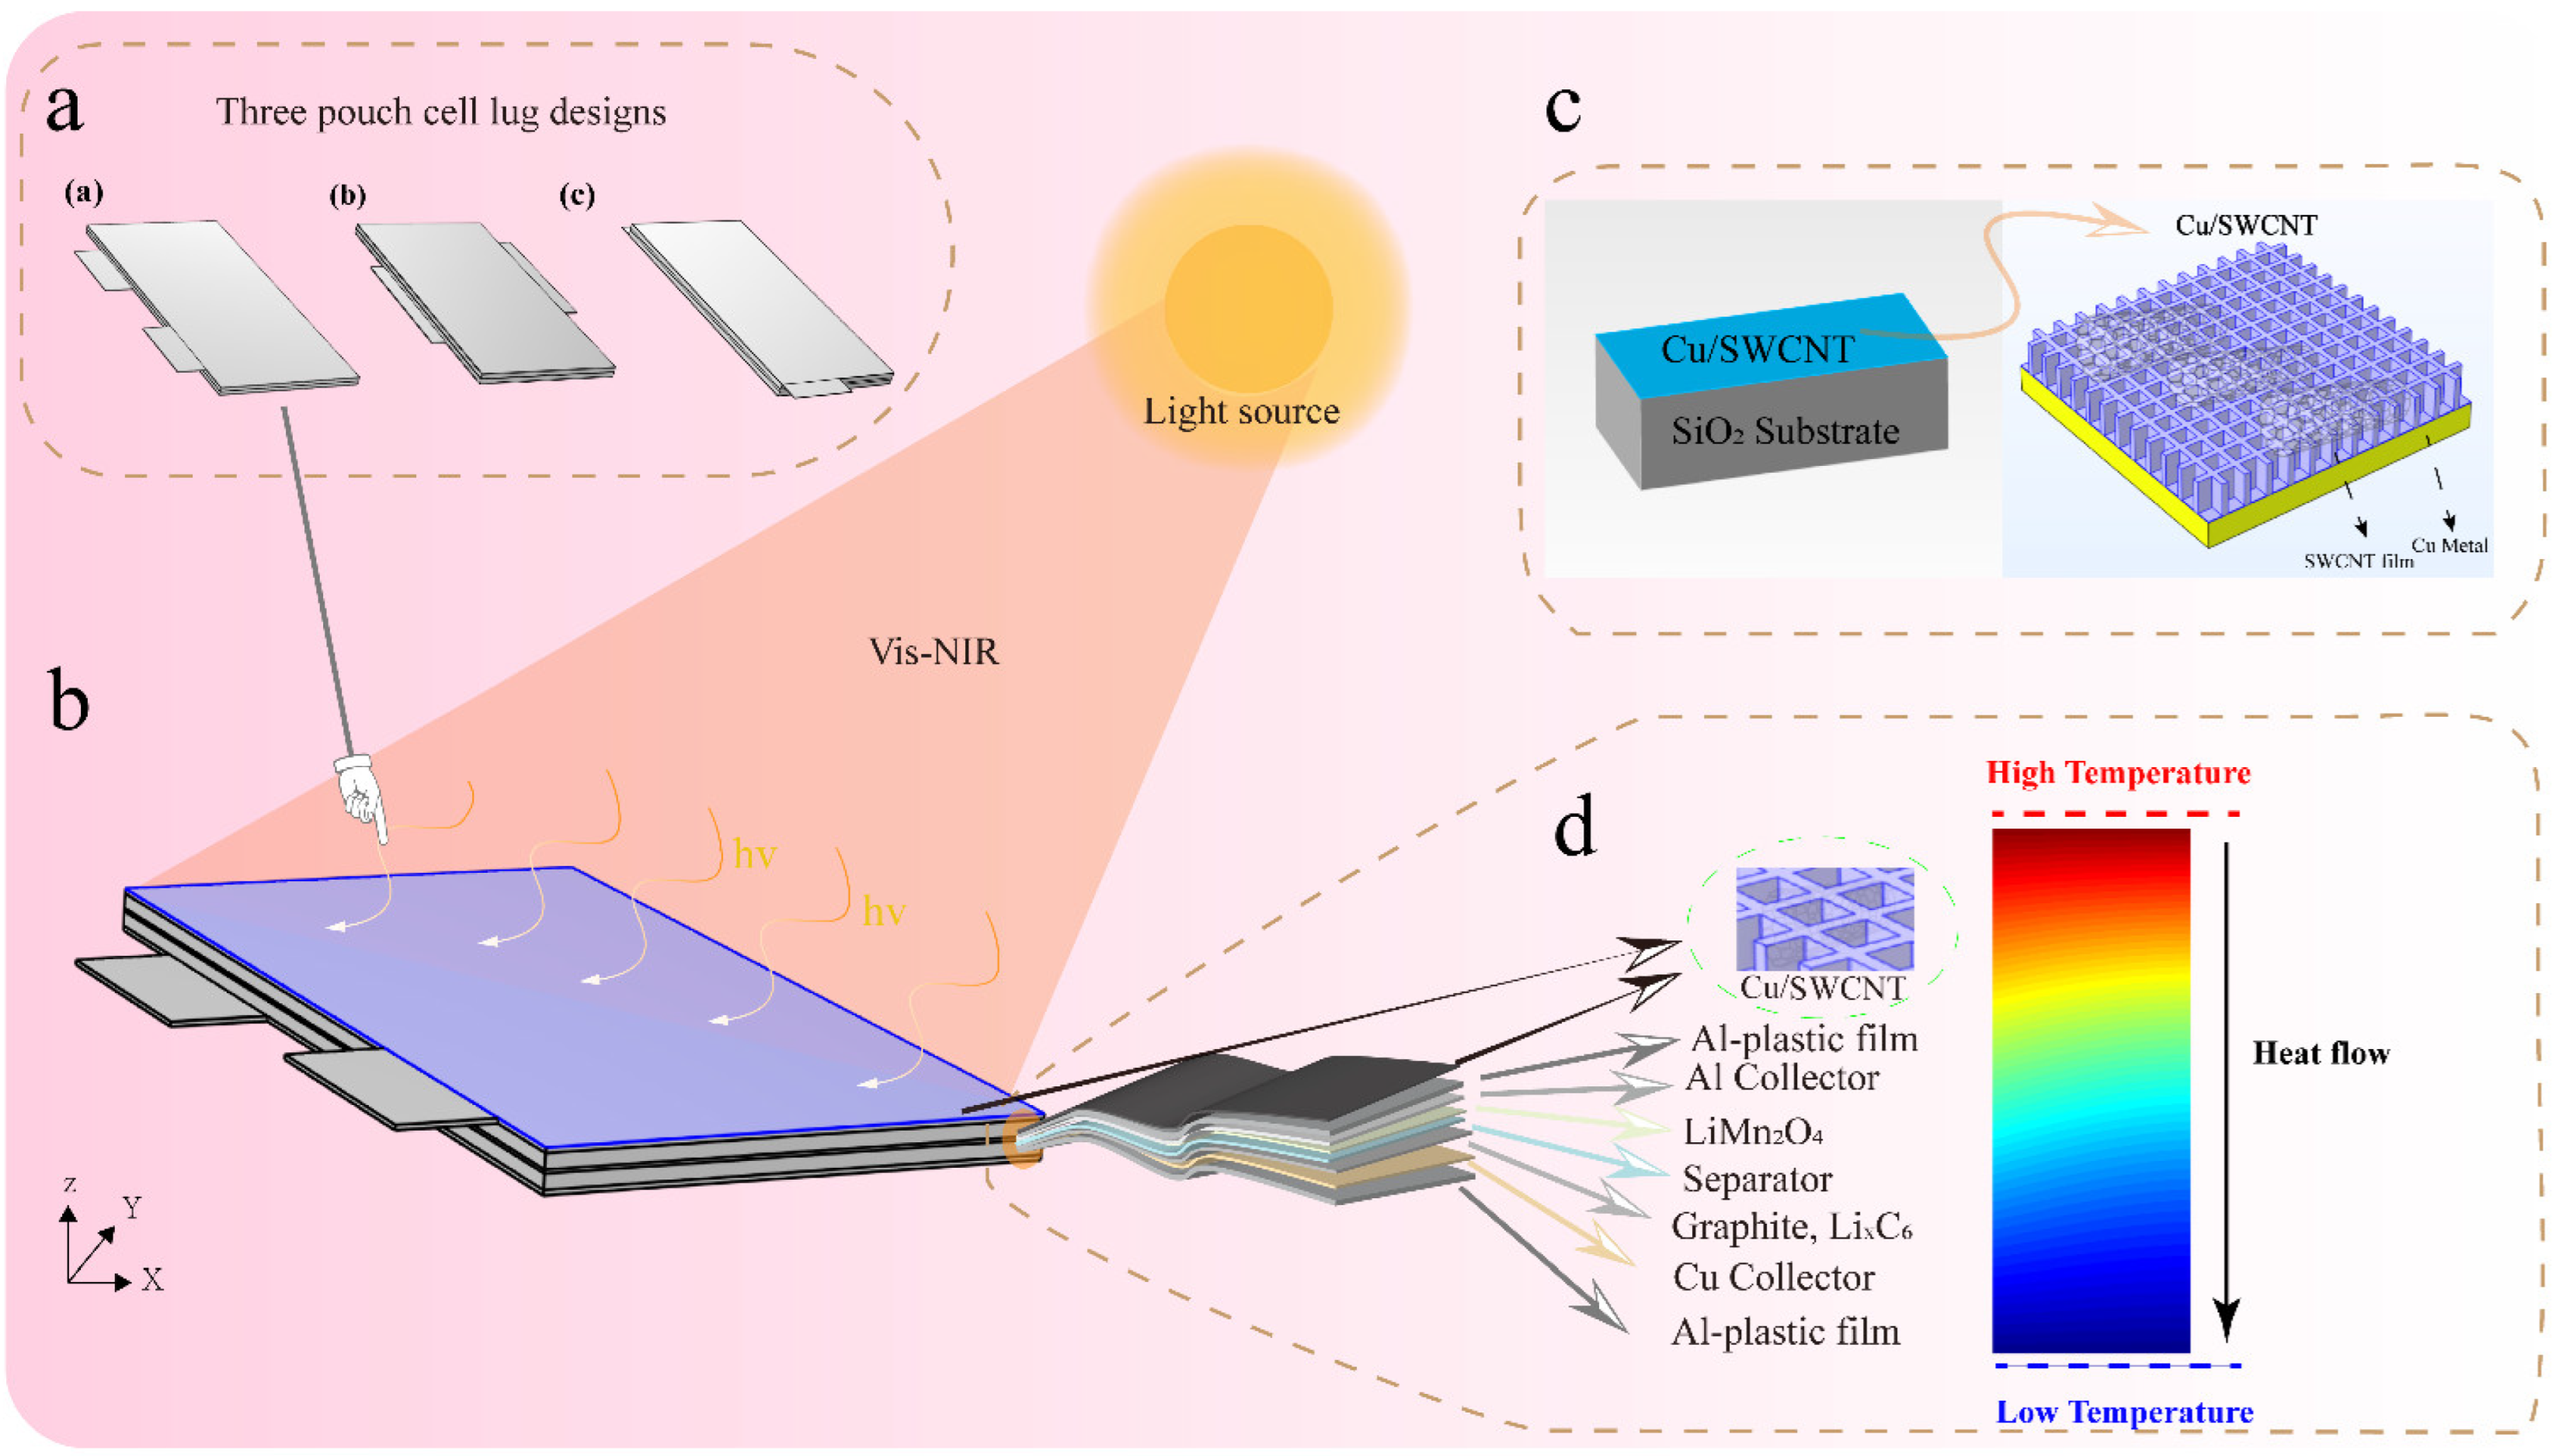
  • After verifying the model’s accuracy, the battery temperature uniformity and charge/discharge characteristics improve the battery dissipation. Three lug designs are shown in Figure 1, to analyze the LIB temperature distribution and performance changes before and after illumination. The heat flux boundary conditions of the six external surfaces are established. The external natural convection heat dissipation is considered to simulate heat dissipation during the experiment, and the heat production is included for different areas of the battery.
  • A radiation beam irradiates the pouch cell for preheating, with a radiation power of 10 W and 1 W, in two stages. The heat production and temperature distribution are analyzed, and the reversible heat and irreversible thermal changes of the battery under different levels of radiation intensity are analyzed.

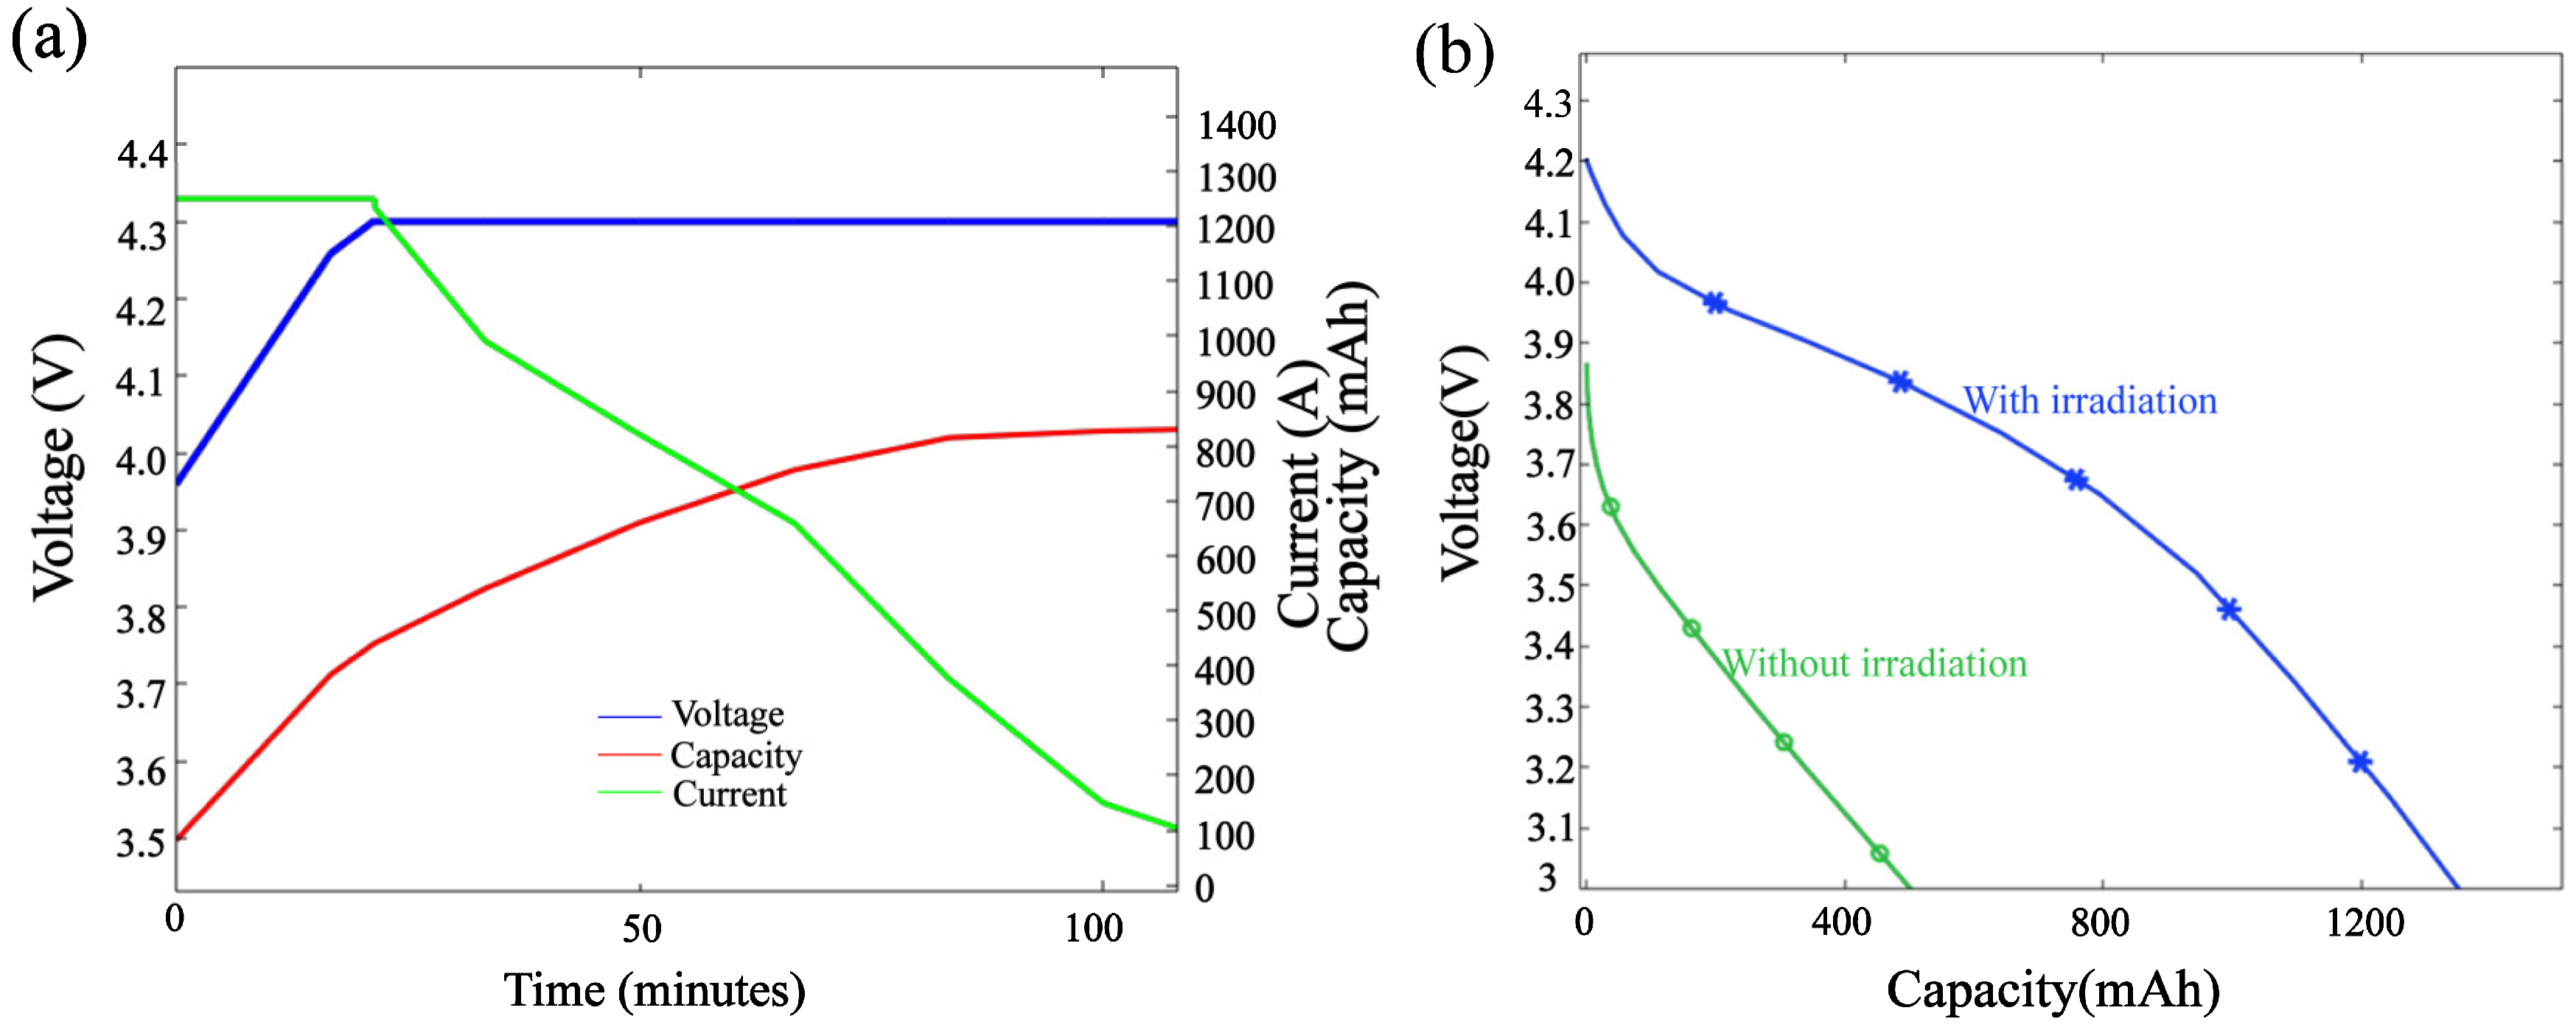
3.1. Model Validation

Figure 3 compares the P2D model simulations with the lithium-ion battery manual, as shown in Figure S1 for verification. Figure 3a illustrates the simulated voltage and current while charging at 20 °C, 1 C with a 1.25 A constant current and 4.3 V constant voltage (CC-CV), and Figure 3b compares the 1 C discharge voltage and capacities at −20 °C, −10 °C, 0 °C, 20 °C, and 40 °C, which indicates that the available discharge capacity decreases for smaller temperatures. Without illumination, the LMO pouch-cell discharge capacity at 20 °C is only 27% of 20 °C, which is due to the increased electrolyte viscosity and lithium-ion depletion caused by side reactions. The voltage and available capacity decrease the most at −20 °C. The simulations and the manual data in Figure 3a,b agree well, but some deviations exist, due to changes in the electrode and electrolyte materials during the experiments. The deviations are due to differing optimization of the electrode and electrolyte materials when preparing the lithium ions during the experiments. These results indicate that the model is valid, and can be used in the study.

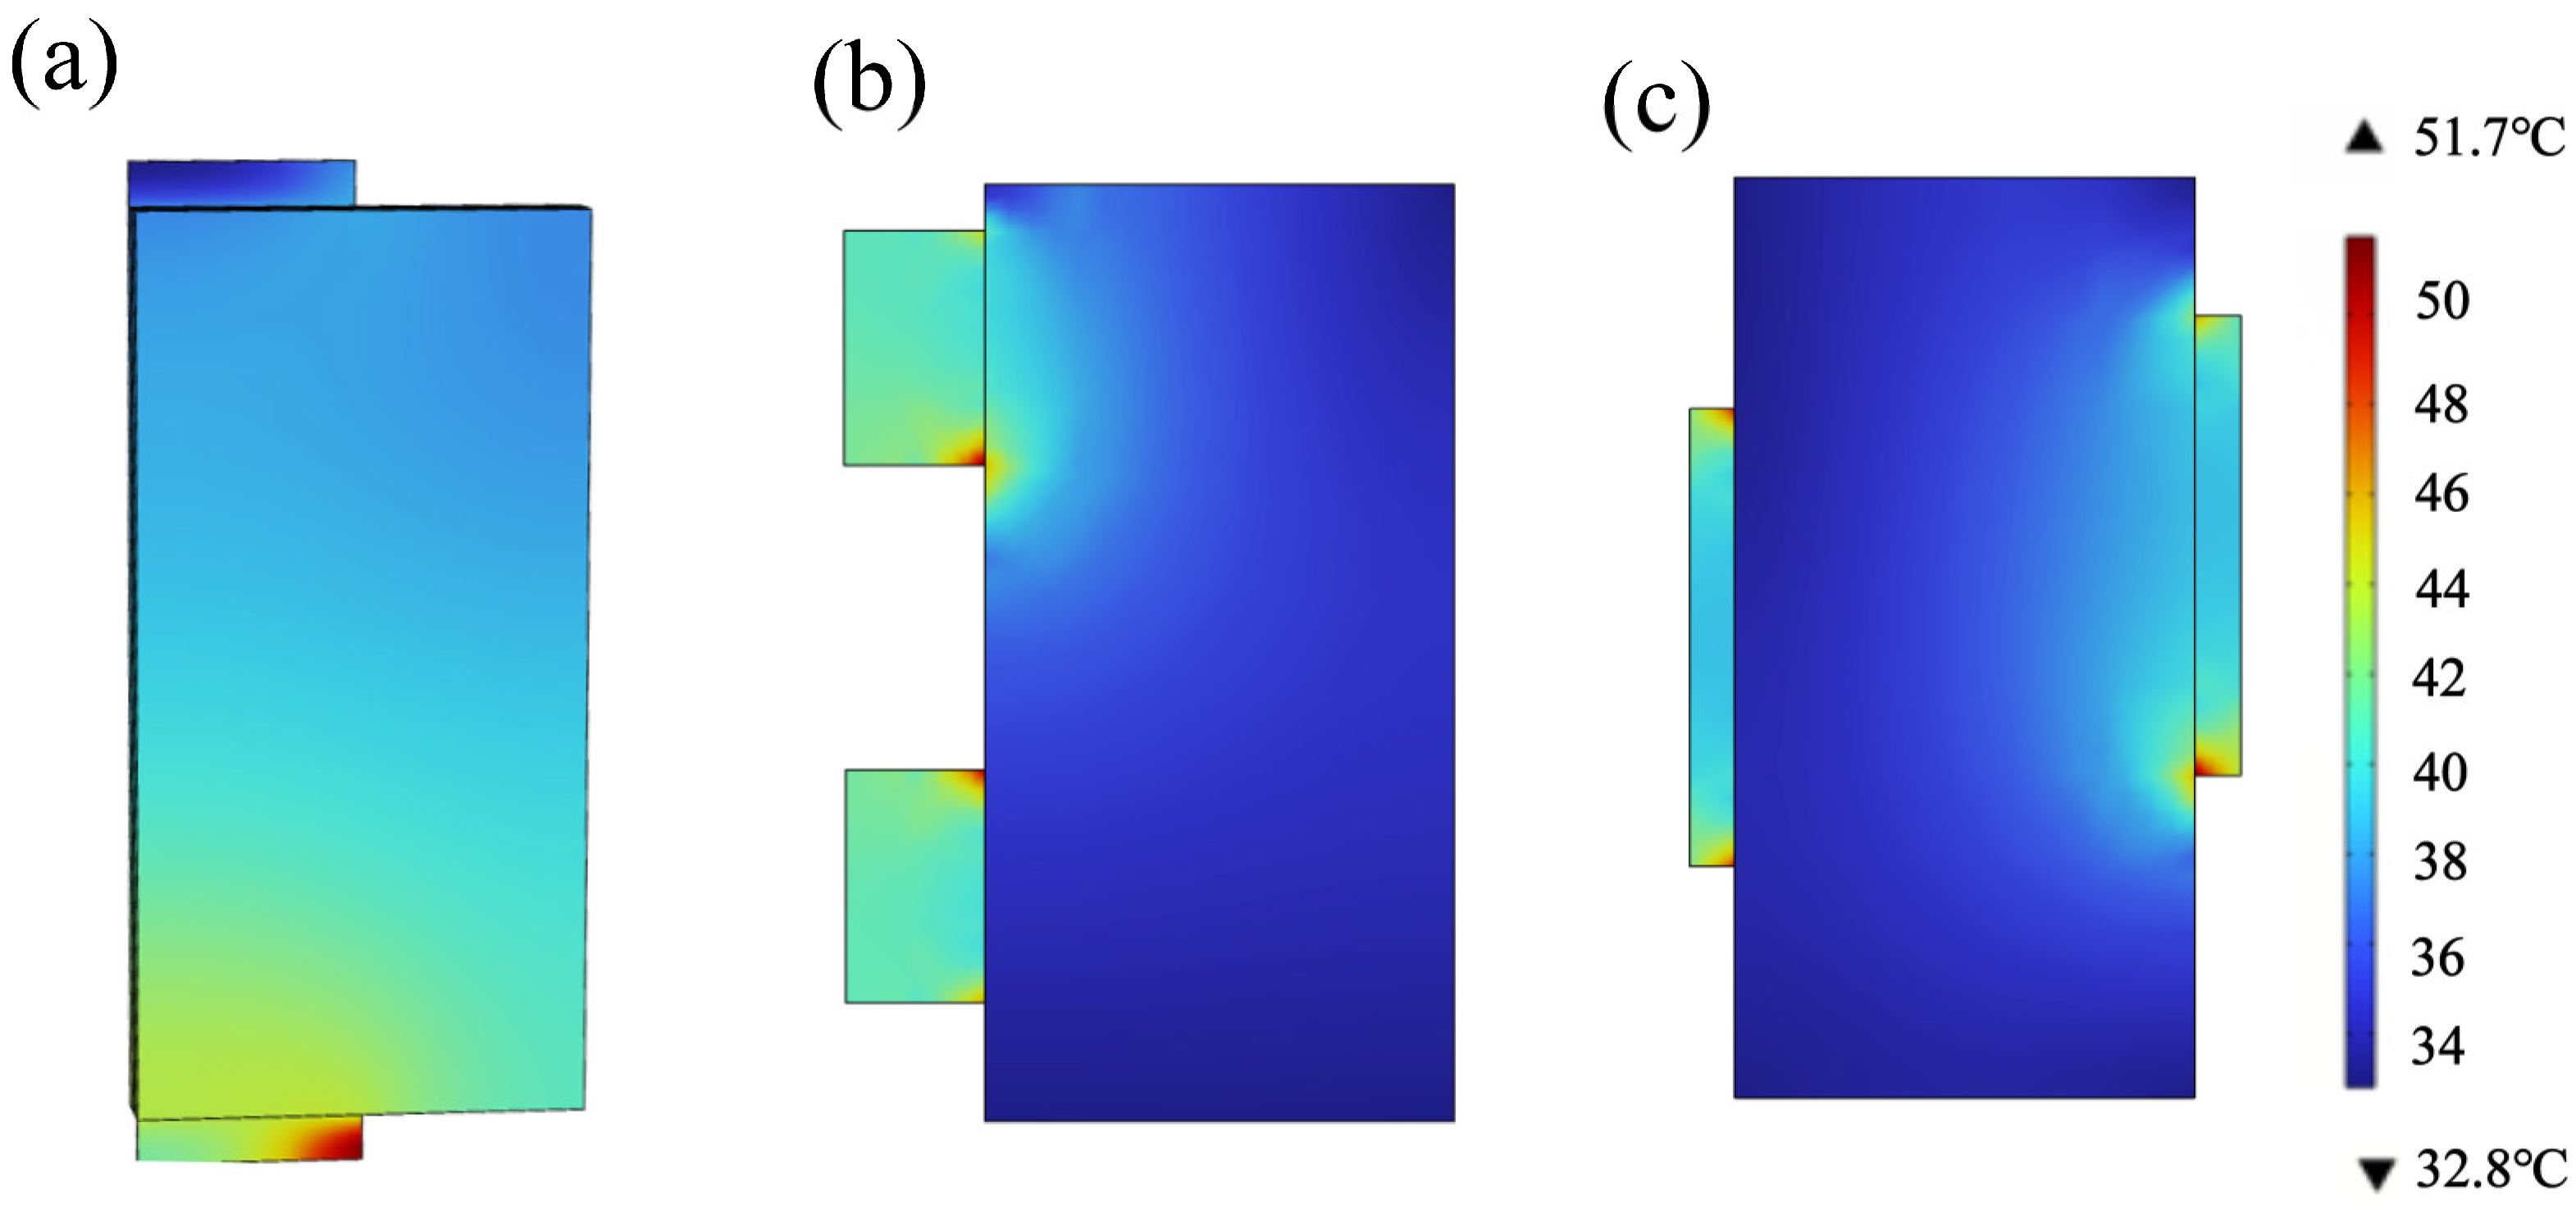
3.2. Lug Design Optimization and Analysis

3.2.1. Optimization of the Lug Design

The pouch cell produces a local heat aggregation during charging and discharging, due to the internal resistance and thermal resistance of the pouch-cell lug, coupled with the influence of uneven heat dissipation, which results in temperature inhomogeneity. Meanwhile, the pouch cell’s average and reasonable working temperature affects the average internal SOC, electrolyte salt concentration distribution, and lithium-ion flux. This impacts the electrochemical reaction rate, which ultimately limits the utilization rate of active particles, making it essential to reasonably design the pole lug position, and reduce the temperature at the highest point of the battery [27]. A reasonable pole lug design improves the battery temperature averaging after adding the Cu/SWCNT carbon nanotube film. The lug design can also improve the average pouch-cell temperature after adding the SWCNT carbon nanotube film. The simulations are designed as shown in Figure 1a, with three different lugs as (a) 50 mm × 20 mm × 2 mm, (b) 100 mm × 8 mm × 2 mm, and (c) 20 mm × 8 mm × 2 mm.
As shown in Figure 4, under adiabatic conditions, the greatest temperature point of the three lug designs during charging always occurs near the lug. However, the thermal conductivity and heat capacity parameters of the electrode material and natural convection create a stronger temperature gradient from heat conduction between the lug and the LMO pouch cell. The temperature rise in the positive aluminum collector is greater than that in the negative lug, due to its higher resistivity. Compared with Figure 4a,c, Figure 4b shows that widening the unilateral lug causes the highest temperature, which only appears at the top of the lug in a small range, and it can be seen that the small percentage of the high temperature is part of the battery surface. This design obviously enhances the battery surface-temperature uniformity. The highest temperature gradient of the pouch cell is only 5.7 °C, and the heat generation is relatively small. This indicates that the board design of Figure 4b positively affects the temperature uniformity.
Figure 5 explores the influence of the optimized lug design on the internal electrochemical reaction of the battery. The distribution of the current densities for the three electrodes designs is shown in Figure 5a–c. The electrode current density has a local maximum at the corner of the lugs and electrode connections. However, Figure 5b indicates that the current density of the single-sided lug design is the best and most reasonable. No densities that are much higher or lower exist in the current density distribution, which is concentrated in 10,000–60,000 A/m2. While Figure 5a shows a concentrated high electrode current density in 500,000–3,000,000 A/m2, Figure 5c shows a concentrated electrode current density in 5000–15,000 A/m2. The design of Figure 5b is conducive to improving the uniformity of the SOC and depth of discharge (DOD) distribution during battery charging, which ultimately improves battery life.

3.2.2. Optimal Lug Design Radiation Preheating Temperature Field

A single-sided lug design is adopted, where the Cu/SWCNT preheating film is bonded to the external aluminum–plastic film near the positive collector side. The initial temperature of the pouch cell is −5 °C. Considering the natural convection on the six external surfaces of the pouch cell, the external radiation heating power is 10 W for the first 5000 s, and reduces to 1 W power for the final 1000 s. The battery temperature curves with a CC-CV charging process, with and without light heating conditions, are shown in Figure 6a,b. Figure 6a shows that after charging for 58.3 min in an ambient temperature of −5 °C using a radiation-free heating film, the pouch cell’s temperature increases by 3.5 °C, and the temperature rise rate only reaches 0.06 °C/min. Figure 6b shows that after 400 s of the heating film being used under illumination, the temperature increases rapidly to 18 °C, and the rise rate reaches 2.7 °C/min, indicating the efficiency of surface photothermal conversion. This is considered a fast heating. The temperatures decrease due to the differences between solid- and liquid-phase concentrations, reaching a maximum in the later charging period. This increases the polarization heat generation and pouch-cell exotherm, slightly decreasing the overall pouch-cell temperature. The temperature drop in the battery from 3000 s to 4000 s is related to the entropy–heat curves, as shown in Figure 6c.
The use of SWCNT film achieves pouch-cell preheating using photothermal conversion. The results are consistent with the temperature rise curve of Yoon et al. [28] for a carbon nanotube film with an input voltage of 6 V at 4 × 4 cm2 and 188 μm thickness in the open mode (25–40 °C). The film design achieves the best heating characteristics. In contrast, the 0.005 mm film thickness design reduces the heat transfer distance between the collector fluids, which suppresses the heat backflow to a certain extent, and improves the energy utilization [29].
During the radiation preheating charging process, the battery heat generation includes both the electrochemical heat of the pouch cell, and the Joule heat generated by the radiation received by the carbon nanotube film. Figure 7a,b show the surface temperature field distribution at 400 s with 10 W irradiation, and 1900 s when the radiation intensity is reduced to 1 W irradiation, respectively. Figure 7a,b include the effects of the considered external convection conditions. As shown in Figure 7a, after receiving 10 W radiation for 400 s, the highest temperature point of the 1 C low-magnification CC rechargeable battery is distributed in an irradiation beam, and the overall preheating temperature difference reaches 4.7 °C. As shown in Figure 7b, after the radiation intensity is reduced to 1 W at 1900 s, the difference between the highest and lowest temperature is 0.93 °C, and the average temperature of the battery is well maintained. Here, the radiation heating area only irradiates the surface of the battery, and not the lugs. This ensures good heat dissipation from the lugs, and prevents excessive accumulation during charging, which indicates the excellent photothermal conversion ability of SWCNTs. Figure 7c represents the magnitude of the instantaneous electric field on the surface of the photothermal film, which is transmitted along the x-direction, and decays vertically, and induces a strong electric field, because of the surface plasmon effect. Figure 7d’s plot shows the magnitude of the electromagnetic loss density of Cu/SWCNT x–z cross-section, and the losses are concentrated on the surface of the Cu/SWCNT film. As marked in Figure 7d, electromagnetic losses occur within the nanopore cavity along a regular stretch, indicating the strong resonance effect within the Cu/SWCNT grid.

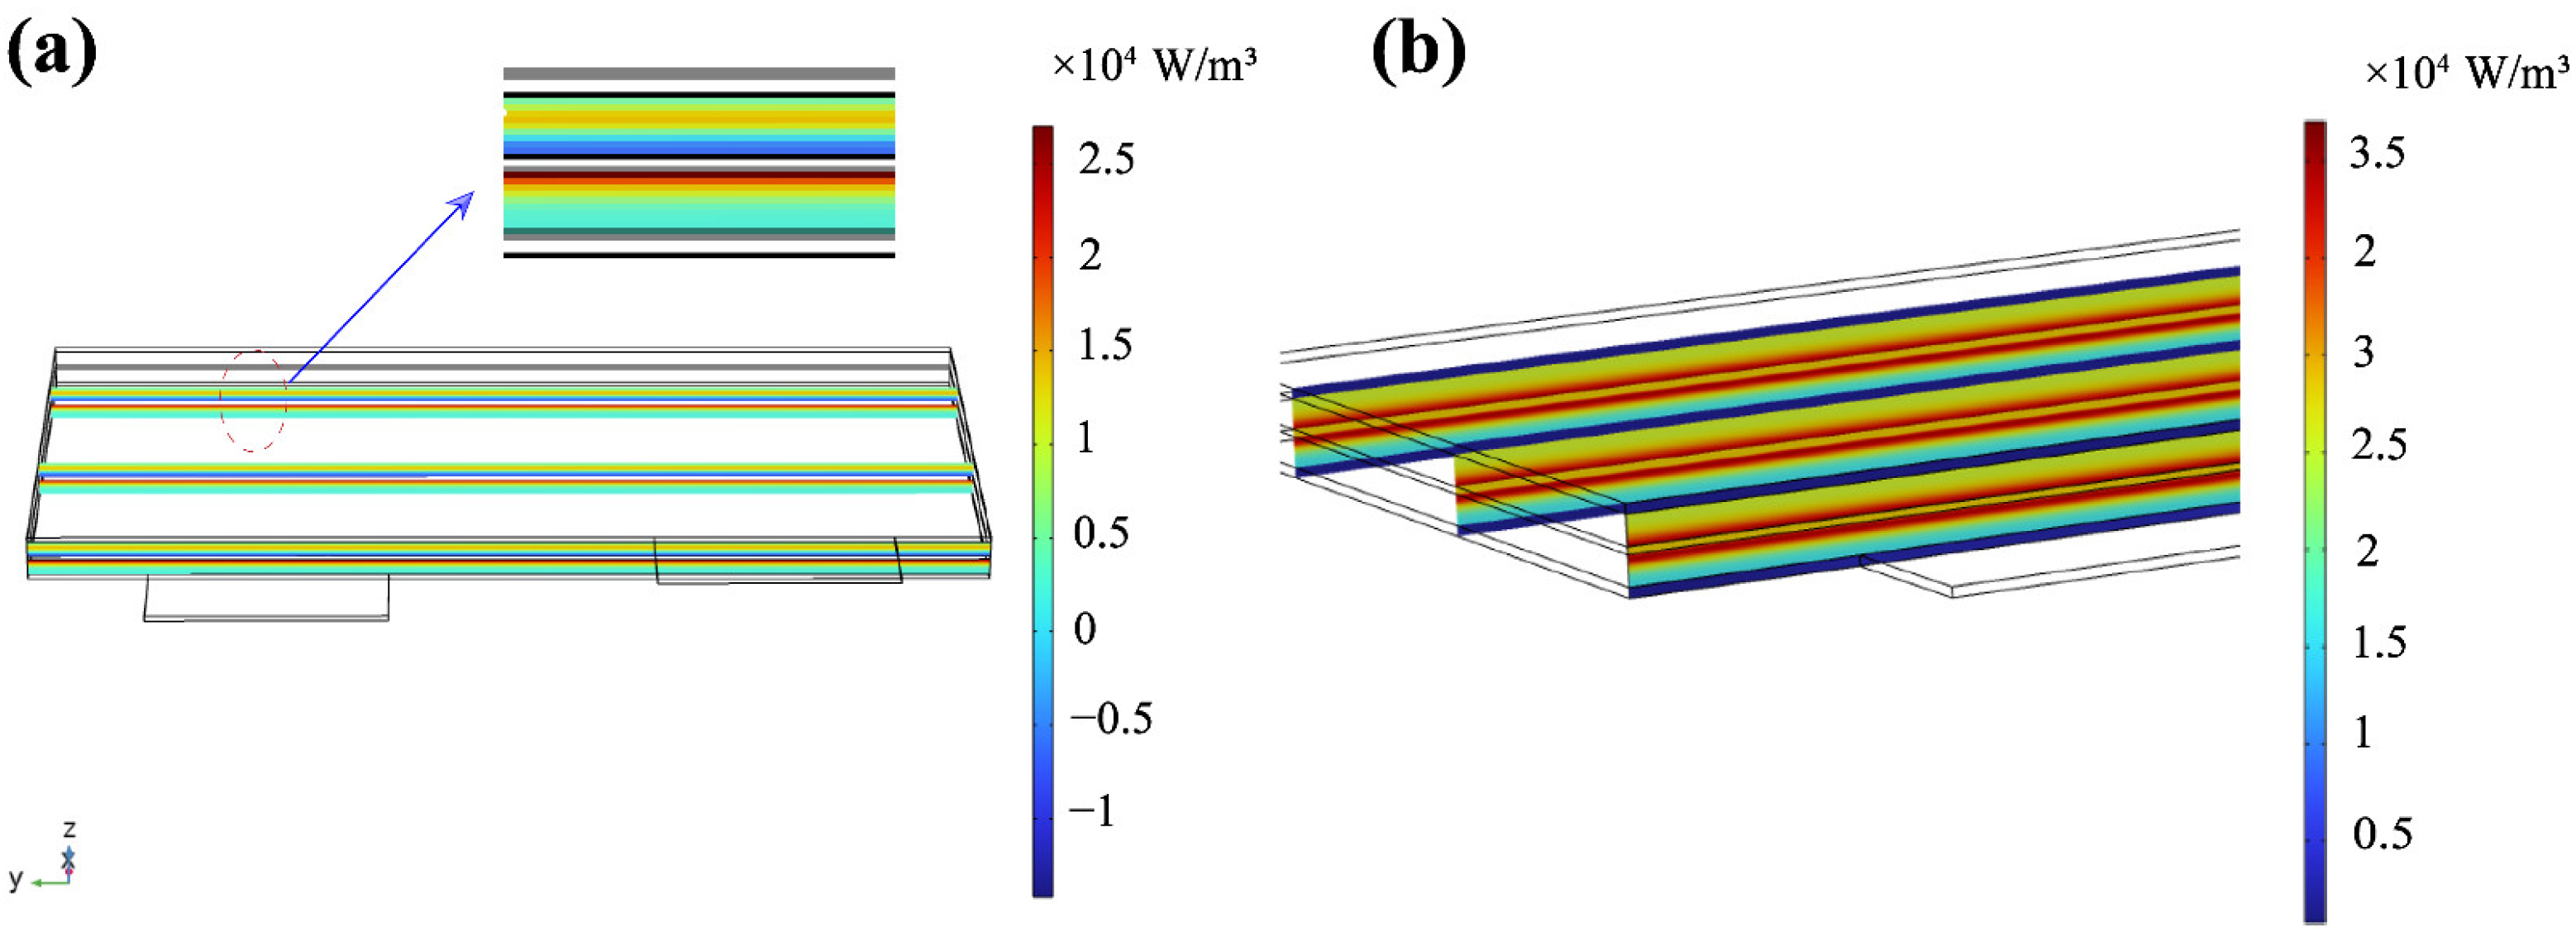
3.3. Reversible Heat Distribution

The process of generating the LMO pouch cell’s heat is vital to analyze the ageing mechanism [30]. In the thermal analysis, the heat source and generation rate are analyzed primarily with the Newman heat generation model and the Bernardi heat generation rate model [31]. According to Equation (27), the Bernardi model for pouch-cell heat generation during charging and discharging can be divided into two parts: reversible reaction heat Q r e and irreversible heat Q i r r e . The final pouch cell’s temperature and heat distributions are calculated using multi-physics field coupling through the solid heat transfer model in the COMSOL software, which is combined with the heat source boundary conditions. The reversible heat Q r e is expressed as the entropic heat of the electrochemical reaction generated during electron and ion transfer, and represents the heat absorption and exothermic characteristics of the battery. The Q r e is expressed as Equation (28), where the reversible heat is calculated using the equilibrium potential method, i.e., the derivative d E e q d T of the equilibrium potential with temperature in the porous electrode reaction. Furthermore, the entropic change T E T is related to the electric potential and temperature [32]. The entropic change of the total pouch cell is the difference between the single-electrode Peltier heat of the two electrodes [33]:
ρ C p T T + k T = Q i r r + Q r e
Q r e = n Q r e = z F n T E T
The irreversible heat Q i r r e mainly comes primarily from the activation loss reaction heat at the electrochemical interface, and the Ohmic heat at the positive side and anode, diaphragm and collector materials, which can be expressed by Equation (29). Here, Q i r r e is used to convert the heat into chemical energy and electrical work, expressed by Equation (30):
Q i r r e = Q o h m + Q p o l
Q i r r e = ( V b a t t e r y U ) I
As a comparison with the later part of the study, Figure 8 shows the reversible heat distribution after 400 s (a) and 1140 s (b) under CC without radiation heating at 5 °C. At the beginning of CC, the reversible heat is distributed primarily at the interface between the positive side and anode and the diaphragm, which is related to the kinetic process of lithium-ion insertion and transport. The cathode is mainly exothermic near the diaphragm side. The anode is mainly for heat absorption near the diaphragm side, which is related to the entropy heat coefficient curve of the positive anode. Figure 8b shows that the cell is mainly exothermic at the middle, and in the last 1140 s of charging, and the heat is mainly distributed at the interface between the anode and the diaphragm. The anode exotherm is much higher than the cathode, which is related to the increase in internal resistance caused by the anode side reaction, and the heat generation of the lithium-ion insertion process. This is related to the increased internal resistance caused by the negative side reaction and the heat generation of the lithium-ion insertion process. Under adiabatic conditions, the analysis of the overall heat production of the cell shows that the total reversible heat distribution will change during cell charging at −5 °C, and the heat is concentrated on the negative side at the beginning of charging. As the reaction proceeds, the battery becomes exothermic. The reversible heat is distributed primarily on the negative side near the diaphragm, which is caused by the maximum negative Peltier heat under the low-temperature conditions [34].

3.4. Analysis of Radiation Heating Heat Performance

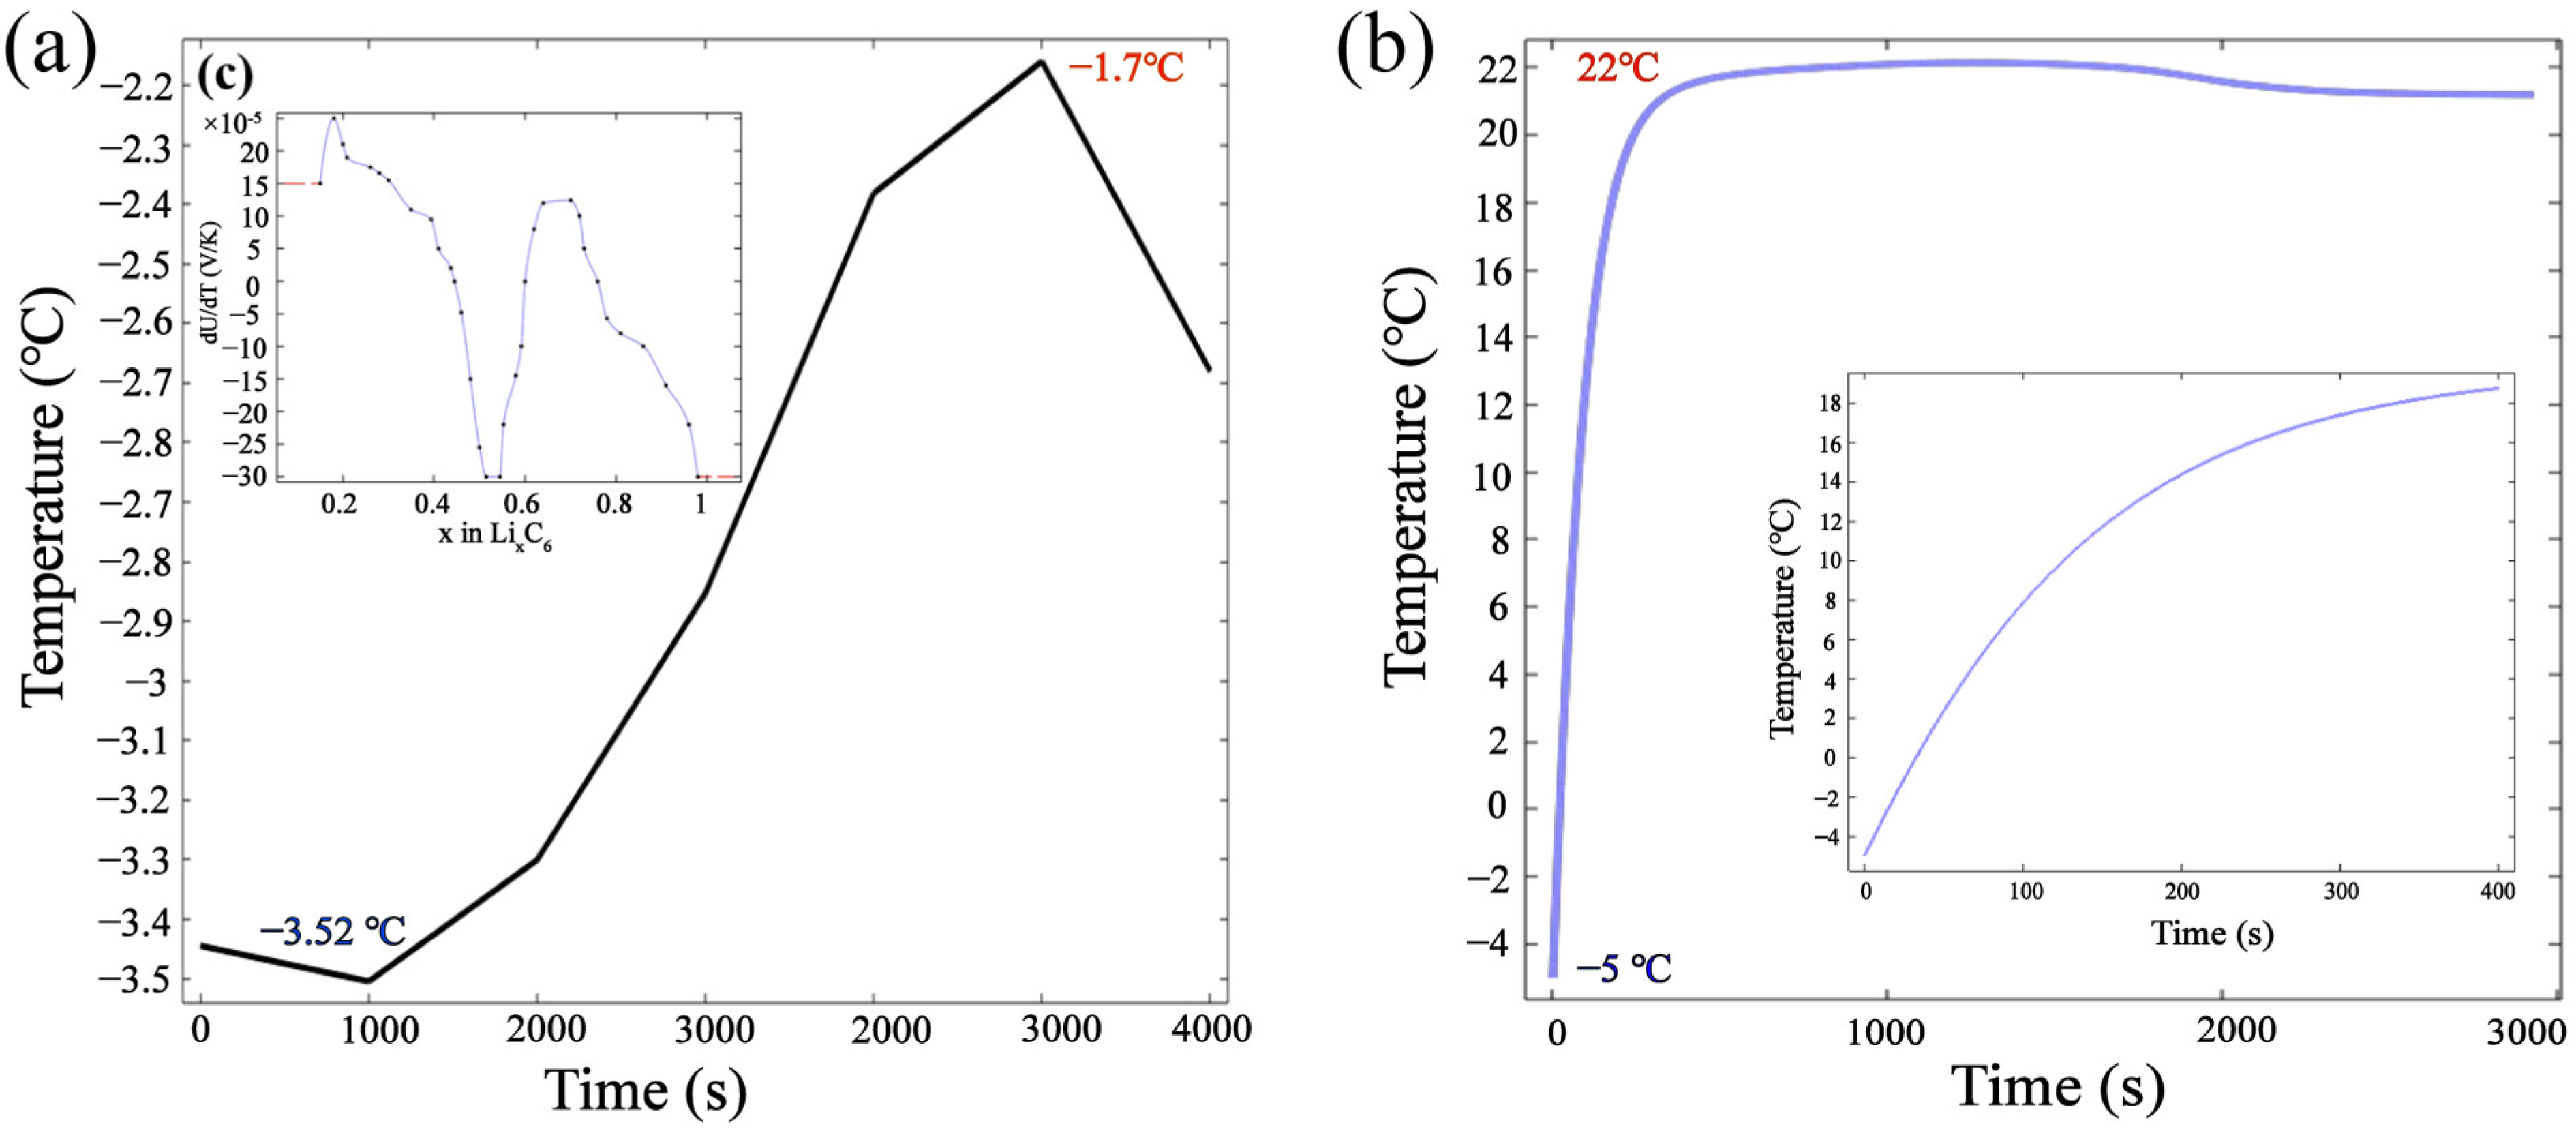
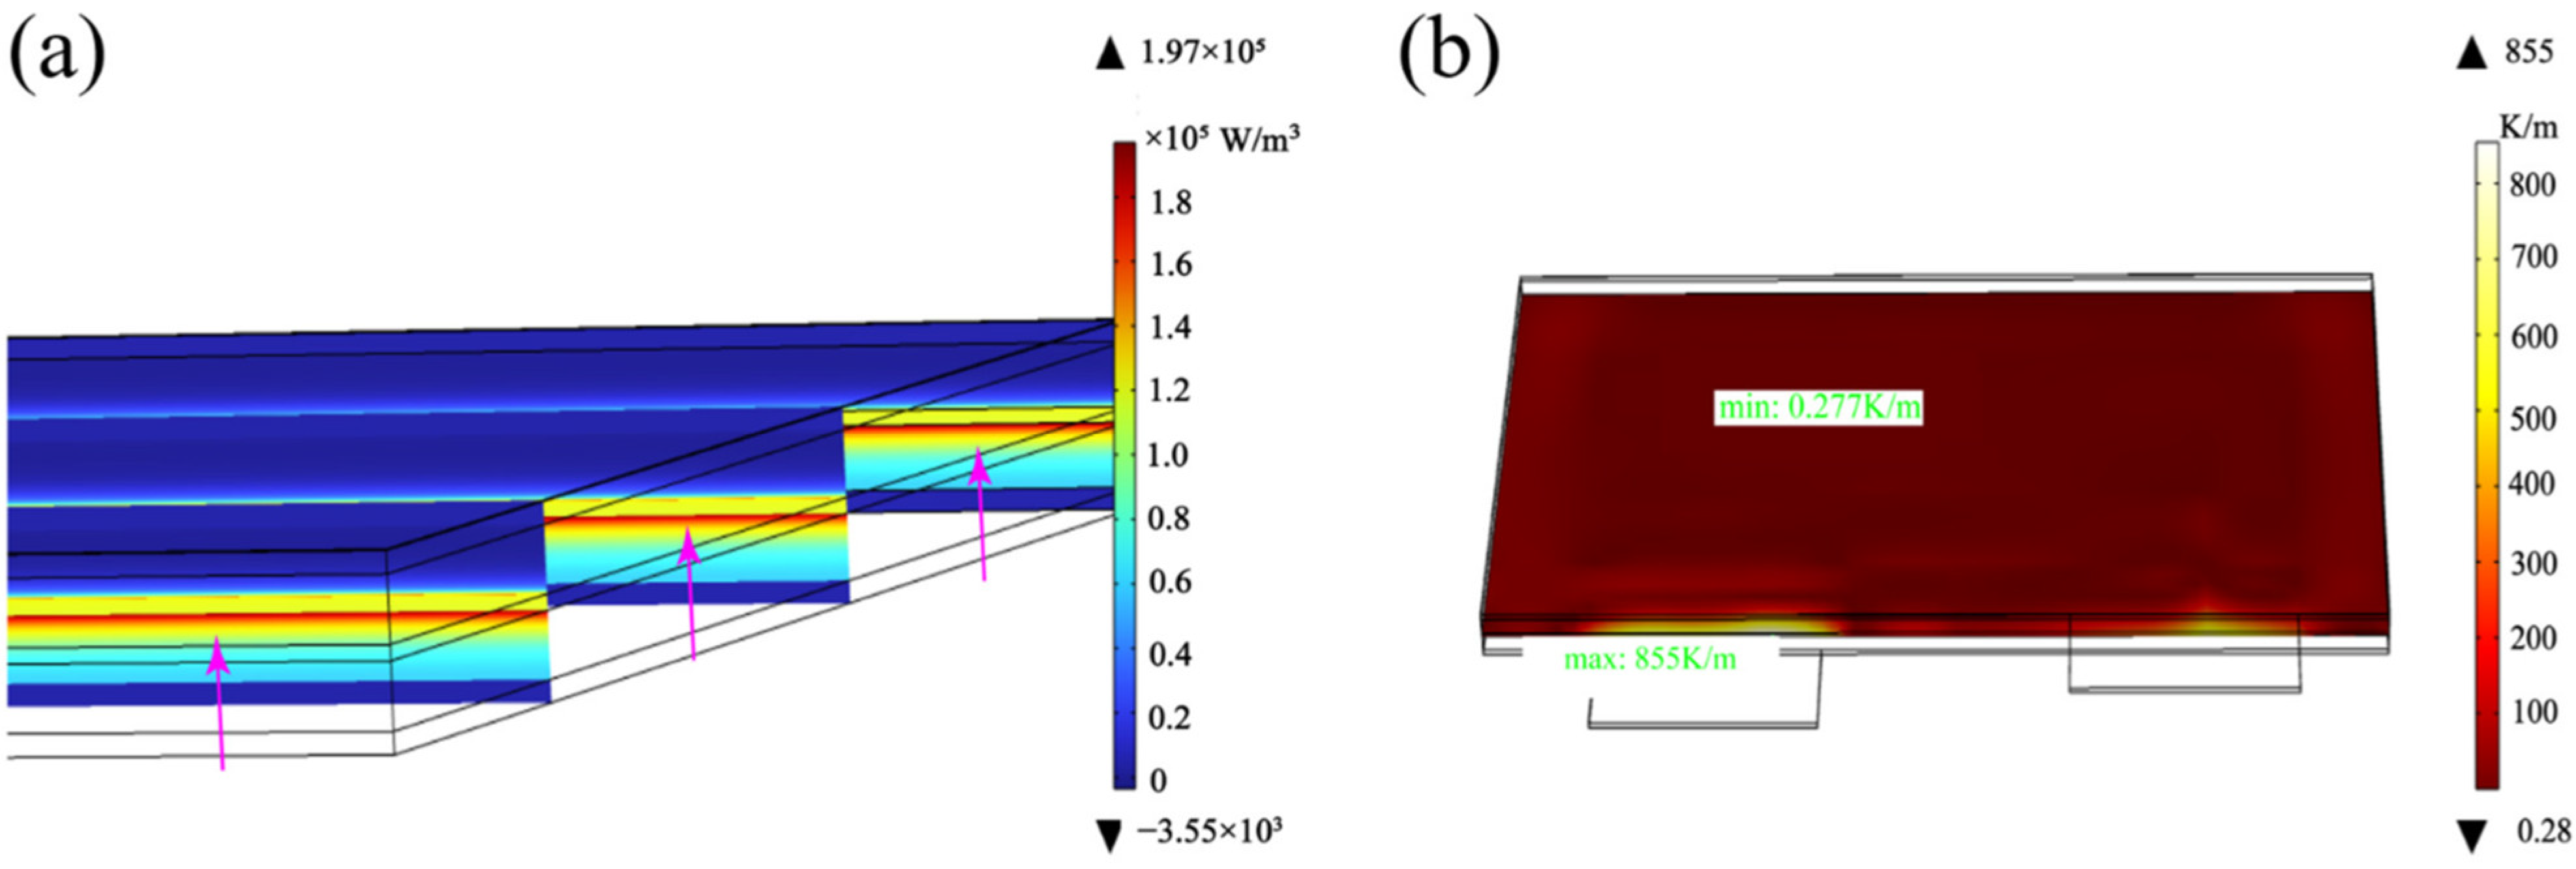
3.4.1. Radiation Preheating Temperature Field Changes

A simulation of the 1 C charging test was performed at −10 °C to observe changes in the voltage, capacity, and other parameters. The simulated voltage, current, and capacity curves of a constant current charging battery at −10 °C are shown in Figure 9a. Compared to charging at 20 °C, the charging time of the battery is prolonged in the low-temperature environment. The CC-CV charging method reaches a final capacity of only 840 mAh, 67.2% of the LMO pouch-cell-rated capacity. Thus, the LMO pouch cell has difficulty charging at low temperatures, and the available capacity is further reduced. This is related to the increased side reaction, and the decreased number of lithium ions embedded in the anode.
At the same time, the battery capacity increases with the number of embedded Li ions. This is related to the temperature and distribution of particles, average particle concentration on the electrode surface, and SOC. A further reduction in the negative electrolyte salt concentration, and an increased impedance occur, which affect the lithium-ion transport, and cause electrode capacity decay at low temperatures.
Figure 9b shows the changes in the battery discharge voltage and capacity during un-preheating and preheating at −10 °C. As expected, the discharge capacity of the battery with heating gradually rises to 1300 mAh compared with 500 mAh without irradiation. This indicates that the preheating strategy promotes the discharging process of low-temperature batteries, and decreases the side reaction of lithium ions, confirming the facilitation of the negative electrode detachment process of lithium ions.
The photothermal conversion efficiency is also related to the temperature gradient within the cell, so the cell heat production gradient and the temperature gradient were modelled, although it was confirmed that preheating has a catalytic effect on the increase in capacity. Under 10 W irradiation, the overall heat production gradient of the battery is concentrated in the range of 60,000–120,000 W/m3, as shown in Figure 10a, but the gradient between the negative electrode and the diaphragm surface is still large, which is caused by the thermal decomposition of the organic components within the negative SEI film during the charging process [35]. Figure 10 shows the temperature gradient of the LMO pouch cell and the diaphragm after preheating. As shown in Figure 10b, with the radiation heating process, the maximum heat gradient is distributed at the diaphragm near the negative side, reaching 855 K/m. However, the temperature gradient and temperature distribution at the surface are more uniform. The graph illustrates that the concentration gradients along the x and y directions are nearly identical, and do not produce apparent differences.

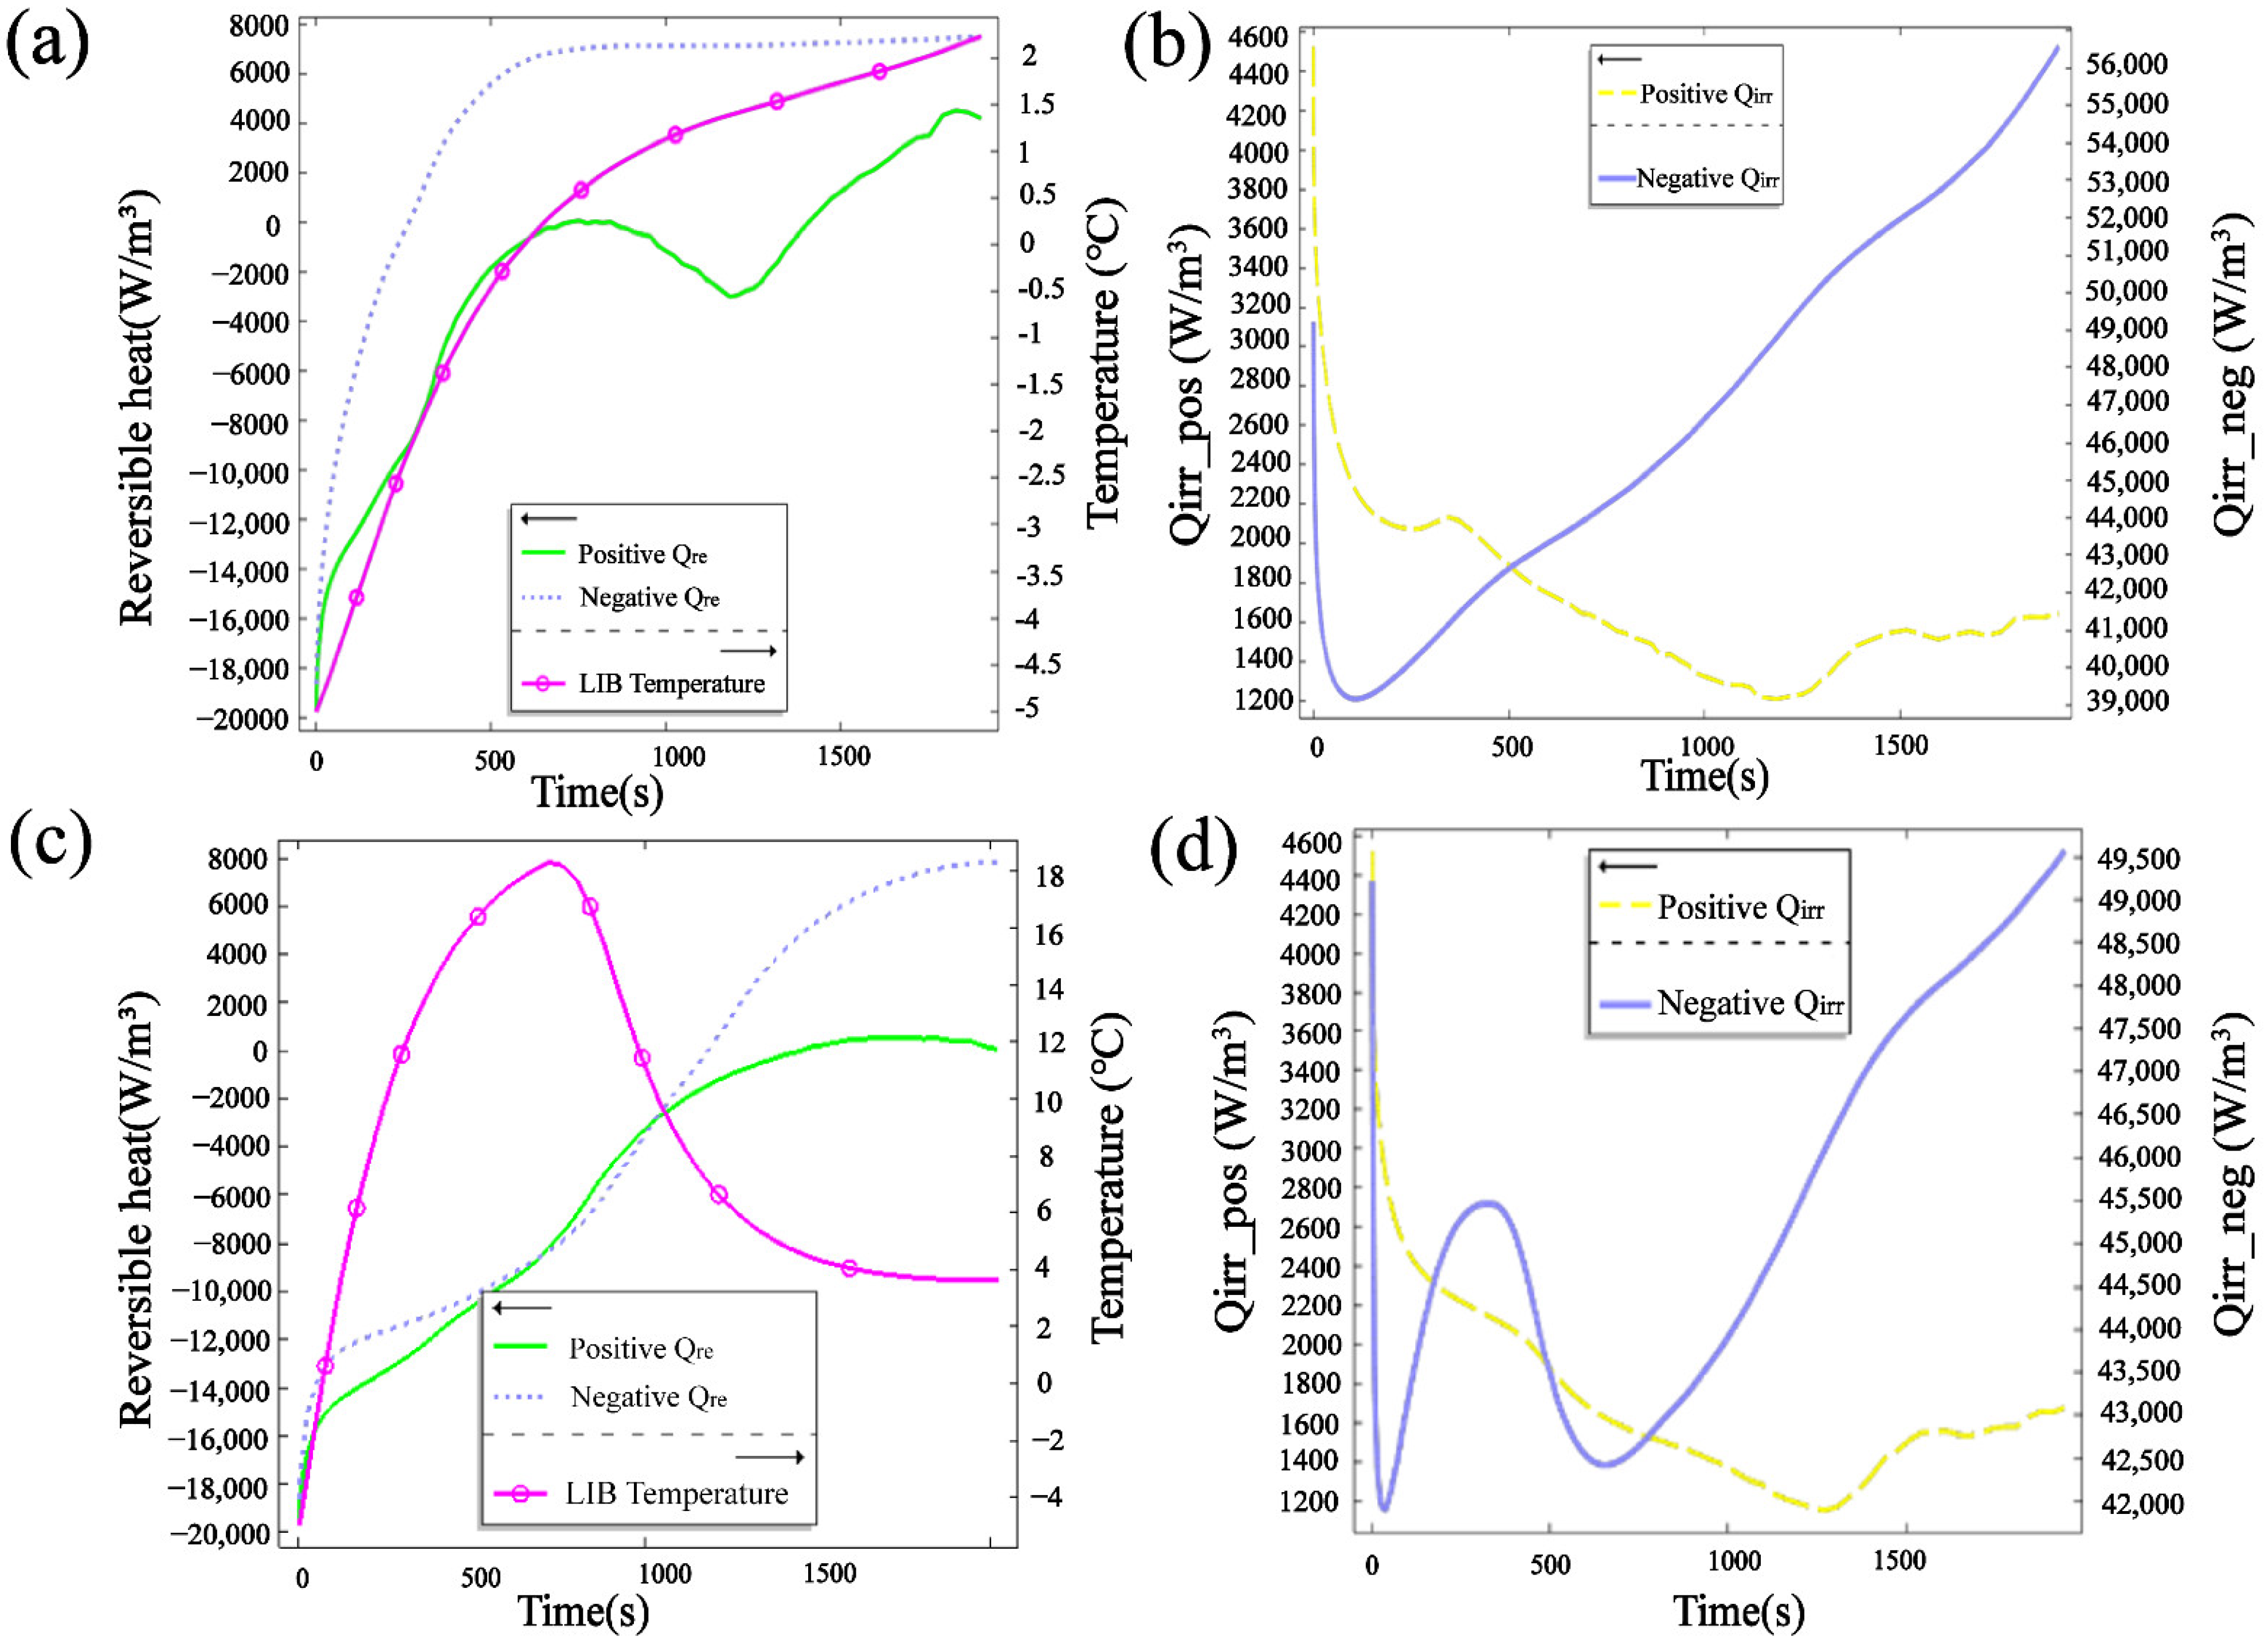
3.4.2. Thermal Behavior under Radiation Preheating

To further analyze the thermal effect under irradiation and without irradiation, with the help of the Bernadi heat generation equation, the reversible heat and irreversible heat of the anode and cathode under 1C charging are shown in Figure 11. As shown in Figure 11a, different charging stages showed different reversible heating generation. During the 0–1400 s CC charging stage, the LMO pouch cell was in the thermal absorption stage. During the 1400–1750 s period, the LMO pouch cell was in a stage of thermal release. During the 1750–2000 s period, in the final CV stage of the charging period, the positive reversible heat decreased, and the heat production of the reversible heat decreased. As shown in Figure 11b, the irreversible heat only decreased in the 0–100 s stage, with the negative irreversible heat up to 56,000 W/m3. In contrast, the positive irreversible heat was only between 1200–2000 W/m3, which comprised 3% of the pouch-cell heat production, much lower than the negative. This was caused by Ohmic internal resistance and polarized internal resistance in the low-temperature environment, and the uniform Li plating and the SEI layer covered by the negative and separator layers. At the same time, the graphite MCMB potential dropped to 0 V vs. Li/Li+ at low temperatures, causing negative overpotential, and the irreversible heat further increased.
Next, the pouch-cell thermal variation under irradiation per heating is shown in Figure 11c,d. To avoid overheating, the external radiation power reduced from 10 W to 1 W during the 1 C charging process. Under irradiation for 2000 s, shown in Figure 11c, after irradiation in the 10 W stage, the LMO pouch cell’s average temperature increased by 23 °C within 5 min; the heating rate was approximately 9 °C/min, indicating the good efficiency of the photothermal conversion. The pouch-cell Cu/SWCNT film design exhibited the best performance, which was better than the heating rate of 5 °C/min in the 2 C CC discharge preheat method, and 6.67 °C in the 2.8 V CV discharge method used by Ji et al. [6]. Furthermore, with a smaller external radiation intensity of 1 W, the battery temperature decreased to 4 °C. After 1200 s, the temperature gradually stabilized, due to the increased irreversible heat production dominated by Ohmic heat at the negative side in the late-charging period (Figure 11d), and the existence of an external convective heat exchange effect that caused the pouch cell’s temperature to gradually stabilize. This preheating approach could provide ideas for the design of a photothermal active controller, i.e., with the help of real-time cell-surface temperature collection, ultimately controlling the intensity of the received light, and thus the overall temperature of the cell.
At the same time, Figure 11c shows that after radiation preheating, the battery positive and negative reversible heat absorption stage periods were longer than in Figure 11a, and the amount of heat generation decreased. It can be seen that the heat generation of the negative increased after 1250 s, while the negative generated little thermal energy. At the same time, after pre-heating, the unit area positive reversible heat production rate decreased from 25 W/s in Figure 11a, to 16.25 W/s in Figure 11c during the 800 s charging period; this indicates that the proportion of reversible heat in the total heat release decreased as the cell temperature rose. As shown in Figure 11d, after the external irradiation with Cu/SWCNT, the pouch cell’s average temperature increased, and the amount of irreversible heat was between 42,500–49,500 W/m3, which was lower than Figure 12b without irradiation (39,500–56,000 W/m3). During the 0–400 s stage, as shown in Figure 11d, the negative irreversible heat showed a sharp increase, indicating that the resistance of the lithium ions increased during insertion into the negative electrode, due to the mismatch between the increase in the lithium-ion flux after the positive electrode was heated, and the high-resistance effect of the negative electrode under low temperature. Moreover, compared with Figure 11b, the amount of irreversible heat of the negative was between 42,500–49,500 W/m3, which was lower than in Figure 11b without irradiation (39,500–56,000 W/m3); the negative thermal generation still played a crucial role in the irreversible heat of the pouch cell. The irreversible heat production was also dominated by polarization heat and Ohmic heat.

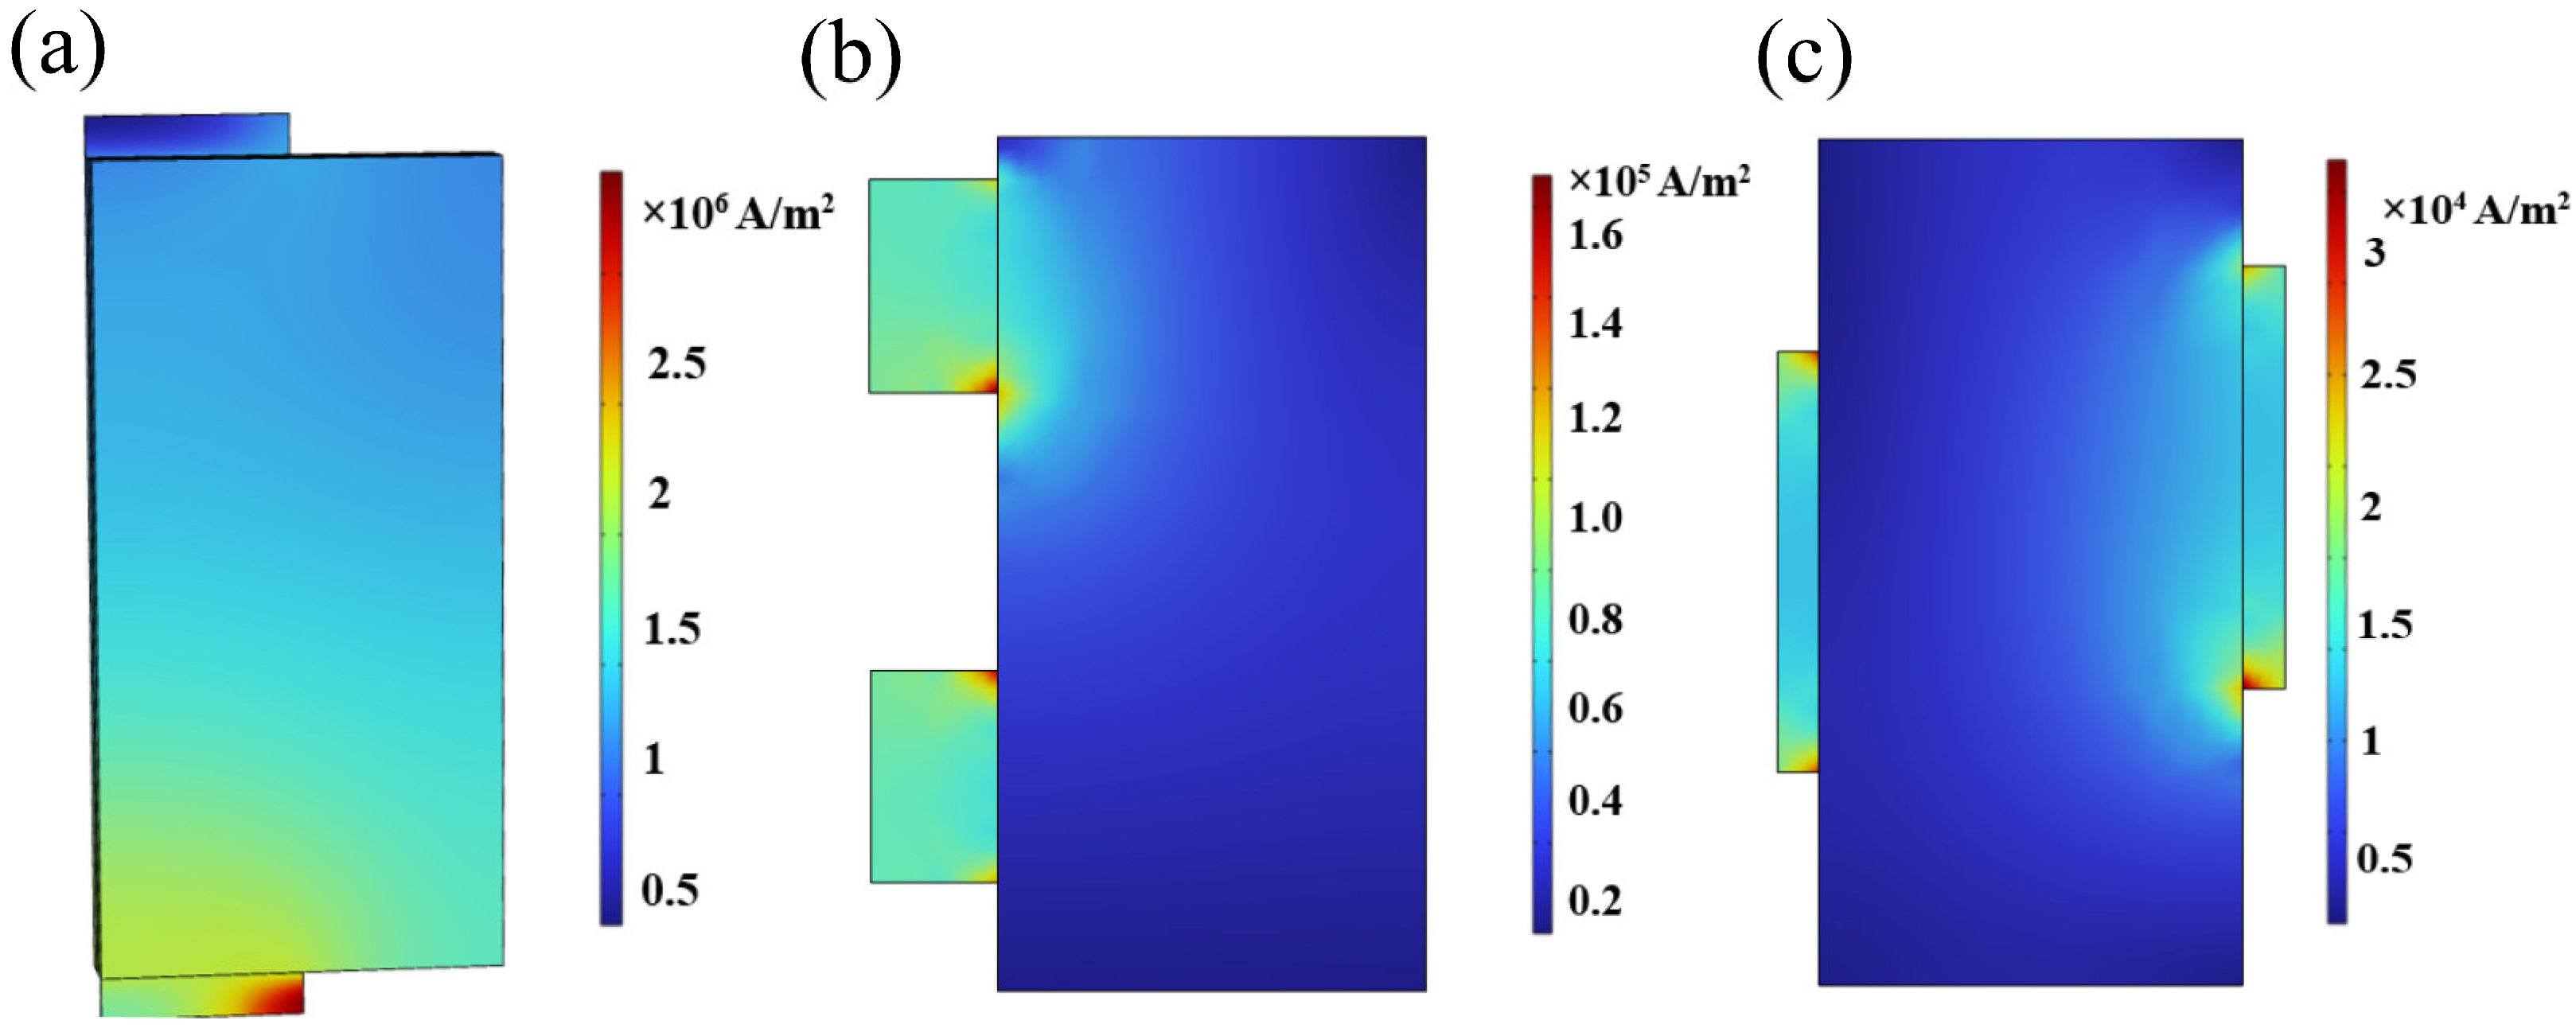
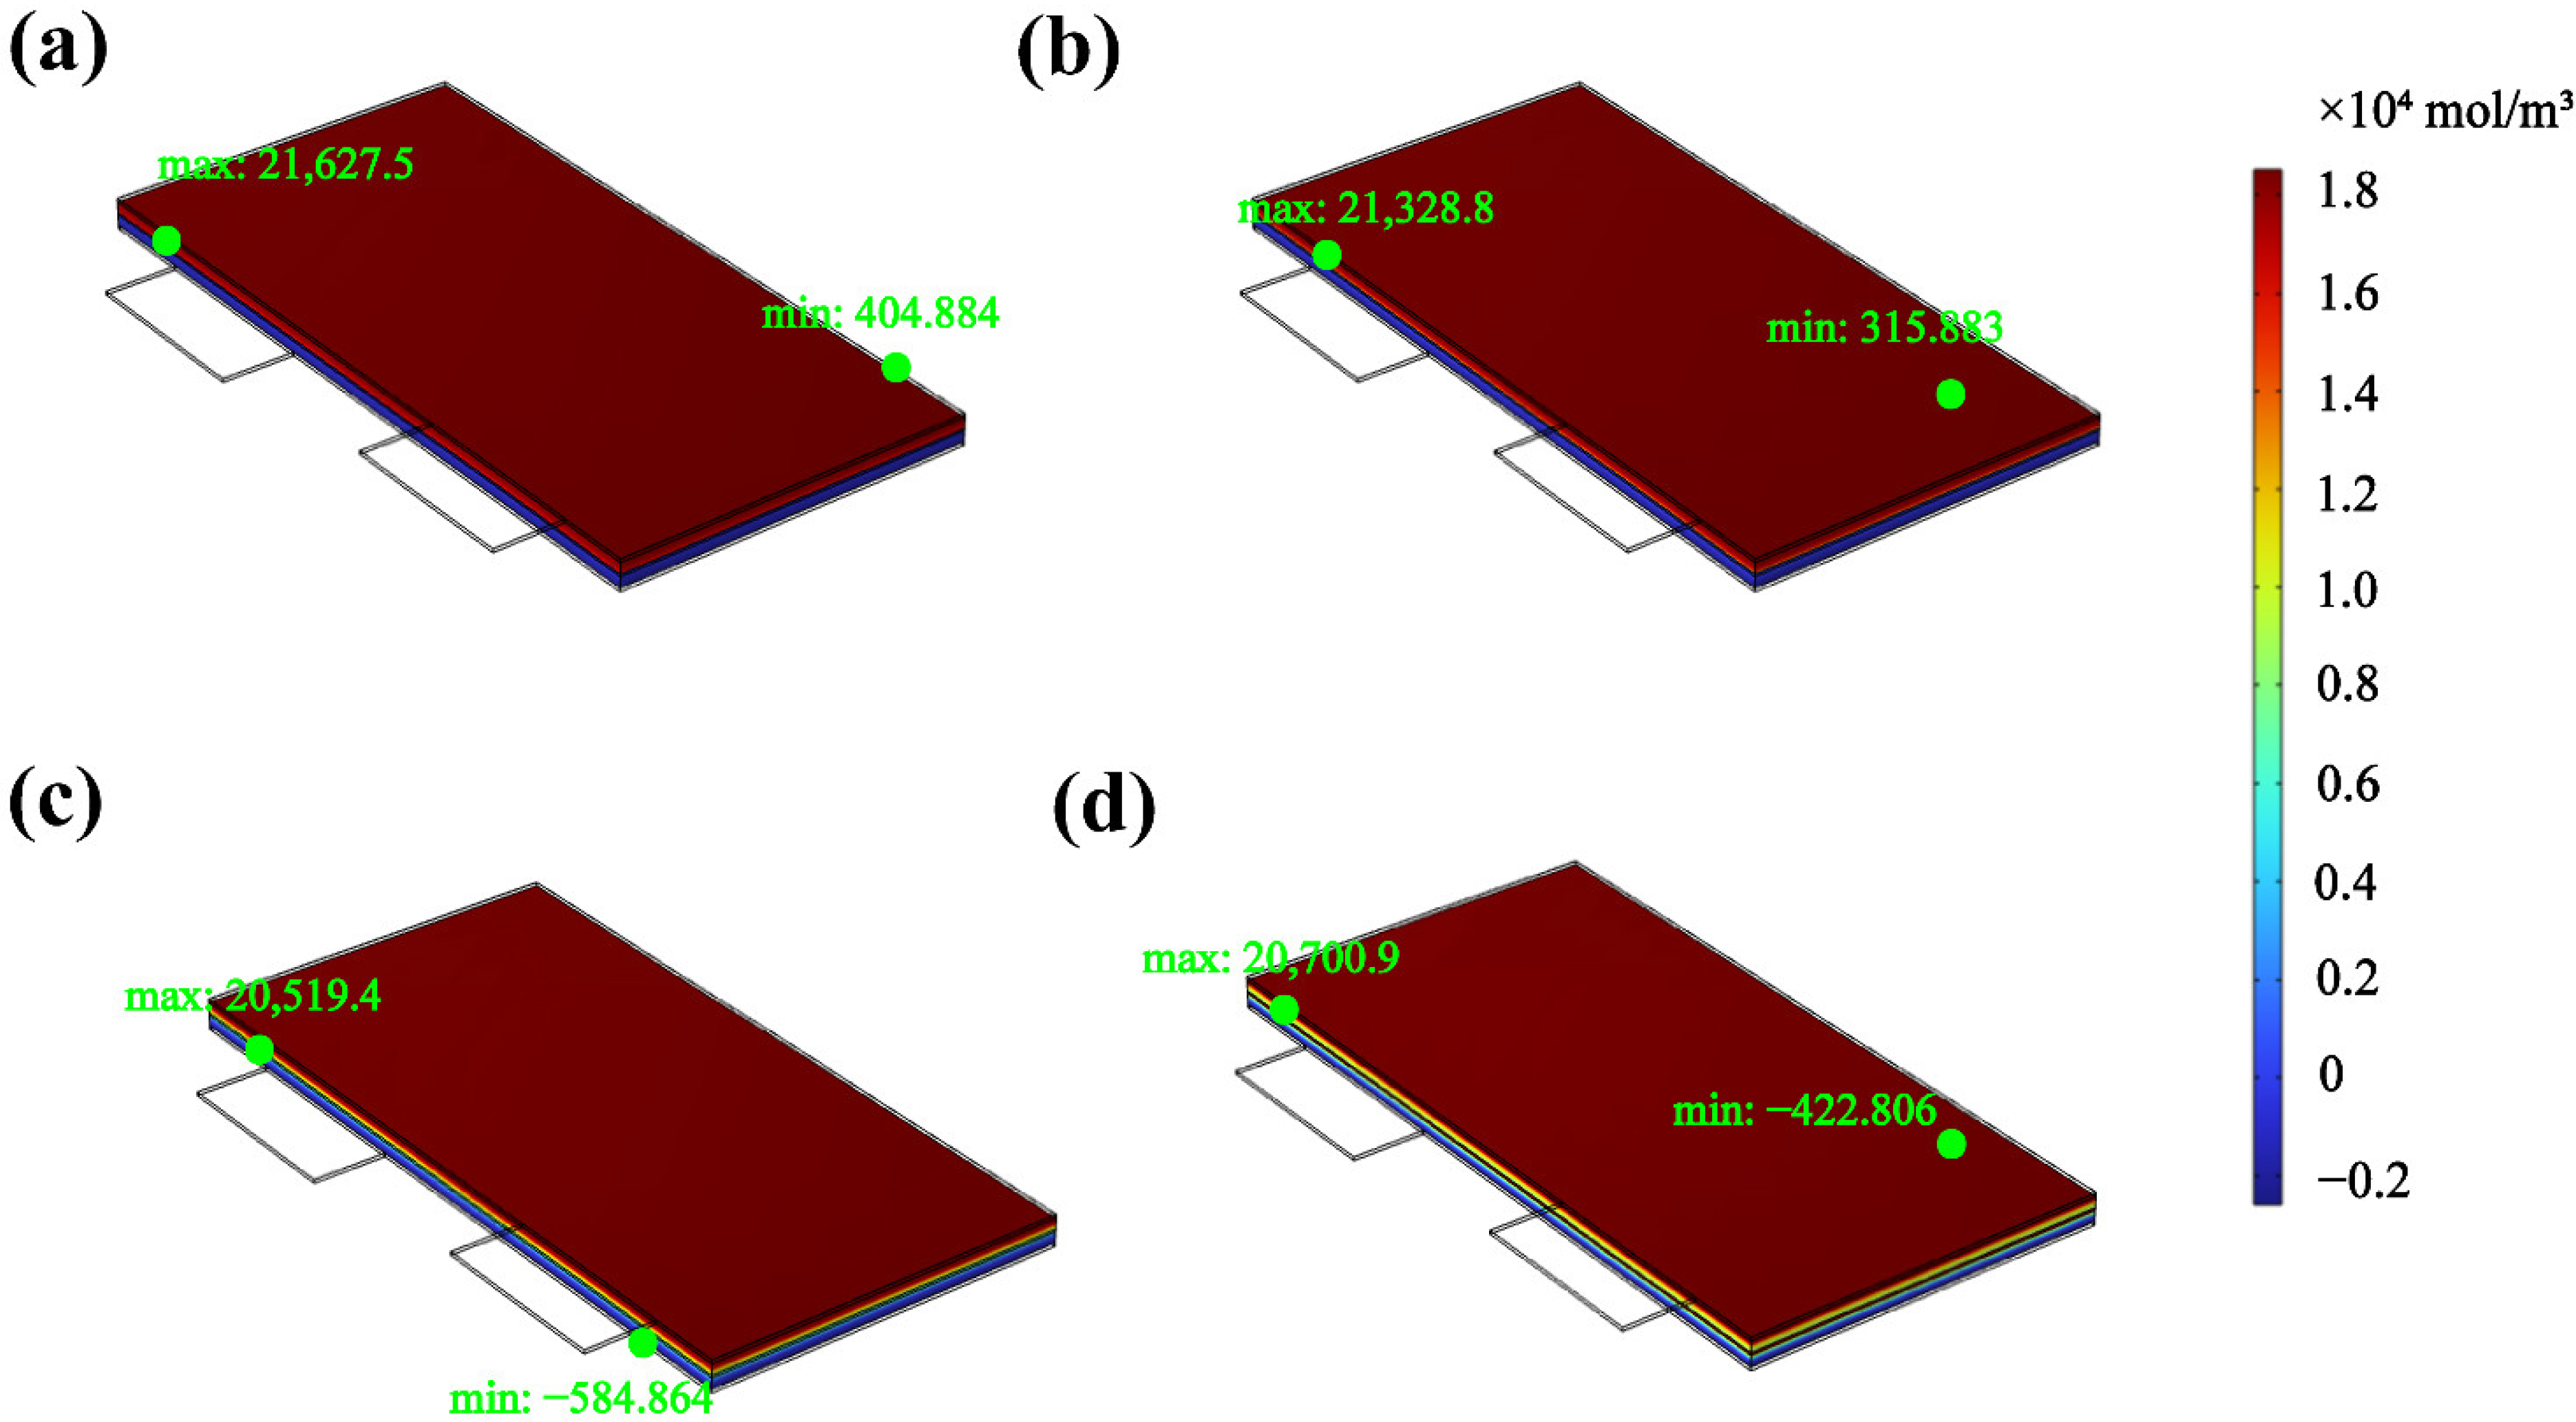
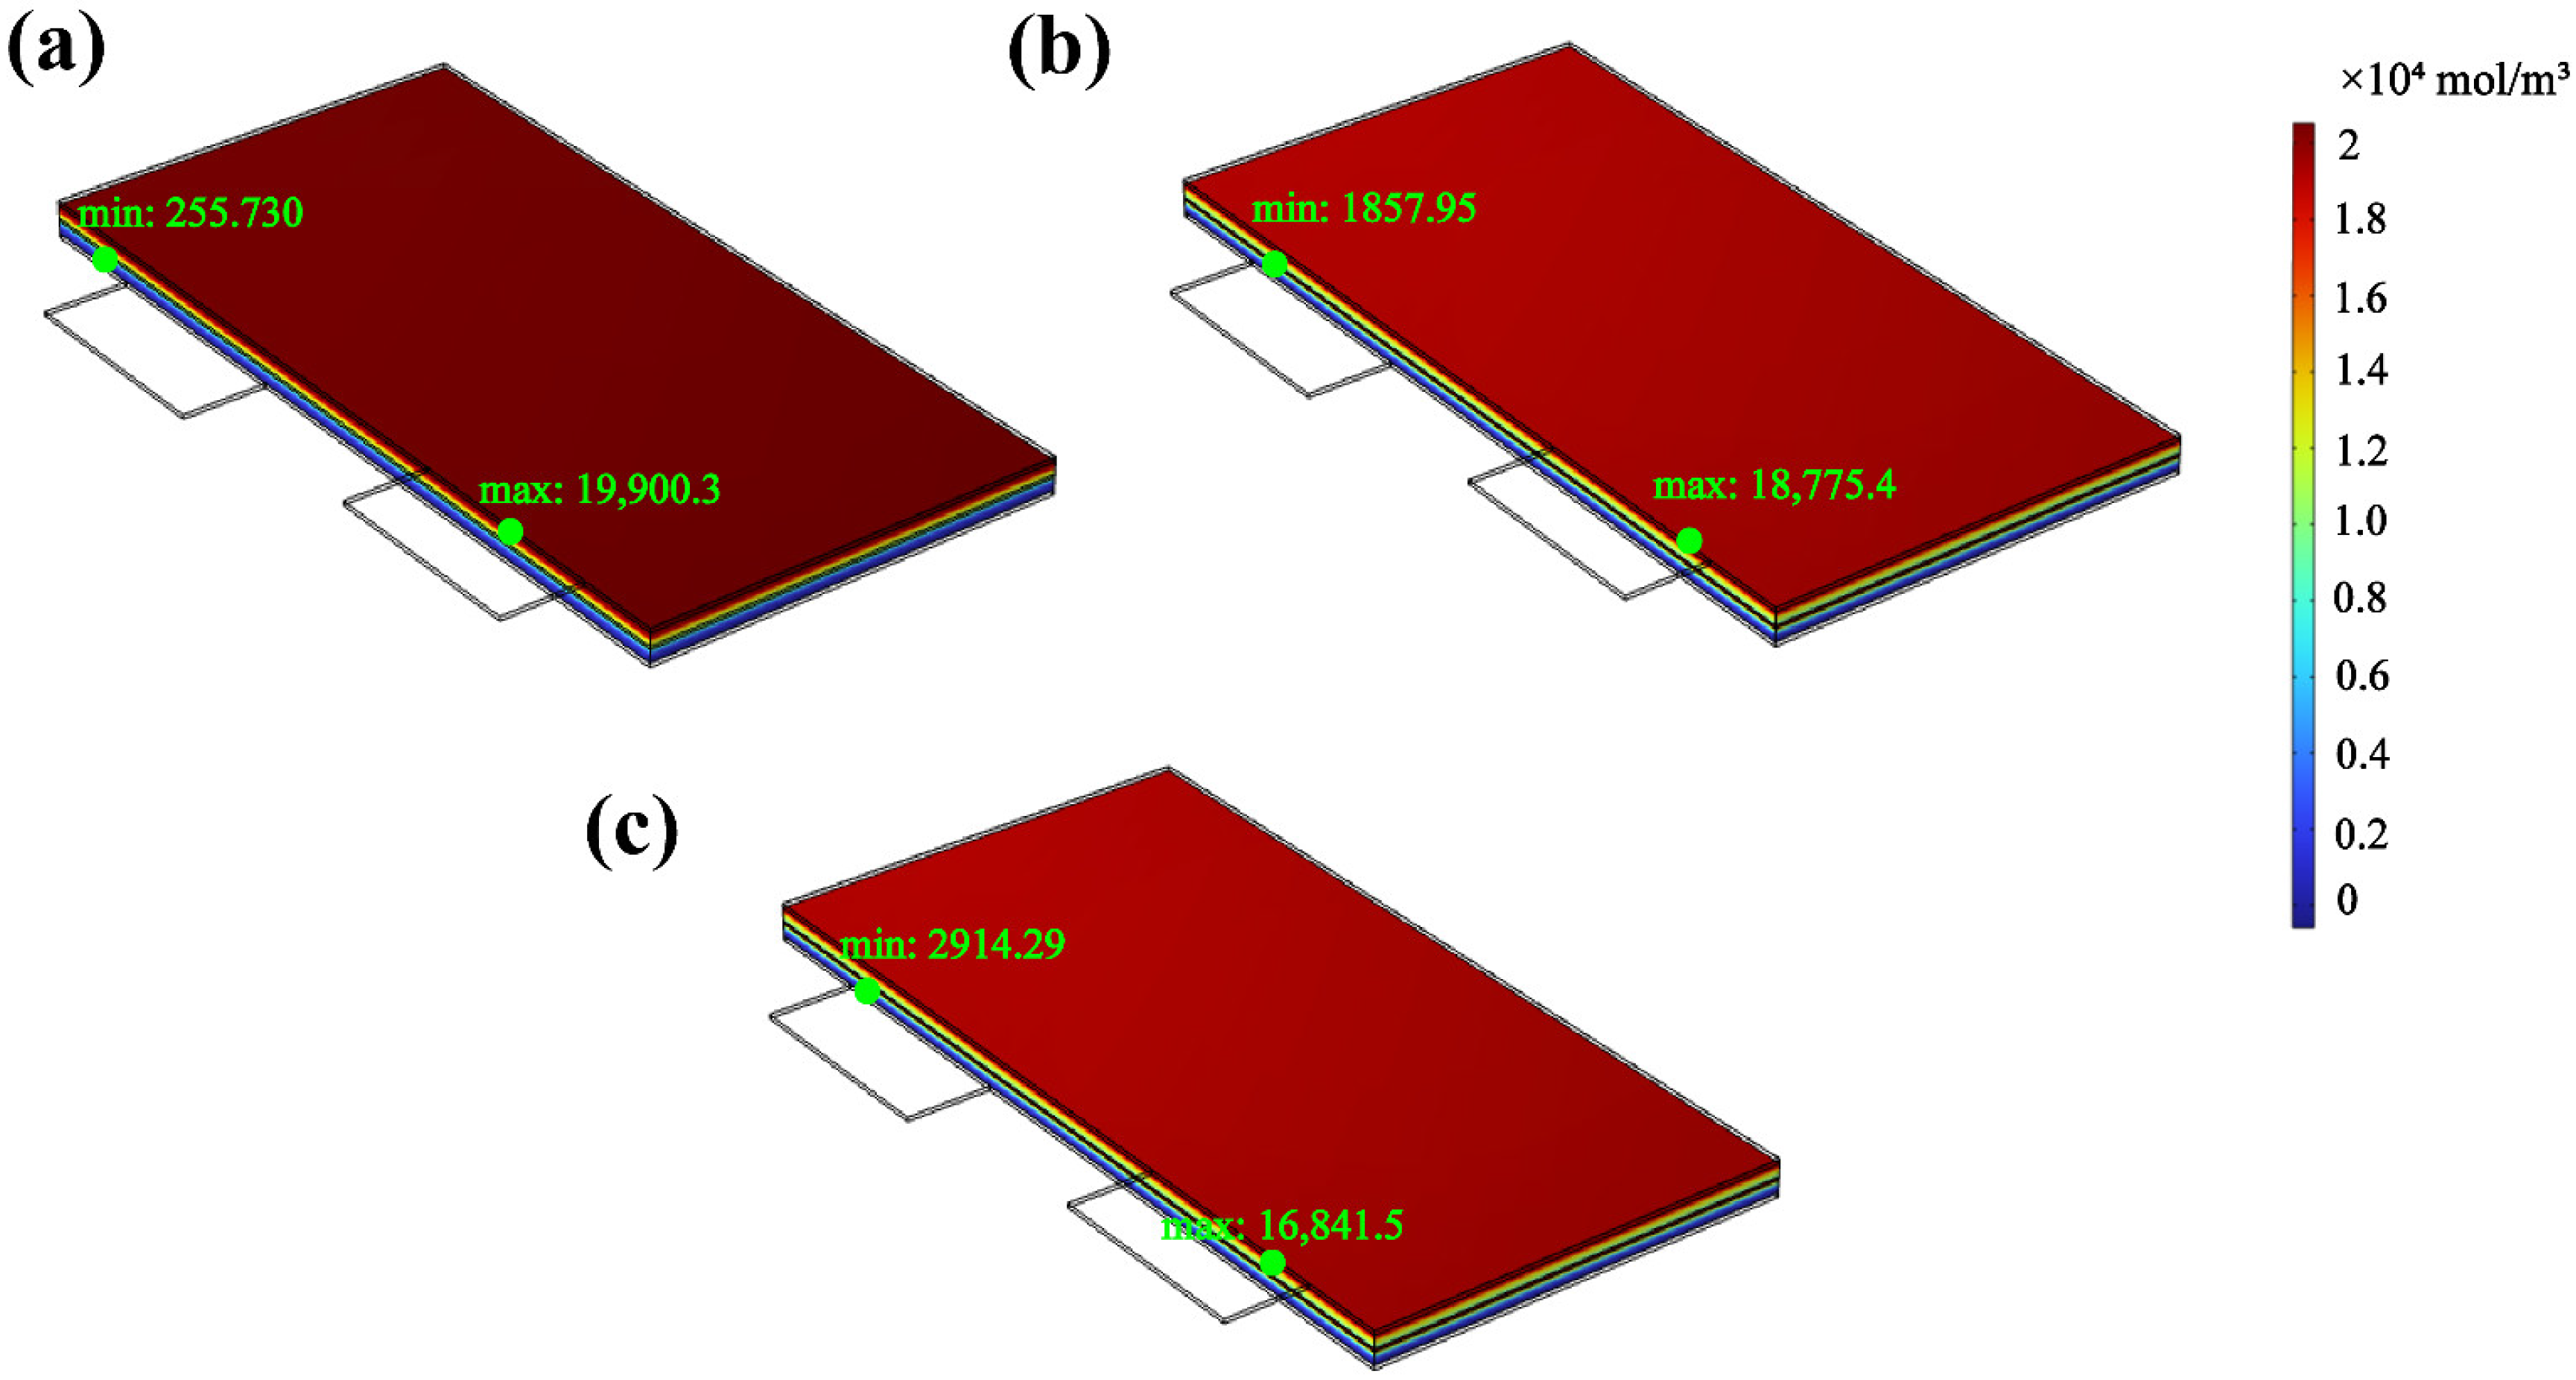
3.4.3. Change in the Lithium-Ion Flow

In order to better understand the mechanism of the lithium-ion transport behavior before and after pre-heating, we simulated the amount of lithium-ion embedding at different moments of the charge, to explain the main reasons for the improvement in performance due to pre-heating.
Radiation preheating has a catalytic effect on the lithium-ion flux. Figure 12 shows the number of lithium ions embedded in the battery during the 300 s, 400 s, 700 s, and 800 s stages of the pre-heating process. There was a smaller difference between the highest and lowest values, reaching 1011.92 mol/m3, 1397.45 mol/m3, 3390.95 mol/m3, and 4682.32 mol/m3, and the trend of the lithium flow decreased from the light source center to the edge. Because the irradiation power decreased from 10 W to 1 W at 400 s, we found that the difference in the lithium-ion flux continuously increased at 700 s and 800 s.
Compared with Figure 12, Figure 13 shows the embedded lithium-ion content without Cu/SWCNT film pre-heating, during 300 s, 400 s, 700 s, and 800 s. The results show that the maximum embedded lithium concentration, distributed evenly near the edge of the negative electrode, decreased from 2162.5 mol/m3 in 300 s to 20,700.9 mol/m3 in 800 s. We can see that the minimum embedded lithium concentration changed from 315.883 mol/m3 in 400 s, to −584.864 in 700 s, and −422.806 mol/m3 in 800 s. Most of the concentrations were distributed far from the rear side, indicating difficulty in embedding lithium ions, or significant side-reaction consumption of lithium ions. The low temperature greatly impacted the diffusion coefficient, which was not conducive to the transport and diffusion of lithium ions. This was consistent with the growth in the irreversible heat of the negative pole. The embedded lithium ion flux was under −5 °C without preheating irradiation, as shown in Figure 14. The simulation results show that, compared with Figure 13, from 300 s to 800 s, the lithium-ion flux without irradiation increased from 1100 s to 1900 s; however, the average embedding of lithium ions was still significantly lower than the average embedding of lithium ions using radiation preheating methods, which had a severe impact on the pouch cell’s life. This indicates the necessity of adopting outer irradiation.
Figure 12. Variation in the lithium-ion flux embedded in the anode of the pouch cell during charging with the Cu/SWCNT film under irradiation: (a) 300 s, (b) 400 s, (c) 700 s, (d) 800 s.
Batteries 09 00366 g012
At −5 °C without preheating, the 1100 s, 1500 s, and 1900 s anode lithium-ion embedding is shown in Figure 14. In the absence of radiation until after 1100 s, the anode was re-embedded with lithium ions. After this, the embedding particle concentration in the anode gradually increased, which indicates that low-temperature charging affected the electrode reaction kinetics, and affected lithium-ion transport. An enhanced negative lithium-ion embedding improved the battery capacity, which improved the battery capacity retention [36]. Meanwhile, the lithium-ion flux changed, and the current density distribution became more consistent.

4. Conclusions

We verified a numerical model of low-temperature LMO pouch-cell radiation preheating using theoretical simulations, and explored changes in the preheating and electrochemical performance. The following conclusions were obtained:
(1) After radiation preheating, the heat dissipation in the long-side lug preheating design was improved, compared to the narrow side lug design. The temperature difference outside the lugs dropped from 14 °C to 4 °C, which dropped by 72%. The surface temperature was distributed more evenly along the radiation center point, and the maximum temperature point of the battery only appeared on the lug side.
(2) With the high photothermal conversion capacity of the Cu/SWCNT atomic film, the temperature-rise rate of the LMO pouch cell in the preheating method reached 2.7 °C/min, which was better than the traditional low-temperature self-discharge heating method.
(3) The LMO pouch-cell release time was extended after radiation preheating. The increased irreversible heat of the anode inhibited the generation rate of reversible heat, and reducing the irradiation power inhibited the generation of polarization heat in the anode. The reversible entropy heat of the anode after preheating was greater than the reversible entropy heat of the cathode.
(4) This method improved the current density distribution of anodes, which is concentrated in the range of 4000~8000 mol/m3, and the insertion and embedding uniformity of lithium ions under low temperature was improved by 50%, compared to without illumination.
The adopted radiation preheating scheme provides an approach for low-temperature preheating of pouch cell, which can enhance the low-temperature performance at low winter temperatures. In the future, we will regulate and investigate photothermal conversion materials with different surface morphologies, to further improve photothermal conversion capabilities.

Supplementary Materials

The following supporting information can be downloaded at: https://www.mdpi.com/article/10.3390/batteries9070366/s1. Table S1: Comprehensive parameter of LMO pouch cell; Table S2: Subscripts; Figure S1: Panasonic UF653445ST commercial battery curves.

Author Contributions

Writing—original draft: S.T., conceptualization: Z.L., software: Q.Y., investigation: N.X., validation: X.L., project administration: D.W., supervision: R.L. and W.L. All authors have read and agreed to the published version of the manuscript.

Funding

This research was funded by the Ministry of Education of China, grant number 2021ALA03004, and the Department of Science and Technology of Jilin Province 20230201133GX.

Data Availability Statement

Data are available on request from the authors.

Conflicts of Interest

The authors declare no conflict of interest.

References

  1. Ma, S.-C.; Xu, J.-H.; Fan, Y. Characteristics and key trends of global electric vehicle technology development: A multi-method patent analysis. J. Clean. Prod. 2022, 338, 130502. [Google Scholar] [CrossRef]
  2. Piao, N.; Gao, X.; Yang, H.; Guo, Z.; Hu, G.; Cheng, H.-M.; Li, F. Challenges and development of lithium-ion batteries for low temperature environments. eTransportation 2022, 11, 100145. [Google Scholar] [CrossRef]
  3. Zhang, G.; Ge, S.; Xu, T.; Yang, X.-G.; Tian, H.; Wang, C.-Y. Rapid self-heating and internal temperature sensing of lithium-ion batteries at low temperatures. Electrochim. Acta 2016, 218, 149–155. [Google Scholar] [CrossRef]
  4. Ji, Y.; Wang, C.Y. Heating strategies for Li-ion batteries operated from subzero temperatures. Electrochim. Acta 2013, 107, 664–674. [Google Scholar] [CrossRef]
  5. Shang, Y.; Zhu, C.; Lu, G.; Zhang, Q.; Cui, N.; Zhang, C. Modeling and analysis of high-frequency alternating-current heating for lithium-ion batteries under low-temperature operations. J. Power Sources 2020, 450, 227435. [Google Scholar] [CrossRef]
  6. Wu, M.; Lin, X.; Wang, T.; Qiu, J.; Ma, T. Low-cost dye-sensitized solar cell based on nine kinds of carbon counter electrodes. Energy Environ. Sci. 2011, 4, 2308–2315. [Google Scholar] [CrossRef]
  7. Jakubinek, M.B.; Johnson, M.B.; White, M.A.; Guan, J.; Simard, B. Novel method to produce single-walled carbon nanotube films and their thermal and electrical properties. J. Nanosci. Nanotechnol. 2010, 10, 8151–8157. [Google Scholar] [CrossRef]
  8. Chen, K.; Gao, W.; Emaminejad, S.; Kiriya, D.; Ota, H.; Nyein, H.Y.; Takei, K.; Javey, A. Printed Carbon Nanotube Electronics and Sensor Systems. Adv. Mater. 2016, 28, 4397–4414. [Google Scholar] [CrossRef] [PubMed]
  9. Rao, R.; Pint, C.L.; Islam, A.E.; Weatherup, R.S.; Hofmann, S.; Meshot, E.R.; Wu, F.; Zhou, C.; Dee, N.; Amama, P.B.; et al. Carbon Nanotubes and Related Nanomaterials: Critical Advances and Challenges for Synthesis toward Mainstream Commercial Applications. ACS Nano 2018, 12, 11756–11784. [Google Scholar] [CrossRef] [Green Version]
  10. Murshed, S.M.S.; Nieto de Castro, C.A. Superior thermal features of carbon nanotubes-based nanofluids—A review. Renew. Sustain. Energy Rev. 2014, 37, 155–167. [Google Scholar] [CrossRef]
  11. Zhang, S.; Pang, J.; Li, Y.; Yang, F.; Gemming, T.; Wang, K.; Wang, X.; Peng, S.; Liu, X.; Chang, B.; et al. Emerging Internet of Things driven carbon nanotubes-based devices. Nano Res. 2022, 15, 4613–4637. [Google Scholar] [CrossRef]
  12. Yavari, F.; Koratkar, N. Graphene-Based Chemical Sensors. J. Phys. Chem. Lett. 2012, 3, 1746–1753. [Google Scholar] [CrossRef] [PubMed]
  13. Liu, T.; Zhang, M.; Wang, Y.L.; Wang, Q.Y.; Lv, C.; Liu, K.X.; Suresh, S.; Yin, Y.H.; Hu, Y.Y.; Li, Y.S.; et al. Engineering the Surface/Interface of Horizontally Oriented Carbon Nanotube Macrofilm for Foldable Lithium-Ion Battery Withstanding Variable Weather. Adv. Energy Mater. 2018, 8, 1802349. [Google Scholar] [CrossRef]
  14. Yang, X.-S. Modelling heat transfer of carbon nanotubes. Model. Simul. Mater. Sci. Eng. 2005, 13, 893–902. [Google Scholar] [CrossRef] [Green Version]
  15. Jin, X.Z.; Li, H.; Wang, Y.; Yang, Z.Y.; Qi, X.D.; Yang, J.H.; Wang, Y. Ultraflexible PEDOT:PSS/Helical Carbon Nanotubes Film for All-in-One Photothermoelectric Conversion. ACS Appl. Mater. Interfaces 2022, 14, 27083–27095. [Google Scholar] [CrossRef] [PubMed]
  16. Yu, F.; Li, J.; Jiang, Y.; Wang, L.; Yang, X.; Li, X.; Lü, W.; Sun, X. Boosting Low-Temperature Resistance of Energy Storage Devices by Photothermal Conversion Effects. ACS Appl. Mater. Interfaces 2022, 14, 23400–23407. [Google Scholar] [CrossRef] [PubMed]
  17. Wang, Q.; Ping, P.; Zhao, X.; Chu, G.; Sun, J.; Chen, C. Thermal runaway caused fire and explosion of lithium ion battery. J. Power Sources 2012, 208, 210–224. [Google Scholar] [CrossRef]
  18. Ngandjong, A.C.; Lombardo, T.; Primo, E.N.; Chouchane, M.; Shodiev, A.; Arcelus, O.; Franco, A.A. Investigating electrode calendering and its impact on electrochemical performance by means of a new discrete element method model: Towards a digital twin of Li-Ion battery manufacturing. J. Power Sources 2021, 485, 229320. [Google Scholar] [CrossRef]
  19. Sheikholeslami, M.; Shamlooei, M. Fe3O4–H2O nanofluid natural convection in presence of thermal radiation. Int. J. Hydrogen Energy 2017, 42, 5708–5718. [Google Scholar] [CrossRef]
  20. Dogonchi, A.S.; Nayak, M.K.; Karimi, N.; Chamkha, A.J.; Ganji, D.D. Numerical simulation of hydrothermal features of Cu–H2O nanofluid natural convection within a porous annulus considering diverse configurations of heater. J. Therm. Anal. Calorim. 2020, 141, 2109–2125. [Google Scholar] [CrossRef]
  21. Sheikholeslami, M.; Ghasemi, A. Solidification heat transfer of nanofluid in existence of thermal radiation by means of FEM. Int. J. Heat Mass Transf. 2018, 123, 418–431. [Google Scholar] [CrossRef]
  22. Larruquert, J.I.; Rodriguez-de Marcos, L.V.; Mendez, J.A.; Martin, P.J.; Bendavid, A. High reflectance ta-C coatings in the extreme ultraviolet. Opt. Express 2013, 21, 27537–27549. [Google Scholar] [CrossRef] [PubMed] [Green Version]
  23. Li, B.; Yang, Y.; Wu, N.; Zhao, S.; Jin, H.; Wang, G.; Li, X.; Liu, W.; Liu, J.; Zeng, Z. Bicontinuous, High-Strength, and Multifunctional Chemical-Cross-Linked MXene/Superaligned Carbon Nanotube Film. ACS Nano 2022, 16, 19293–19304. [Google Scholar] [CrossRef] [PubMed]
  24. Doyle, M.; Fuller, T.F.; Newman, J. Modeling of galvanostatic charge and discharge of the lithium/polymer/insertion cell. J. Electrochem. Soc. 1993, 140, 1526–1533. [Google Scholar] [CrossRef]
  25. Bahiraei, F.; Ghalkhani, M.; Fartaj, A.; Nazri, G.-A. A pseudo 3D electrochemical-thermal modeling and analysis of a lithium-ion battery for electric vehicle thermal management applications. Appl. Therm. Eng. 2017, 125, 904–918. [Google Scholar] [CrossRef]
  26. Yao, H.-R.; Yin, Y.-X.; Guo, Y.-G. Size effects in lithium ion batteries. Chin. Phys. B 2016, 25, 018203. [Google Scholar] [CrossRef]
  27. Goutam, S.; Nikolian, A.; Jaguemont, J.; Smekens, J.; Omar, N.; Van Dan Bossche, P.; Van Mierlo, J. Three-dimensional electro-thermal model of li-ion pouch cell: Analysis and comparison of cell design factors and model assumptions. Appl. Therm. Eng. 2017, 126, 796–808. [Google Scholar] [CrossRef]
  28. Yoon, Y.-H.; Song, J.-W.; Kim, D.; Kim, J.; Park, J.-K.; Oh, S.-K.; Han, C.-S. Transparent film heater using single-walled carbon nanotubes. Adv. Mater. 2007, 19, 4284–4287. [Google Scholar] [CrossRef]
  29. Gong, F.; Li, H.; Wang, W.; Huang, J.; Xia, D.; Liao, J.; Wu, M.; Papavassiliou, D.V. Scalable, eco-friendly and ultrafast solar steam generators based on one-step melamine-derived carbon sponges toward water purification. Nano Energy 2019, 58, 322–330. [Google Scholar] [CrossRef]
  30. Richter, F.; Vie, P.J.S.; Kjelstrup, S.; Burheim, O.S. Measurements of ageing and thermal conductivity in a secondary NMC-hard carbon Li-ion battery and the impact on internal temperature profiles. Electrochim. Acta 2017, 250, 228–237. [Google Scholar] [CrossRef]
  31. Bernardi, D.; Pawlikowski, E.; Newman, J. A General Energy Balance for Battery Systems. J. Electrochem. Soc. 2019, 132, 5–12. [Google Scholar] [CrossRef] [Green Version]
  32. Gerke, R.H. Temperature coefficient of electromotive force of galvanic cells and the entropy of reactions. J. Electrochem. Soc. 1922, 44, 1684–1704. [Google Scholar] [CrossRef]
  33. Rao, L.; Newman, J. Heat-Generation Rate and General Energy Balance for Insertion Battery Systems. J. Electrochem. Soc. 1997, 144, 2697–2704. [Google Scholar] [CrossRef]
  34. Gunnarshaug, A.F.; Vie, P.J.S.; Kjelstrup, S. Review—Reversible Heat Effects in Cells Relevant for Lithium-Ion Batteries. J. Electrochem. Soc. 2021, 168, 050522. [Google Scholar] [CrossRef]
  35. Son, K.; Hwang, S.M.; Woo, S.-G.; Paik, M.; Song, E.H.; Kim, Y.-J. Thermal and chemical characterization of the solid-electrolyte interphase in Li-ion batteries using a novel separator sampling method. J. Power Sources 2019, 440, 227083. [Google Scholar] [CrossRef]
  36. Lee, A.; Voros, M.; Dose, W.M.; Niklas, J.; Poluektov, O.; Schaller, R.D.; Iddir, H.; Maroni, V.A.; Lee, E.; Ingram, B.; et al. Photo-accelerated fast charging of lithium-ion batteries. Nat. Commun. 2019, 10, 4946. [Google Scholar] [CrossRef] [Green Version]
Figure 1. Schematic illustration of (a) three types of lug design of the LMO (LiMn2O4) pouch cells; (b) the Vis-NIR light source illumination test; (c) the preparation method for the Cu/SWCNT coating on the SiO2 substrate; (d) the structure of the pouch cell covered by Cu/SWCNT photothermal conversion film, and the heat-flow direction under illumination.
Batteries 09 00366 g001
Figure 2. Schematic diagram of the electrochemical P2D model of the LMO lithium-ion battery.
Batteries 09 00366 g002
Figure 3. Schematic diagram of the simulation validation: (a) CC-CV charging simulation curve of the pouch cell at 273.15 K with simulation; (b) constant 1C discharge curves of the pouch cell without preheating illumination at different temperatures (40 °C, 20 °C, 0 °C, −10 °C, −20 °C), with simulation.
Batteries 09 00366 g003
Figure 4. (ac) The surface temperature fields of different lug designs without Cu/SWCNT and illumination, measured in a 20 °C environment during constant current charging stage (heat insulation condition).
Batteries 09 00366 g004
Figure 5. (ac) Electrode current density distribution during 1 C charging at 20 °C of three different lug designs at CC charging 400 s.
Batteries 09 00366 g005
Figure 6. (a) The weighted average temperature variation in the LMO pouch cell during 1 C charge without irradiation for 4000 s. (b) The weighted average temperature variation of the Cu/SWCNT film surface with 10 W irradiation (0 s–800 s), 1 W irradiation (800 s–3000 s). (c) The thermal profile of LMO cathode entropy.
Batteries 09 00366 g006
Figure 7. (a) Temperature field distribution of the pouch cell at 400 s with Cu/SWCNT under 10 W irradiation. (b) Temperature field distribution at 1900 s with Cu/SWCNT under 1 W irradiation. (c) Surface plasmon resonance effects and electric field distributions of the Cu/SWCNT film under irradiation. (d) Electromagnetic power loss density of the Cu/SWCNT film surface under irradiation.
Batteries 09 00366 g007
Figure 8. (a) Distribution of reversible thermal sections of the LMO pouch cell for charging at 400 s without radiation heating. (b) Distribution of reversible thermal sections of the LMO pouch cell with constant current charging without radiation heating at −5 °C, 1140 s.
Batteries 09 00366 g008
Figure 9. Simulation diagram of the LMO pouch-cell charging curves. (a) Voltage, current and capacity curves under −10 °C CC-CV charging without Cu/SWCNT irradiation for 100 min. (b) Voltage and capacity curves of the pouch cell under 1C discharge, with and without Cu/SWCNT film illumination at −10 °C.
Batteries 09 00366 g009
Figure 10. (a) The LMO pouch-cell inner heat production gradient, after pre-heating under 10 W irradiation at 400 s. (b) Maximum and minimum temperature gradients of the pouch cell, after pre-heating under 1 W irradiation.
Batteries 09 00366 g010
Figure 11. (a) The negative and positive reversible heat and overall temperature change in the LMO pouch cell without radiation. (b) The negative and positive irreversible heat of the pouch cell without radiation. (c) The negative and positive reversible heat and overall temperature change in the pouch cell when the radiation intensity is reduced from 10 W to 1 W at 400 s during the 2000 s of charging. (d) The negative and positive irreversible heat of the pouch cell when the radiation intensity is reduced from 10 W to 1 W at 400 s during the 2000 s of charging.
Batteries 09 00366 g011
Figure 13. Variation in the lithium-ion flux embedded in the anode of the pouch cell during charging without Cu/SWCNT film irradiation at −5 °C: (a) 300 s, (b) 400 s, (c) 700 s, (d) 800 s.
Batteries 09 00366 g013
Figure 14. Schematic diagram of the maximum and minimum values of the lithium-ion embedding in the anode of the LMO pouch cell at −5 °C without preheating irradiation: (a) 1100 s, (b) 1500 s, (c) 1900 s.
Batteries 09 00366 g014
Disclaimer/Publisher’s Note: The statements, opinions and data contained in all publications are solely those of the individual author(s) and contributor(s) and not of MDPI and/or the editor(s). MDPI and/or the editor(s) disclaim responsibility for any injury to people or property resulting from any ideas, methods, instructions or products referred to in the content.

