Article

State of Health Trajectory Prediction Based on Multi-Output Gaussian Process Regression for Lithium-Ion Battery

1
Graduate School of Science and Technology, Hirosaki University, Hirosaki 036-8560, Japan
2
School of Mechanical and Electrical Engineering, University of Electronic Science and Technology of China, Chengdu 611731, China
3
College of Mechanical and Vehicle Engineering, Chongqing University, Chongqing 400044, China
4
Xinjiang Coal Mine Electromechanical Engineering Technology Research Center, Xinjiang Institute of Engineering, Urumqi 830023, China
*
Authors to whom correspondence should be addressed.
Batteries 2022, 8(10), 134; https://doi.org/10.3390/batteries8100134
Submission received: 19 August 2022 / Revised: 16 September 2022 / Accepted: 19 September 2022 / Published: 21 September 2022

Abstract

:
Lithium-ion battery state of health (SOH) accurate prediction is of great significance to ensure the safe reliable operation of electric vehicles and energy storage systems. However, safety issues arising from the inaccurate estimation and prediction of battery SOH have caused widespread concern in academic and industrial communities. In this paper, a method is proposed to build an accurate SOH prediction model for battery packs based on multi-output Gaussian process regression (MOGPR) by employing the initial cycle data of the battery pack and the entire life cycling data of battery cells. Firstly, a battery aging experimental platform is constructed to collect battery aging data, and health indicators (HIs) that characterize battery aging are extracted. Then, the correlation between the HIs and the battery capacity is evaluated by the Pearson correlation analysis method, and the HIs that own a strong correlation to the battery capacity are screened. Finally, two MOGPR models are constructed to predict the HIs and SOH of the battery pack. Based on the first MOGPR model and the early HIs of the battery pack, the future cycle HIs can be predicted. In addition, the predicted HIs and the second MOGPR model are used to predict the SOH of the battery pack. The experimental results verify that the approach has a competitive performance; the mean and maximum values of the mean absolute error (MAE) and root mean square error (RMSE) are 1.07% and 1.42%, and 1.77% and 2.45%, respectively.

1. Introduction

1.1. Literature Review

For numerous advantages, lithium-ion batteries have been widely used in electric vehicles, consumer electronics devices, and energy storage systems [1,2]. Like many electrochemical systems, the repeated charging and discharging during the application of batteries inevitably cause gradual aging, resulting in an increase in internal resistance and a decrease in capacity. In the later stage of battery aging, it can more easily cause failure or fire, and the method to enhance the performance and safety of lithium-ion battery systems is a critical research hotspot [3]. Prognostic and Health Management has been one of the indispensable functions of the battery management system. Generally, the aging degree of the battery is characterized by State of health (SOH). SOH is defined as the ratio of the maximum available capacity to the rated capacity. According to the different application fields of lithium-ion batteries, the battery is usually considered to approach its end of life when its capacity reaches 80% of the normal value or its internal resistance increases to twice the initial value [4]. Existing studies have shown that lithium-ion battery SOH prediction methods can be classified into electrochemical-based methods (EM) [5,6,7], equivalent circuit-based methods (ECM) [8,9], and data-driven methods (DDM) [10,11].
The relevant mathematical techniques can simplify the EM, which is established through the mathematical modeling of the internal mechanism of the battery and can be used to predict battery SOH. Nonetheless, the aging models based on different side reactions inside the battery are usually coupled with some partial differential equations [12], leading to some deficiencies such as high computational costs and hindering their applicability. Unlike EM, ECM is the most commonly used model that combines voltage sources, resistors, capacitors, and other components. The computational cost of this model is small, and its parameters are easy to identify. As a complex, nonlinear time-varying system, it is difficult to establish a model for the battery to characterize dynamic properties accurately. The data-driven approach does not consider the battery operating mechanism and aging mechanism compared with the model-based approach. It does not require a specific physical model, meaning it is more flexible. In addition, data-driven approaches typically treat the battery as a “black box” that maps external measurements such as voltage, current, and temperature to capacity based on machine learning algorithms.
With the continuous progress of computer technology and artificial intelligence technology, data-driven methods in battery health research receive more attention than physical methods due to their flexibility and model-free characteristics [13]. The following are data-driven methods for battery health prognostics: an artificial neural network (ANN) [14], a support vector machine (SVM) [6,15], a relevance vector machine (RVM) [16], and a Gaussian process regression (GPR) [17,18]; the advantages and disadvantages of the four approaches are listed in Table 1 [10].
Compared with ANN, RVM, and SVM, the GPR model has better adaptability to deal with complex issues such as high-dimensional data, small samples, non-parameters, uncertainty expression, and nonlinearity. At the same time, the GPR model has received widespread attention in battery SOH research. Liu et al. [19] successfully prognosticated the cycle capacity of lithium-ion batteries based on the improved single-output Gaussian process regression (SOGPR) model. Li et al. [20] used the SOGPR to prognosticate the SOH of a battery with satisfactory accuracy. However, the SOGPR model cannot fully utilize the information of other batteries as prior knowledge to accurately predict the SOH of the target battery. To cope with this shortcoming, Zheng et al. [21] proposed a multiple SOGPR model to achieve the prediction of battery SOH based on different weights, but this method requires a large amount of computation. In order to further overcome the shortcomings of SOGPR, Boyle et al. [22] regarded the Gaussian process as a convolution between a smoothing kernel and Gaussian white noise.
Multi-output Gaussian process regression (MOGPR) [23,24] utilizes a covariance matrix for each channel to model their possible dependencies and each channel can use the information of other channels to enhance performance. Richardson et al. [25] employed the SOGPR to predict battery SOH directly and predicted the capacity based on the MOGPR and the correlation between different battery cells. However, research on the SOH prediction of battery packs is still rare. In addition, most of the above studies mainly use the NASA public data set to conduct the battery SOH estimation, but the data set was collected in 2008, and the cycle life of batteries is less than 200 cycles. Due to the rapid development of battery technology, this dataset is not suitable for the current commercial batteries, which usually have a larger capacity and a longer cycling life.

1.2. The Thought of This Paper

It is still challenging to achieve an accurate SOH prediction of battery packs only using early aging data of the pack. To this end, this paper proposes a method to build an accurate SOH prediction model for battery packs based on the MOGPR by employing the entire life cycling data of battery cells and the initial cycle data of the battery pack. Firstly, a battery aging experimental platform is constructed to collect battery aging data, and health indicators (HIs) that characterize battery aging are extracted. Then, we use correlation coefficients to evaluate the correlation between the HIs and the capacity, and the HIs that have a strong correlation to the battery capacity are screened. Finally, two MOGPR prediction models are constructed, namely, an MOGPR HIs prediction model and an MOGPR SOH prediction model. The MOGPR HIs prediction model is trained by employing the first 20% cycle HIs of the battery pack and the entire life cycle HIs of the battery cell. Based on this model, the future cycle HIs of the battery pack can be obtained. The MOGPR SOH prediction model is established by using the early HIs and SOH data of the battery pack as a training sample. Based on this model and the predicted HIs, the future SOH of the battery pack can be predicted.
The method consists of three main parts: data acquisition, model construction, and health prognostics, as shown in Figure 1. First, the battery aging experiment platform is built to collect the battery aging data such as voltage, current, capacity, and temperature. Secondly, the HIs are extracted from the charge/discharge aging experimental data and filtered by using the correlation analysis method. Additionally, they are combined with the MOGPR to construct the battery SOH prediction model. Finally, the SOH-predicted results of the battery cells and packs are evaluated by three metrics.
The contributions of this paper are as follows:
(1)
Two HIs, namely, cycle number and standard deviation of discharge capacity (stdQ) are combined to achieve a highly accurate SOH prediction for battery packs.
(2)
The proposed MOGPR model can maintain a high-precision SOH prediction of battery cells and battery packs under different working conditions.
(3)
Only 20% early aging data of battery packs are employed to achieve an accurate SOH trajectory prediction for the battery pack, which saves lots of time and energy in whole-life aging tests of battery packs.
The remaining sections of this paper are as follows: Section 2 analyzes the results; Section 3 is the experimental testing; Section 4 extracts and evaluates the HIs from the experimental aging data; the methodology is described in Section 5; the conclusions of this paper are given in the end.

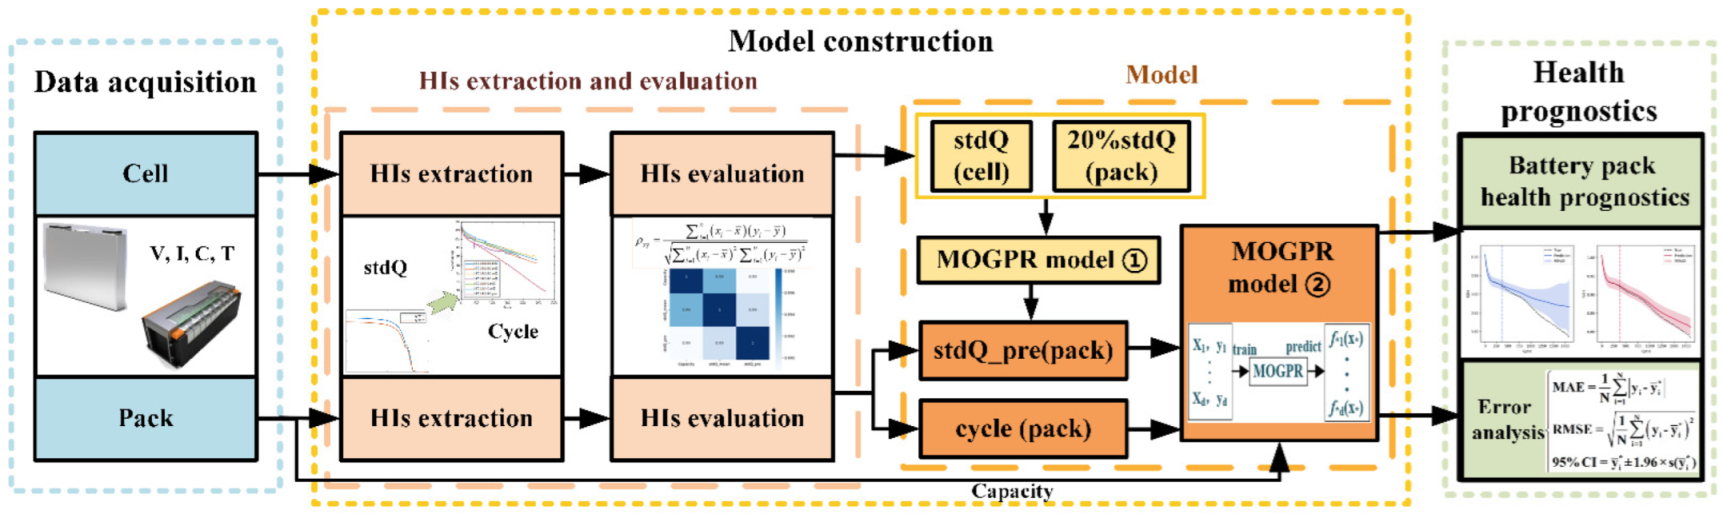
2. Results and Discussion

In this section, the HIs prediction model and the SOH prediction model based on the MOGPR are validated by using the aging experimental data of battery cells and battery packs. The battery pack stdQ prediction results based on the MOGPR model are presented in Section 2.1. In Section 2.2, the SOH prediction results of battery cells under different models and working conditions are presented, while the SOH prediction results of the battery pack under different models are illustrated in Section 2.3.

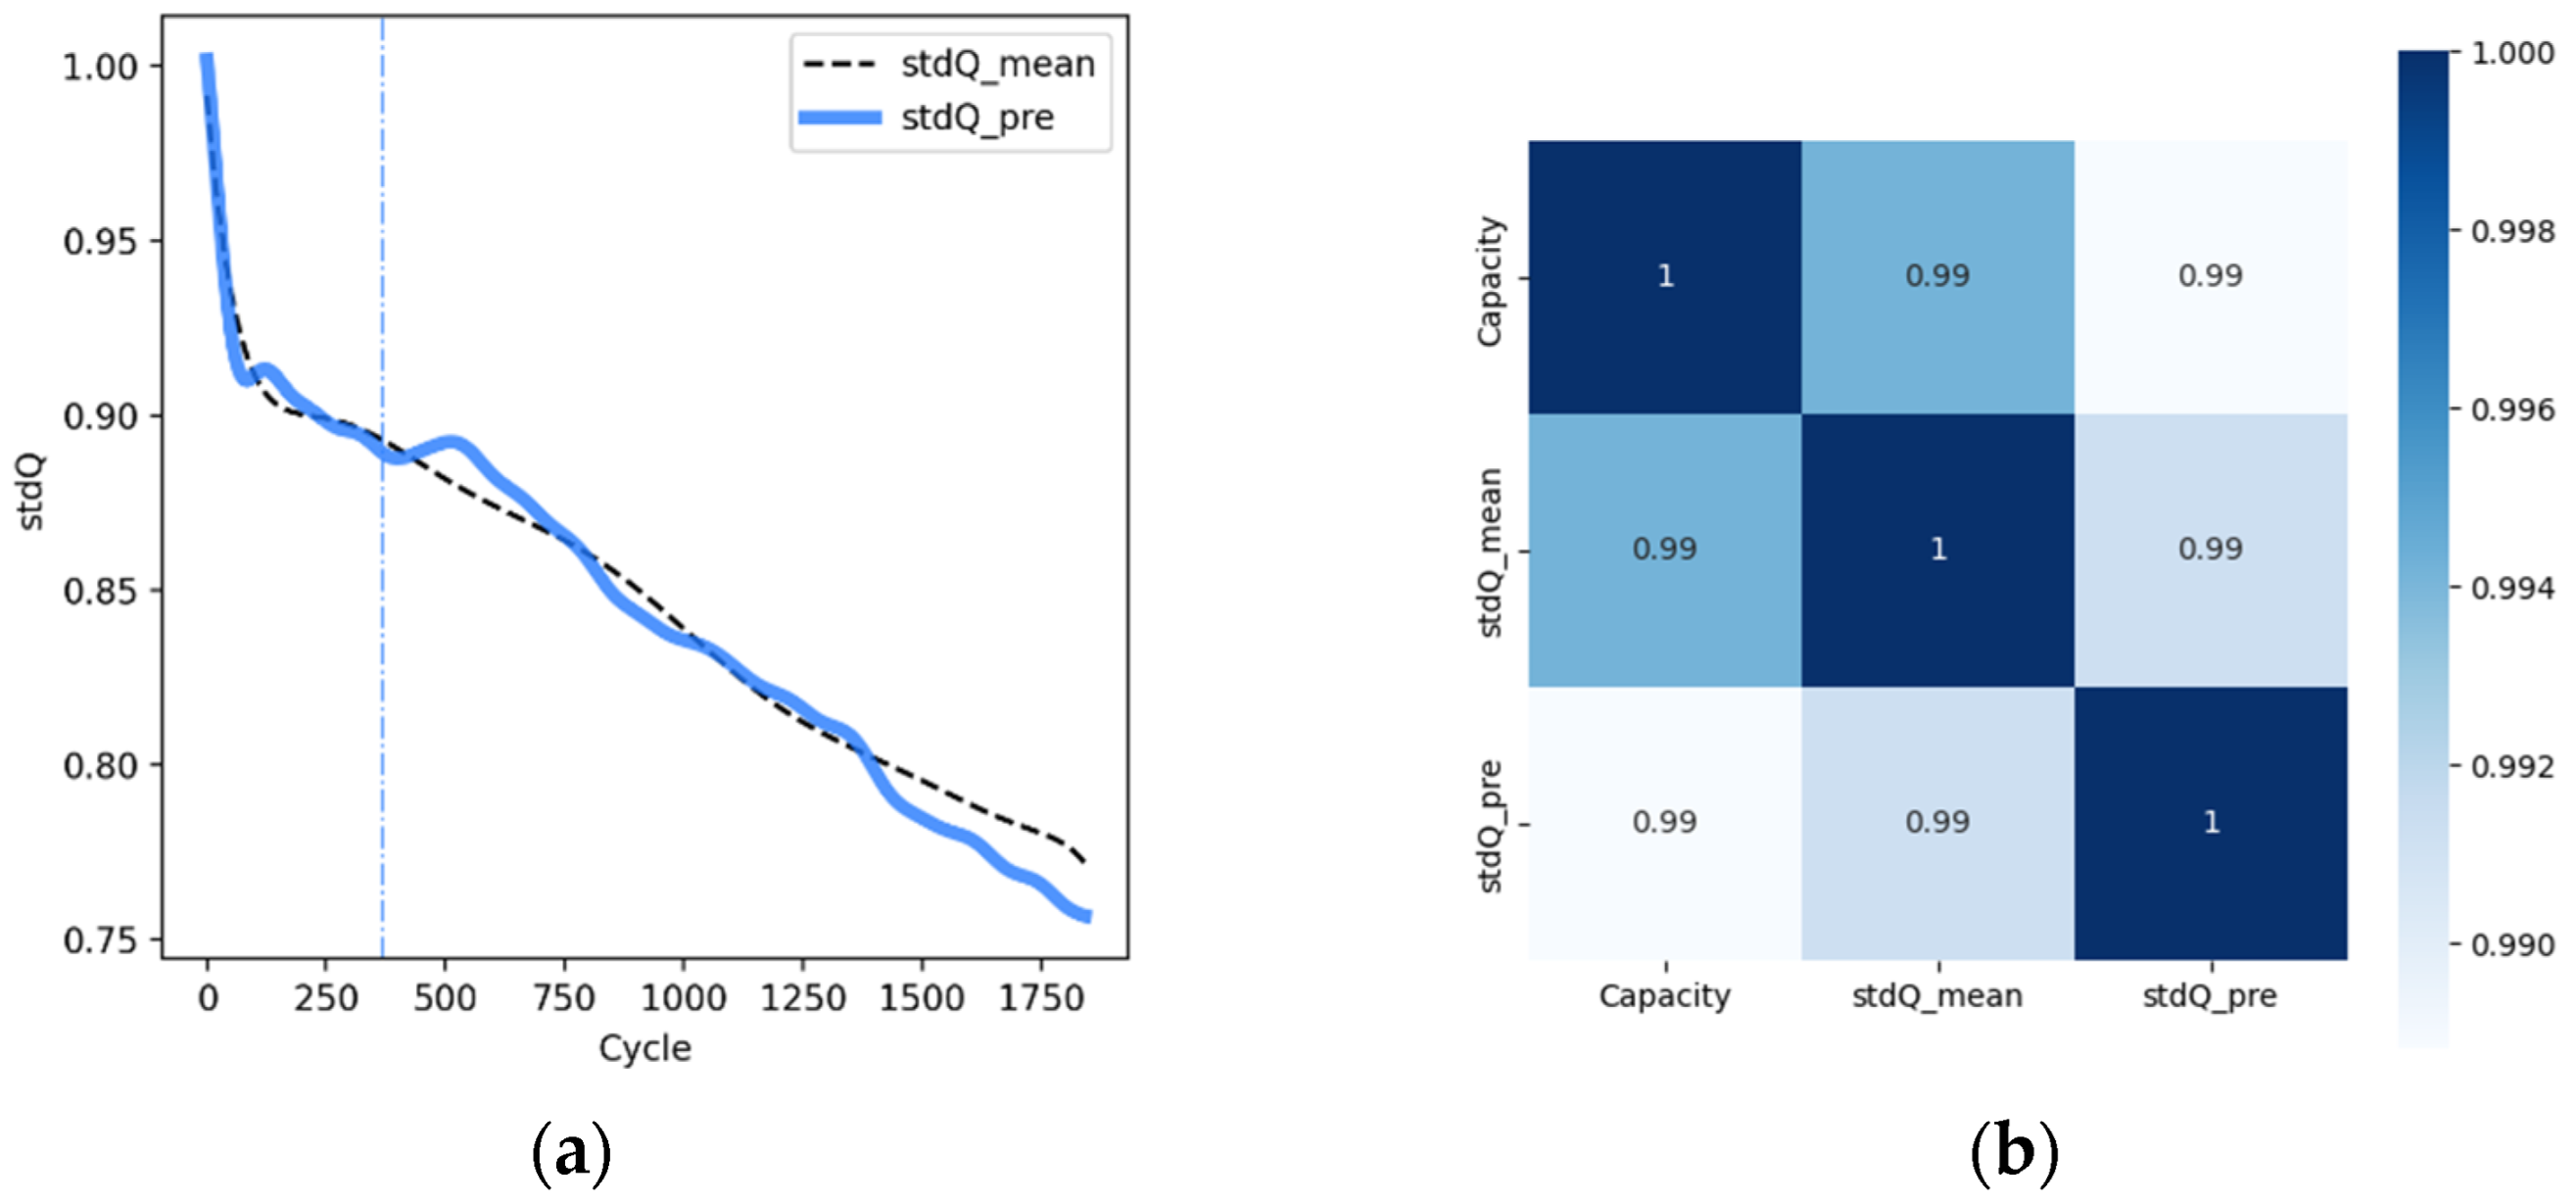
2.1. The HIs Prediction of Battery Pack

Under the working condition of 35 °C_0.5C0.5C (35 °C: ambient temperature, 0.5C0.5C: charge–discharge rate), based on the MOGPR model, the future cycle stdQ (stdQ_pre) of the battery pack can be obtained by learning the entire life data of the battery cell stdQ and the initial 20% life data of the battery pack stdQ_mean, and the results are presented in Figure 2. As shown in Figure 2a, the vertical dashed line represents the 20% cycle data of the battery pack, with the left side representing the observed value and the right side representing the predicted value. The predicted HIs not only have the same trend as the observed HIs, but also have a small error, and their MAE and RMSE are 0.36% and 0.496%, respectively. Figure 2b illustrates the correlation between the stdQ and the capacity in the battery pack, where the stdQ_mean represents the observed value of the stdQ1–15 of the battery pack. The results show that the stdQ_pre still has a strong correlation with the capacity, and thus the above stdQ can be used for the health prediction of the battery pack. Although the stdQ has a good correlation with capacity, there is still a certain degree of deviation. In order to improve prediction accuracy, the next section will fuse the two HIs, namely the cycle number and the stdQ, for the SOH prediction of the battery pack.

2.2. SOH Prediction of Battery Cells

2.2.1. Prediction Results of Two Different Models

The SOH prediction results of the battery cell based on the SOGPR model and the MOGPR model are compared in this section. Under the working condition of 35 °C_0.5C0.5C, the SOGPR prediction model is trained by using the first 20% aging data of the 1# cell and the entire life aging data of the 2# cell, and the results are shown in Figure 3a. The bold solid line represents the observed value used to train the SOGPR model, the dotted line is the future SOH of the battery cell, and the solid blue line is the predicted SOH. The light blue area displays the 95% confidence interval (CI), which is used to assess the prediction results. The narrower the 95% CI, the more reliable. It can be seen from the picture that the SOGPR prediction model cannot achieve accurate SOH prediction of the battery cell.
Compared with the SOGPR model, the MOGPR model accounts for the disadvantage of the SOGPR model and can take use of the prior SOH information of the 2# cell to obtain higher prediction accuracy. Under the working condition of 35 °C_0.5C0.5C, the MOGPR prediction model is trained by employing the entire life cycling data of the 2# cell and the first 20% aging data of the 1# cell, and the prediction result is shown in Figure 3b. Their MAE and RMSE are 0.278% and 0.337%, respectively.

2.2.2. Prediction Results for Two Different Conditions

In order to analyze the influence of temperature and the charge–discharge rate on the MOGPR model, the future SOH of battery cell under 35 °C_0.5C0.5C is predicted based on the battery cell aging data of two different operating conditions: 25 °C_0.5C0.5C and 35 °C_0.3C1C, and the predicted results are shown in Figure 4.
At first, in order to analyze the influence of temperature on the prediction accuracy of the SOH of the battery cell, the entire life aging data of the 3# cell under the working condition of 25 °C_0.5C0.5C and the first 20% cycle data of the 1# cell under 35 °C_0.5C0.5C working conditions are employed to train the MOGPR model. The SOH prediction results are shown in Figure 4a, the MAE and RMSE are 0.31%, and 0.99%, respectively. The result shows that temperature has little effect on the SOH prediction of the battery cell. The model can obtain satisfactory SOH prediction accuracy under different working temperatures by using the aging data in other working temperatures.
Then, to analyze the influence of the charge–discharge rate on the prediction accuracy of battery cell SOH, the entire life aging data of the 5# cell under 35 °C_0.3C1C operating conditions and the first 20% cycle data of the 1# cell under 35 °C_0.5C0.5C working conditions are utilized to train the MOGPR model. The deviation of the predicted value from the true value gradually increases with the increasing number of cycles; the SOH prediction result is shown in Figure 4b. Their MAE and RMSE are 1.71% and 1.89%, respectively.
By verifying the MOGPR model based on two different working conditions, it can be seen that, compared with temperature, the impact of the charge–discharge rate on the prediction accuracy of the battery cell SOH is more obvious.

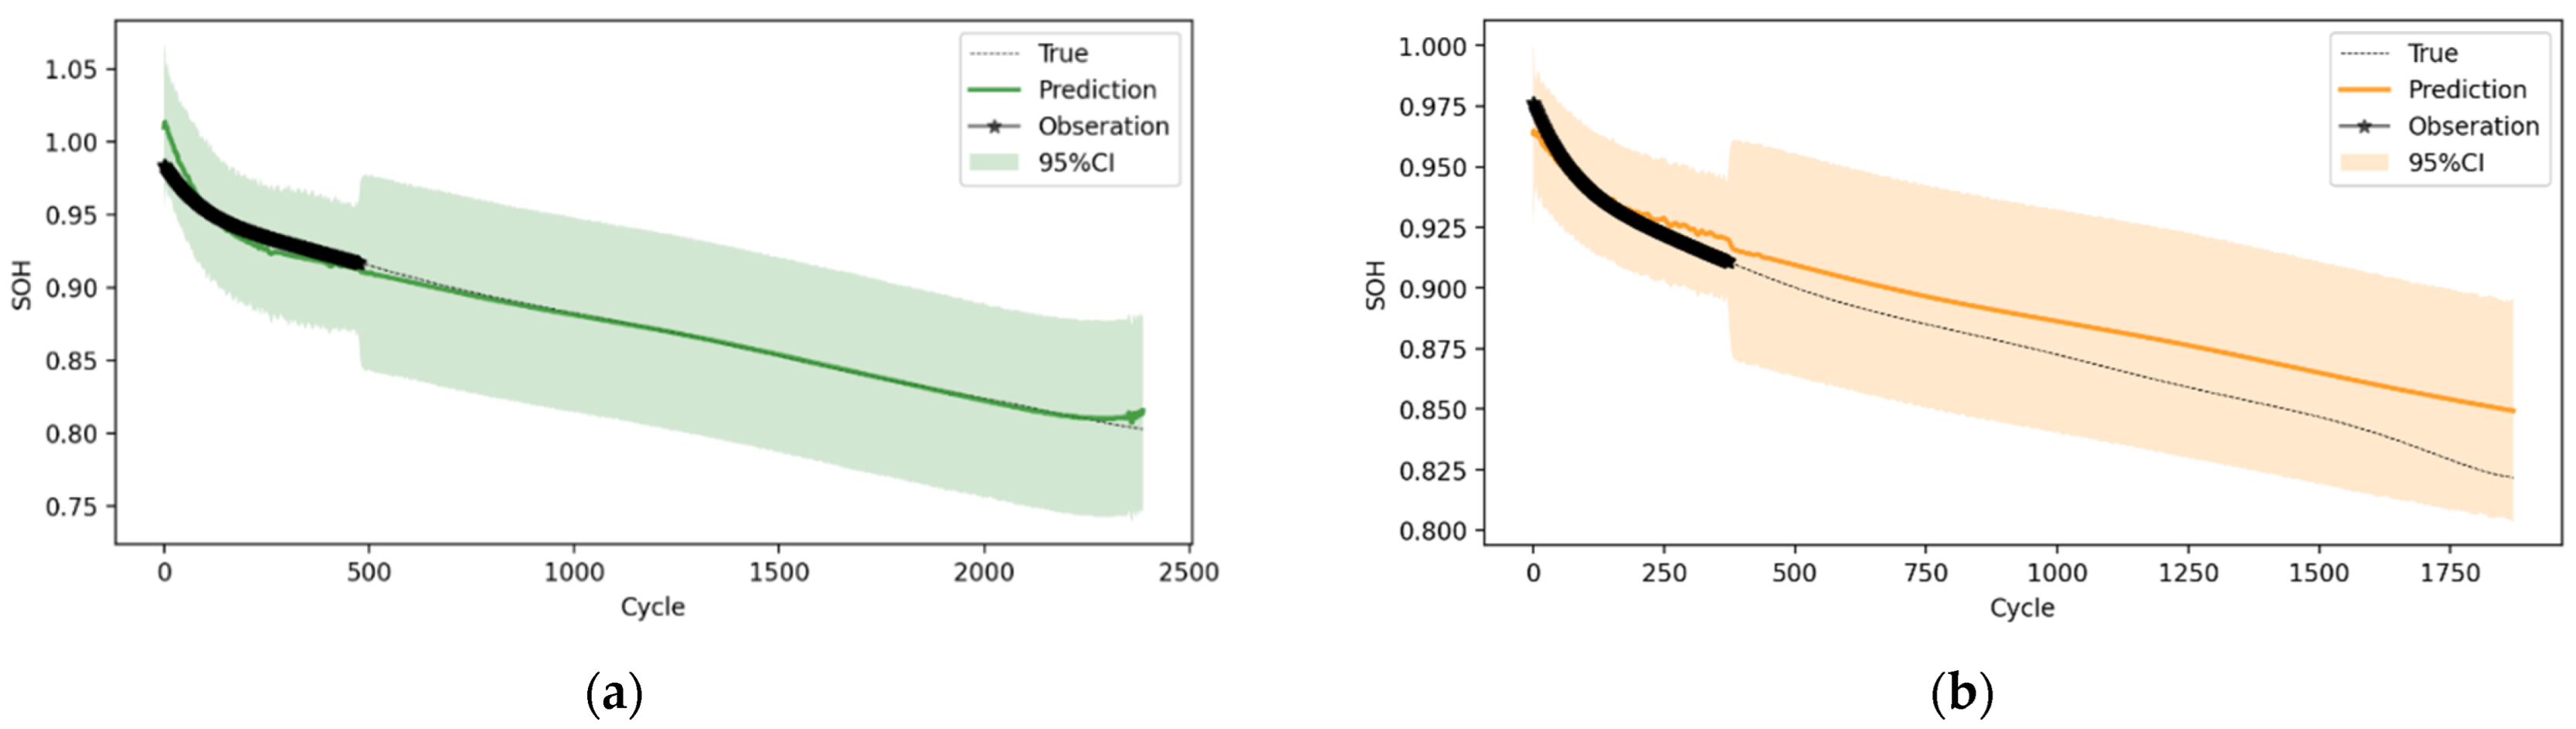
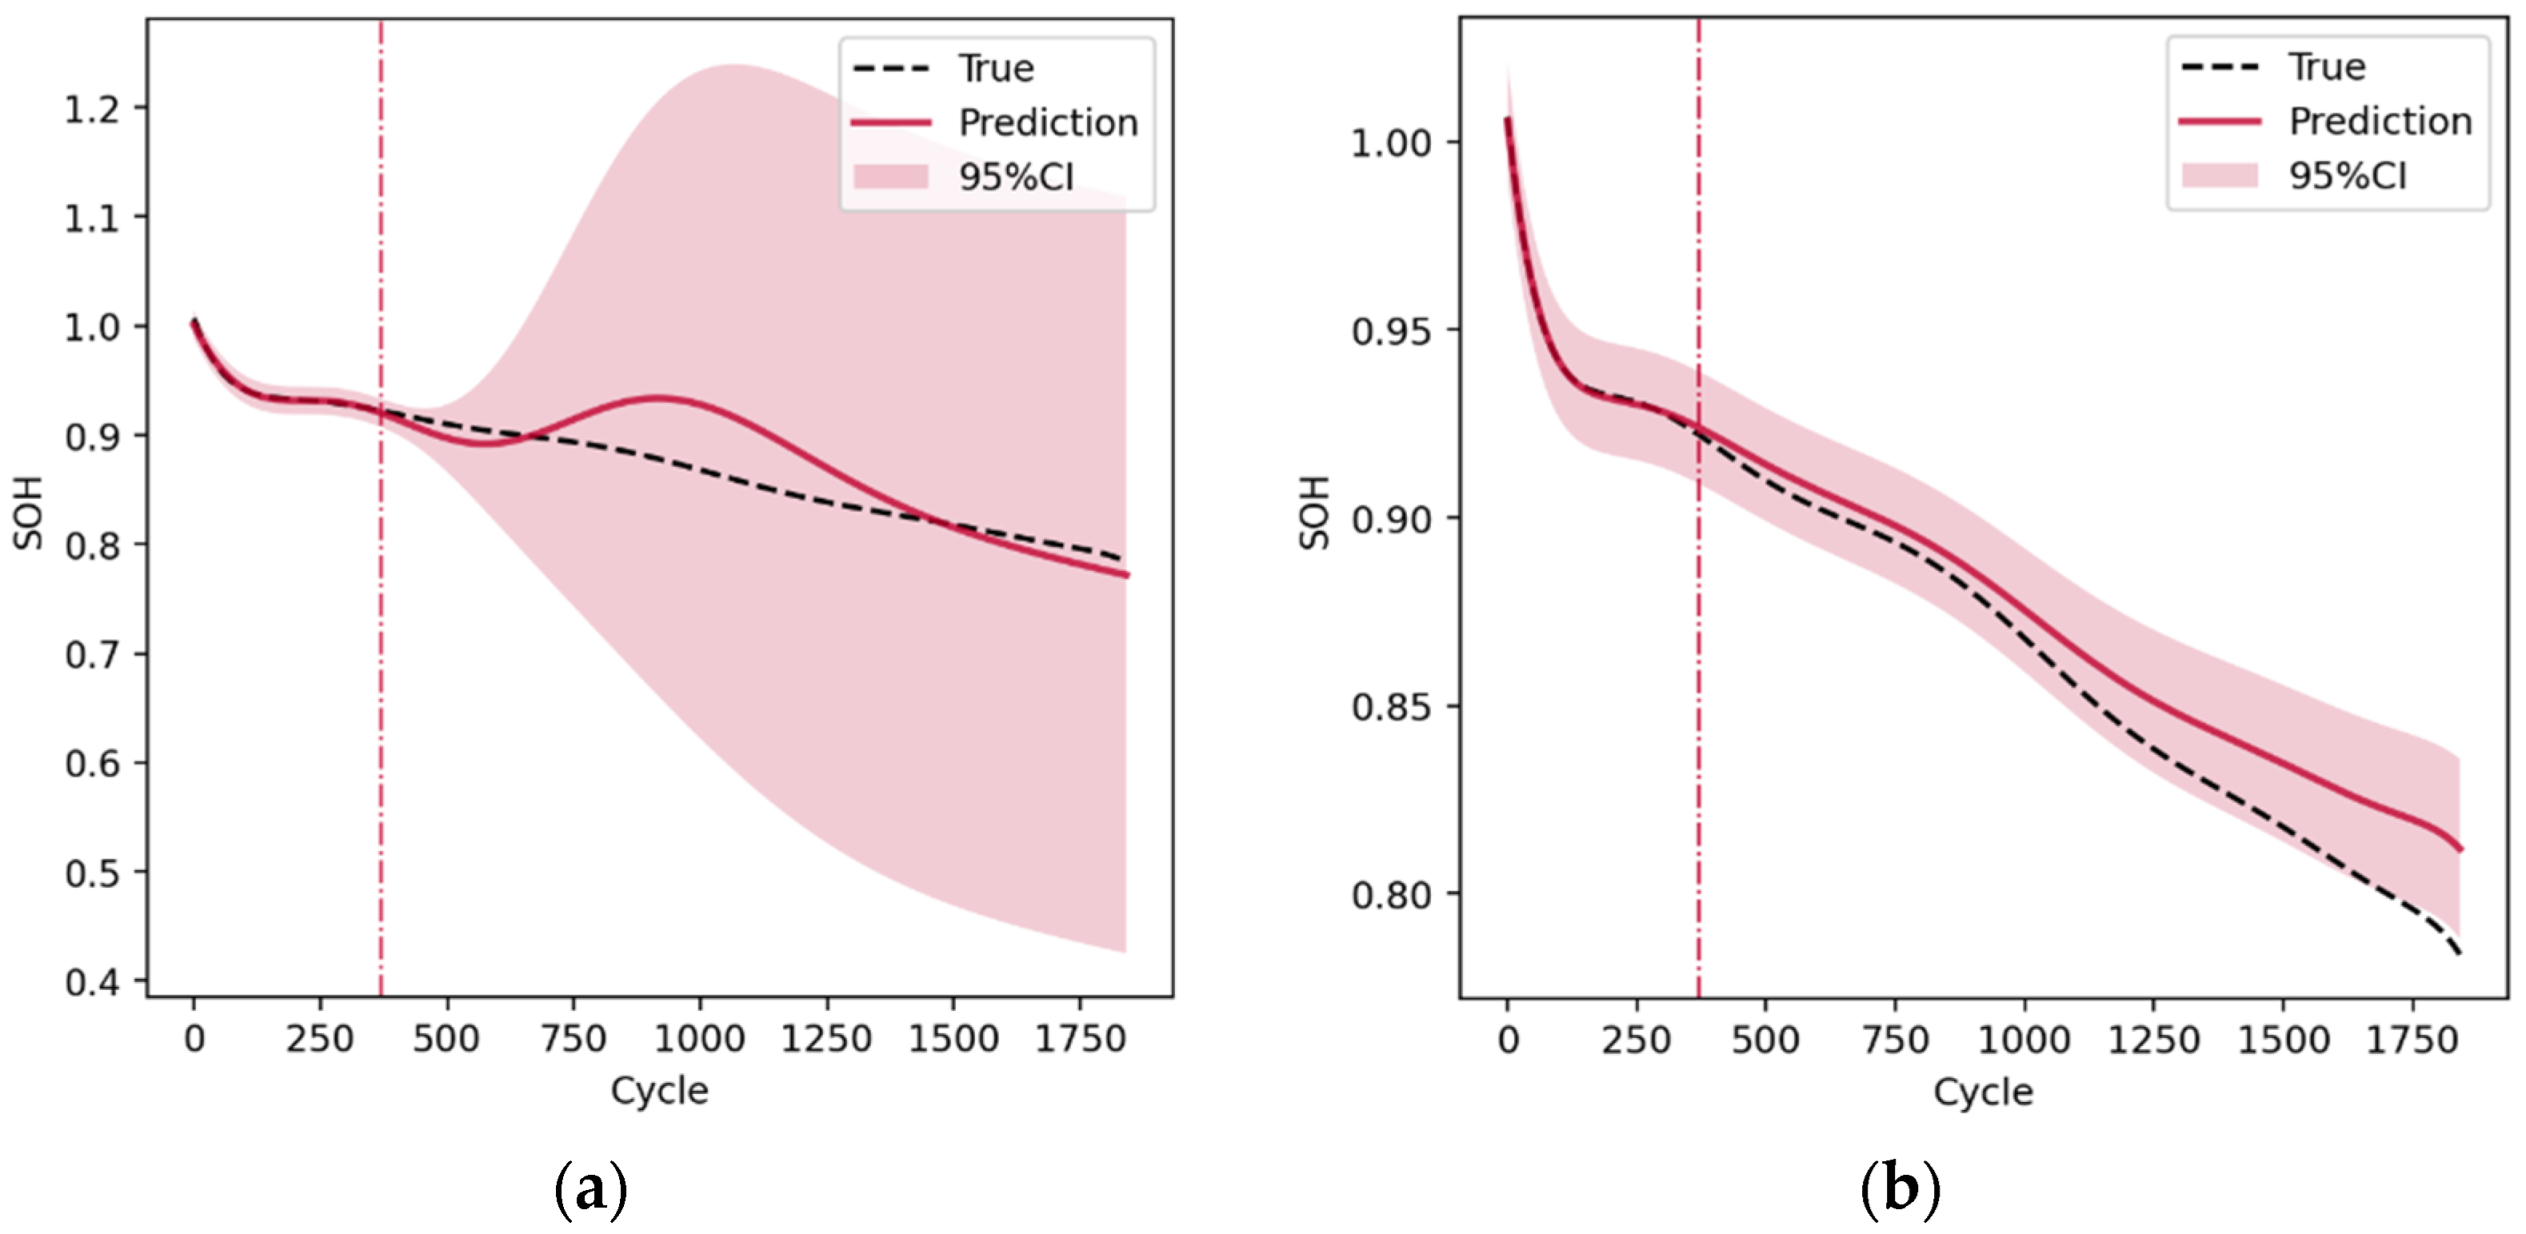
2.3. SOH Prediction of Battery Pack

In this section, firstly, the prediction results of two different HIs are validated separately based on the SOGPR model. Secondly, based on the MOGPR model, the prediction results of two different HIs are verified separately. The black dotted line is the actual value of the SOH. the solid colorful line represents the predicted value of the SOH, and the corresponding area is the 95% CI.

2.3.1. Prediction Results Based on the SOGPR Model

Under 35 °C_0.5C0.5C operating conditions, the first 20% of a battery pack is used to train the SOGPR model. The prediction result is shown in Figure 5. The battery used in the experiments in this paper is affected by polarization, and the SOH of the first 100 cycles of the pack shows a rapid decline. In Figure 5a, the SOGPR model is trained using only the cycle number as the HI, and the SOH prediction error of the battery pack is large. The MAE and RMSE are 2.554% and 3.64%, respectively. While in Figure 5b, the cycle number and stdQ_pre are used as the input HIs. Although the future cycling SOH prediction of the battery pack can be achieved by training two sets of HIs, the predicted values deviate significantly from the actual values and are located in the unreliable region, and its MAE and RMSE are 2.79% and 3.74%, respectively. The results show the SOGPR model cannot obtain accurate SOH predictions of the battery pack.

2.3.2. Prediction Results Based on the MOGPR Model
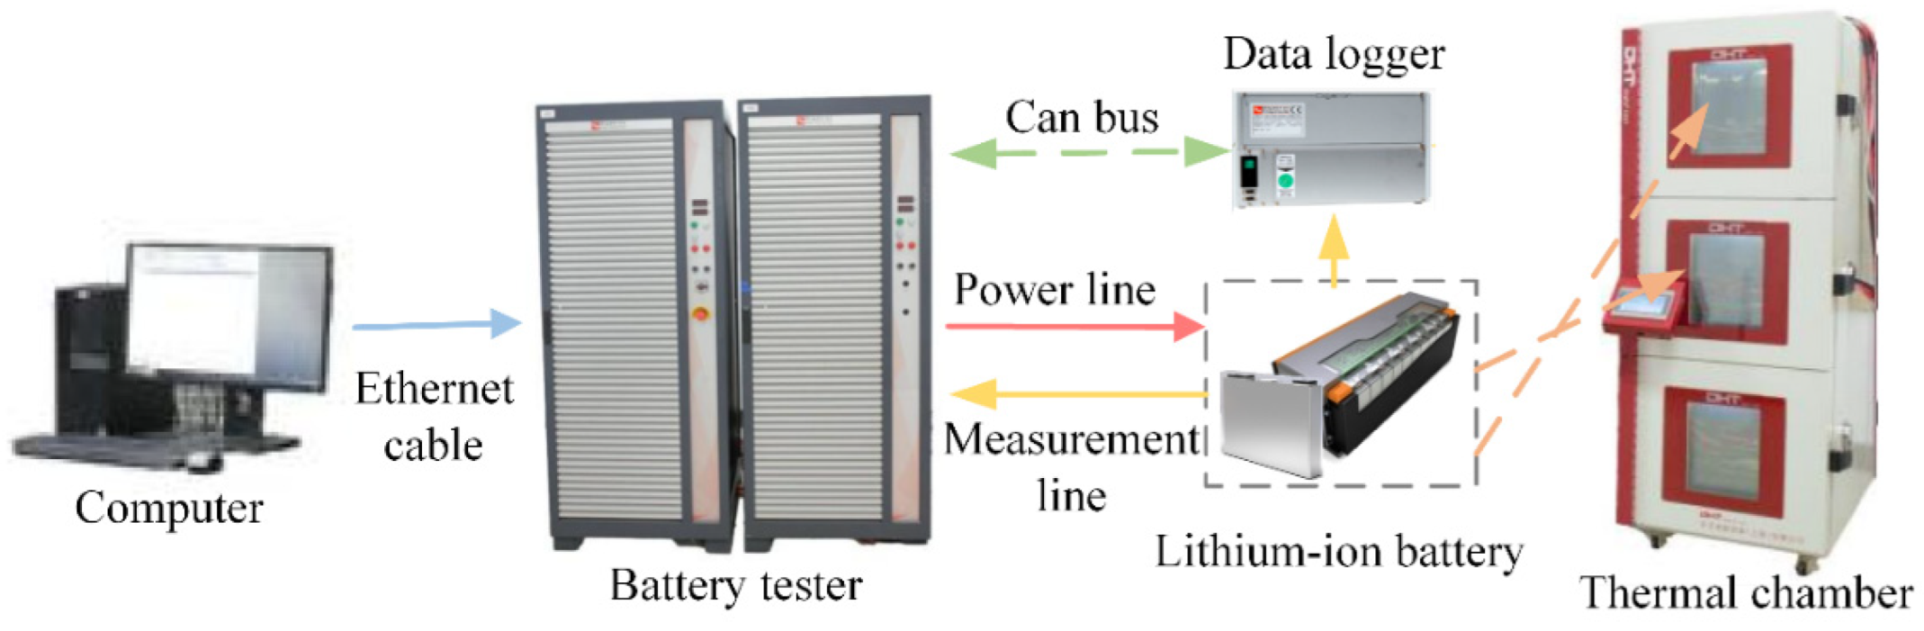
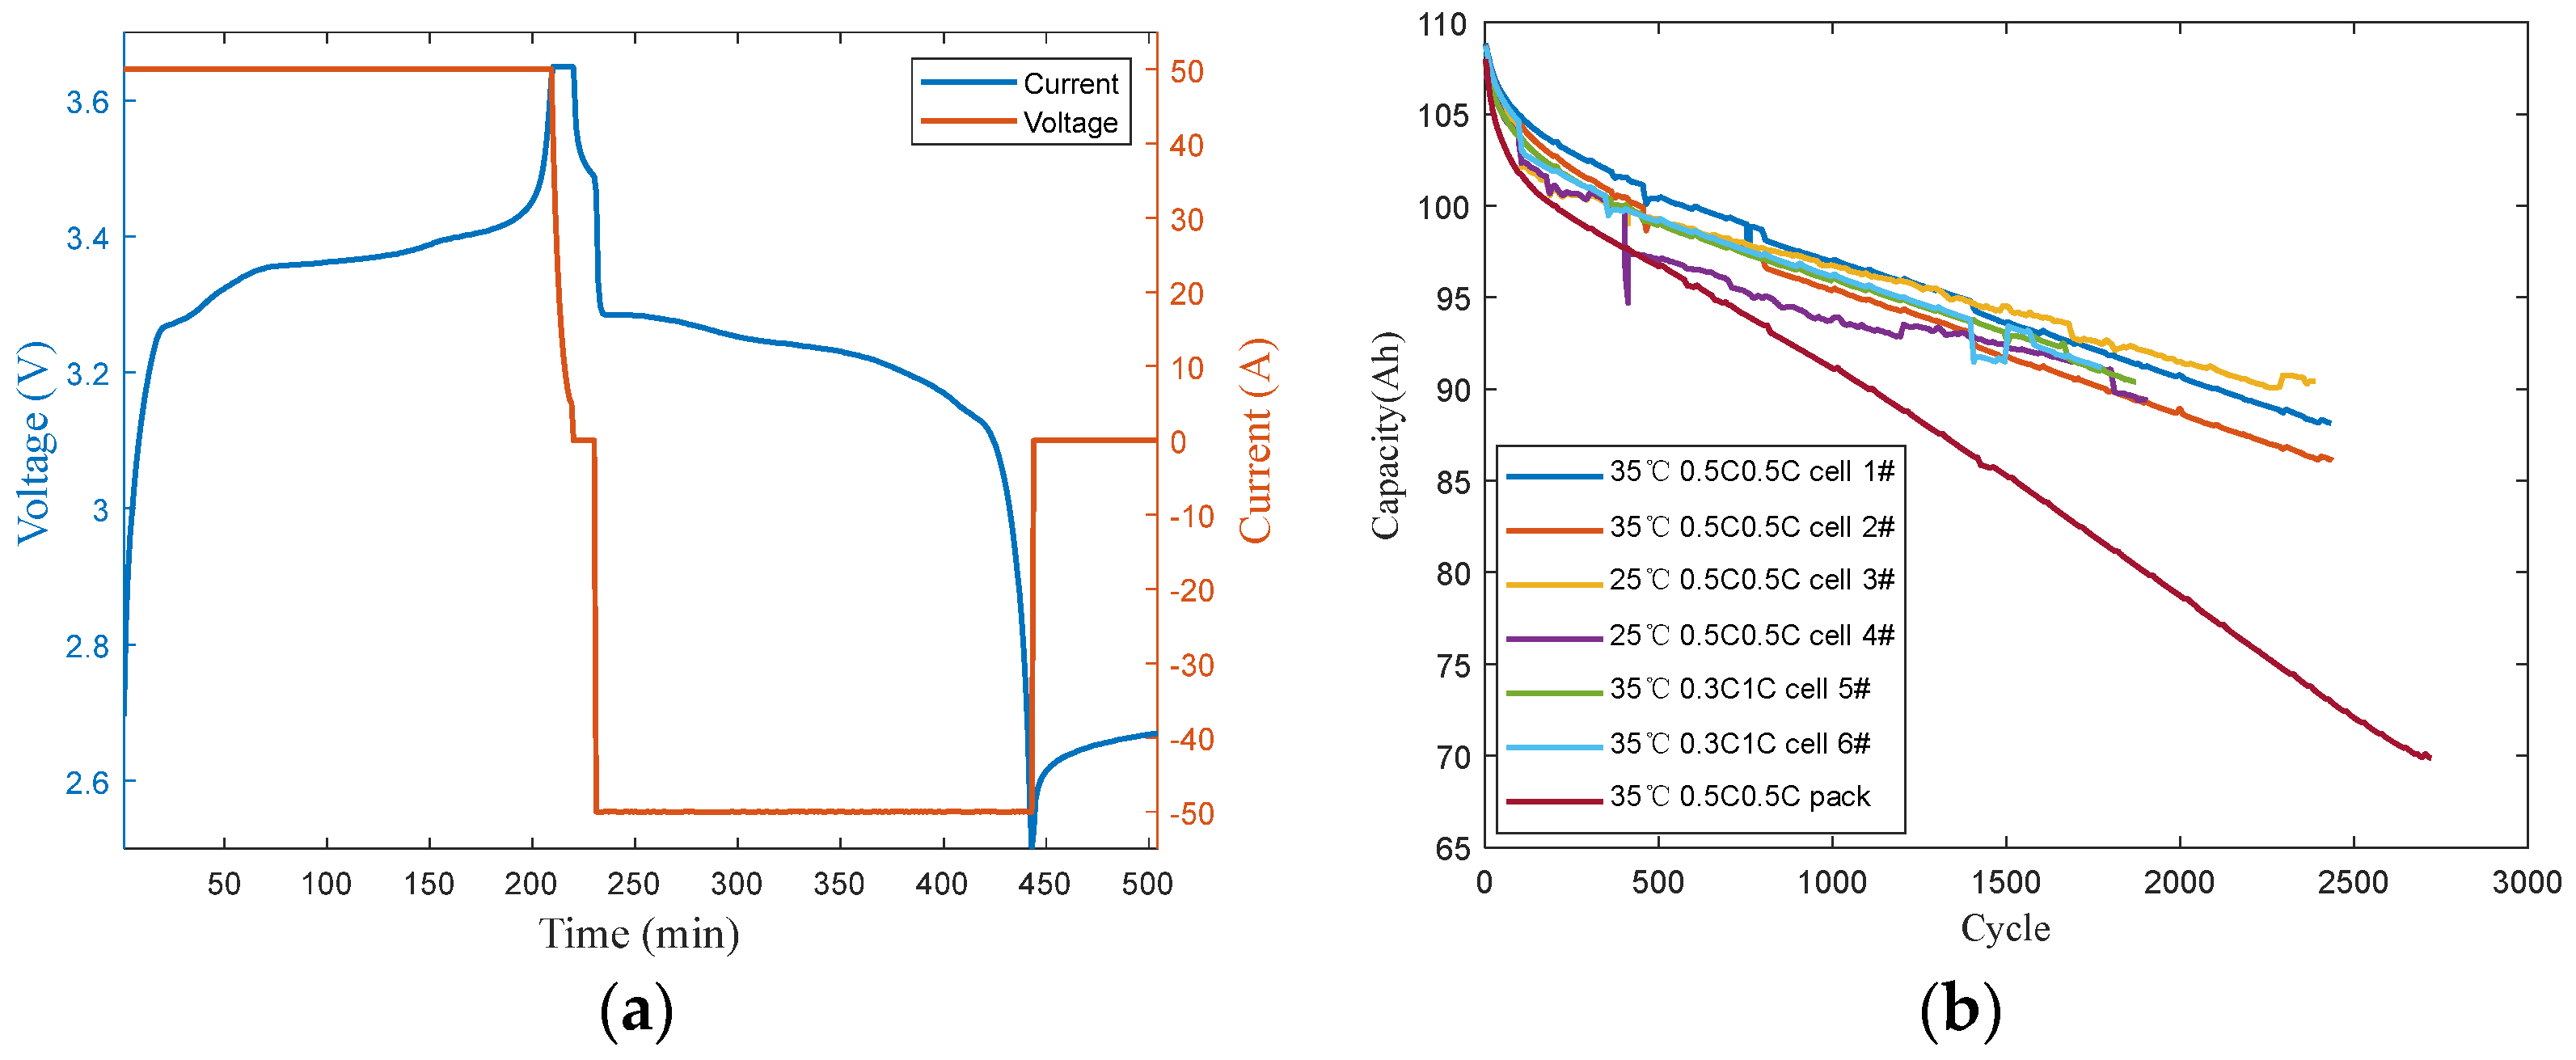
In this section, the MOGPR prediction model is trained by the data of a single HI (cycle number) and two HIs (cycle number and stdQ_pre), and the SOH prediction results of the battery pack are analyzed. Under the working condition of 35 °C_0.5C0.5C, the whole life aging data of the 1# cell and the first 20% of the battery pack are used to train the MOGPR prediction model of the battery pack. In Figure 6a, only the cycle number is used as the HI to train the model. The results show that the capacity drops rapidly in the early cycle. In the first 400 cycles, it still has high prediction accuracy and can effectively capture the overall trend of battery decline, with an MAE and RMSE of 1.87% and 2.69%, respectively. Compared with SOGPR, the prediction accuracy of SOH has been significantly improved. Although the deviation of the predicted future SOH of the battery pack from the actual value is small, its 95% CI is still much larger than the normal threshold. The results show that, based on the MOGPR SOH prediction model, satisfactory reliability prediction results cannot be obtained by training using only the cycle number.
The SOH prediction results of the battery pack based on two HIs (cycle number and stdQ_pre) are shown in Figure 6b. It can be observed that the model can not only capture the general trend of battery aging but also has better results, with an MAE and RMSE of 0.91% and 1.18%, respectively. Based on the fusion feature to account for the deficiency of a single feature, the prediction accuracy has been significantly improved.

3. Experiment

As an electrochemical system, the battery inevitably leads to the gradual degradation of its performance during constant use and long-term storage. To study its aging characteristics, an aging experiment platform is set up to conduct different charging and discharging tests. The battery aging test platform mainly includes a battery tester, a thermal chamber, a computer, a data logger, etc., as shown in Figure 7. First, set the experimental steps and parameters through the computer. Then, use the battery tester to run the battery cells and pack in the thermal chamber according to the preset steps. Finally, save the experimental data to the computer through the data logger.
The battery used in this aging test is a prismatic battery cell with a LiFePO4 cathode and a graphite anode. A batch of batteries with a rated capacity of 110Ah is applied to the aging experiment. The battery pack is composed of fifteen battery cells in series. Both battery cells and battery packs are subjected to aging tests at 35 °C_0.5C0.5C. In order to analyze the influence of temperature and the current rate on aging characteristics, aging experiments are carried out on battery cells under two operating conditions, namely 25 °C_0.5C0.5C and 35 °C_0.3C1C, respectively. The aging test conditions of battery cells and battery packs are shown in Table 2.
In this work, a test battery cell (35 °C_0.5C0.5C_cell, 1#) (35 °C: ambient temperature, 0.5C0.5C: charge–discharge rate, cell 1#: battery number) is an example for the description. The battery tester conducts the aging experiment under preset working conditions, where the ambient temperature is set to 35 °C. Consistently use the 0.5 C rate to complete charging until 3.65 V, and the current becomes 0.05 C. In the discharge process, the discharge rate is set to 0.5 C to discharge until 2.5 V, and then the discharge step is terminated. The voltage and current curves in a charge–discharge cycle are shown in Figure 8a, then the above process is repeated until the capacity reaches a preset value of the initial capacity of the battery. Compared with the battery cells, the cycling life of the battery pack is usually much shorter, as shown in Figure 8b. Specifically, since the battery pack is affected by the inconsistency of the battery cells and multiple factors, the aging rate of the battery pack is increased, and its cycle life is shortened.

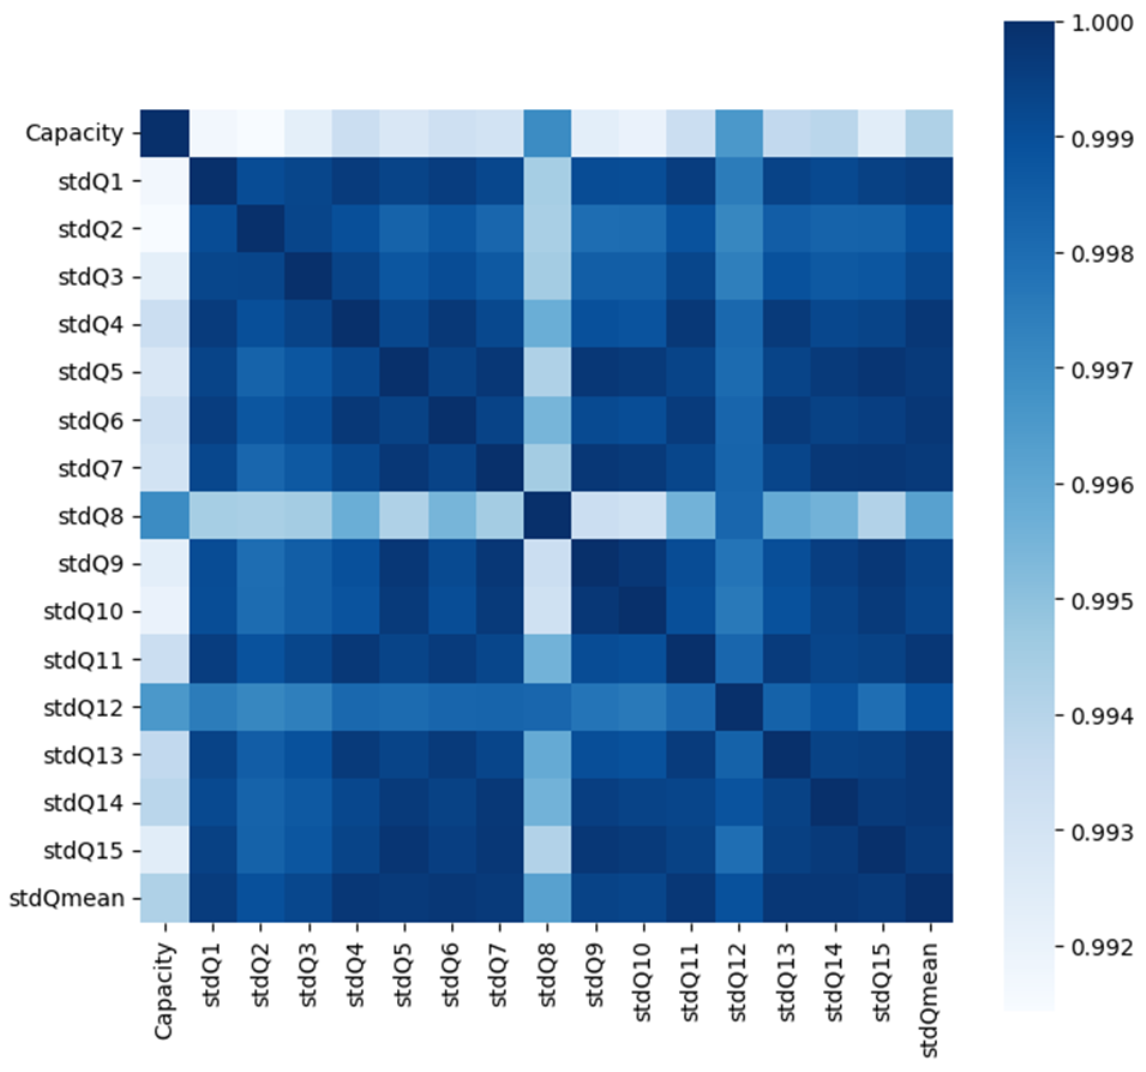
4. Health Indicators Extraction and Evaluation

4.1. Health Indicators Extraction

As a battery is repeatedly charged and discharged, its active material will gradually decrease. The gradual thickening of the solid electrolyte interphase (SEI) eventually leads to its capacity fading and a power drop. Experiments show differences in the charge and discharge capacity under different cycles, so capacity would usually be used as an indicator to evaluate battery aging. The discharge capacity of the lithium-ion battery in this experiment is completed between the lower and upper cut-off voltage. This work chooses to extract the voltage segment in this voltage interval, then obtains the corresponding discharge capacity sequence (Q) through the ampere-hour integration. In order to further improve the reliability and operability of this indicator, the standard deviation of the Q is adopted, which is named as stdQ [26]. The specific implementation principle of stdQ is as follows:
Assuming that the voltage discharge curve is divided into the same N sub-intervals, the voltage interval ΔV can be calculated by Equation (1):
Δ V = V max V min N
Based on the voltage interval ΔV, the i-th voltage interval sequence Vs,i can be obtained by Equation (2):
V s , i = [ V max , V max Δ V , , V min ]
The accumulated charge sequence Q corresponding to the voltage sequence can be obtained according to the ampere-hour integration method, as shown in Equation (3):
Q i ( V ) = [ Q 1 , Q 2 , , Q N ]
The dQ sequence of Equation (4) can be obtained as the difference between the sequence of Equation (3) and the element Q1 which corresponds to the first voltage interval. Then, the variance of the dQ sequence can be obtained to obtain the health indicator of the i-th cycle and named as stdQ.
d Q i ( V ) = [ Q 1 i Q 1 i , Q 2 i Q 1 i , , Q N i Q 1 i ]
Through the analysis of the experimental data, it can be seen that as the number of battery cycles increases, the battery capacity decreases continuously, so the cycle number can also be used as an HI to capture the aging status of the battery.

4.2. Health Indicators Evaluation

The selection of HIs is critical for the prediction of battery SOH based on machine learning, which can not only effectively eliminate a large number of unimportant and redundant features but also help to reduce the computational cost and obtain reliable prediction results. The Pearson correlation analysis method is suitable for the quantitative analysis of the linear relationship between the extracted HIs and the battery capacity. The Pearson correlation coefficient can be expressed by Equation (5) [27]:
ρ = ( x i x ¯ i ) ( y y ¯ ) ( x i x ¯ i ) 2 ( y y ¯ ) 2
where x i represents the HIs, and y represents the capacity observations. x ¯ i and y ¯ represent their mean values, respectively. ρ represents the correlation coefficient between the HIs and the capacity.
Based on the above analysis, the features of fifteen battery cells in the battery pack are extracted. The correlation between the HIs and the battery capacity is calculated by using Pearson correlation analysis. Figure 9 shows the correlation between the sixteen HIs (stdQ1–15, stdQ_mean) and capacity, respectively, in the battery pack, where the stdQ_mean represents the average value of the stdQ for the fifteen battery cells. The Pearson correlation analysis shows that the correlation coefficients are greater than 0.99, indicating that there is a strong correlation between the stdQ and the capacity. Therefore, the stdQ_mean can be used as an HI to represent all changes in the stdQ1–15 of the battery pack.

5. Methodology

The Gaussian process regression model, as a machine learning method based on Bayesian framework, has the advantages of non-parametric and uncertainty expression. According to the number of model outputs, the model can be divided into single-output Gaussian process regression (SOGPR) models and multiple-output Gaussian process regression (MOGPR) models. Since the traditional machine learning methods cannot fit well for heterogeneous data, we use the MOGPR model to predict battery pack health. A comparison of the implementation principles of the two different Gaussian process regression models can be found in the literature [28], and an intuitive illustration is shown in Figure 10. For the multiple-input multiple-output prediction problem, the traditional method often uses multiple SOGPR models to build models separately, where the input is {Xi,yi}, and the output is {fi}. However, this method ignores the correlation during multiple outputs; in contrast, the MOGPR model accounts for the deficiencies of the SOGPR model.

5.1. Single-Output Gaussian Process Regression Model

A typical single-output Gaussian process is a collection of any finite number of random variables with a joint Gaussian distribution, whose properties are completely determined by their means and covariance functions. The Gaussian process definition is shown in Equation (6):
f ( x ) G P ( m ( x ) , k ( x , x ) )
where x and x’ represent two different input samples, m(x) is the mean function, and its value usually takes zero (the assumption does not affect the generalization and learning performance of the Gaussian process), and k(x, x’) is the covariance function of the Gaussian process, which characterizes the correlation between random variables.
According to Bayesian theory, the posterior distribution of the predicted value y* can be obtained, as shown in Equation (7):
p ( y * | x , y , x * ) = N ( μ , σ * 2 )
where x and y are the input and output of the training set, respectively. x * and y * are the input and prediction output of the testing set, respectively. μ * is the prediction mean, and σ * 2 is the prediction covariance.

5.2. Multi-Output Gaussian Process Regression Model

The MOGPR model is obtained by extending the SOGPR model. Compared with the SOGPR model, the MOGPR model accounts for the deficiency of the SOGPR model in that each output needs to be modeled separately and cannot capture the potential correlation between multiple outputs. The MOGPR establishes a covariance matrix for each output, so as to learn the correlation between each output. It assumes that the multiple outputs are related to some extent, and employs the mutual information to obtain more accurate prediction results than the SOGPR model [28].
The MOGPR assumes that the set containing D functions, {f d(x) } d = 1 D , where any function can be expressed as the convolution of the smooth kernel function {Gd(x) } d = 1 D , with the implicit function μ(x), as shown in Equation (8):
f d ( x ) = x G d ( x z ) μ ( z ) d z
Similar to the SOGPR, the MOGPR multi-output random variable f(x) is assumed to obey a Gaussian distribution, as shown in Equation (9):
f ( x ) G P ( m ( x ) , K M O G P )
where m(x) is the mean function, predicted by the mean of the test aging data series, and the multi-output covariance KMOGP is defined as Equation (10):
K M O G P ( x , x ) = k f d , f d ( x , x ) = [ k 11 ( x , x ) k D 1 ( x , x ) k 1 D ( x , x ) k D D ( x , x ) ]
The multiple output regression problem can be defined in Equation (11):
y d ( x ) = f d ( x ) + ε d
where f(x) is the multi-output function, εd is a Gaussian noise εd~N(0, σ n 2 ), and yd is the multi-output observation.
Based on Bayesian theory, the posterior distribution of MOGP predicted values yd* can be expressed in Equation (12):
p ( y d * | x , y , x * ) = N ( μ d , σ d * 2 )
where x and y are the input and output of the training set, x * and y d * are the input and predicted output of the test set, μ d * is the predicted mean, and σ d * 2 is the predicted covariance.
In this work, for battery SOH prediction, the HIs and capacity data of battery cells and packs are used as the input of the MOGPR model, and the corresponding SOHs are taken as the output, respectively. Firstly, the battery cell entire-life aging data and the pack early cycle data are selected and loaded into the model for training. Then, the MOGPR prediction model is used to complete the prediction of the battery pack SOH. We use three metrics to evaluate the accuracy of the prediction results, namely, MAE, RMSE, and 95% CI, as shown in Equation (13):
{ M A E = 1 N i = 1 N | y i y ¯ i * | R M S E = 1 N i = 1 N ( y i y ¯ i * ) 2 95 % C I = y ¯ i * ± 1.96 × σ ( y ¯ i * )
where yi and y ¯ i * represent the actual and predicted values of the battery SOH, respectively, and σ ( y ¯ i * ) is the variance of the predicted capacity. The 95% CI represents the confidence interval of the predicted value of the battery SOH.

6. Conclusions

In this paper, a battery pack SOH prediction method based on the MOGPR model is proposed with satisfactory accuracy. Firstly, two HIs are proposed from the battery cells and the battery pack by analyzing the battery aging characteristics. Then, the Pearson correlation analysis method is used to quantify the correlation between the HIs and the capacity. At last, the SOH prediction result based on the MOGPR is verified by employing the entire life cycling data of the battery cell and the initial cycle data of the battery pack. Based on the stdQ of the battery cell, the prediction of the future stdQ of the battery pack is realized through the MOGPR model. Then, the cycle number and stdQ_pre are combined to form the HIs set, and the MOGPR model is employed again to achieve the prediction of the future SOH of the battery pack. The results show that its MAE and RMSE are 0.91% and 1.18%, respectively. The results of this paper show that the prediction effect based on two features is better than that of a single feature, and the performance of the MOGPR model is better than that of the SOGPR model. By comparison, the MOGPR model based on the two features has better reliability and accuracy. Only the basic RBF kernel function is used in this model, and the performance of other kernel functions has not been compared. In addition, this paper only used the LFP battery to verify the MOGPR model, and whether this method is applicable to other material batteries needs further research. In the future, we will try to use different kernel functions in our scenario and combine MOGPR with ANN. Furthermore, our proposed model will be validated on different materials of batteries.

Author Contributions

Conceptualization, J.W., Z.D. and A.A.; methodology, J.W., Z.D., J.L. and A.A.; software, J.W. and J.L.; validation, J.W. and J.L.; formal analysis, J.W. and J.L.; investigation, J.W. and J.L.; resources, J.W. and K.P.; data curation, J.W. and K.P.; writing—original draft preparation, J.W.; writing—review and editing, J.W., Z.D., J.L., K.P., L.X., G.G. and A.A.; visualization, J.W. and J.L.; supervision, Z.D. and A.A; project administration, Z.D. All authors have read and agreed to the published version of the manuscript.

Funding

This research received no external funding.

Institutional Review Board Statement

Not applicable.

Informed Consent Statement

Not applicable.

Data Availability Statement

The data presented in this study are available on request from the corresponding author.

Conflicts of Interest

The authors declare no conflict of interest.

References

  1. Farmann, A.; Waag, W.; Marongiu, A.; Sauer, D.U. Critical review of on-board capacity estimation techniques for lithium-ion batteries in electric and hybrid electric vehicles. J. Power Sources 2015, 281, 114–130. [Google Scholar] [CrossRef]
  2. Liu, J.; Bao, Z.; Cui, Y.; Dufek, E.J.; Goodenough, J.B.; Khalifah, P.; Li, Q.; Liaw, B.Y.; Liu, P.; Manthiram, A. Pathways for practical high-energy long-cycling lithium metal batteries. Nat. Energy 2019, 4, 180–186. [Google Scholar] [CrossRef]
  3. Khumprom, P.; Yodo, N. A data-driven predictive prognostic model for lithium-ion batteries based on a deep learning algorithm. Energies 2019, 12, 660. [Google Scholar] [CrossRef]
  4. Zubi, G.; Dufo-López, R.; Carvalho, M.; Pasaoglu, G.; Reviews, S.E. The lithium-ion battery: State of the art and future perspectives. Renew. Sustain. Energy Rev. 2018, 89, 292–308. [Google Scholar] [CrossRef]
  5. Zhang, Q.; Wang, D.; Yang, B.; Cui, X.; Li, X. Electrochemical model of lithium-ion battery for wide frequency range applications. Electrochim. Acta 2020, 343, 136094. [Google Scholar] [CrossRef]
  6. Wang, Y.; Tian, J.; Sun, Z.; Wang, L.; Xu, R.; Li, M.; Chen, Z. A comprehensive review of battery modeling and state estimation approaches for advanced battery management systems. Renew. Sustain. Energy Rev. 2020, 131, 110015. [Google Scholar] [CrossRef]
  7. Xiong, R.; Li, L.; Li, Z.; Yu, Q.; Mu, H. An electrochemical model based degradation state identification method of Lithium-ion battery for all-climate electric vehicles application. Appl. Energy 2018, 219, 264–275. [Google Scholar] [CrossRef]
  8. Plett, G.L. Battery Management Systems, Volume II: Equivalent-Circuit Methods; Artech House: Norwood, MA, USA, 2015. [Google Scholar]
  9. Hu, X.; Li, S.; Peng, H. A comparative study of equivalent circuit models for Li-ion batteries. J. Power Sources 2012, 198, 359–367. [Google Scholar] [CrossRef]
  10. Hu, X.; Xu, L.; Lin, X.; Pecht, M. Battery lifetime prognostics. Joule 2020, 4, 310–346. [Google Scholar] [CrossRef]
  11. Ge, M.-F.; Liu, Y.; Jiang, X.; Liu, J. A review on state of health estimations and remaining useful life prognostics of lithium-ion batteries. Measurement 2021, 174, 109057. [Google Scholar] [CrossRef]
  12. Deng, Z.; Hu, X.; Lin, X.; Xu, L.; Li, J.; Guo, W. A reduced-order electrochemical model for all-solid-state batteries. IEEE Trans. Transp. Electrif. 2020, 7, 464–473. [Google Scholar] [CrossRef]
  13. Hu, X.; Jiang, J.; Cao, D.; Egardt, B. Battery health prognosis for electric vehicles using sample entropy and sparse Bayesian predictive modeling. IEEE Trans. Ind. Electron. 2015, 63, 2645–2656. [Google Scholar] [CrossRef]
  14. You, G.-w.; Park, S.; Oh, D. Real-time state-of-health estimation for electric vehicle batteries: A data-driven approach. Appl. Energy 2016, 176, 92–103. [Google Scholar] [CrossRef]
  15. Klass, V.; Behm, M.; Lindbergh, G. A support vector machine-based state-of-health estimation method for lithium-ion batteries under electric vehicle operation. J. Power Sources 2014, 270, 262–272. [Google Scholar] [CrossRef]
  16. Hu, C.; Jain, G.; Schmidt, C.; Strief, C.; Sullivan, M. Online estimation of lithium-ion battery capacity using sparse Bayesian learning. J. Power Sources 2015, 289, 105–113. [Google Scholar] [CrossRef]
  17. Deng, Z.; Hu, X.; Lin, X.; Xu, L.; Che, Y.; Hu, L. General discharge voltage information enabled health evaluation for lithium-ion batteries. IEEE/ASME Trans. Mechatron. 2020, 26, 1295–1306. [Google Scholar] [CrossRef]
  18. Wang, J.; Deng, Z.; Yu, T.; Yoshida, A.; Xu, L.; Guan, G.; Abudula, A. State of health estimation based on modified Gaussian process regression for lithium-ion batteries. J. Energy Storage 2022, 51, 104512. [Google Scholar] [CrossRef]
  19. Liu, K.; Hu, X.; Wei, Z.; Li, Y.; Jiang, Y. Modified Gaussian process regression models for cyclic capacity prediction of lithium-ion batteries. IEEE Trans. Transp. Electrif. 2019, 5, 1225–1236. [Google Scholar] [CrossRef]
  20. Li, X.; Wang, Z.; Yan, J. Prognostic health condition for lithium battery using the partial incremental capacity and Gaussian process regression. J. Power Sources 2019, 421, 56–67. [Google Scholar] [CrossRef]
  21. Zheng, X.; Deng, X. State-of-health prediction for lithium-ion batteries with multiple gaussian process regression model. IEEE Access 2019, 7, 150383–150394. [Google Scholar] [CrossRef]
  22. Boyle, P.; Frean, M. Dependent gaussian processes. Adv. Neural Inf. Process. Syst. 2004, 17, 17,217–224. [Google Scholar]
  23. Li, Y.; Sheng, H.; Cheng, Y.; Stroe, D.-I.; Teodorescu, R. State-of-health estimation of lithium-ion batteries based on semi-supervised transfer component analysis. Appl. Energy 2020, 277, 115504. [Google Scholar] [CrossRef]
  24. Li, J.; Deng, Z.; Liu, H.; Xie, Y.; Liu, C.; Lu, C. Battery capacity trajectory prediction by capturing the correlation between different vehicles. Energy 2022, 260, 125123. [Google Scholar] [CrossRef]
  25. Richardson, R.R.; Osborne, M.A.; Howey, D.A. Gaussian process regression for forecasting battery state of health. J. Power Sources 2017, 357, 209–219. [Google Scholar] [CrossRef]
  26. Deng, Z.; Hu, X.; Li, P.; Lin, X.; Bian, X. Data-driven battery state of health estimation based on random partial charging data. IEEE Trans. Power Electron 2021, 37, 5021–5031. [Google Scholar] [CrossRef]
  27. Lee Rodgers, J.; Nicewander, W.A. Thirteen ways to look at the correlation coefficient. Am. Stat. 1988, 42, 59–66. [Google Scholar] [CrossRef]
  28. Liu, H.; Cai, J.; Ong, Y.-S. Remarks on multi-output Gaussian process regression. Knowl. Based Syst. 2018, 144, 102–121. [Google Scholar] [CrossRef]
Figure 1. The composition and implementation principle of the battery SOH prediction method.
Batteries 08 00134 g001
Figure 2. The prediction results of the stdQ for the battery pack: (a) the predicted future stdQ of the battery pack; (b) the correlation coefficient between observed and predicted HIs and the capacity.
Batteries 08 00134 g002
Figure 3. SOH prediction results for battery cell (35 °C_0.5C0.5C): (a) SOH prediction result based on the SOGPR; (b) SOH prediction result based on the MOGPR.
Batteries 08 00134 g003
Figure 4. SOH prediction results of battery cell based on the MOGPR under different conditions: (a) results of MOGPR-based battery cell SOH prediction (25 °C_0.5C0.5C); (b) results of MOGPR-based battery cell SOH prediction (35 °C_0.3C1C).
Batteries 08 00134 g004
Figure 5. SOH prediction of the battery pack based on the SOGPR with different HIs: (a) only using the cycle number as the HI; (b) using the cycle number and stdQ as the HIs.
Batteries 08 00134 g005
Figure 6. SOH prediction of the battery pack based on the MOGPR with different HIs: (a) only using the cycle number as the HI; (b) using the cycle number and stdQ as the HIs.
Batteries 08 00134 g006
Figure 7. The platform for the battery aging experiment.
Batteries 08 00134 g007
Figure 8. Battery cycling profile and capacity aging curves: (a) voltage and current curves in a charge–discharge cycle; (b) capacity decay curves of battery cells and packs.
Batteries 08 00134 g008
Figure 9. The correlation coefficient between stdQ and the capacity of each battery cell.
Batteries 08 00134 g009
Figure 10. Basic principles of two GPR models: (a) basic principles of the SOGPR model; (b) basic principles of the MOGPR model.
Batteries 08 00134 g010
Table 1. Comparison of the advantages and disadvantages of the four data-driven approaches.
ApproachAdvantagesDisadvantages
ANNsupport for multidimensional spaces;
high prediction accuracy;
ability to learn independently;
high computational complexity large-scale samples;
poor uncertainty expression;
complex structure;
SVMsupport for multidimensional spaces;
strong generalization ability;
better performance in the nonlinear system;
kernel function satisfying the Mercer criterion;
more computing resources are required;
sensitive to missing data;
RVMhigh sparsity;
not subject to Mercer restrictions;
depends on kernel function selection;
susceptibility to falling into a local optimum;
GPRavailability of uncertainty expressions;
applicable to high-dimensional and small sample data;
poor long-term forecasting;
high cost of computing large samples of data;
Table 2. Battery aging test conditions.
ConditionsCellPack
Temperature (°C)35253535
Charge rate (C)0.50.50.30.5
Discharge rate (C)0.50.510.5
Publisher’s Note: MDPI stays neutral with regard to jurisdictional claims in published maps and institutional affiliations.

