Article

A Post-Mortem Study of Stacked 16 Ah Graphite//LiFePO4 Pouch Cells Cycled at 5 °C

1
Helmholtz Institute Ulm (HIU), Helmholtzstrasse 11, 89081 Ulm, Germany
2
Karlsruhe Institute of Technology (KIT), P.O. Box 3640, 76021 Karlsruhe, Germany
3
Helmholtz-Institute Münster (IEK 12), Forschungszentrum Jülich GmbH, Corrensstraße 46, 48149 Münster, Germany
4
Grenoble Université Alpes, CEA-LITEN, 17 avenue des Martyrs, 38000 Grenoble, France
5
CIDETEC Energy Storage, Parque Científico y Tecnológico de Gipuzkoa, Paseo Miramón 196, 20014 Donostia-San Sebastián, Spain
6
VITO/EnergyVille, Thor Park 8300, 3600 Genk, Belgium
*
Authors to whom correspondence should be addressed.
Batteries 2019, 5(2), 45; https://doi.org/10.3390/batteries5020045
Submission received: 22 March 2019 / Revised: 19 April 2019 / Accepted: 24 April 2019 / Published: 7 May 2019
(This article belongs to the Special Issue Batteries and Supercapacitors Aging)

Abstract

:
Herein, the post-mortem study on 16 Ah graphite//LiFePO4 pouch cells is reported. Aiming to understand their failure mechanism, taking place when cycling at low temperature, the analysis of the cell components taken from different portions of the stacks and from different positions in the electrodes, is performed by scanning electron microscopy (SEM), X-ray diffraction (XRD) and X-ray photoemission spectroscopy (XPS). Also, the recovered electrodes are used to reassemble half-cells for further cycle tests. The combination of the several techniques detects an inhomogeneous ageing of the electrodes along the stack and from the center to the edge of the electrode, most probably due to differences in the pressure experienced by the electrodes. Interestingly, XPS reveals that more electrolyte decomposition took place at the edge of the electrodes and at the outer part of the cell stack independently of the ageing conditions. Finally, the use of high cycling currents buffers the low temperature detrimental effects, resulting in longer cycle life and less inhomogeneities.

1. Introduction

Li-ion batteries are required to operate for thousands cycles in a wide temperature range to satisfy the market and end-user expectations. Usually accelerated ageing protocols are performed to speed-up the degradation processes in order to study, in a relatively short time, the influence of key parameters (such as temperature, charge/discharge rates, state of charge (SOC), cut-off voltages) on the battery performance and to predict battery lifetime [1]. Performance degradation is mainly attributed to complex chemical processes involving active and non-active electrode components and the electrolyte. In part, they occur at the electrode/electrolyte interface due to the electrochemical instability of the electrolyte at low (below 1 V) and high (above 4 V) voltages [2,3]. If the formation of a solid electrolyte interface (SEI) at the anode is pivotal for ensuring battery operation, the uncontrolled growth of this layer during cell lifetime contributes to the capacity decrease as the Li inventory (corresponding to the cathode capacity) is continuously depleted [4]. Loss of lithium inventory (LLI) can also be due to its deposition at the anode close to 0 V. This can happen in case of non-ideal cell’s capacity balance (normally a negative to positive capacity ratio ≥1.1 is used), or upon fast charging at low temperature [5,6]. In addition, transition metals can be leached out of the cathode structure, especially at high voltage where the reactivity between the delithiated cathode surface and the electrolyte is the highest, inducing the active material leaching (LAM) resulting in the anode poisoning [7,8]. Furthermore, the mechanical failure of the electrode and the loss of electric contact generate electrochemically inactive areas [9] that adds to the LAM. Ageing tests can be followed by cell autopsy and post-mortem analysis. Cell disassembly is generally conducted on the discharged cells to limit the risk of thermal runaway. There is no standard procedure available and thus different methods, depending on the cell architecture, are used to open the cell in an inert atmosphere to avoid altering the physical-chemical state of the cell components [10]. The samples have to be carefully labelled to track their position in the stack (in stacked cells) or in the jelly-roll (for wound cells). A series of analytical techniques are then combined to find out the morphological, chemical and electrochemical modifications that occurred in the components upon ageing [11].
Herein, we focus on the post-mortem analysis of stacked 16 Ah graphite//LiFePO4 pouch cells designed for automotive applications and produced within the European project SPICY (Silicon and polyanionic chemistries and architectures of Li-ion cell for high energy battery). The cells were subjected to cycle ageing (between 0% and 100% SOC) at different charge current rates and temperatures (Figure S1). The results obtained at 5 °C, which is a moderately low temperature easily experienced in electric vehicle (EV) applications, were surprising as a low C-rate led to lower cycle life when compared to ageing results at 25 °C. That it is why cells cycled at 5 °C, were investigated deeply. Portions of the cell components, especially the electrodes, were analysed before and after ageing using scanning electron microscopy (SEM), X-rays diffraction (XRD) and X-ray photoemission spectroscopy (XPS), and used to reassemble half-cells cells to determine the evolution of their electrochemical properties. The tests were conducted using electrode parts taken from different portion of the stacks and from different positions in the electrodes (edge vs. center) to detect non-homogeneous ageing effects.

2. Results and Discussion

2.1. Description of Cells, Ageing Conditions and Initial Visual Inspection of Components

The cells specifications are reported in Table 1. The cells were aged by cycling with a constant charge current (0.3C or 2C) between 0% and 100% SOC (i.e., between 2.5 V and 3.6 V) at 5 °C inside a ventilated climatic chamber. The discharge C-rate is kept the same (1C). The tests were interrupted regularly to run a performance test at room temperature (RT) to follow up on the evolution of the cell’s characteristics. The cell state of health (SOH) was determined from a 1C discharge constant current/constant voltage (CC-CV) test performed during this reference test.
Acronyms: LFP = LiFePO4; C = conductive carbon; PVDF = Polyvinylidendifluoride; Gr = graphite; CMC = Sodium carboxymethylcellulose; SBR = Styrene Butadiene Rubber; LiPF6 = Lithium hexafluorophosphate EC = Ethylencarbonate; PC = Propylencarbonate; DMC = Dimethylcarbonate; VC = vinylcarbonate; PE/PP = Polyethylene/polypropylene.
The ageing protocol was interrupted when the cell loses at least 20% of its initial capacity. As the SOH is calculated during the performance test, it was not possible to interrupt the ageing at the exact same SOH value. Nevertheless, they have very close SOH values (79.7% and 72%).
Table 2 summarizes the results of the ageing phase. The total capacity throughput indicates the total capacity (charge and discharge) that the cells have cycled during ageing (including the performance test). The equivalent cycle number is obtained by dividing the total capacity throughput by the capacity of one complete cycle (about 32 Ah). Three cells were used for the study: a cell that performed only the formation protocol (named fresh cell) and two cells aged by cycling at 5 °C and 0.3C (named Cell A) or 2C (named Cell B).
After cycle ageing, the cells did not present any clear sign of degradation, such as swelling or electrolyte leakage. Although the cells were completely discharged to 2.5 V, a slightly higher value of OCV was detected for Cell A shortly prior to cell disassembly.
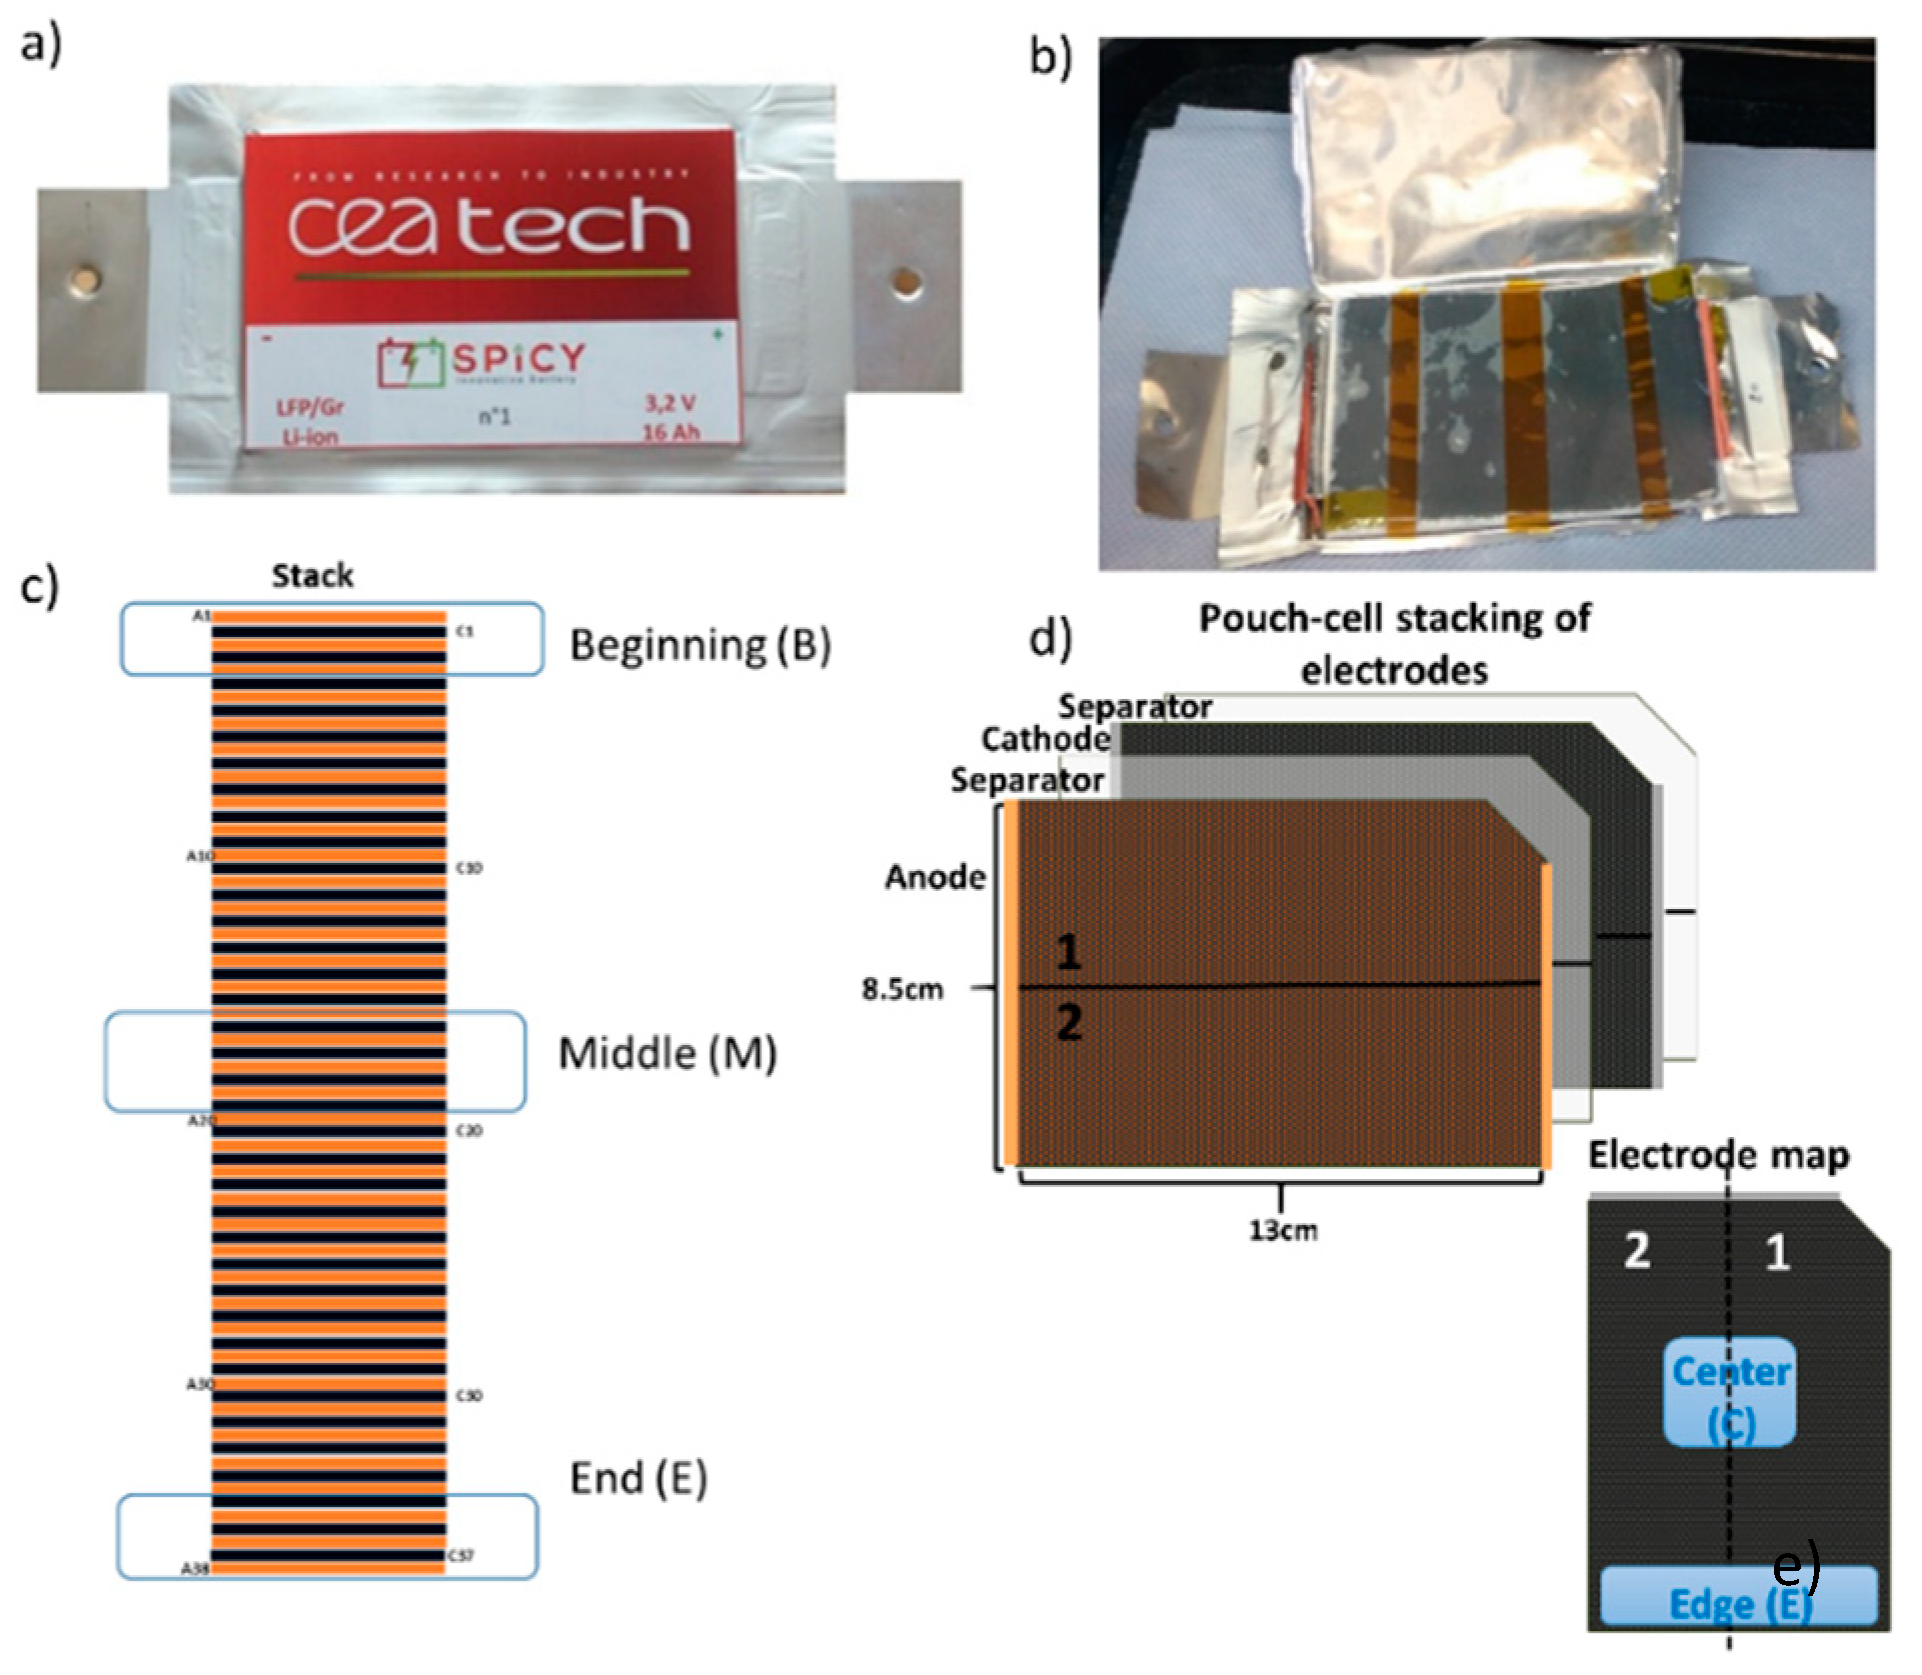
Figure 1a,b shows the pouch cell as made and after opening. Each cell contains a stack (Figure 1c) of double-side coated electrodes and separators as schematically depicted in Figure 1d. The electrodes were harvested at the beginning (B), middle (M) and end (E) of the stack. The samples, taken from the edge (e) and the center (c) of the electrode tape (Figure 1d), were dipped in dimethylcarbonate (DMC) (except some cathode samples from the fresh cell for SEM analysis which were dipped in acetonitrile (ACN) for 30 s and then dried under dynamic vacuum at room temperature for 30 min. Table S1 in the Supplementary Materials reports a detailed description of the analysis performed on each sample and its position in the stack.
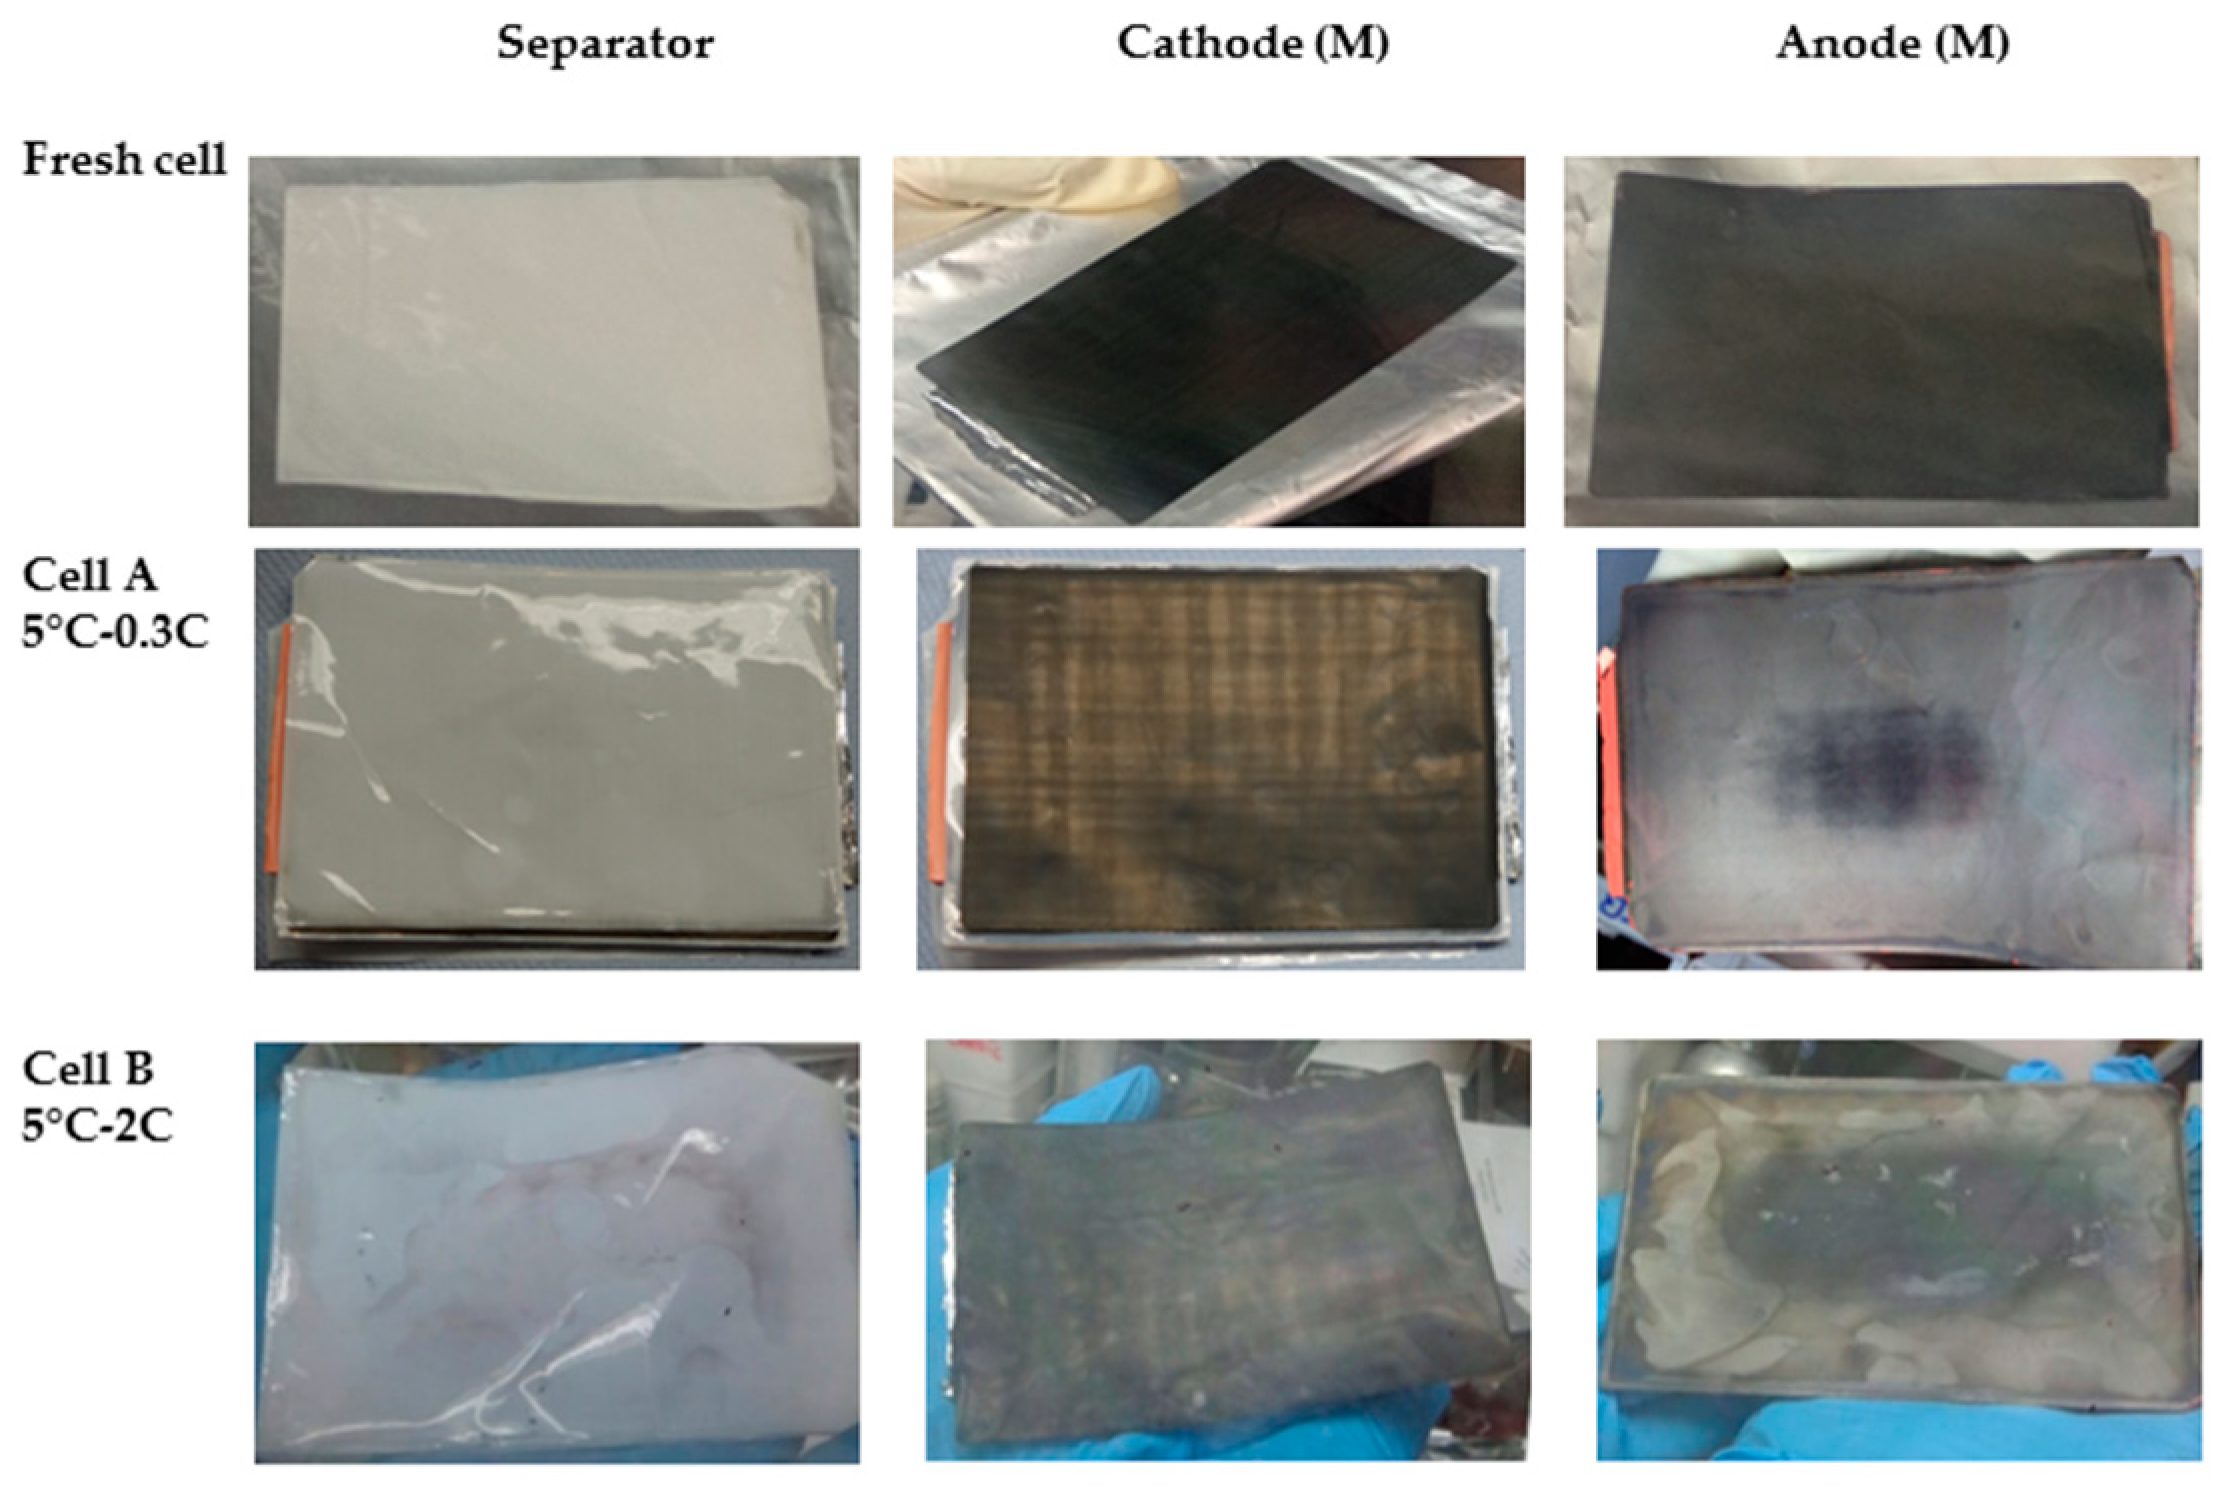
Figure 2 compares the pictures of cells components harvested from the middle of the stack. The separator of Cell A does not show a significant difference respect to the one from fresh cell, while that taken from Cell B shows dark areas, probably due to detachment of active material from anode tape. Compared to the fresh cell, the cathode from cell A and cell B show a grey/brown coloration after cycling at 5 °C. Noteworthy, the cathode tape in different portions of the stack does not show any visual difference (not shown). The anode tape, on the other hand, was rather shiny at the edges with a darker area in the center. The silvery color may be an indication of plated lithium [5], in both cell A and cell B.

2.2. Adhesion Test

Table 3 summarizes the thickness and adhesion test results of electrodes portions sampled from different position in the stack. The anode thickness increases already after cell formation while the cathode thickness only increases upon ageing.
Overall, the adhesion of the anode is quite poor compared to that of the cathode. Additionally, the anode adhesion significantly drops after formation (see fresh cell results), although it recovers nearly the values for the pristine electrode over cycle ageing (see Cell B results). The cathode adhesion appears also to be lower in the fresh cell than in the pristine electrode (never in contact with the electrolyte) but still retains high values (>330 N/m) on aged cells. For both electrodes adhesion values vary along the stack, which may be correlated with a different pressure distribution throughout the cell stack, also lead to variations of the electrode capacity.

2.3. Morphology of Cells’ Components
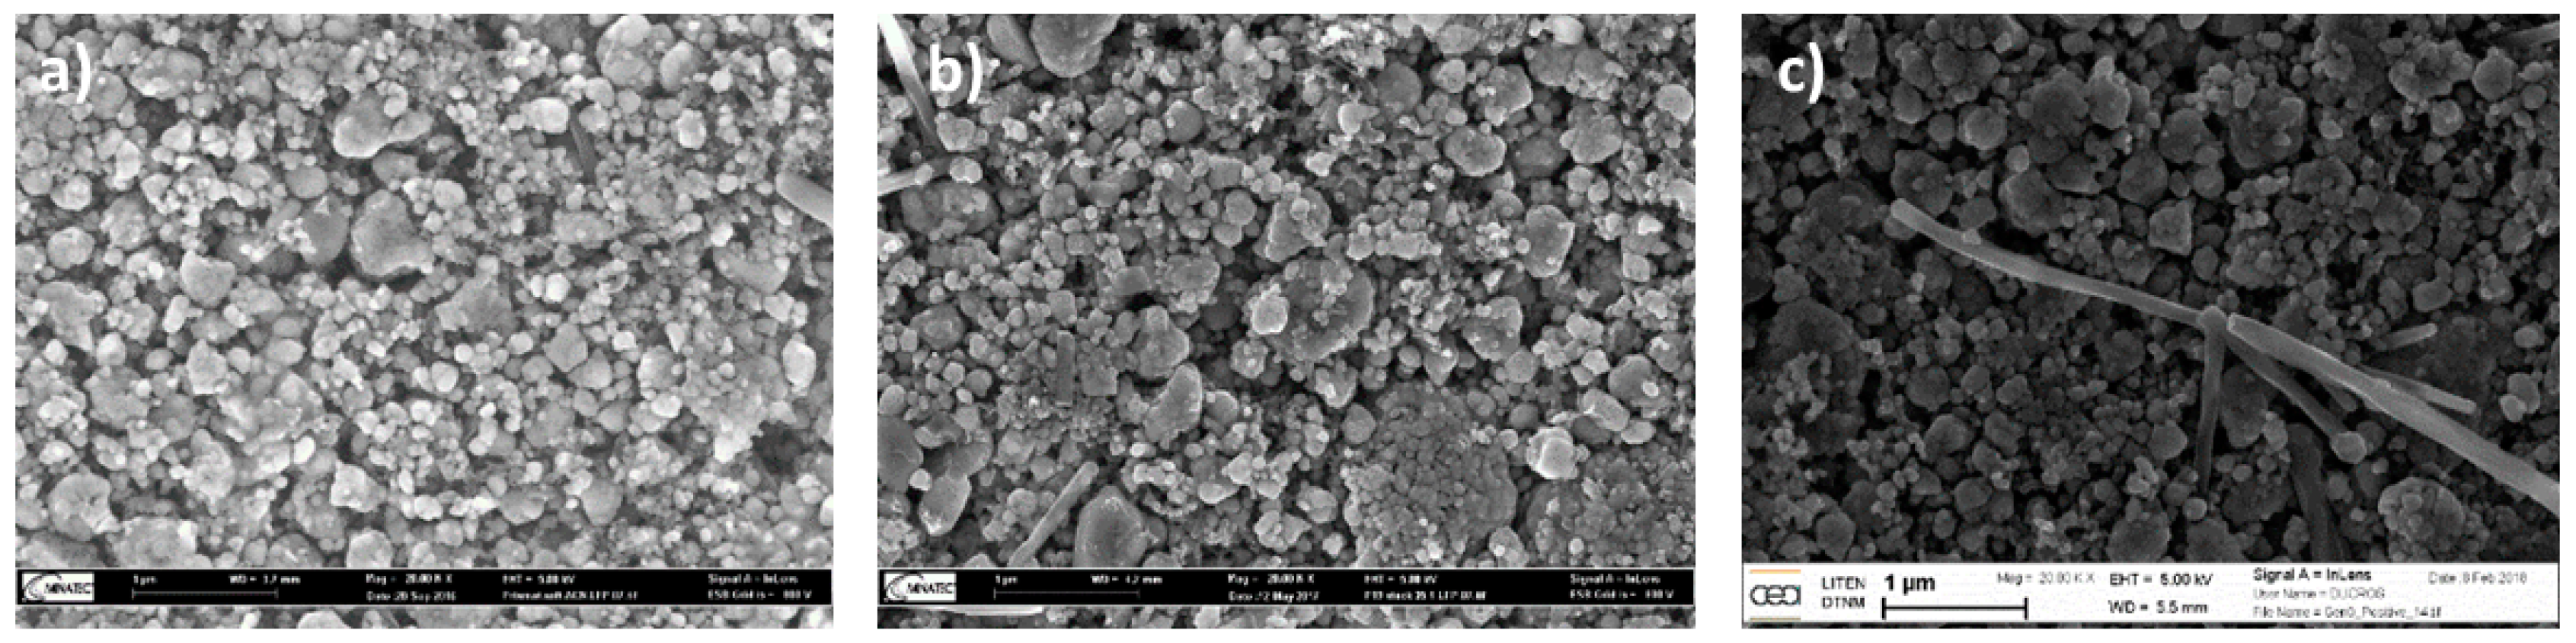
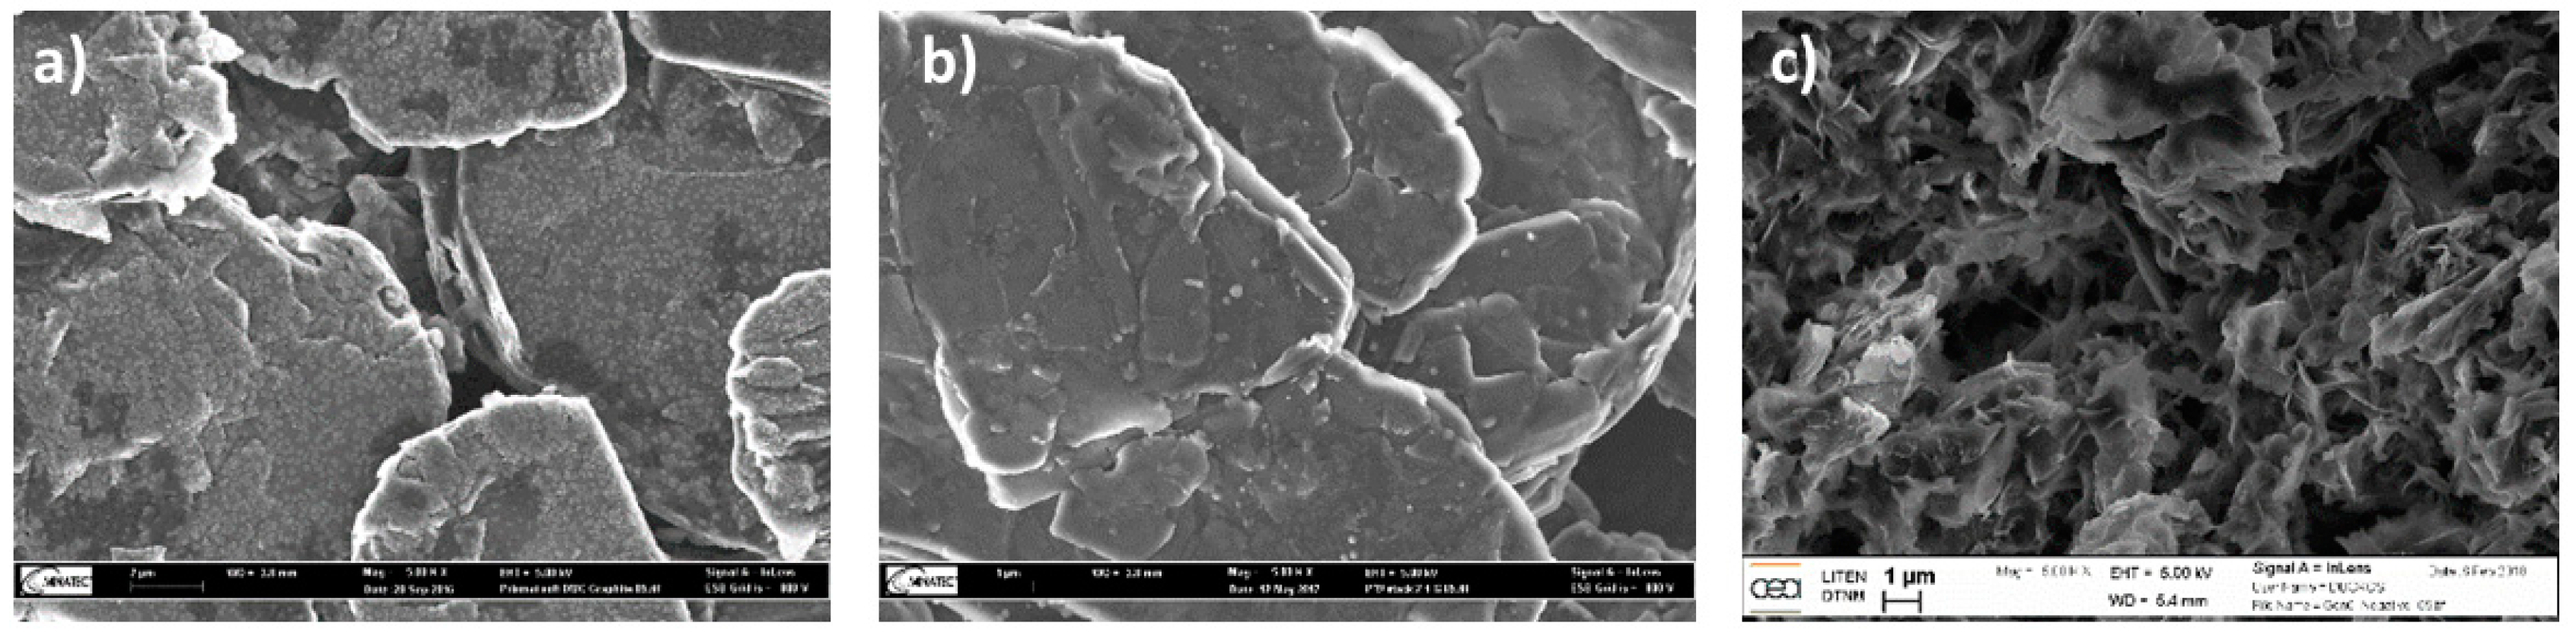
The SEM images in Figure 3 show the appearance of the LiFePO4 (LFP) electrodes at the beginning of the stack in the center position of the Fresh Cell, Cell A and Cell B. The electrodes are composed of a mixture of spherical particles and small amount of carbon fibers (used as conductive agent) of micrometric length. The larger spherical particles show a diameter comprised between 0.5 and 1 µm while the smaller particles have a diameter lower than 100 nm. Comparing the SEM images, no significant differences are observed. Additionally, no specific damage or deposit is visible.
Also, the cathode morphology did not show any relevant difference when sampled from different position in the stack and in the tape (edge vs. center) (see, respectively, Figures S2 and S3 in the Supplementary Materials). Furthermore, the energy dispersive X-ray (EDX) analysis (Figure S4 in the Supplementary Materials) does not reveal differences between Cell A and Cell B, nor the presence of contaminants. The elemental composition (Figure S4) is also similar to that of the fresh cell (only Fe, P, O and C are detected).
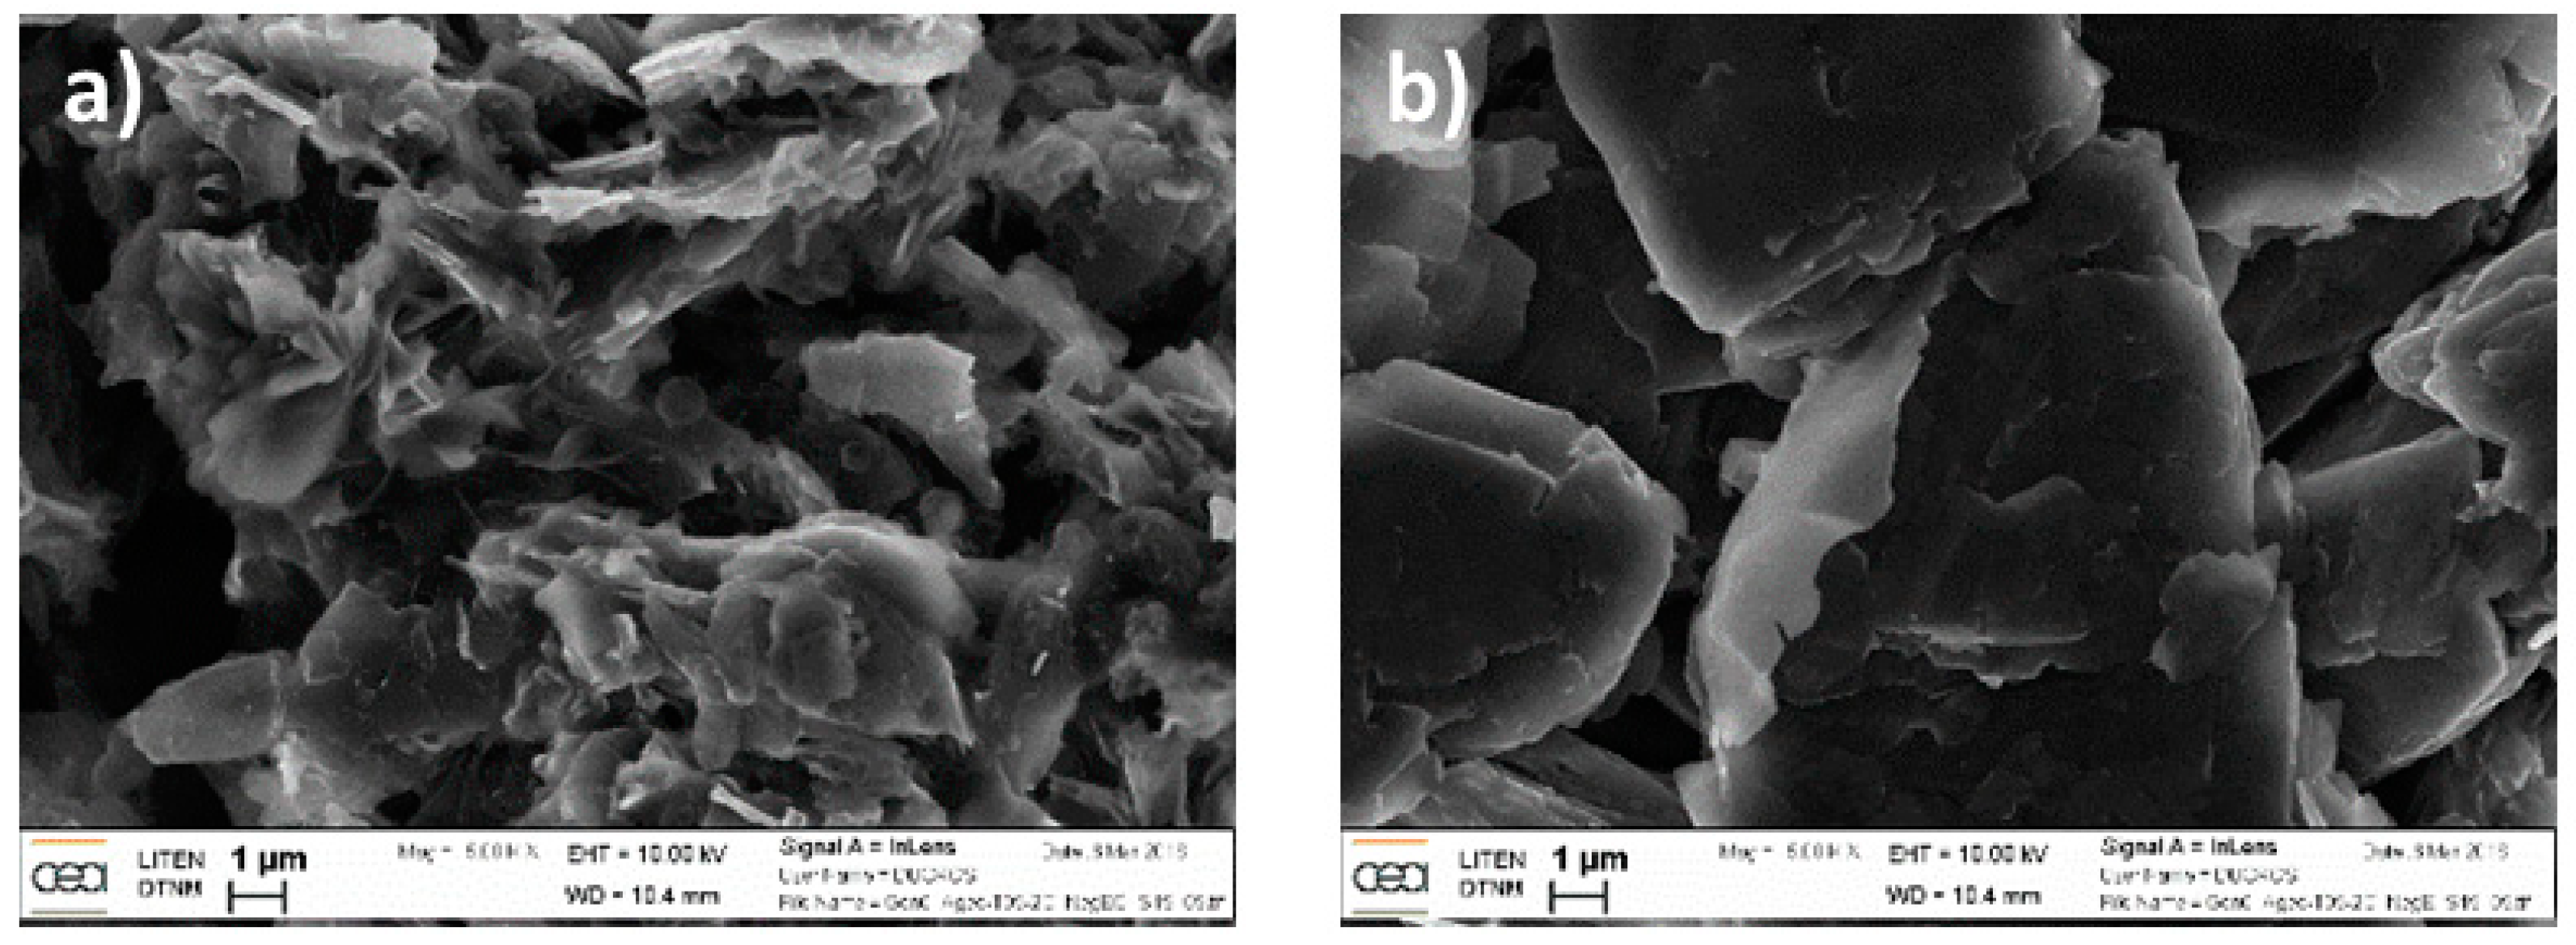
Figure 4 shows a few SEM images of the graphite electrode at the beginning of the stack in the center position, extracted from Fresh Cell (EDX spectra reported in Figure S5 in the Supplementary Materials), Cell A and Cell B. While no major difference between the electrodes from Fresh Cell and Cell A is observed, the anode of Cell B (cycled at 2C) shows the occurrence of graphite exfoliation (notice that several SEM images were taken using different samples to confirm the observed differences). Noteworthy, such exfoliation is not observed in the edge of the electrode (see Figure 5). Thus, a major difference between the center and the edge of the anode electrode is confirmed using both visual (see Figure 2) and SEM observations.
EDX analysis was performed on the samples extracted from both the center and the edge of the anode of Cell B (Figure S6 in Supplementary Materials). Surprisingly, no significant difference in terms of elemental composition was observed. EDX indicates the presence of O, P and F in both samples, due to electrolyte salt residue and the SEI. However, Fe traces were detected in the center (but not in the edge of the electrode) resulting from the cathode (LFP) decomposition. The Fe traces could be one of the reasons for the graphite exfoliation detected in the center of the electrode, even if Fe is not expected to be intercalated inside graphite.
The SEM pictures of the separator (Figure S7 in Supplementary Materials) do not show any damage upon ageing. The separator retained its porous structure upon cell ageing.

2.4. Residual Capacity Measurement

All samples used for the residual capacity determination were harvested from the electrode tapes taken from Area 2 in Figure 1d. The samples are named using the abbreviation given in Table 4, which describes their position in the stack and the electrode. Due to the poor adhesion of the anodic tape, the half-cell assembly with aged graphite anodes was not always possible therefore the residual capacity is analyzed using only the cathode.
The voltage profile obtained at 0.15 mA∙cm−2 (corresponding to 0.065C) for a pristine cathode tape is reported in 
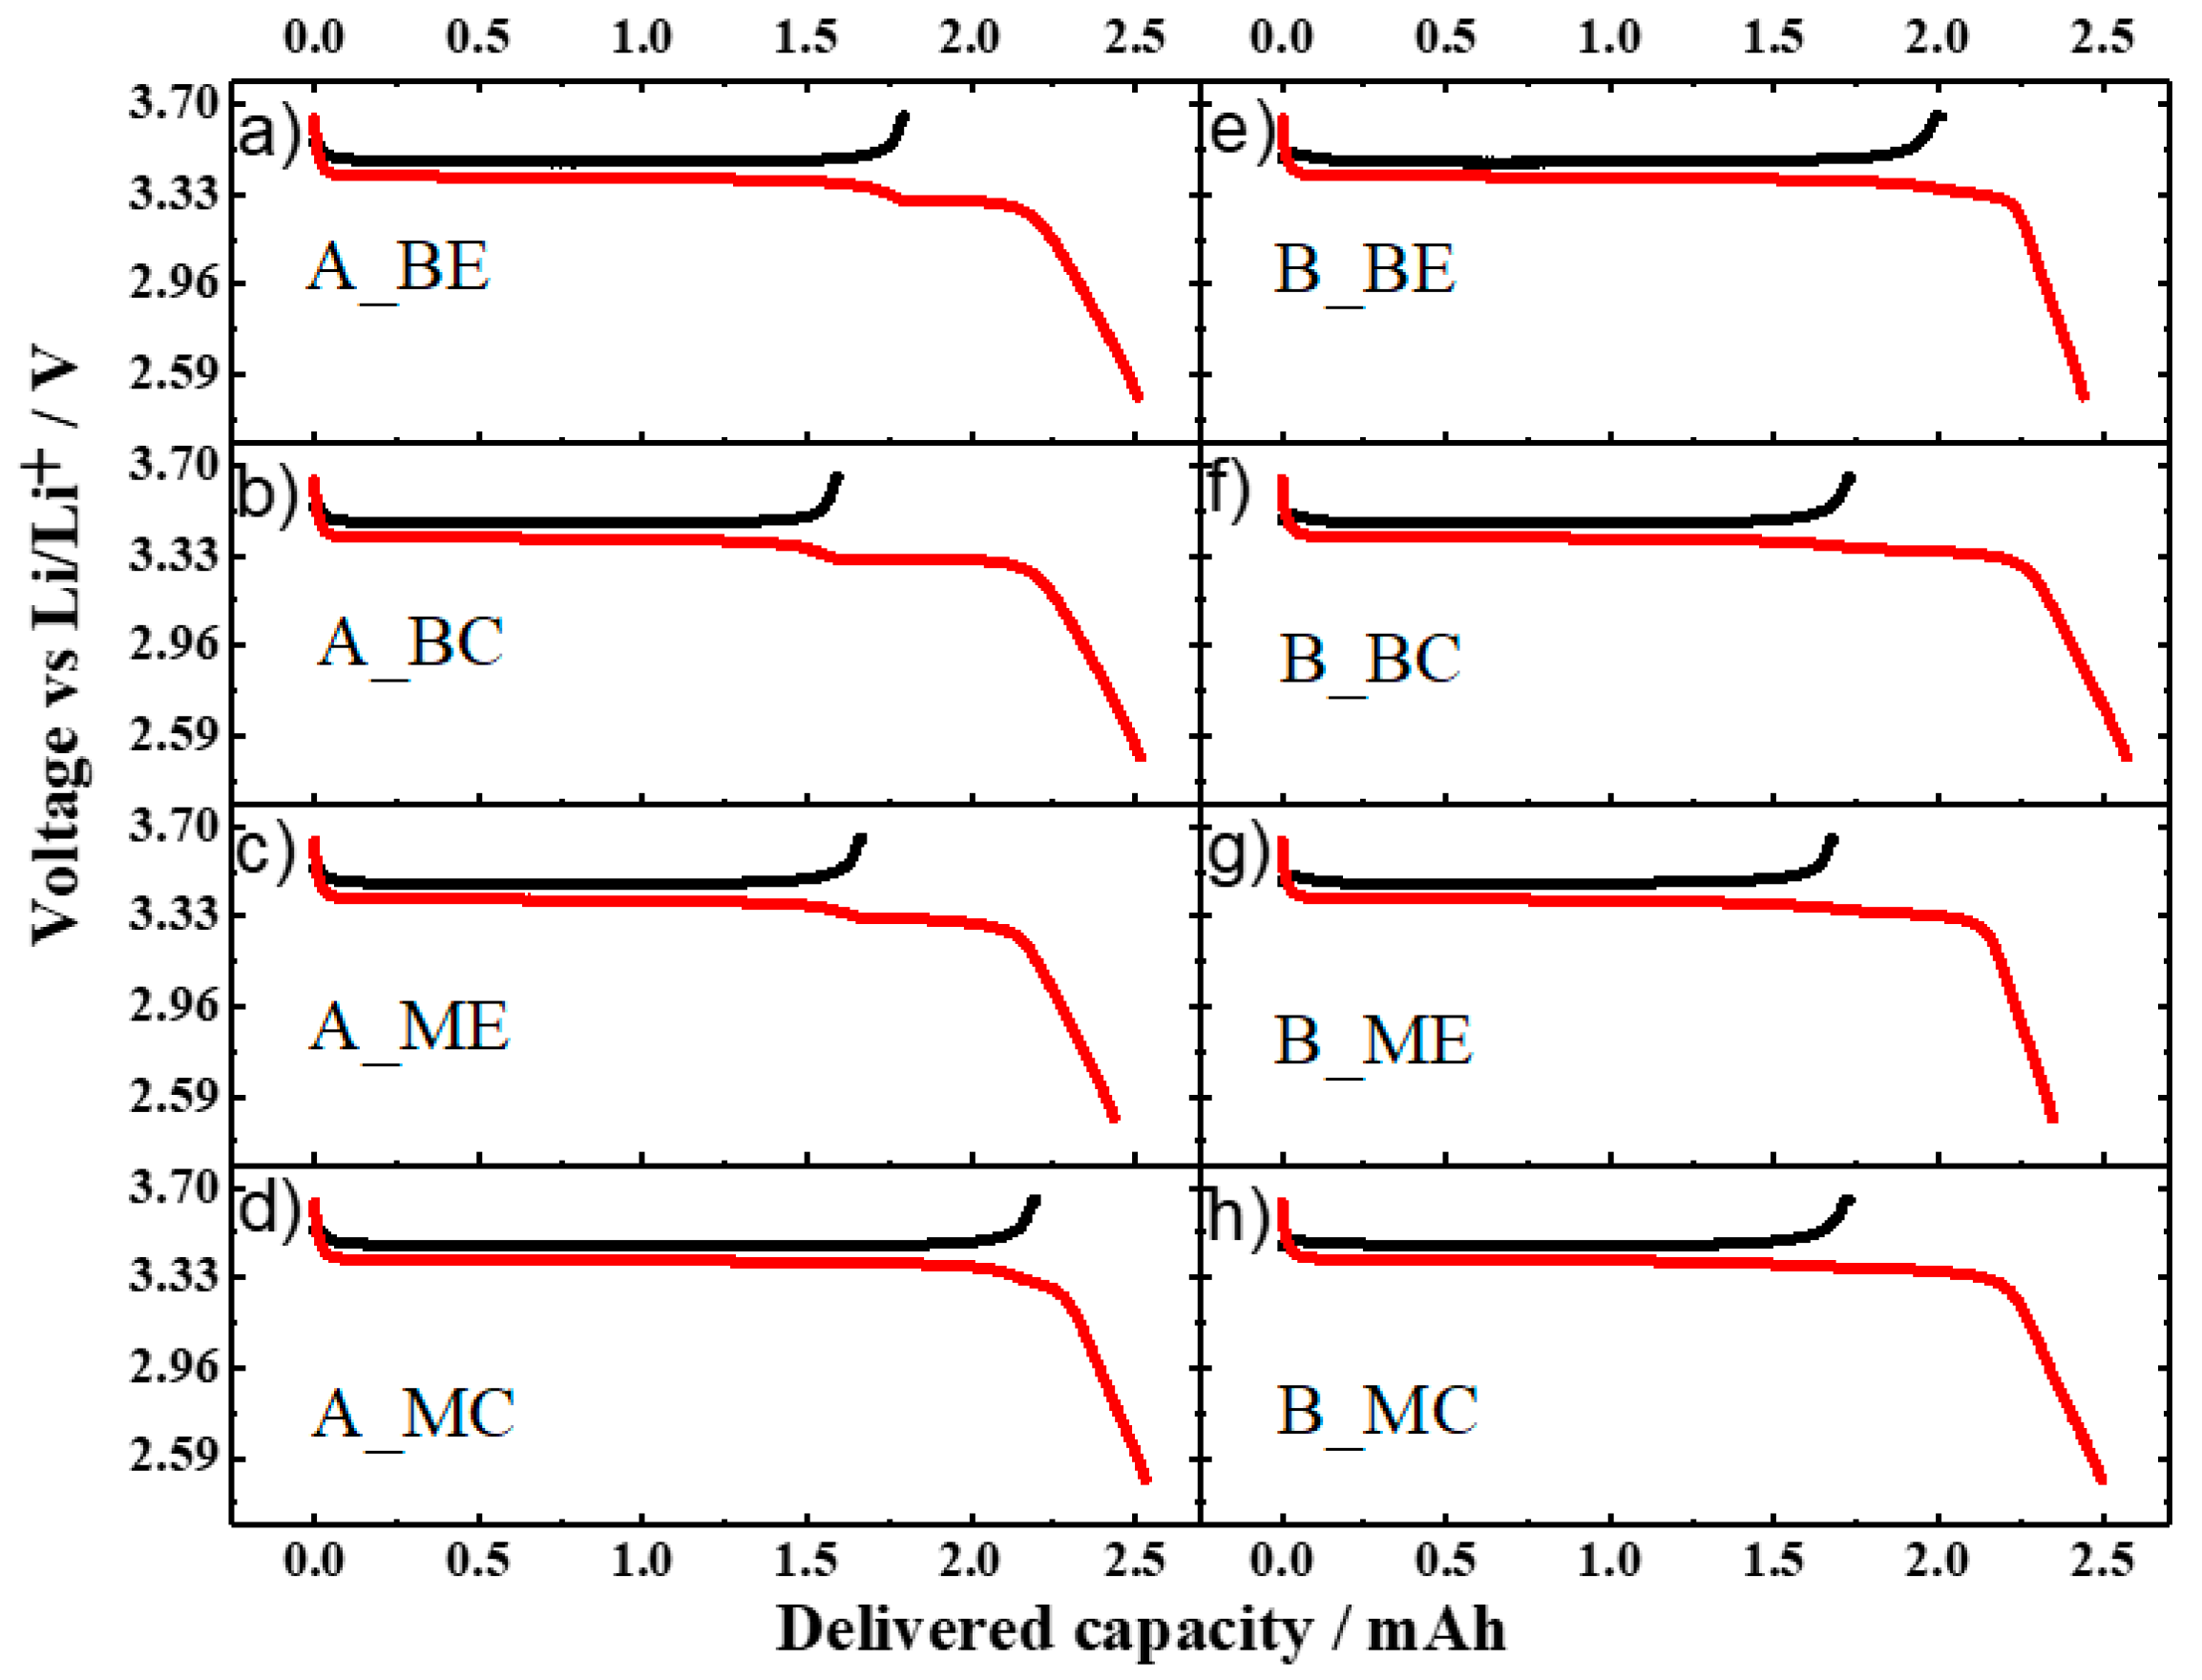
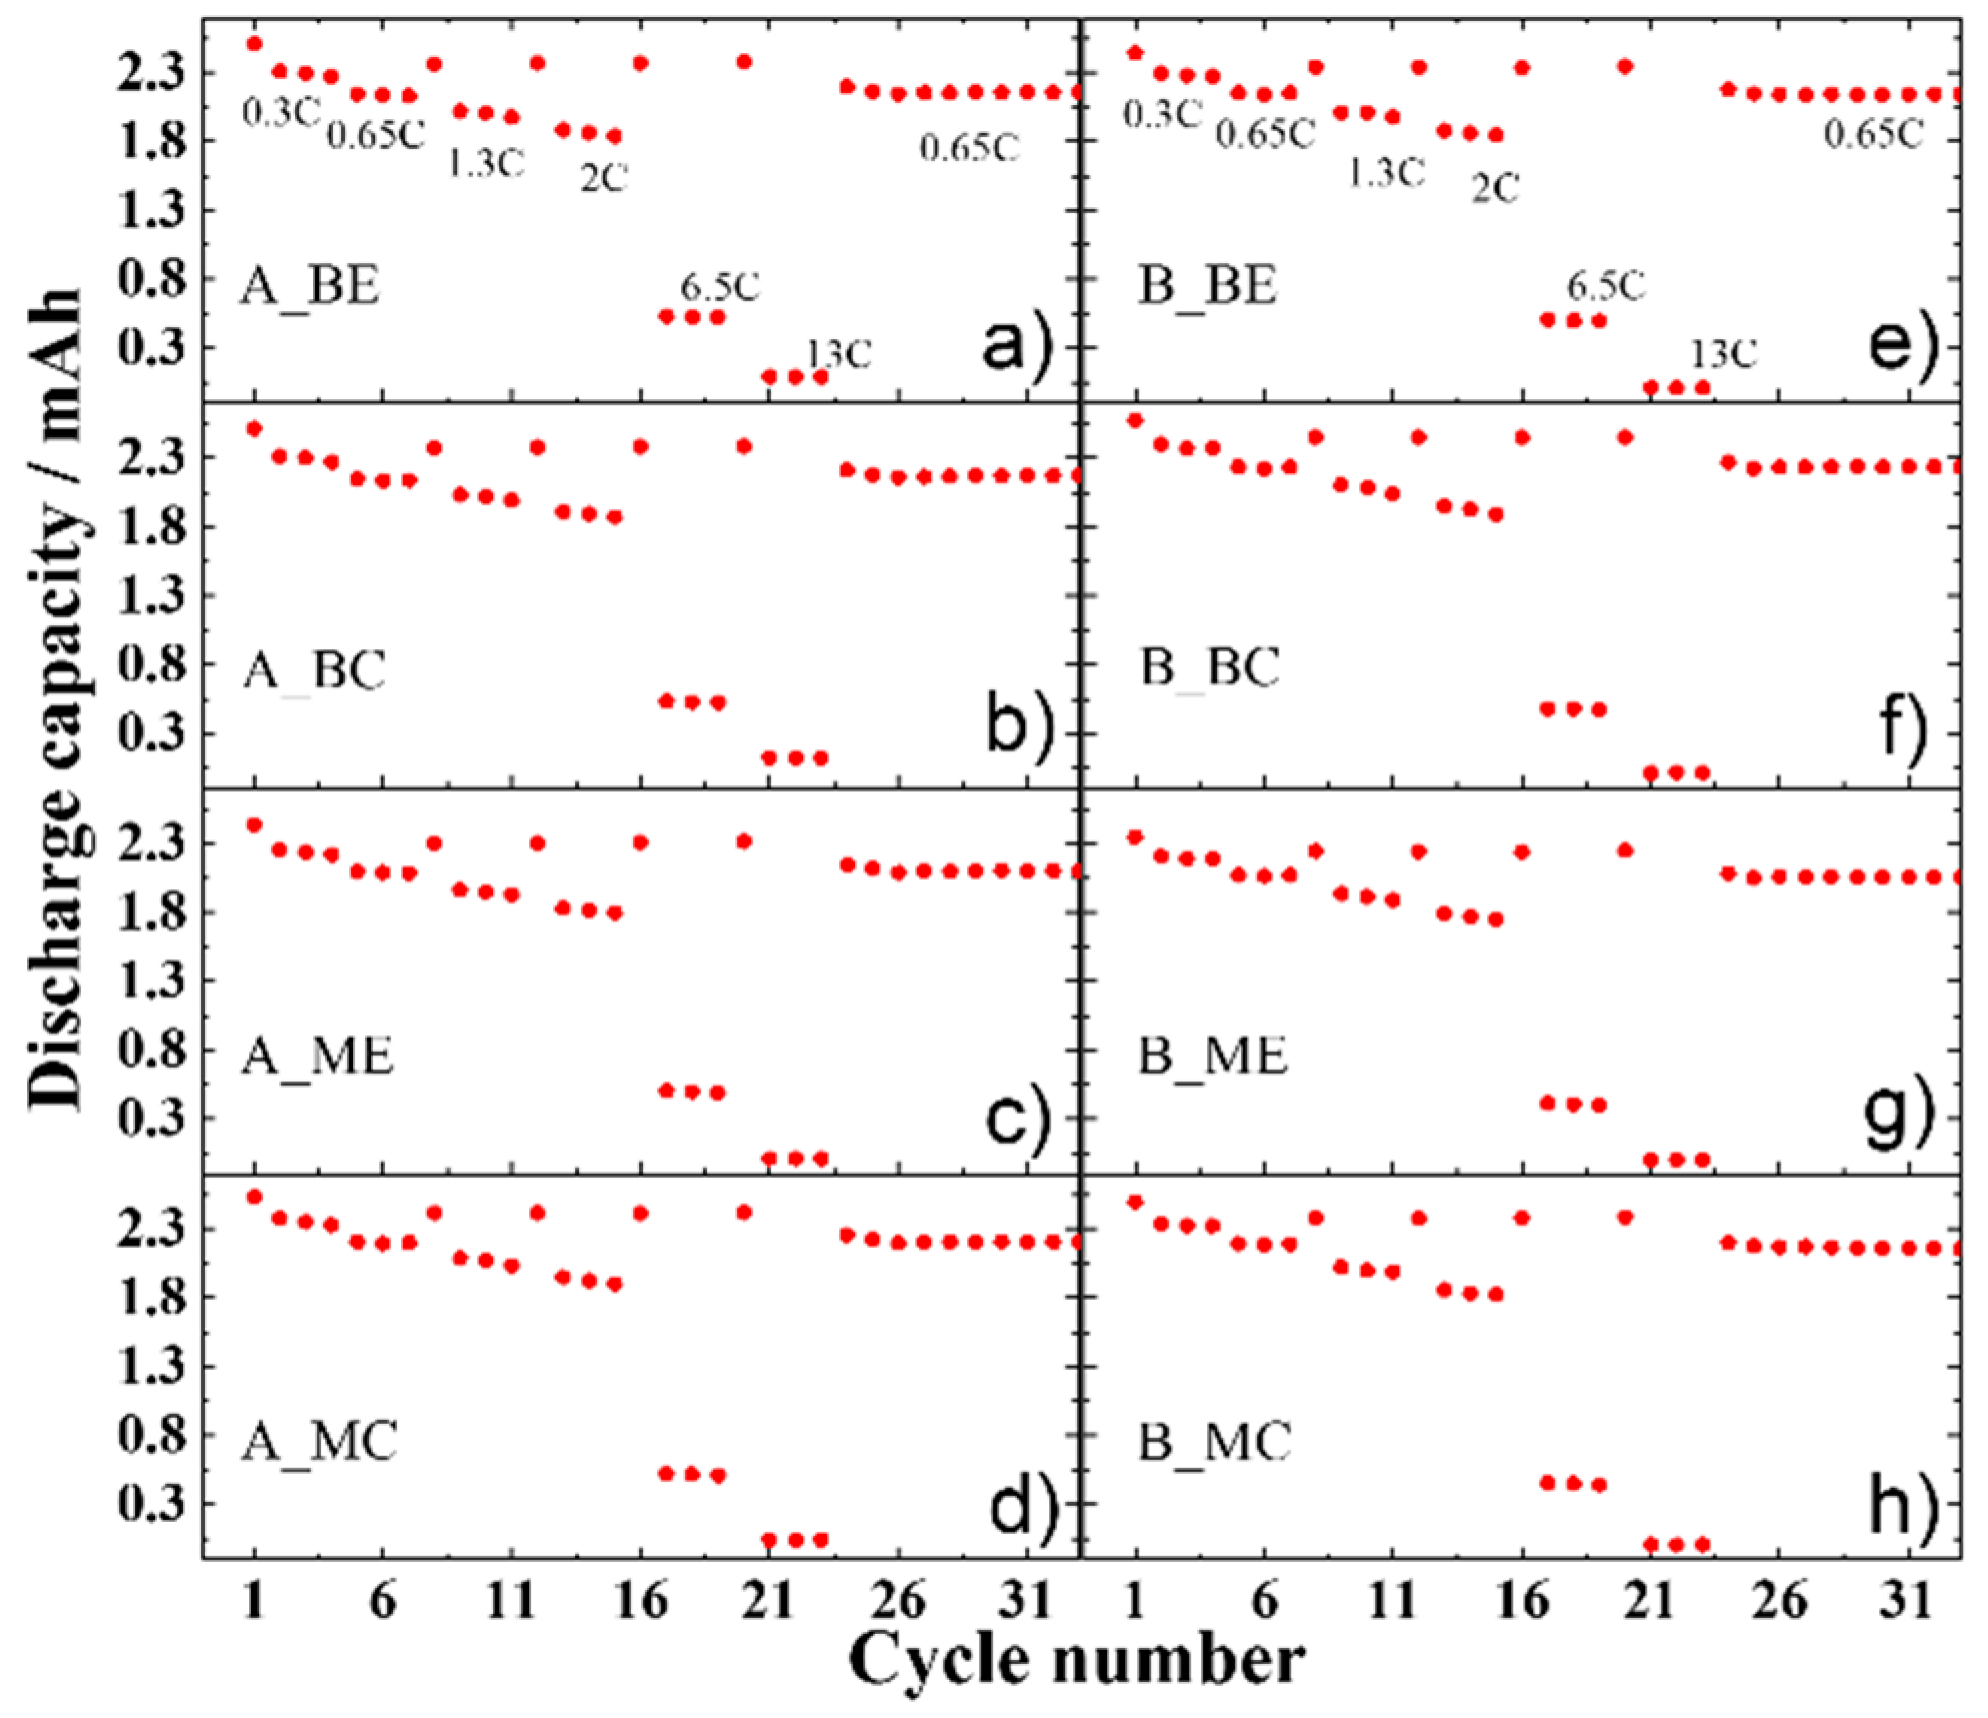
Figure S8 in the Supplementary Materials. The voltage profiles of the first cycle (charge comes first) of the aged cathodes performed in the same conditions are shown in Figure 6. It can be noticed that the residual charge capacity, i.e., the amount of Li+ extracted from the electrode, is not homogeneous along the stack and across the electrode tape.
For the cell aged at 0.3C, the sample A_MC delivered a high charge capacity of ca. 2.25 mAh, a value close to that of the pristine electrode. On the other hand, for the sample A_ME only 1.66 mAh were obtained. The situation is inverted for the samples taken at the beginning of the stack as the sample from the edge (A_BE) delivered a higher capacity (1.79 mAh) than that from the center (A_BC) (ca. 1.59 mAh). It is worth noting that, upon the subsequent lithiation, a “step” in the voltage profile appears. Its position matches well with the capacity value obtained during the previous de-lithiation. Therefore, we attributed this feature to the insertion of lithium into the LFP cathode, which did not occur during the ageing test. This means that, for all the samples, part of the cathode material was inactive during the ageing test, but not damaged. A similar situation is found for the voltage profiles of the aged cathodes from cell B (see Figure 6e–h). Here, the sample from the beginning of the stack and edge of the electrode (B _BE) delivered a capacity (ca. 2.0 mAh) higher than all the other samples (ca. 1.7 mAh). It is also noted that the resistance of Cell A cathode is higher than that of Cell B cathode as a marked overvoltage is present at the very beginning of the charge process (Figure S9 in the Supplementary Materials).
After the first discharge (lithiation of LFP), all the electrodes perform equally in the rate capability test shown in Figure 7 (cycling protocol described in Table S2 in the Supplementary Materials), indicating that the cathode material structure did not undergo significant damages independent on the position in the stack and across the tape. Therefore, the loss of active material (LAM) is negligible compared to the loss of lithium inventory (LLI).
Overall, the same trend of the residual capacity is observed for both aged cells, i.e., MC > ME and BE > BC, but the non-uniformity is more marked for Cell A than Cell B. The observed inhomogeneous LLI can be attributed to a different extent of side reactions (e.g., SEI formation at the facing anode) caused by variations of the electronic contact (due to differences in the internal pressure) and/or ionic conduction through the electrode (inhomogeneous electrode wetting).
It can be inferred that, in the middle of the stack and in the center of the electrode (MC), more LFP is reversibly cycled than at the edge, probably due to the better contact induced by the higher internal pressure. This would also result in a better anode SEI, with a lower consumption of the Li+ inventory to repair it upon cycling. On the contrary, at the beginning of the stack, the edge part of the electrode (BE) is more electrochemically active. Recalling the SEM results for Cell B, graphite exfoliation was observed in the center of the electrode, but not at the edges.

2.5. Structural Analysis

The inhomogeneity revealed by the electrochemical tests is confirmed by phase quantification via Rietveld refinement of the XRD patterns of aged cathode electrodes (Figure S10 in Supplementary Materials). The results are summarized in Table 5. Considering that the cells were opened in the fully discharged state, the cathode material should mostly consist of LiFePO4 but FePO4 could also be present if the discharge process is not complete due to lack of available lithium. For Cell A, the trend that a higher fraction of LiFePO4 is present in samples BE than BC is confirmed (and double checked with the samples taken at the end of the stack EE). On the other hand, discrepancies are found for electrodes in the middle of the stack for which the XRD investigation detects more LiFePO4 at the edge than in the center, revealing that the inhomogeneity is more pronounced in this part of the stack.
The diffraction patterns of the anodes have been analysed for the shift of the first graphite peak at 26.8° (Figure S11). The shift towards lower angle of the 00l reflection is linked with graphite interlayer expansion upon lithium intercalation [12] The shift is larger in the Fresh Cell, while among the aged samples, Cell B showed the smallest shift, indicative of a lower amount of Li+ remaining trapped into the graphite layers (the cells are opened in the fully discharged state, i.e., Li+ ions should be fully removed). This translates into a higher lithiation of the cathode. Indeed, a higher LiFePO4 content is observed in the cathode sample B_BC than A_BC (75% and 70%, respectively), which matches well with the slightly higher residual capacity (Figure 6) obtained for the B_BC cathode than the A_BC cathode (1.73 and 1.59 mAh, respectively).

2.6. Surface Analysis

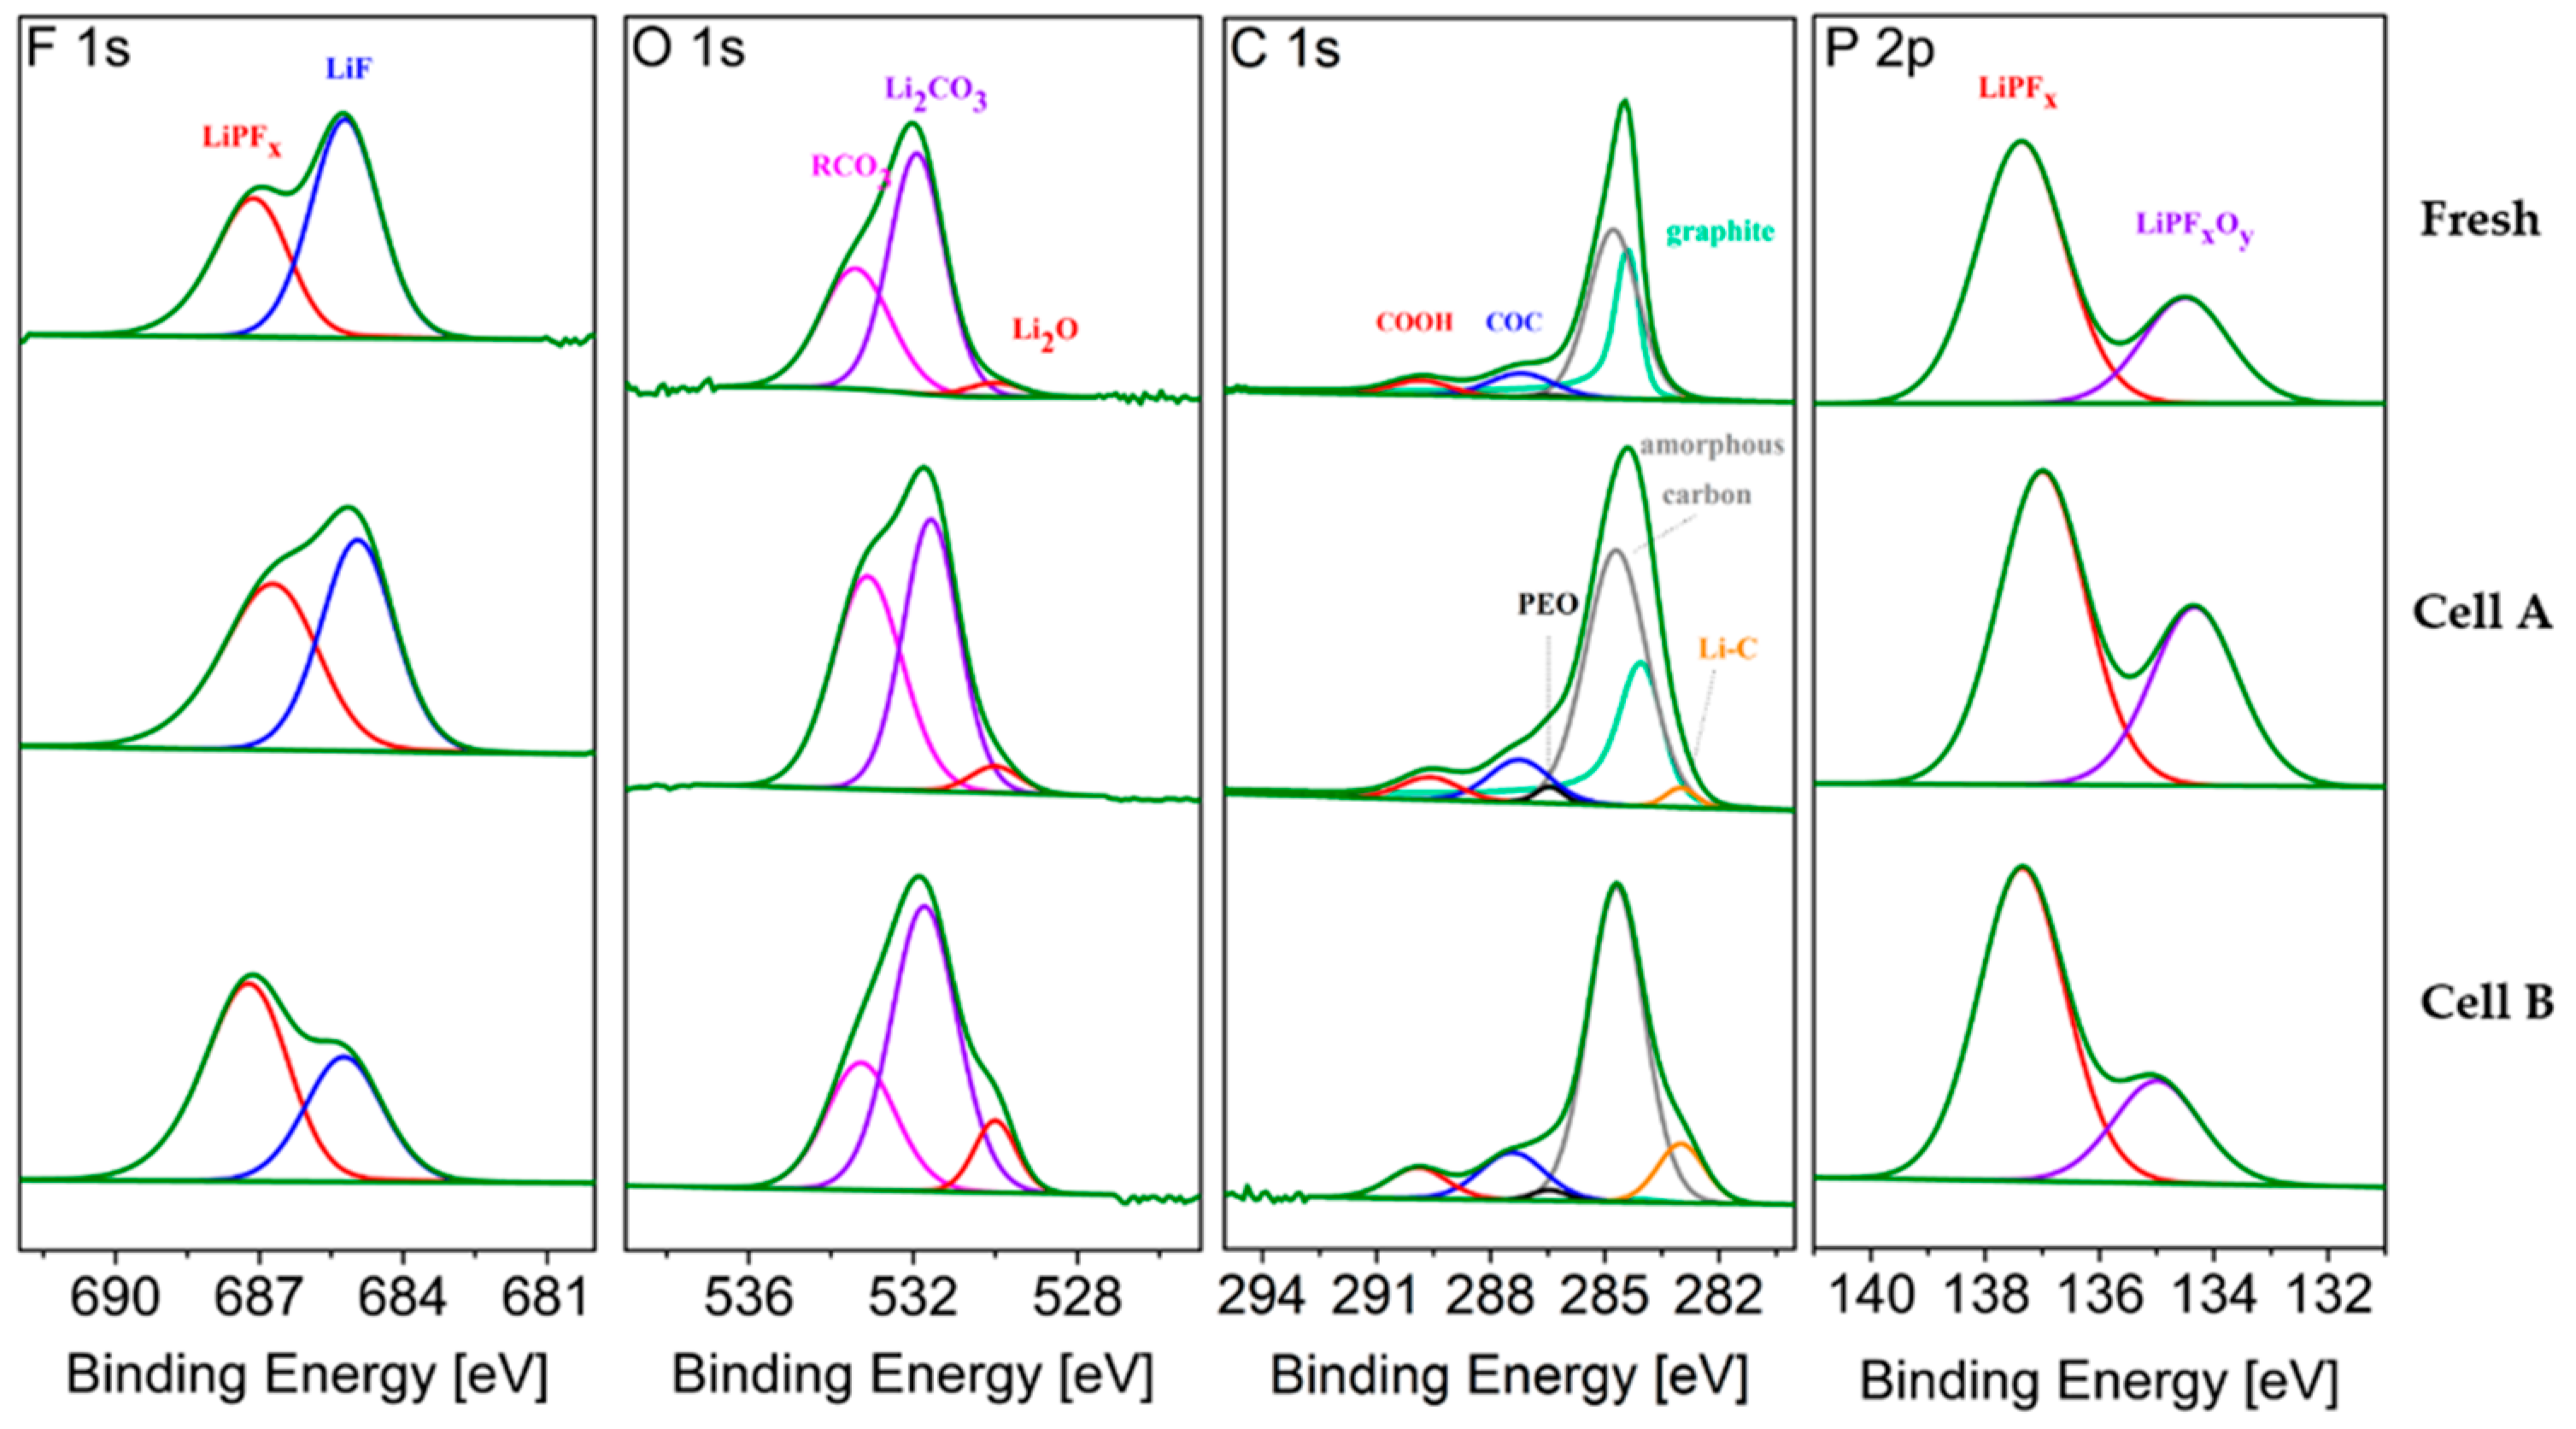
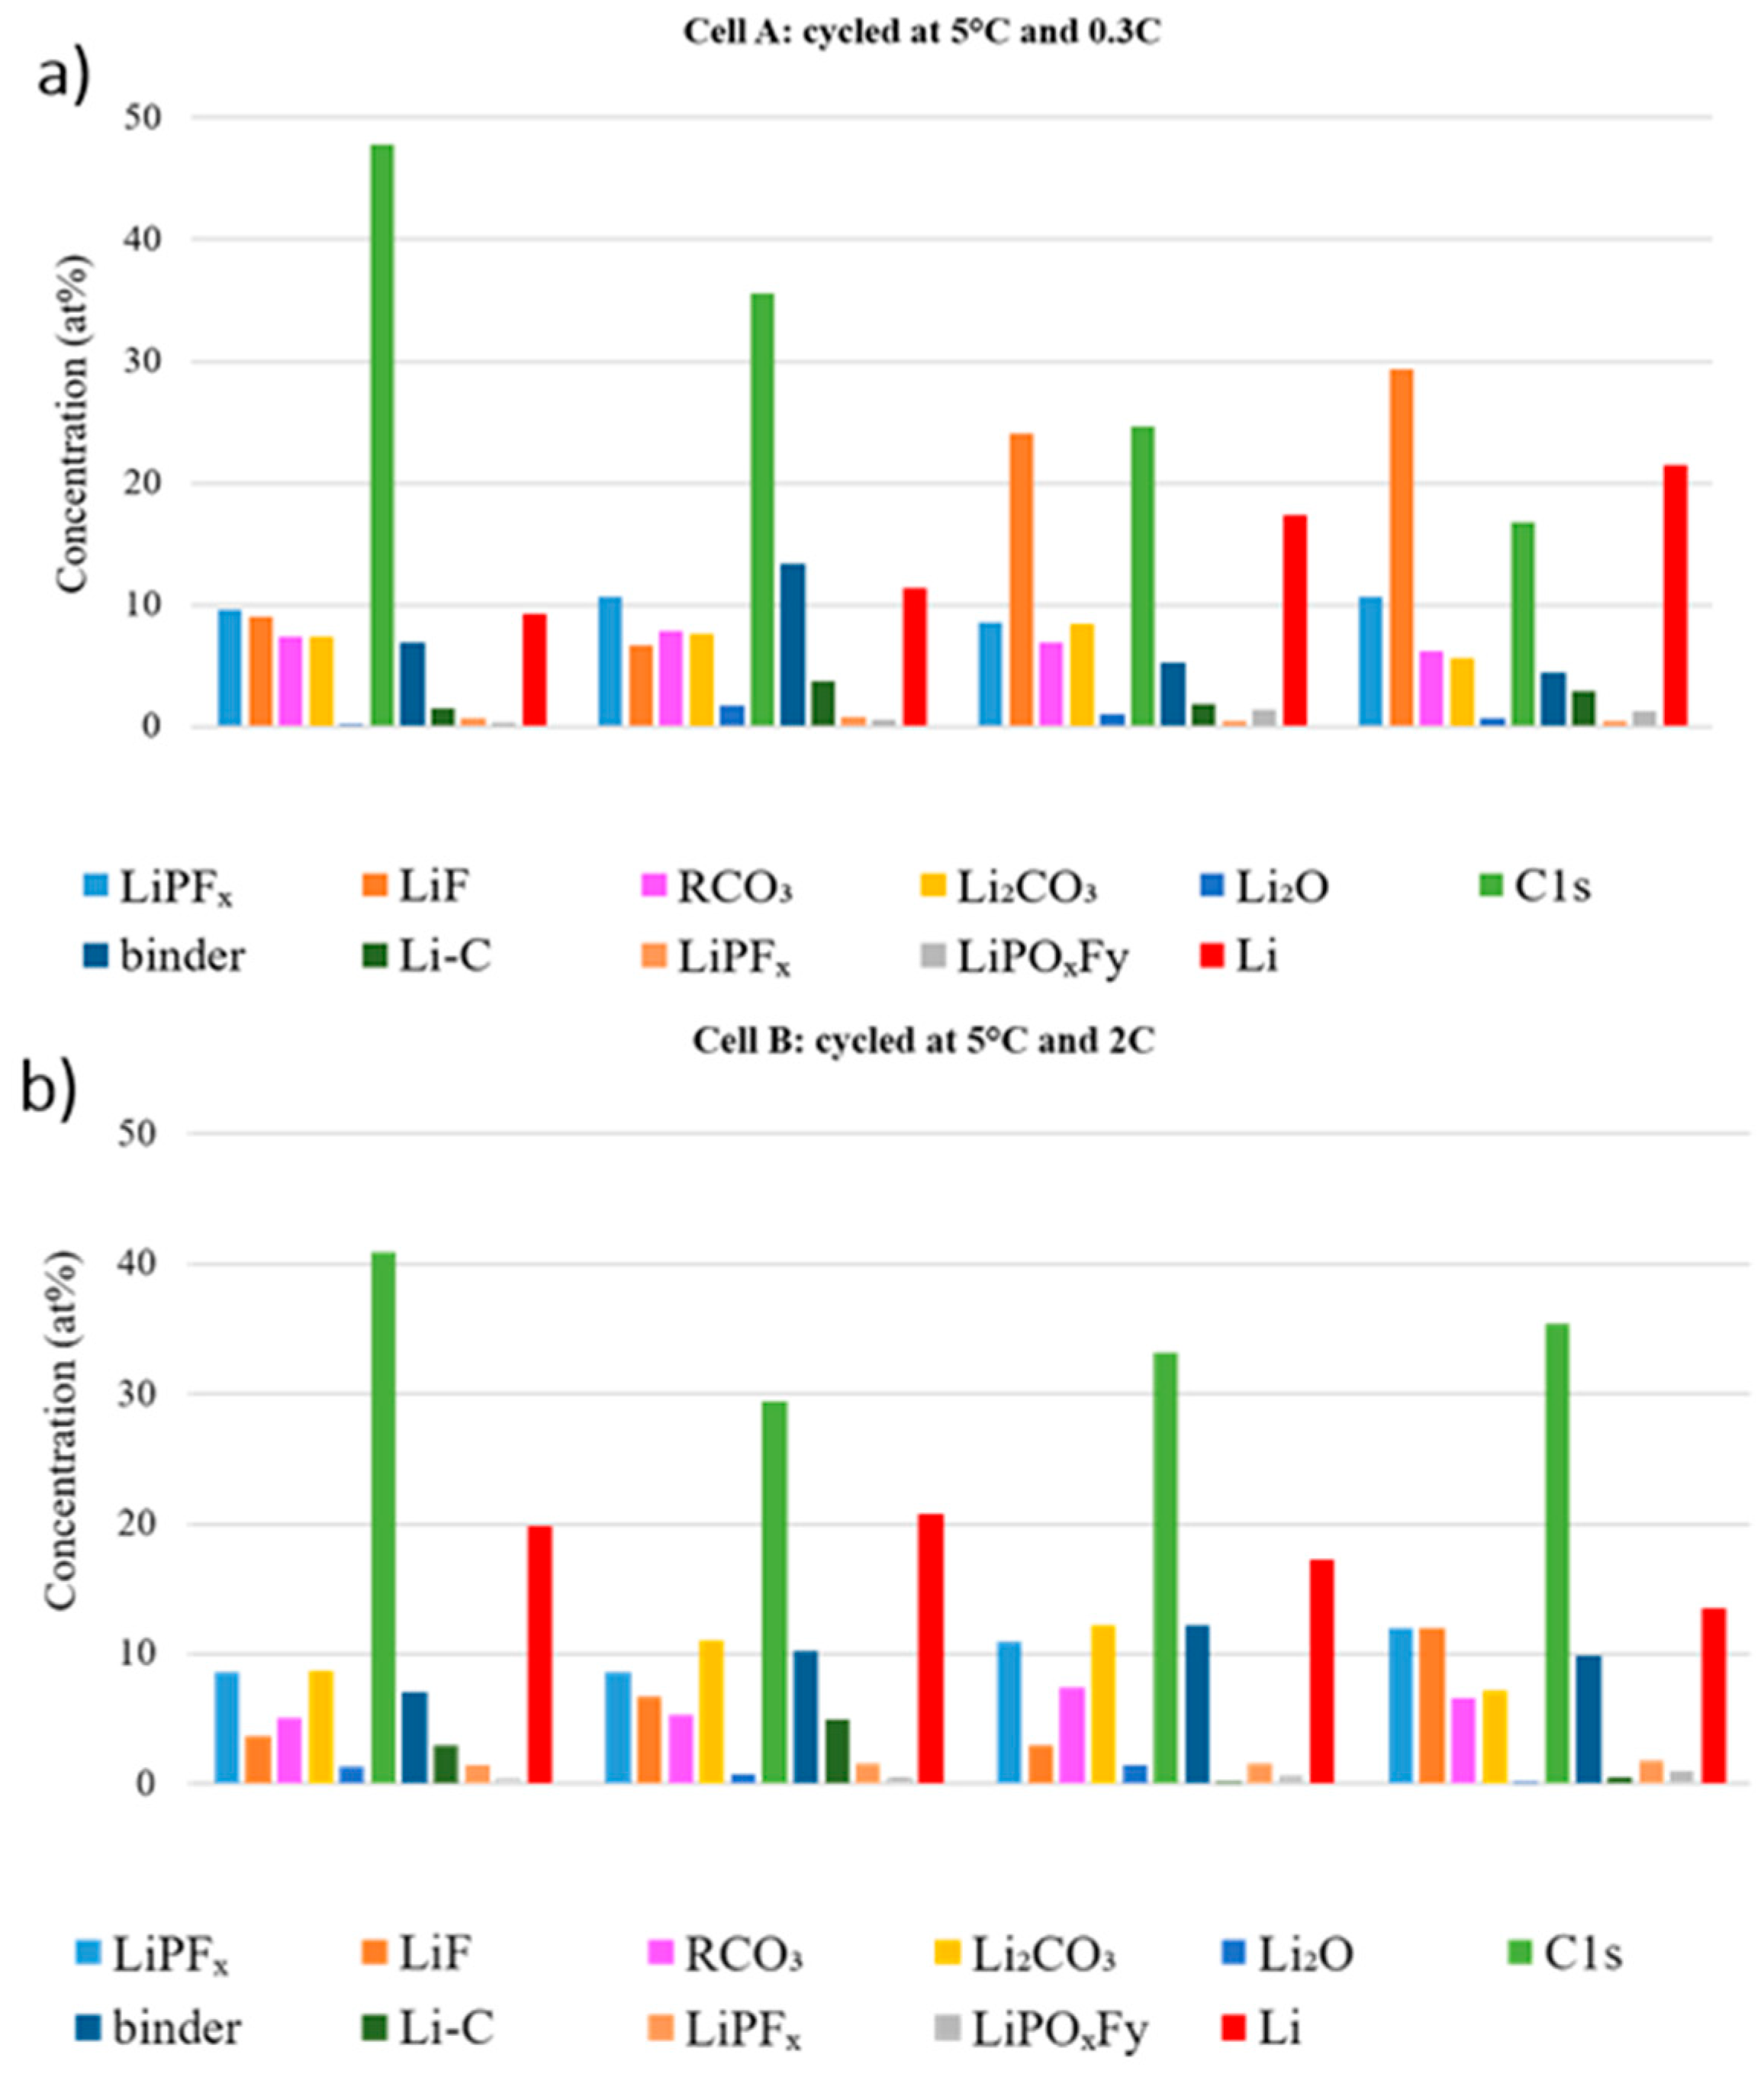
The XPS spectra of graphite samples, harvested from the middle of the stack and at the center of the electrodes (MC), from fresh and aged cells are compared in Figure 8. The average atomic compositions are reported in Table 6. Sputter depth profiling was conducted to obtain information on the SEI composition and thickness.
Upon ageing, the SEI on graphite is expected to grow, consuming lithium and thus contributing to the LLI. Figure 8 shows the typical LiPF6 (electrolyte salt) decomposition products, i.e., LiF, LiPFx and LiPOxFy, that are detected in the F 1s and P 2p regions [13]. Their relative ratio changes upon ageing. The sum of the atomic fractions derived from these three peaks after 600 s of sputtering (Table 6) represents 3.3, 5.0 and 5.6 % at. for the Fresh Cell, Cell A and Cell B, respectively, showing that a slightly higher salt decomposition occurred in Cell B upon cycling, as also highlighted by the higher signal detected for LiPFx (P 2p region).
The O 1s spectra of the graphite electrodes (Figure 8) consists of three peaks. The first peak, at the lowest energy, is assigned to lithium oxide, which is a well-known component of the inner part of the SEI [14], but it also corresponds to the degradation product of Li2CO3 induced by the sputtering process itself [15]. After ageing, the Li2O feature is more pronounced in the cell cycled at 2C (cell B). The sputtering results in Table 6 indicate more Li2O in the inner layer of the SEI of aged graphite electrodes. The second peak, assigned to Li2CO3, also grows slightly upon ageing. The peak at the highest binding energy, assigned to organic carbonates, increases more on the surface of the electrode during ageing at 0.3C (cell A), while after 600 s sputtering more organic carbonates are found in Cell B. Before sputtering, the oxygen containing components found in the O 1s region of the graphite from the fresh cell represent 12.11 % at., which increases to 14.98 % at. upon cycling at 0.3 C and 15 % at. 2C.
To eliminate the error caused by the overlapping of graphite and amorphous carbon signals, the sum of their contributions is labeled C 1s in Table 6. This contribution decreases upon cycling indicating that the SEI becomes thicker, thus hiding the graphite contribution. The Li-C signal at 600 s increases in the cycled electrodes, being more pronounced for Cell A (0.3C). This further confirms that the SEI is thicker in the cell cycled at higher C-rate (Cell B).
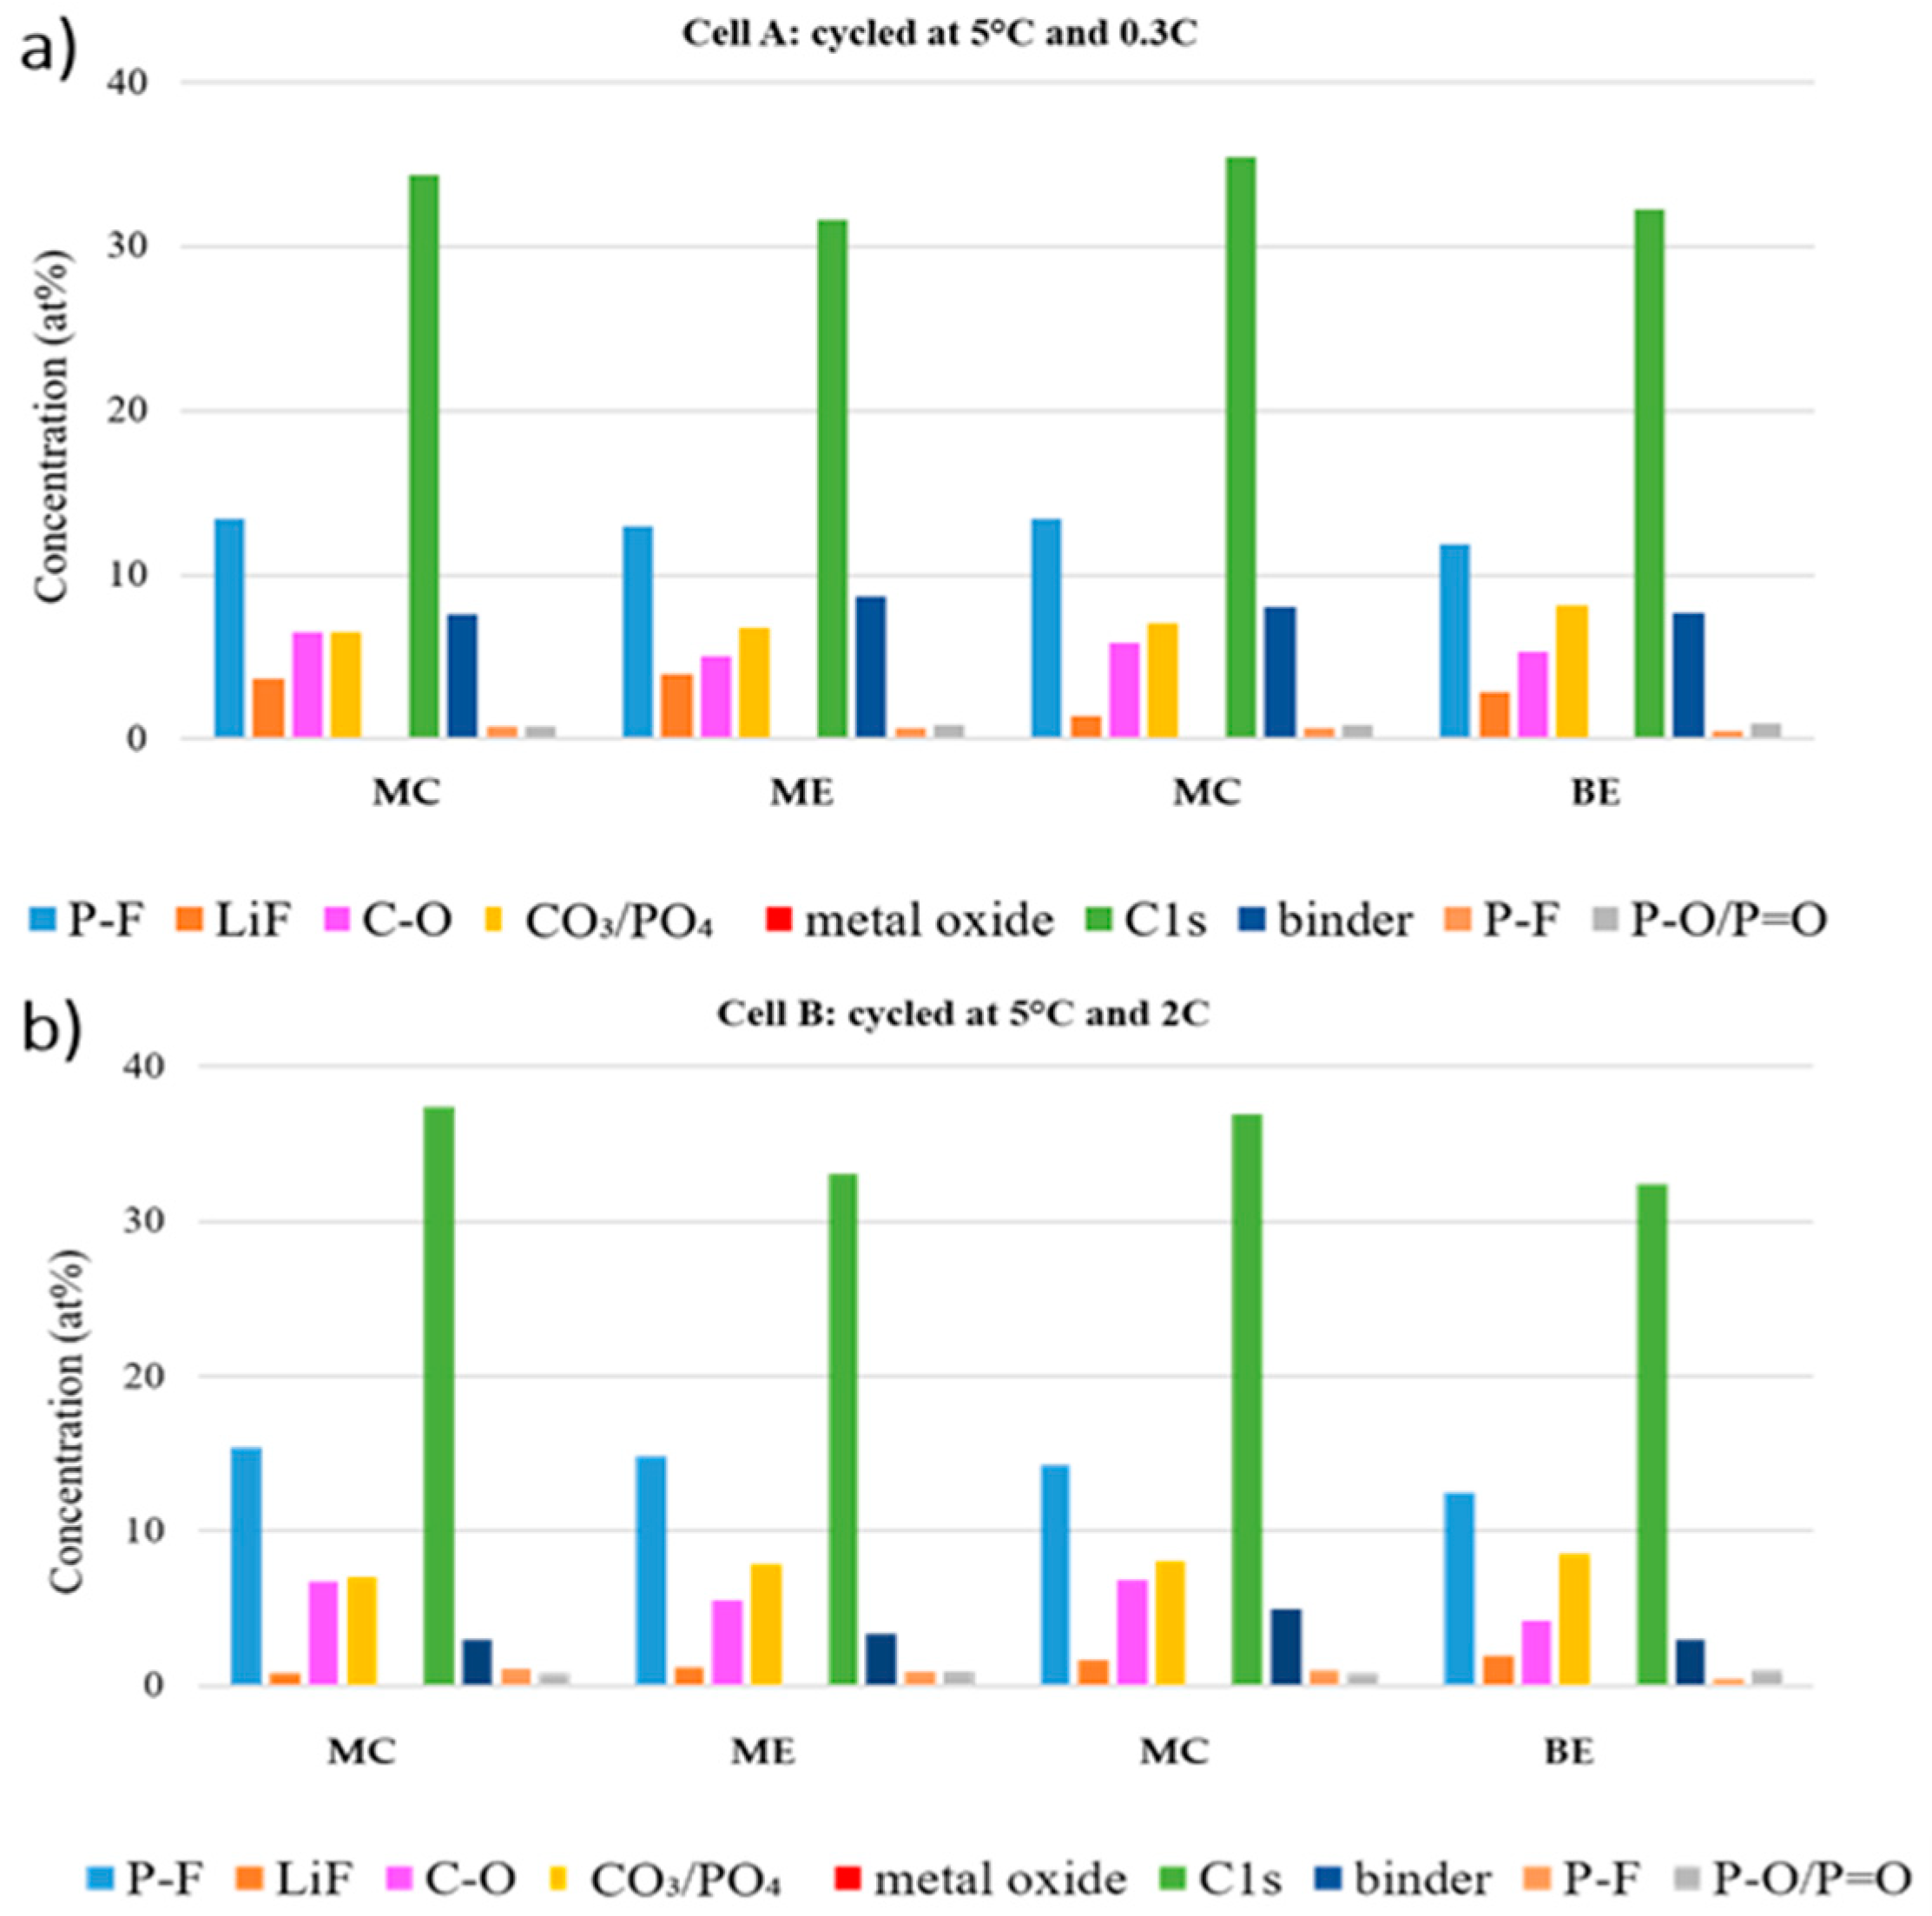
To investigate the effect of electrode position on the SEI build-up, Figure 9 compares the atomic fraction observed at the center and edge of the electrode tape from the beginning and the middle of the stack for the aged cells. The LiPFx, LiF and LiPOxFy % at. compositions are overall higher at the edge of the graphite tape, which means that LiPF6 degrades more extensively there. Additionally, more LiPF6 degradation products are detected in the outer layers of the stack. Overall, the amount of salt decomposition products is higher, whatever the position, in the cell cycled at 0.3C.
In Cell A, the C 1s and binder features decrease dramatically in the beginning of the stack, which indicates that the SEI is thicker than in the middle of the stack. On the other hand, the carbon features in the beginning of the stack in Cell B is higher than Cell A, which is an opposite trend comparing to the middle of the stack. For Li compounds there is no clear trend, which makes it challenging to obtain a reliable relation between different positions.
Generally, for both cycled cells, the differences due to sample location are in the same range as the differences between the two cells. These findings can be correlated to the visual observation of several variations in color and thickness along the electrode stack and across each electrode tape.
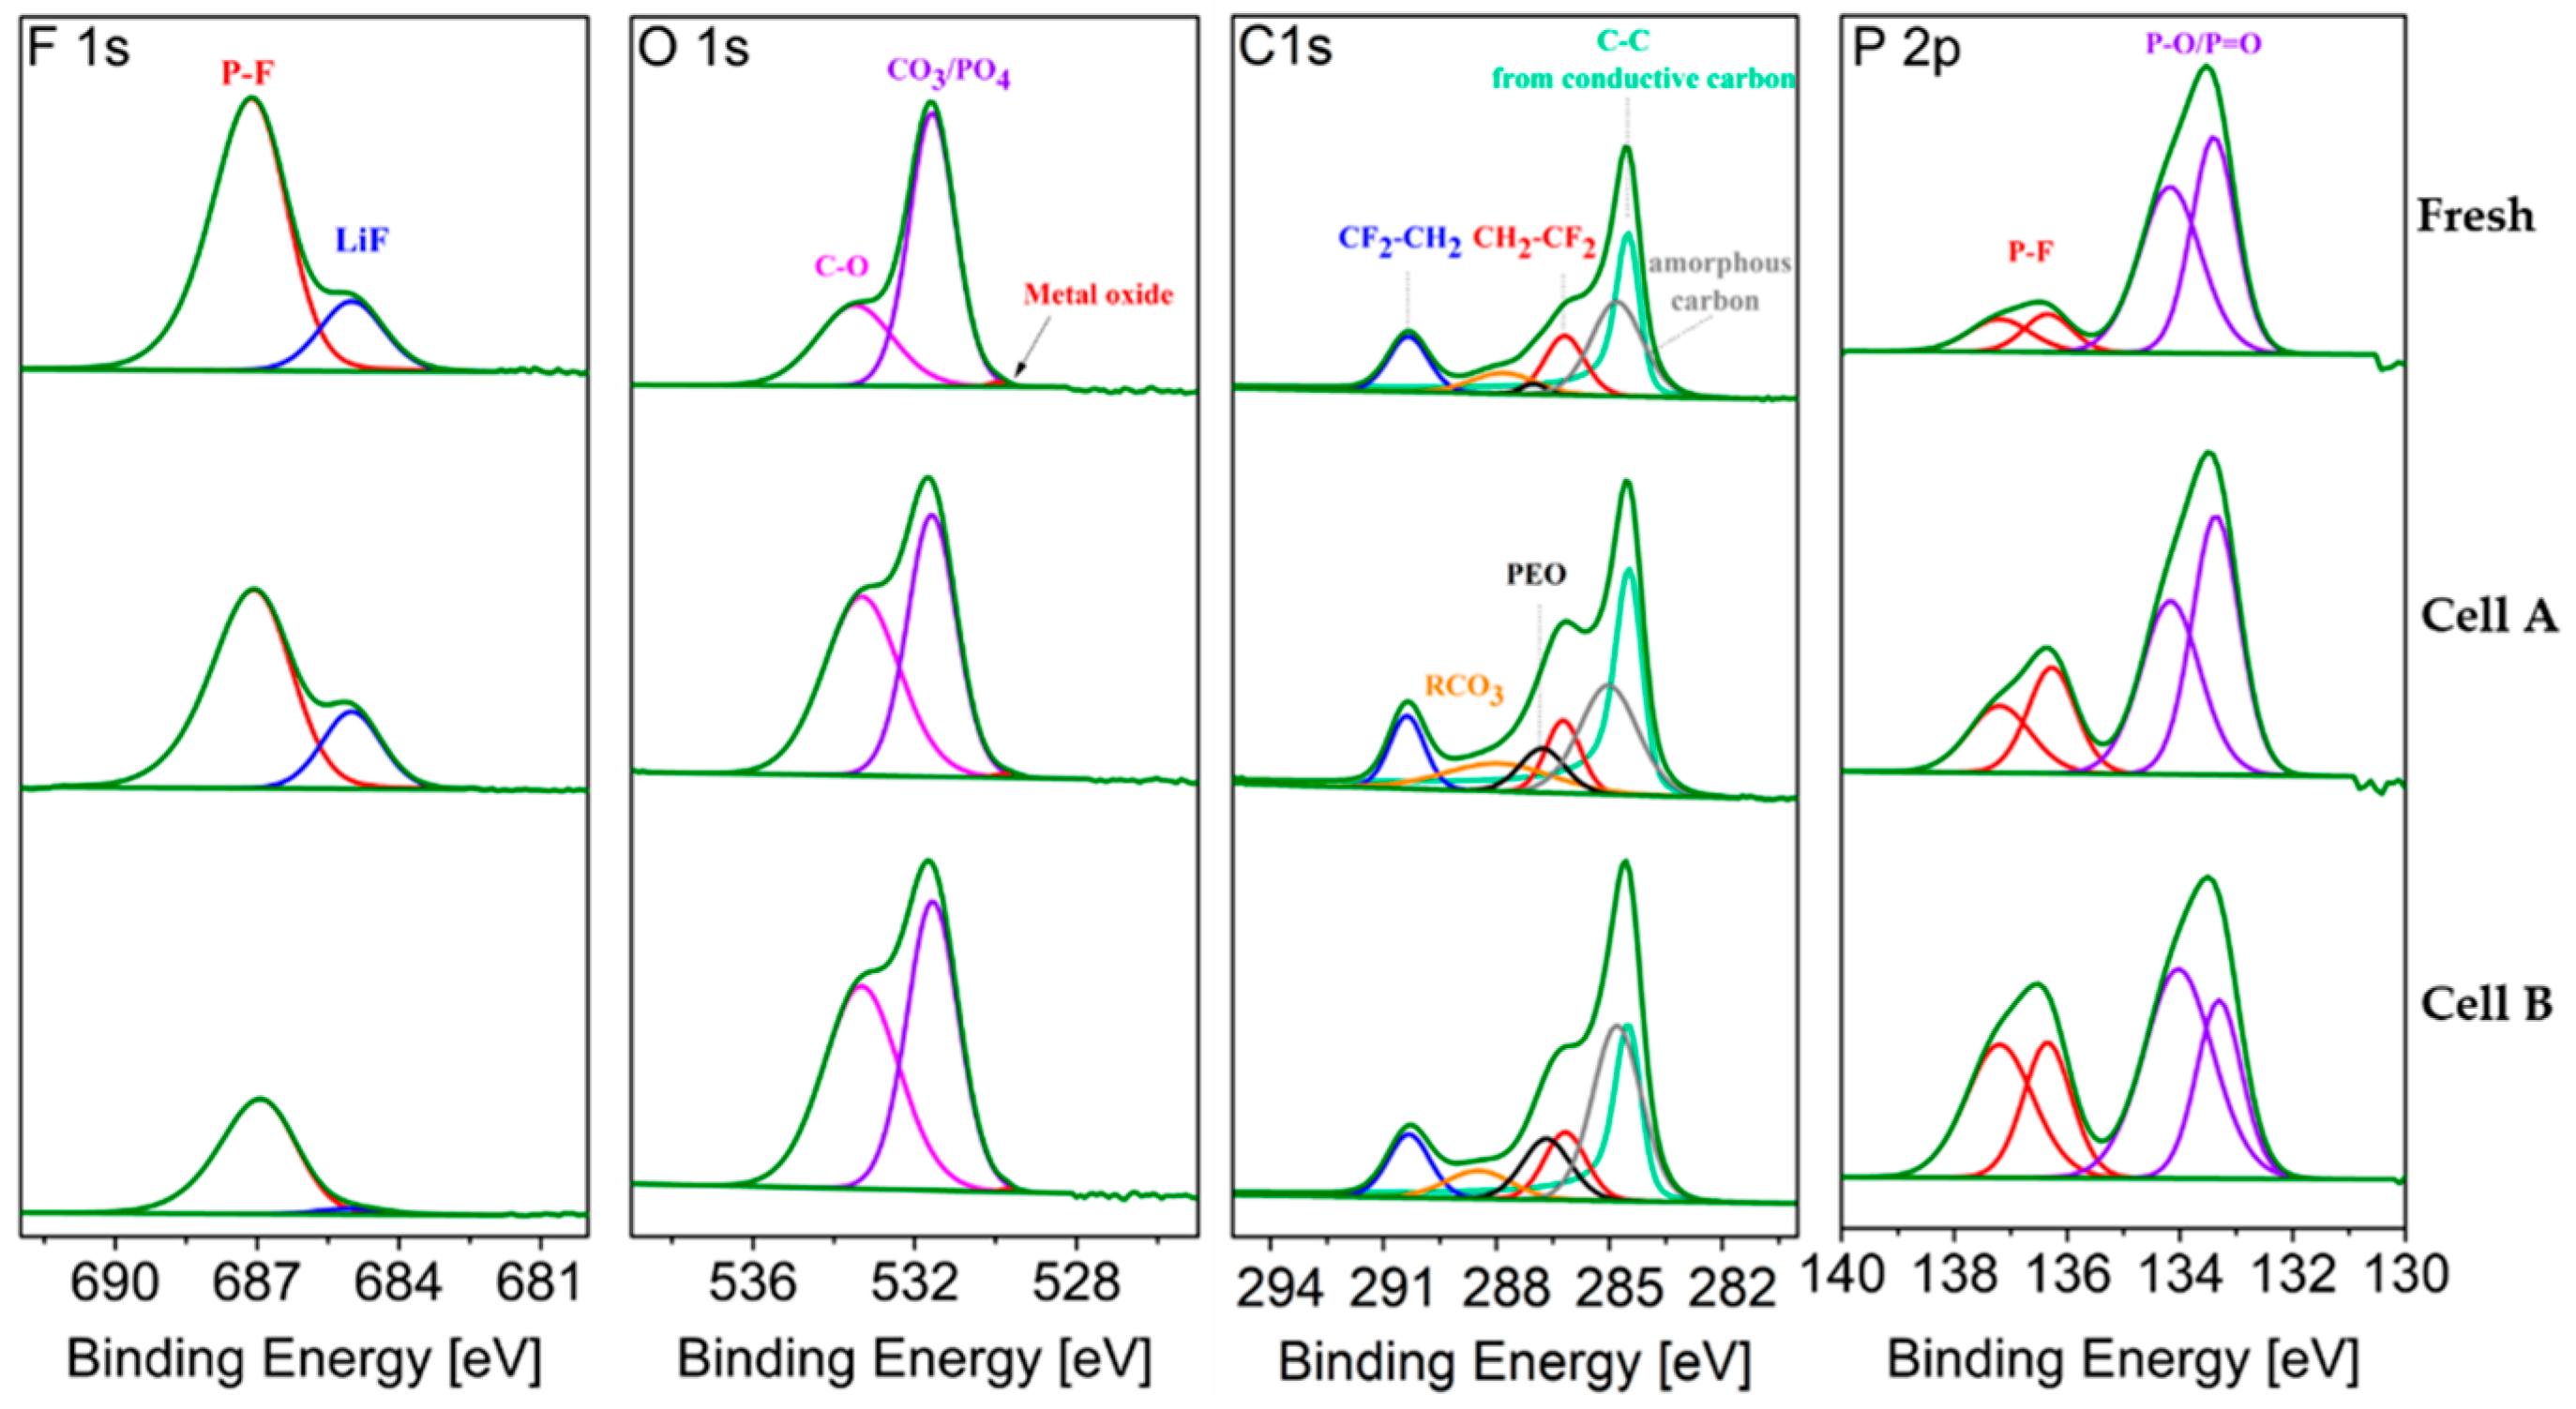
The XPS spectra and fitting results for the cathodes extracted from fresh and aged cells are compared in Figure 10. Table 7 reports the averaged atomic concentration for the different components. Due to the uncertainties caused by the overlap between the Fe 2p and Fe 3p core level spectra and the fluorine plasmon and, in the Li 1s core spectra, the overlap between Fe and Li contributions, the corresponding spectra were not used for cathode analysis. All samples investigated were taken at the center of electrode at the middle of the stack.
The F 1s spectra show traces of LiF at 685 eV on the fresh and aged LFP electrodes. As found for the anode, LiF represents a higher fraction of the cathode electrolyte interphase (CEI) layer in the cell cycled at 0.3C (Cell A) than at 2C (Cell B).
In the O 1s region, the amount of signal attributed to oxygen atoms in the phosphate group (PO4)3− of LFP decreases upon cycling (Figure 10). This peak is well pronounced for the fresh cathode, indicating the very thin nature of the CEI layer. The peak at higher binding energy (C–O) is attributed to the oxygenated species at the electrode surface and increases in aged cathodes. Upon ageing, the difference between these two peaks decreases, as a result of the growth of the CEI layer. For Cell B the (PO4)3− contribution remains dominant (see Table 7) while the fraction of oxygenated species in Cell A equals that calculated from the LFP feature.
In the C 1s spectrum, the peak at 284.5 eV corresponds to conductive carbon, which conceals the peak of amorphous carbon related to carbon coating [16]. The two other peaks toward higher energy at 286.3 eV and 290.4 eV are attributed to CF2CH2 and CH2CF2, corresponding to the PVdF binder [17]. Moreover, two small peaks are due to polyethylene glycol (PEO) and RCO3 [7]. PEO and RCO3 have been proved to be part of both the SEI and the CEI [18,19]. It can be seen that both contributions increase upon cycling in both cases.
In the P 2p region, the peak of PO4 (at 133.3–133.5 eV, labeled P–O/P = O) declines with ageing, which indicates for the CEI growth. The higher amount of phosphate feature in the cell cycled at 2 C is in good agreement with results from the O 1s region, indicating thinner CEI layer. The higher amount of P–F compound (LiPF6 decomposition products) is detected in the cell cycled at higher C-rate, the same result was obtained for graphite electrode.
Figure 11 compares the atomic percentages at the center and edge of the electrode tape from different positions of the stack (beginning and middle of the stack) of the aged cathodes. In both cells, a higher LiF amount is detected at the edge of each electrode tape, which means more LiPF6 degradation. Overall, the amount of LiF is higher at any positions in the cell cycled at 0.3C. However, higher amounts of LiF are found in the middle of the stack, while the opposite is observed for the cell cycled at 2C. Nonetheless, the total amount of fluoride species are found to be higher in the middle of the stack for both cells.
In O 1s and P 2p regions, the amount of oxygenated species (C–O and P–F) is lower at the edge of each stack, while the LFP feature stays more pronounced at all the edges. Thus, we can conclude that the formed CEI is thinner at the electrode edge in both cells. Moreover, the LFP feature (PO4 and P–O/P = O) in O 1s and P 2p region is more pronounced in the beginning of the stack, which implies that the CEI at the middle of the stack is thicker.
Generally, for both cycled cells greater differences were found in electrodes of different stacks. However, the trend of the features in the F 1s, O 1s and P 2p regions suggest that the dissimilarities caused by varying the C rates are as marked as the differences between different locations in the cells.

3. Conclusions

The post-mortem analysis conducted on 16 Ah graphite//LiFeO4 cells after formation and aged at 5 °C by cycling either at 0.3C (Cell A) or 2C (Cell B) revealed inhomogeneous ageing of the electrodes along the stack and from the center to the edge of the electrode tapes. Differences in the residual capacity values and LiFePO4/FePO4 phase distribution were detected. Although a clear trend could not be identified between C-rates, one of the possible reasons for the non-uniform ageing can be related to differences in the pressure experienced by the electrodes, which are higher in the middle of the stack and at the center of the electrode. Furthermore, the inhomogeneities are more marked for the cell cycled at low rate (Cell A) than for that cycled at 2C (Cell B). The cell cycled at 2C (Cell B) performed higher number of equivalent cycles compared to that cycled at 0.3C (Cell A). It is reasonable to assume that the higher current also results in more heat generated, therefore the temperature experienced by the cell could have been higher than the 5 °C of the environmental temperature, and has positively influenced the cell performance. From XPS analysis it appears that more electrolyte decomposition took place at the edge of the electrodes and at the outer part of the cell stack independently of the ageing conditions. Therefore, in these areas, more Li is consumed by SEI formation and side reactions, which contributed to the inhomogeneity in the cathode residual capacity values. In both aged cells the most evident signs of graphite electrode ageing are the increased thickness of the SEI and the increase of salt decomposition products (compared with fresh cells) and they are more pronounced in Cell A. Overall, the cathode is less affected by cycling and able to recover the initial capacity for both aged cells. On the other hand, the anode of the cell cycled at 2C (Cell B) displayed graphite exfoliation in the central parts of the electrode and the presence, in the same areas of Fe contamination.

4. Materials and Methods

The 16 Ah pouch cells were manufactured by CEA-LITEN. The stack contained 38 anodes 76 separators and 37 cathodes. The stacks with tabs as terminal were placed between two half shells based of aluminium and heat sealed before the electrolyte filling.
The ageing tests on the 16 Ah pouch cells were carried on in a custom-made climate chamber using a PEC battery tester with a maximum of 5 V and 50 A per channel.
Prior the opening, the cells have been discharged to Vmin (2.5 V) using a constant current (C/2) step followed by a constant voltage step (10 h or C/50). The cells were opened inside the glove box under Ar atmosphere (H2O < 1 ppm, O2 < 1 ppm) cutting the long side of the bag with ceramic scissor and scalpel avoiding to damage the stack or to induce a short circuit.
The adhesion strength of the coated electrodes on the current collector is measured via the 90° peel test carried out in ambient conditions at 20 mm/min crosshead speed on 20 × 90 mm (Width × Length) electrode strips cut from the ~6 × 9 cm samples to obtain a peeling strength value (N·m−1).
The morphological analysis of the cell components was conducted using a Scanning Electron Microscope (SEM) using an inert transfer chamber to protect the sample from the external atmosphere.
X-Ray Diffraction measurements were carried out directly on electrodes using a Bruker D8 Discover diffractometer equipped with a Cu Kα source (λ = 0.154 nm) where 2θ range was between 10 to 85°. Refinements of the cathode materials diffraction patterns were performed by the Rietveld Method using the FullProf program [20].
XPS measurements were conducted on an Axis UltraDLD (Kratos, U.K.) equipped with a monochromatic X-Ray source (Al Kα, filament current and voltage 15 mA and 15 kV respectively, with charge neutralizer to compensate for the charging of samples, and 20 eV pass energy for core spectra) The investigated sample area was ca. 700 µm × 300 µm. The XPS equipment is equipped with an antechamber, preventing atmospheric exposure when loading samples. Samples were not washed for XPS investigation. Sputter depth profiling (sputter times 60, 120 and 600 s) was done using an Argon ion gun (a coronene ion source with a filament voltage of 0.5 kV and an emission current of 8 mA, with a sputter crater diameter set to 1.1 mm and the incident angle between the sample surface and the ion gun beam at 45°. Measurements were done in the field of view 2 with a 110 μm aperture and a pass energy of 40 eV). The fitting of the spectra was done with the CasaXPS software (Version 2.3.16 PR 1.6, Casa Software Ltd., Teignmouth, UK). Core peaks were analyzed using a nonlinear Shirley-type background. The peak positions and areas were optimized by a weighted least-square fitting method using 70% Gaussian, 30% Lorentzian peak shapes. The intense C 1s peak at 284.5 eV was used as reference. For each XPS sample, at least 3 spots per sample were measured to test reproducibility.
The electrochemical tests were carried out using coin cells 2032 assembled in argon-filled glove box (H2O < 0.1 ppm, O2 < 0.1 ppm). Half-cells were assembled using the pristine electrodes (never assembled into a cell) and aged electrodes. The glass fibre separator (Whatman, GF/D) was soaked with the electrolyte 1 M LiPF6 in EC:PC:DMC (1:1:3 vol.) + 2 wt. % VC. One side of the coated electrode was removed to eliminate artefacts at low current density [21]. In the argon-filled glove box, the cathode layer, made with PVDF binder, was removed using a paper tissue wet with N-methyl-2-pyrrolidone (NMP) solvent while the anode layer was removed using a sand paper. The removal of the coating from one side of the electrode resulted in heavy damage of the anode. Afterwards, small discs (area = 1.13 cm2) were punched out of the electrode sheet and dried under vacuum in order to remove any residues of solvent and electrolyte. Galvanostatic cycling was carried out at a constant temperature of 20 ± 0.1 °C (Binder KB 400) using a battery tester (MACCOR 4300) following the test protocols described in Table S2 in Supplementary Materials. A C-rate of 1 C corresponds to 2.3 Ma cm−2.

Supplementary Materials

The following are available online at https://www.mdpi.com/2313-0105/5/2/45/s1, Figure S1. Results of 16 Ah soft prismatic cells cycled at different temperatures: 5 °C (blue), 25 °C (green) and 45 °C (red) at 1 C discharge rate and 0.3 C (circle), and 2 C (square) in charge. Table S1. Summary of measurements performed in different stack´s positions. Figure S2. SEM images of LFP electrode extracted from different parts of the stack of Cell A. Figure S3. SEM images of LFP samples. Figure S4. EDX spectra of aged cathodes. Figure S5. EDX analysis of the fresh graphite electrode. Figure S6. EDX spectra of negative electrode extracted from Cell B. Figure S7. SEM of separators from Fresh Cell, Cell A and Cell B. Figure S8. Voltage profile of the first cycle of a pristine cathode. Figure S9. Comparison of first de-lithiation of aged cathode in freshly re-assembled half-cells. Table S2. C-rate test protocol for half-cells with aged cathodes. Figure S10. Examples of Rietveld refinement of XRD patterns of aged cathodes. Figure S11. XRD patterns (focus on 00l peak at 26.8°) of pristine, fresh and aged anodes.

Author Contributions

Conceptualization, A.M., E.P., I.d.M., W.P., K.T. and N.E.; methodology, A.M., E.P., I.d.M., W.P. and K.T.; investigation, D.V.C., N.E., D.B.-B., J.-B.D., A.E.-B. and I.d.M.; writing—original draft preparation, A.M., N.E., E.P., I.d.M. and J.-B.D.; writing—review and editing, A.M., N.E., S.P., I.d.M., E.P., J.-B.D. and K.T.; supervision, A.M. and S.P.; funding acquisition, S.P., I.d.M. and E.P.

Funding

This research was funded by the European Union, under the grant agreement No. 653373 (SPICY—Silicon and polyanionic chemistries and architectures of Li-ion cell for high energy battery).

Conflicts of Interest

The authors declare no conflict of interest.

References

  1. Mulder, G. White Paper on Test Methods for Improved Battery Cell Understanding. Available online: https://www.batterystandards.info/literature (accessed on 15 February 2019).
  2. Kalhoff, J.; Eshetu, G.G.; Bresser, D.; Passerini, S. Safer Electrolytes for Lithium-Ion Batteries: State of the Art and Perspectives. ChemSusChem 2015, 8, 2154–2175. [Google Scholar] [CrossRef] [PubMed]
  3. Xu, K. Nonaqueous Liquid Electrolytes for Lithium-Based Rechargeable Batteries. Chem. Rev. 2004, 104, 4303–4418. [Google Scholar] [CrossRef] [PubMed]
  4. An, S.J.; Li, J.; Daniel, C.; Mohanty, D.; Nagpure, S.; Wood, D.L. The state of understanding of the lithium-ion-battery graphite solid electrolyte interphase (SEI) and its relationship to formation cycling. Carbon 2016, 105, 52–76. [Google Scholar] [CrossRef] [Green Version]
  5. Waldmann, T.; Hogg, B.-I.; Wohlfahrt-Mehrens, M. Li plating as unwanted side reaction in commercial Li-ion cells—A review. J. Power Sources 2018, 384, 107–124. [Google Scholar] [CrossRef]
  6. Petzl, M.; Kasper, M.; Danzer, M.A. Lithium plating in a commercial lithium-ion battery—A low-temperature ageing study. J. Power Sources 2015, 275, 799–807. [Google Scholar] [CrossRef]
  7. Koltypin, M.; Aurbach, D.; Nazar, L.; Ellis, B. On the Stability of LiFePO4 Olivine Cathodes under Various Conditions (Electrolyte Solutions, Temperatures). Electrochem. Solid-State Lett. 2007, 10, A40–A44. [Google Scholar] [CrossRef]
  8. Evertz, M.; Horsthemke, F.; Kasnatscheew, J.; Börner, M.; Winter, M.; Nowak, S. Unraveling transition metal dissolution of Li1.04Ni1/3Co1/3Mn1/3O2 (NCM 111) in lithium ion full cells by using the total reflection X-ray fluorescence technique. J. Power Sources 2016, 329, 364–371. [Google Scholar] [CrossRef]
  9. Qi, Y.; Harris, S.J. In Situ Observation of Strains during Lithiation of a Graphite Electrode. J. Electrochem. Soc. 2010, 157, A741–A747. [Google Scholar] [CrossRef]
  10. Williard, N.; Sood, B.; Osterman, M.; Pecht, M. Disassembly methodology for conducting failure analysis on lithium–ion batteries. J. Mater. Sci. Mater. Electron. 2011, 22, 1616–1630. [Google Scholar] [CrossRef]
  11. Waldmann, T.; Iturrondobeitia, A.; Kasper, M.; Ghanbari, N.; Aguesse, F.; Bekaert, E.; Daniel, L.; Genies, S.; Gordon, I.J.; Löble, M.W.; et al. Review—Post-Mortem Analysis of Aged Lithium-Ion Batteries: Disassembly Methodology and Physico-Chemical Analysis Techniques. J. Electrochem. Soc. 2016, 163, A2149–A2164. [Google Scholar] [CrossRef] [Green Version]
  12. Wang, S.; Wang, C.; Ji, X. Towards understanding the salt-intercalation exfoliation of graphite into graphene. RSC Adv. 2017, 7, 52252–52260. [Google Scholar] [CrossRef] [Green Version]
  13. Ciosek Högström, K.; Hahlin, M.; Malmgren, S.; Gorgoi, M.; Rensmo, H.; Edström, K. Ageing of electrode/electrolyte interfaces in LiFePO4/graphite cells cycled with and without PMS additive. J. Phys. Chem. C 2014, 118, 12649–12660. [Google Scholar] [CrossRef]
  14. Ciosek Högström, K.; Malmgren, S.; Hahlin, M.; Rensmo, H.; Thébault, F.; Johansson, P.; Edström, K. The Influence of PMS-Additive on the Electrode/Electrolyte Interfaces in LiFePO4/Graphite Li-Ion Batteries. J. Phys. Chem. C 2013, 117, 23476–23486. [Google Scholar] [CrossRef]
  15. Andersson, A.M.; Henningson, A.; Siegbahn, H.; Jansson, U.; Edström, K. Electrochemically lithiated graphite characterised by photoelectron spectroscopy. J. Power Sources 2003, 119–121, 522–527. [Google Scholar] [CrossRef]
  16. Dedryvère, R.; Maccario, M.; Croguennec, L.; Le Cras, F.; Delmas, C.; Gonbeau, D. X-Ray Photoelectron Spectroscopy Investigations of Carbon-Coated LixFePO4 Materials. Chem. Mater. 2008, 20, 7164–7170. [Google Scholar] [CrossRef]
  17. Castro, L.; Dedryvère, R.; El Khalifi, M.; Lippens, P.E.; Bréger, J.; Tessier, C.; Gonbeau, D. The spin-polarized electronic structure of LiFePO4 and FePO4 evidenced by in-lab XPS. J. Phys. Chem. C 2010, 114, 17995–18000. [Google Scholar] [CrossRef]
  18. Qian, Y.; Niehoff, P.; Börner, M.; Grützke, M.; Mönnighoff, X.; Behrends, P.; Nowak, S.; Winter, M.; Schappacher, F.M. Influence of electrolyte additives on the cathode electrolyte interphase (CEI) formation on LiNi1/3Mn1/3Co1/3O2 in half cells with Li metal counter electrode. J. Power Sources 2016, 329, 31–40. [Google Scholar] [CrossRef]
  19. Zhuang, G.; Chen, Y.; Ross, P.N. The Reaction of Lithium with Dimethyl Carbonate and Diethyl Carbonate in Ultrahigh Vacuum Studied by X-ray Photoemission Spectroscopy. Langmuir 1999, 15, 1470–1479. [Google Scholar] [CrossRef]
  20. Rodriguez-Carvajal, J. Recent advances in magnetic structure determination by neutron powder diffraction. Fullprof Program. Physica B 1993, 192, 55–69. [Google Scholar] [CrossRef]
  21. Zhou, G.; Wang, Q.; Wang, S.; Ling, S.; Zheng, J.; Yu, X.; Li, H. A facile electrode preparation method for accurate electrochemical measurements of double-side-coated electrode from commercial Li-ion batteries. J. Power Sources 2018, 384, 172–177. [Google Scholar] [CrossRef]
Figure 1. (a) Closed pouch cell; (b) view of the opened cell; (c) scheme of the stack defining the sampling portions; (d) simplified view of double coated electrode indicating the two areas sampled; and (e) definition of “edge” and “center” positions within a single electrode.
Batteries 05 00045 g001
Figure 2. Visual inspection of cells components (separator, cathode and anode from the middle (M) of the stack).
Batteries 05 00045 g002
Figure 3. SEM images comparing the morphology of the LFP electrodes taken from (a) the fresh cell (after formation), (b) Cell A and (c) Cell B. All the samples were harvested from the beginning of the stack.
Batteries 05 00045 g003
Figure 4. SEM images comparing the graphite electrodes of the (a) Fresh Cell (i.e., after formation), (b) Cell A and (c) Cell B (cycled at 0.3C and 2C, respectively). All the samples were taken from the electrode at the beginning of the cell stack.
Batteries 05 00045 g004
Figure 5. SEM images of the graphite anode of Cell B sampled at the (a) center and (b) edge of the tape. Both samples were taken from the middle (M) of the stack.
Batteries 05 00045 g005
Figure 6. First cycle voltage profile of the aged cathodes in half-cells. (ad) samples from cell A. (eh) samples from cell B. Electrode area ≈ 1.13 cm2; C-rate 0.065C.
Batteries 05 00045 g006
Figure 7. Rate capability test of cathodes harvested from aged cell A (ad) and cell B (eh) (1C = 2.3 mA·cm−2). The detailed test protocol is reported in Table S2 in the Supplementary Materials.
Batteries 05 00045 g007
Figure 8. F 1s, O 1s, C 1s and P 2p core peaks XPS spectra of graphite electrode from fresh and aged cells (MC samples). Non-sputtered samples.
Batteries 05 00045 g008
Figure 9. Atomic concentration at the center and edge of the electrode sheet in different position of the stack of (a) Cell A and (b) Cell B.
Batteries 05 00045 g009
Figure 10. F 1s, O 1s, C 1s and P 2p core peaks XPS spectra of LiFePO4 electrode from fresh and aged cells (MC samples). Non-sputtered samples.
Batteries 05 00045 g010
Figure 11. Atomic concentrations of cathode electrolyte interphase (CEI) components at the center and edge of the electrode tape in different position of the stack of (a) Cell A and (b) Cell B.
Batteries 05 00045 g011
Table 1. Cells specifications.
ParameterDescription
Cathode active material Cathode composition (37 sheets) Cathode areal capacityLiFePO4 (LFP) LFP/C/PVDF = 90.5/5/4.5 2.3 mAh/cm2/face
Anode active material Anode composition (38 sheets) Anode areal capacityGraphite (Gr) Gr/C/CMC/SBR = 96/0/2/2 2.5 mAh/cm2/face
Electrolyte composition1 M LiPF6 in EC:PC:DMC (1:1:3 vol.) + 2 wt. % VC
Separator (76 sheets)Celgard® PE/PP 2325 (Celgard, LLC)
FormatSoft prismatic (pouch-cell)
Weight 394 g
Average capacity at RT @C @C/1014.7 Ah 16.2 Ah
Specific energy at RT @C115 Wh/kg
@C/10134 Wh/kg
Table 2. State of health (SOH), total capacity throughput, equivalent cycle number, time required for ageing and voltage of the cells before disassembly.
Ageing ParametersFresh CellCell ACell B
Ageing conditions/5 °C; 0.3C5 °C; 2C
SOH (%)1007279.7
Total capacity throughput (Ah)/16,98220,753
Ageing time (Days)/11886
Equivalent cycle number/533660
Voltage (V)2.4623.022.63
Table 3. Thickness and adhesion strength of pristine and aged electrode tapes. Results are provided as average of at least two tests per electrode sample with the standard deviation in brackets.
CellElectrode (Position within the Stack B = Beginning, M = Middle, E = End)Thickness (µm)Peel Force (N/m)
PristineAnode117 (3)5.4 (2)
Cathode183 (5)504 (17)
Fresh CellAnode127 (2)2.2 (0.4)
Cathode188 (2)372 (56)
Cell A 5 °C–0.3CAnode 3 (B)147 (2)5 (1)
Anode 16 (M)157 (2)3.3 (9)
Anode 34 (E)150 (7)3.2 (8)
Cathode 3 (B)195 (3)336 (85)
Cathode 16 (M)202 (5)358 (41)
Cathode 34 (E)192 (4)534 (73)
Cell B 5 °C–2CAnode 3 (B)155 (6)4.7 (2)
Anode 16 (M)154 (7)8 (2)
Anode 34 (E)146 (1)3.5 (3)
Cathode 2 (B)199 (1)579 (53)
Cathode 16 (M)198 (1)#
Cathode 34 (E)197 (2)342 (8)
# above equipment measurement range (>550 N/m).
Table 4. Description of sample positioning in the stack and within the electrode, sample coding and residual capacity.
CellPosition in the Stack-Electrode NumberPosition in the ElectrodeCodeResidual Capacity 1 (%)
A 5 °C-0.3CBeginning (B)-2EdgeA_BE70.7
CentreA_BC62.8
Middle (M)-15EdgeA_ME65.6
CentreA_MC88.9
B 5 °C-2CBeginning (B)-2EdgeB_BE79
CentreB_BC68.4
Middle (M)-15EdgeB_ME66.4
CentreB_MC68.4
1 The residual capacity is calculated from the first charge of the reassembled half-cells as a percentage of the capacity of the pristine electrode (2.53 mAh) in Figure S7.
Table 5. Phase quantification obtained by XRD of fresh and aged electrode. For comparison also the value obtained for a fresh cathode (after cell formation) is reported.
Sample NameElectrode NumberLiFePO4 (%)FePO4 (%)
Freshn/a919
A_BC37030
A_BE38020
A_MC167525
A_ME168515
A_EC347426
A_EE348218
B_BC37525
B_MC167426
B_EC34973
Table 6. Average atomic percentages (% at.) determined from three measurement spots on fresh and aged graphite electrodes.
RegionComponentsFresh Cell MCCell A MCCell B MC
Sputtering Time (s)
060120600060120600060120600
Average Atomic Percentages (% at.)
F 1sLiPFx5.623.124.583.679.6012.307.177.498.586.396.194.78
LiF6.179.817.322.888.999.8113.844.653.663.984.374.36
O 1sRCO34.785.454.642.607.346.685.273.255.104.294.074.06
Li2CO37.244.474.031.857.447.128.244.988.689.0110.219.78
Li2O0.090.110.160.040.190.290.841.461.321.311.491.63
C 1sC1s56.6956.1660.1574.5046.5941.3734.0045.3138.2638.7844.9944.66
CMC-COC6.053.024.424.104.183.943.661.924.162.992.742.93
CMC-COOH3.022.832.852.302.692.662.841.352.912.402.441.90
Li-C0.000.000.000.001.573.0010.3519.292.962.152.622.02
PEO0.334.591.922.461.181.280.872.832.662.822.001.70
P 2pLiPFx0.900.360.280.210.640.420.310.141.411.191.090.79
LiPOxFy0.310.410.390.210.360.490.410.210.430.450.540.46
Table 7. Average atomic percentages (% at.) determined from three measurement spots on fresh and aged cathodes.
RegionComponentsFreshMCCell ACell B
MCMC
F 1sP-F12.81013.43315.393
LiF2.7513.7040.866
O 1sC-O4.1716.5126.761
CO3/PO49.1016.5087.043
Metal Oxide0.0530.0430.043
C 1sConductive carbon15.36518.82716.033
CH2-CF24.7833.8124.575
CF2-CH24.4633.8094.268
RCO32.7204.8852.964
PEO0.4511.8234.401
amorphous carbon9.6578.81414.020
P 2pP-F0.6430.7871.131
P-O/P = O1.1350.7620.792

