Combining a Fatigue Model and an Incremental Capacity Analysis on a Commercial NMC/Graphite Cell under Constant Current Cycling with and without Calendar Aging

 , ,
, ,  , and
, and
Abstract
:1. Introduction
- fundamental models or physical models;
- phenomenological models or empirical models; and
- mathematical models.
1.1. Fundamental Models
1.2. Phenomenological Models
1.3. Mathematical Models
2. Materials and Methods
3. Results
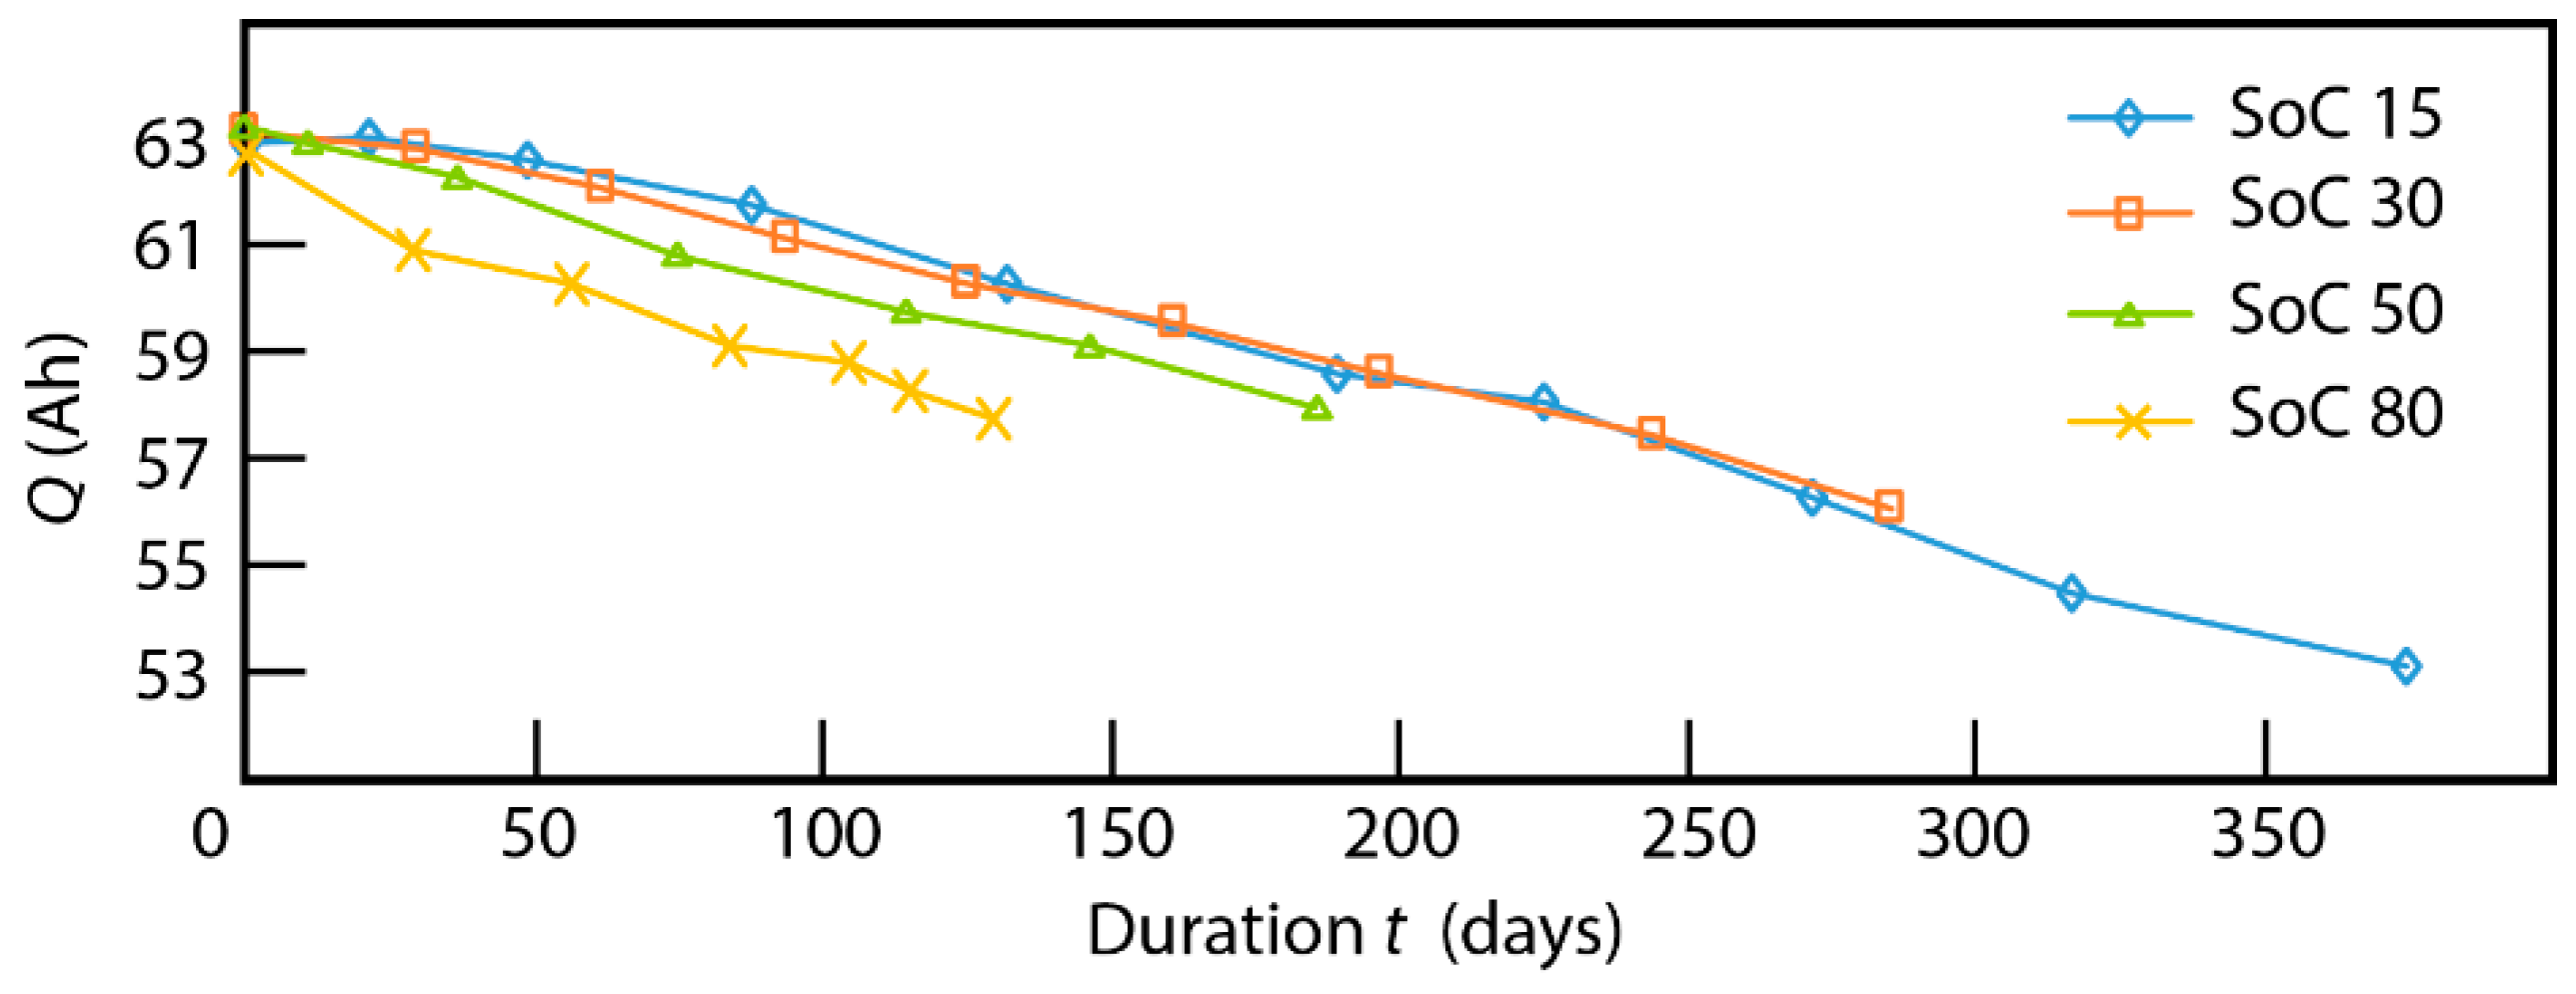
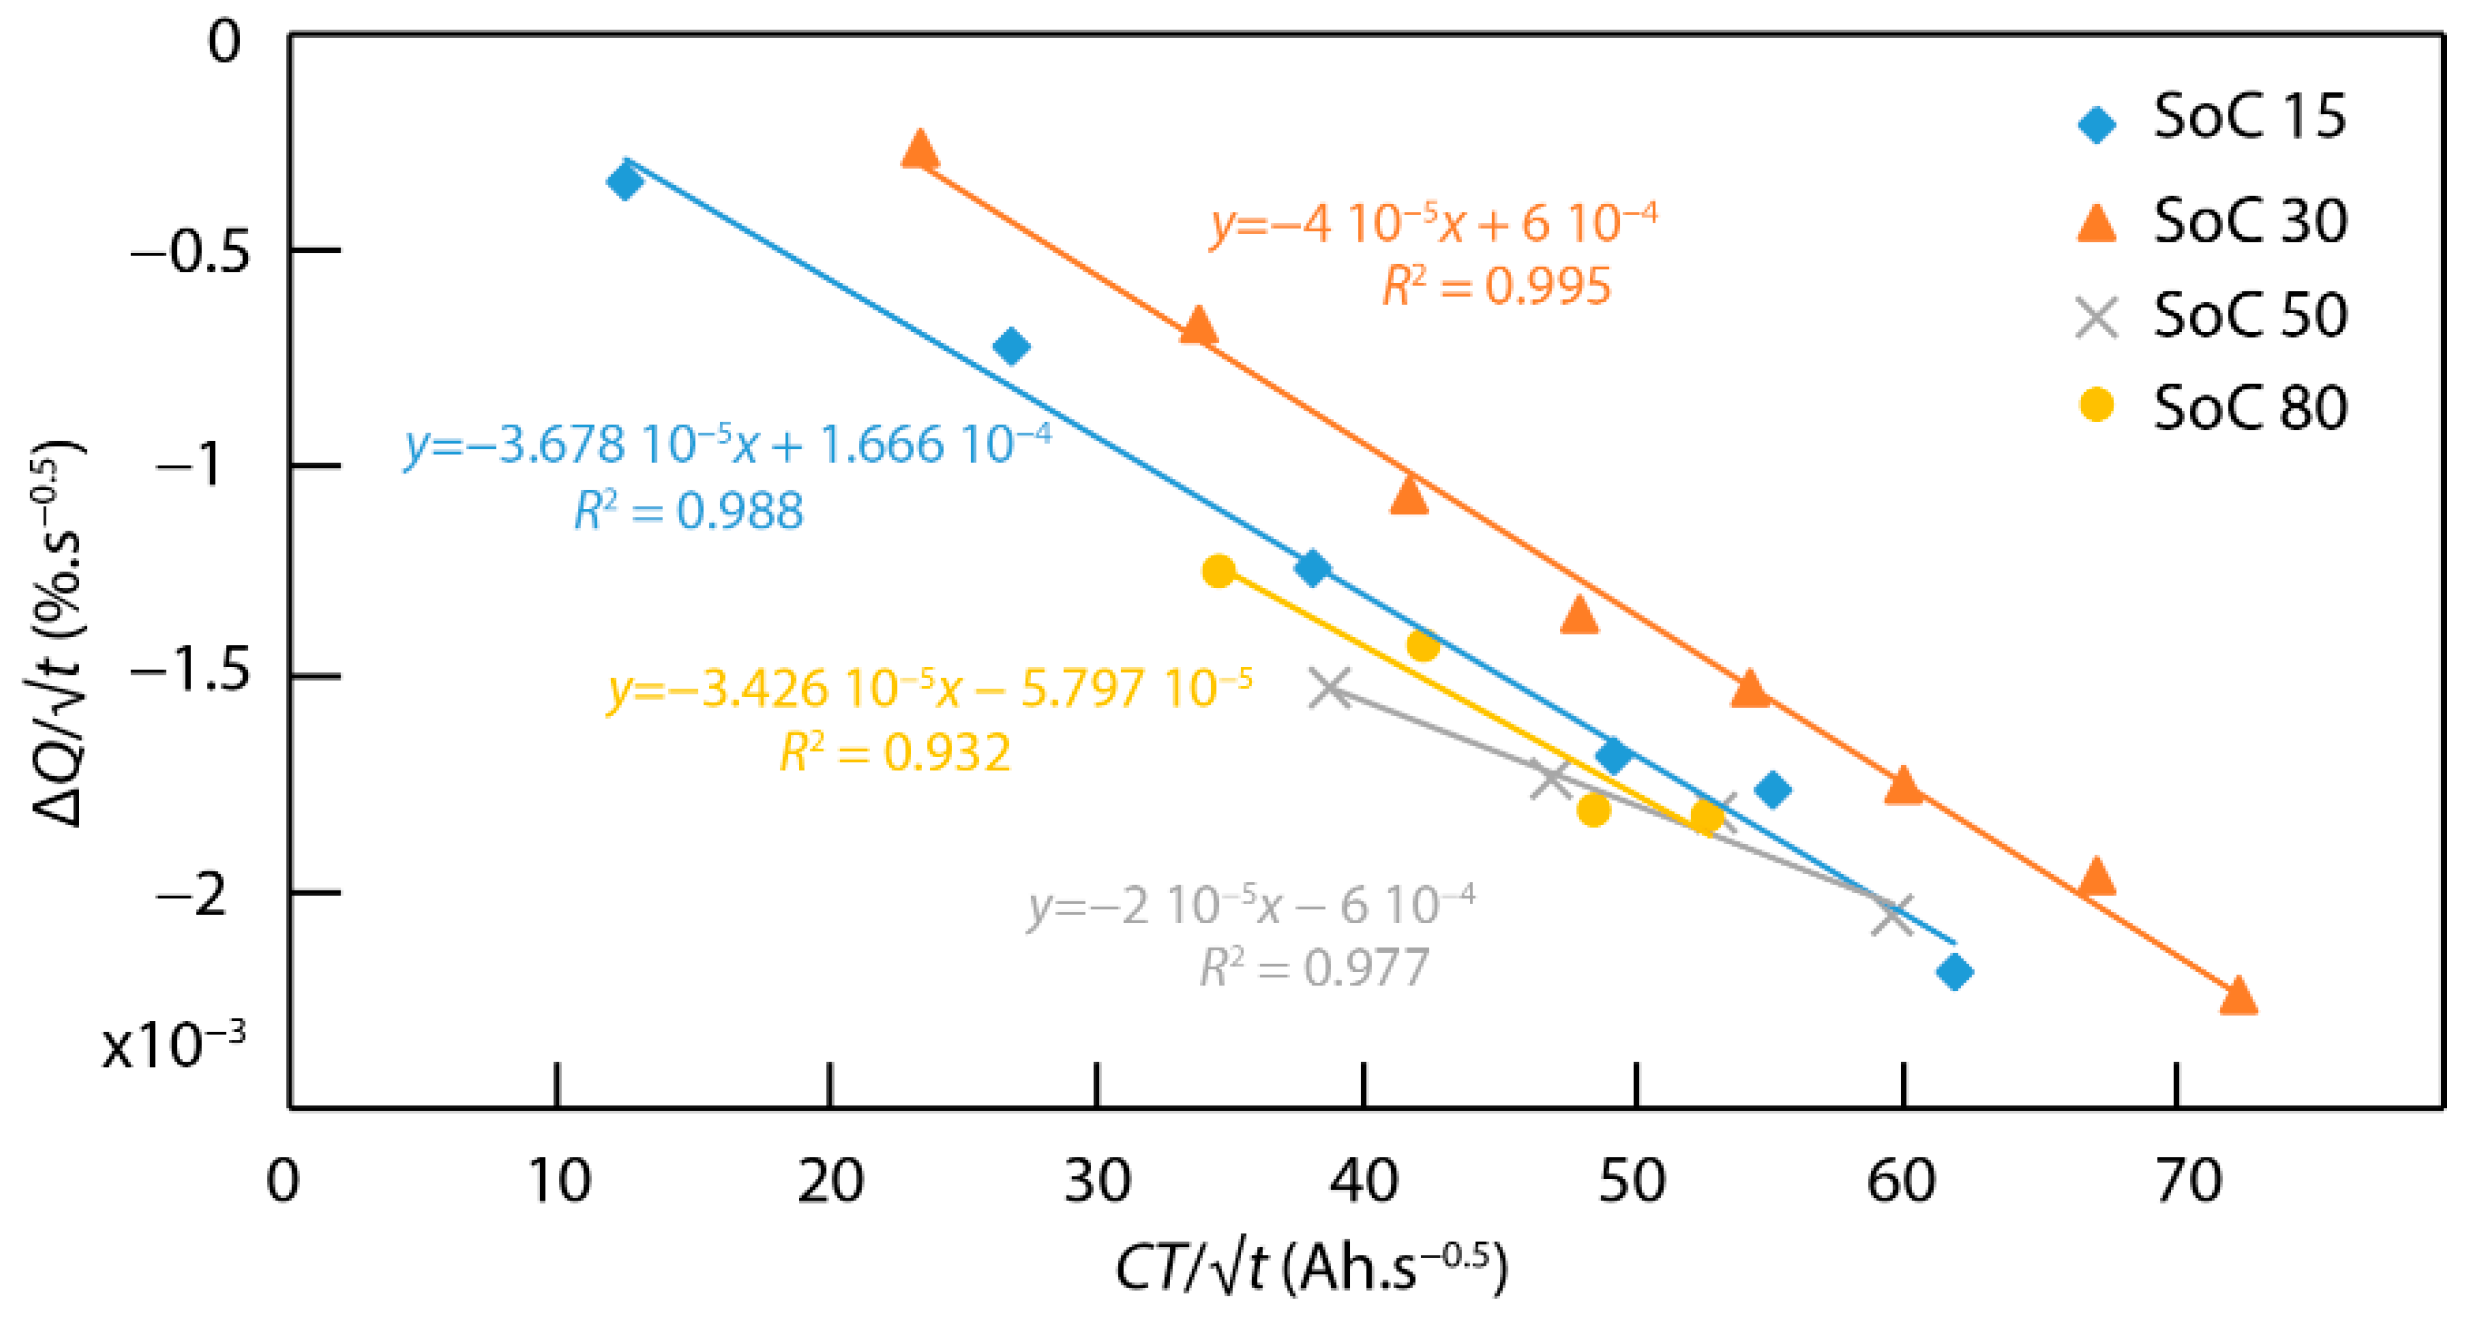
3.1. Cycling Aging
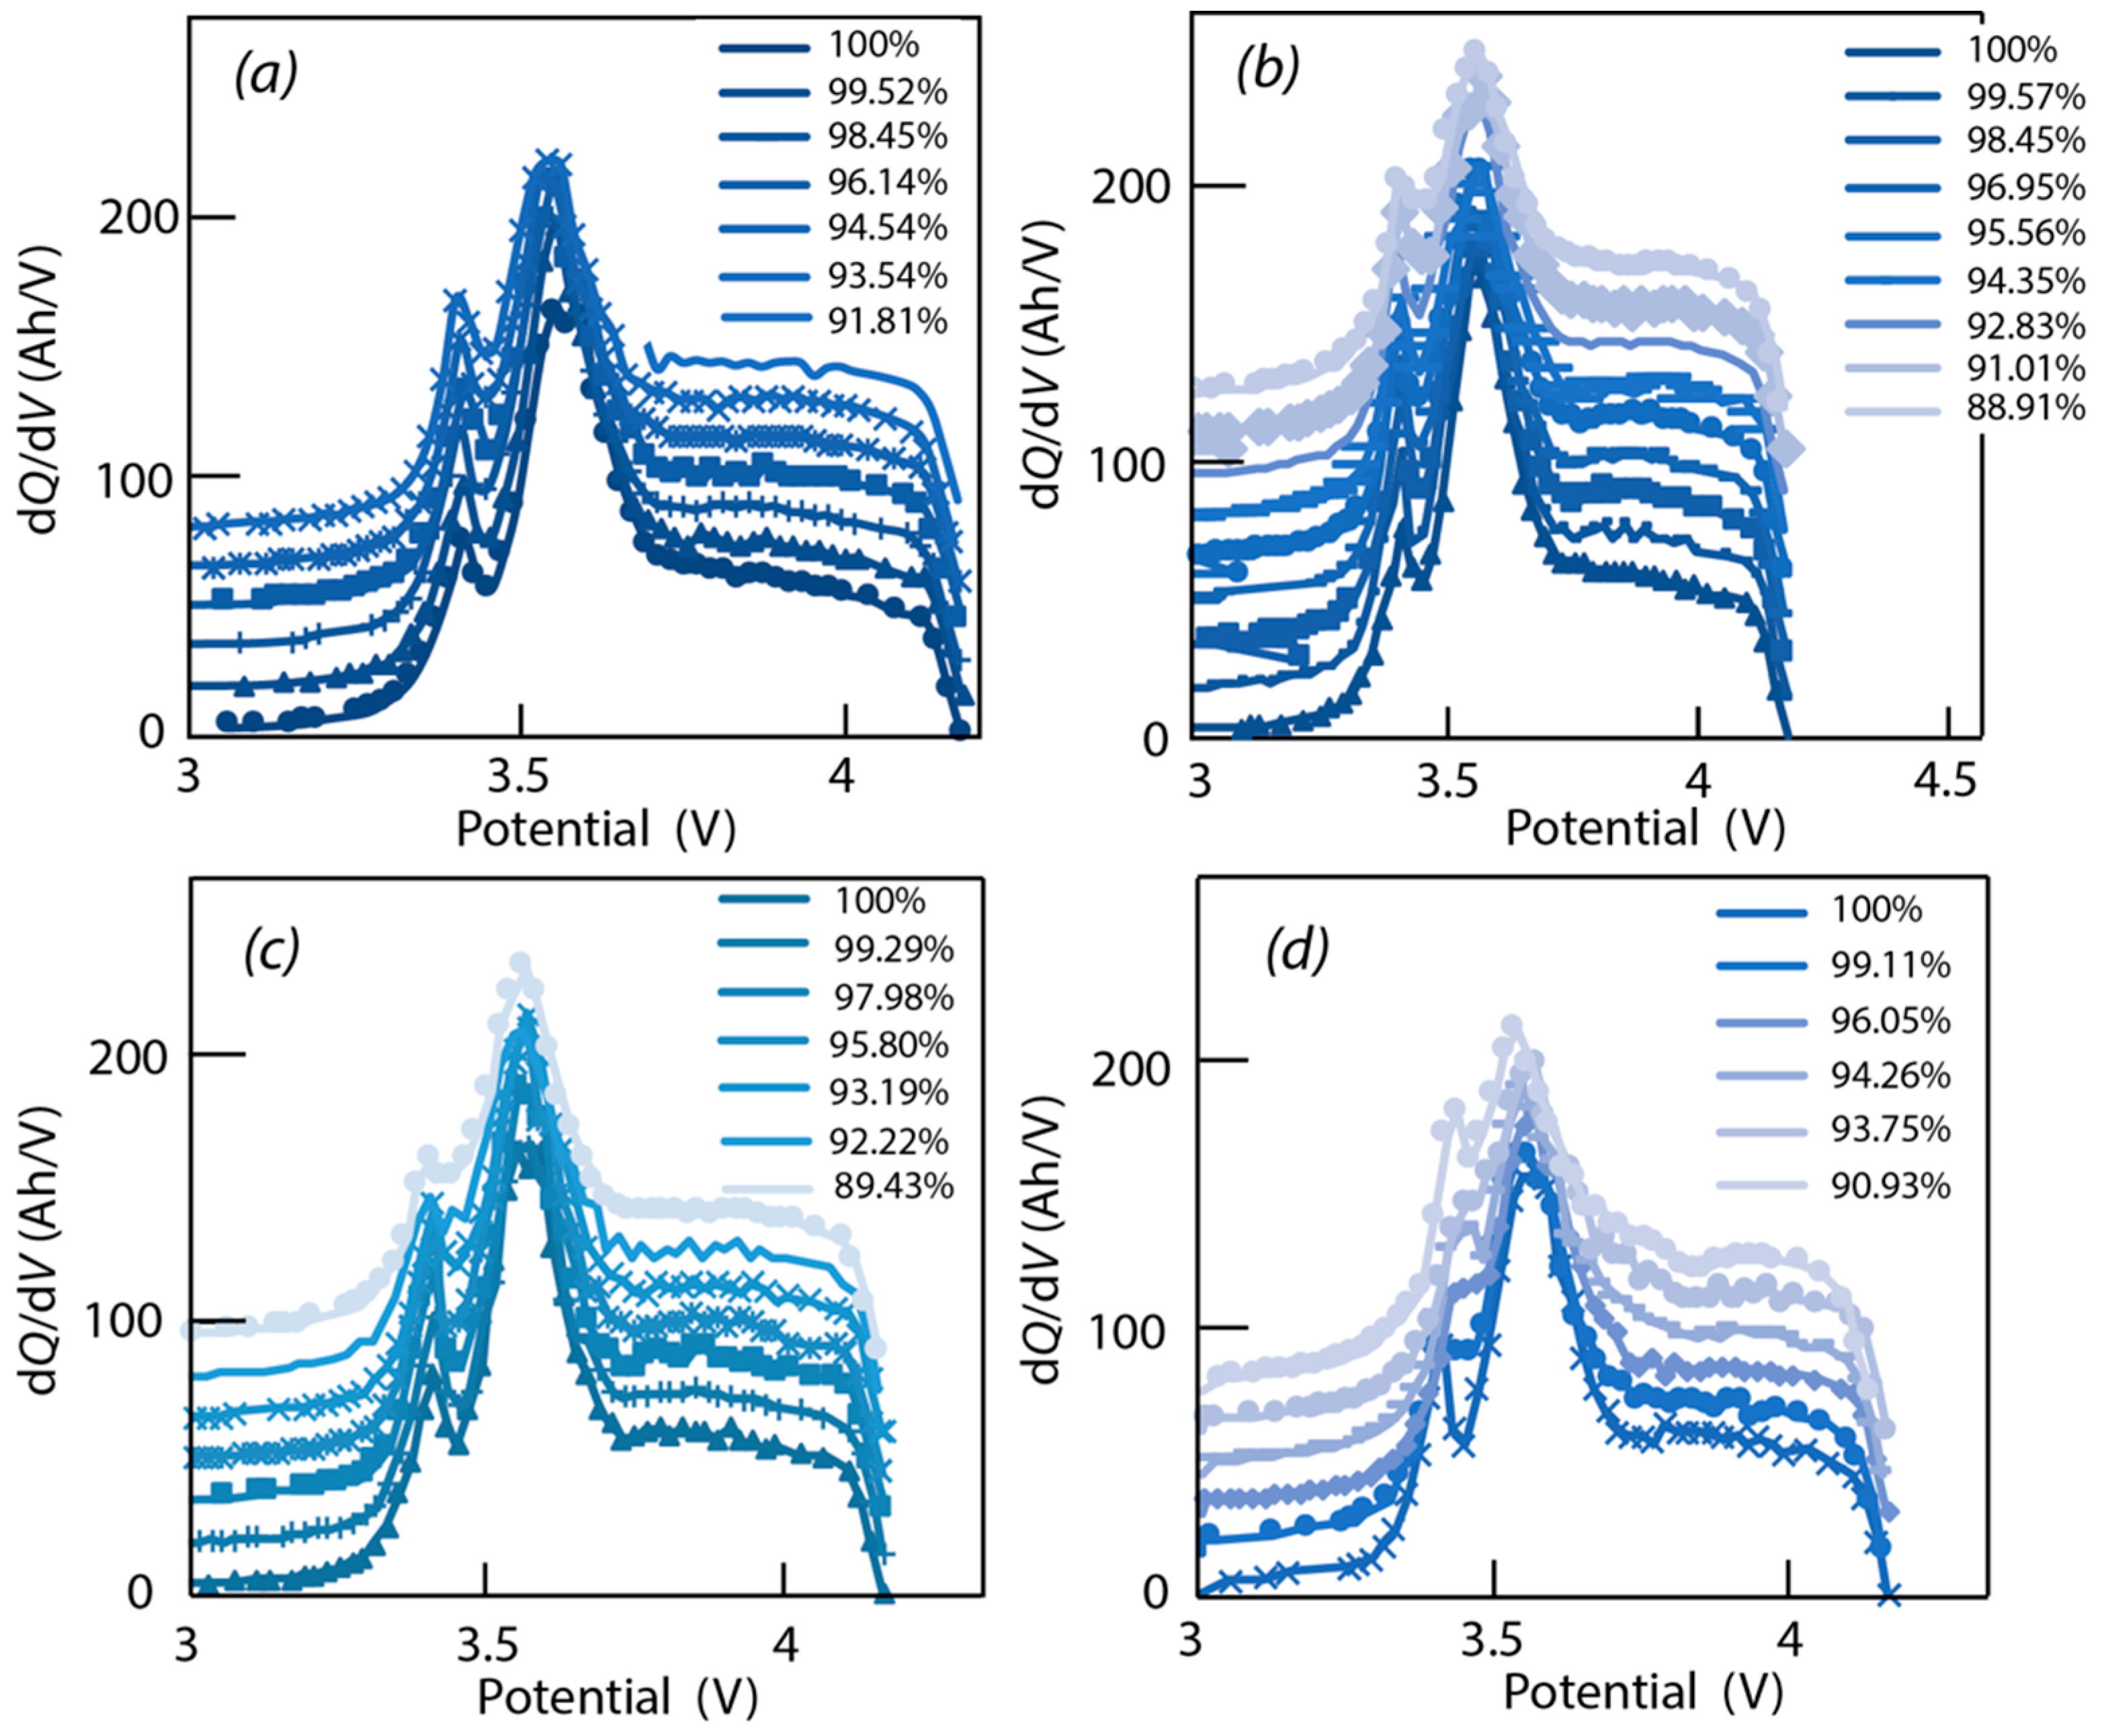
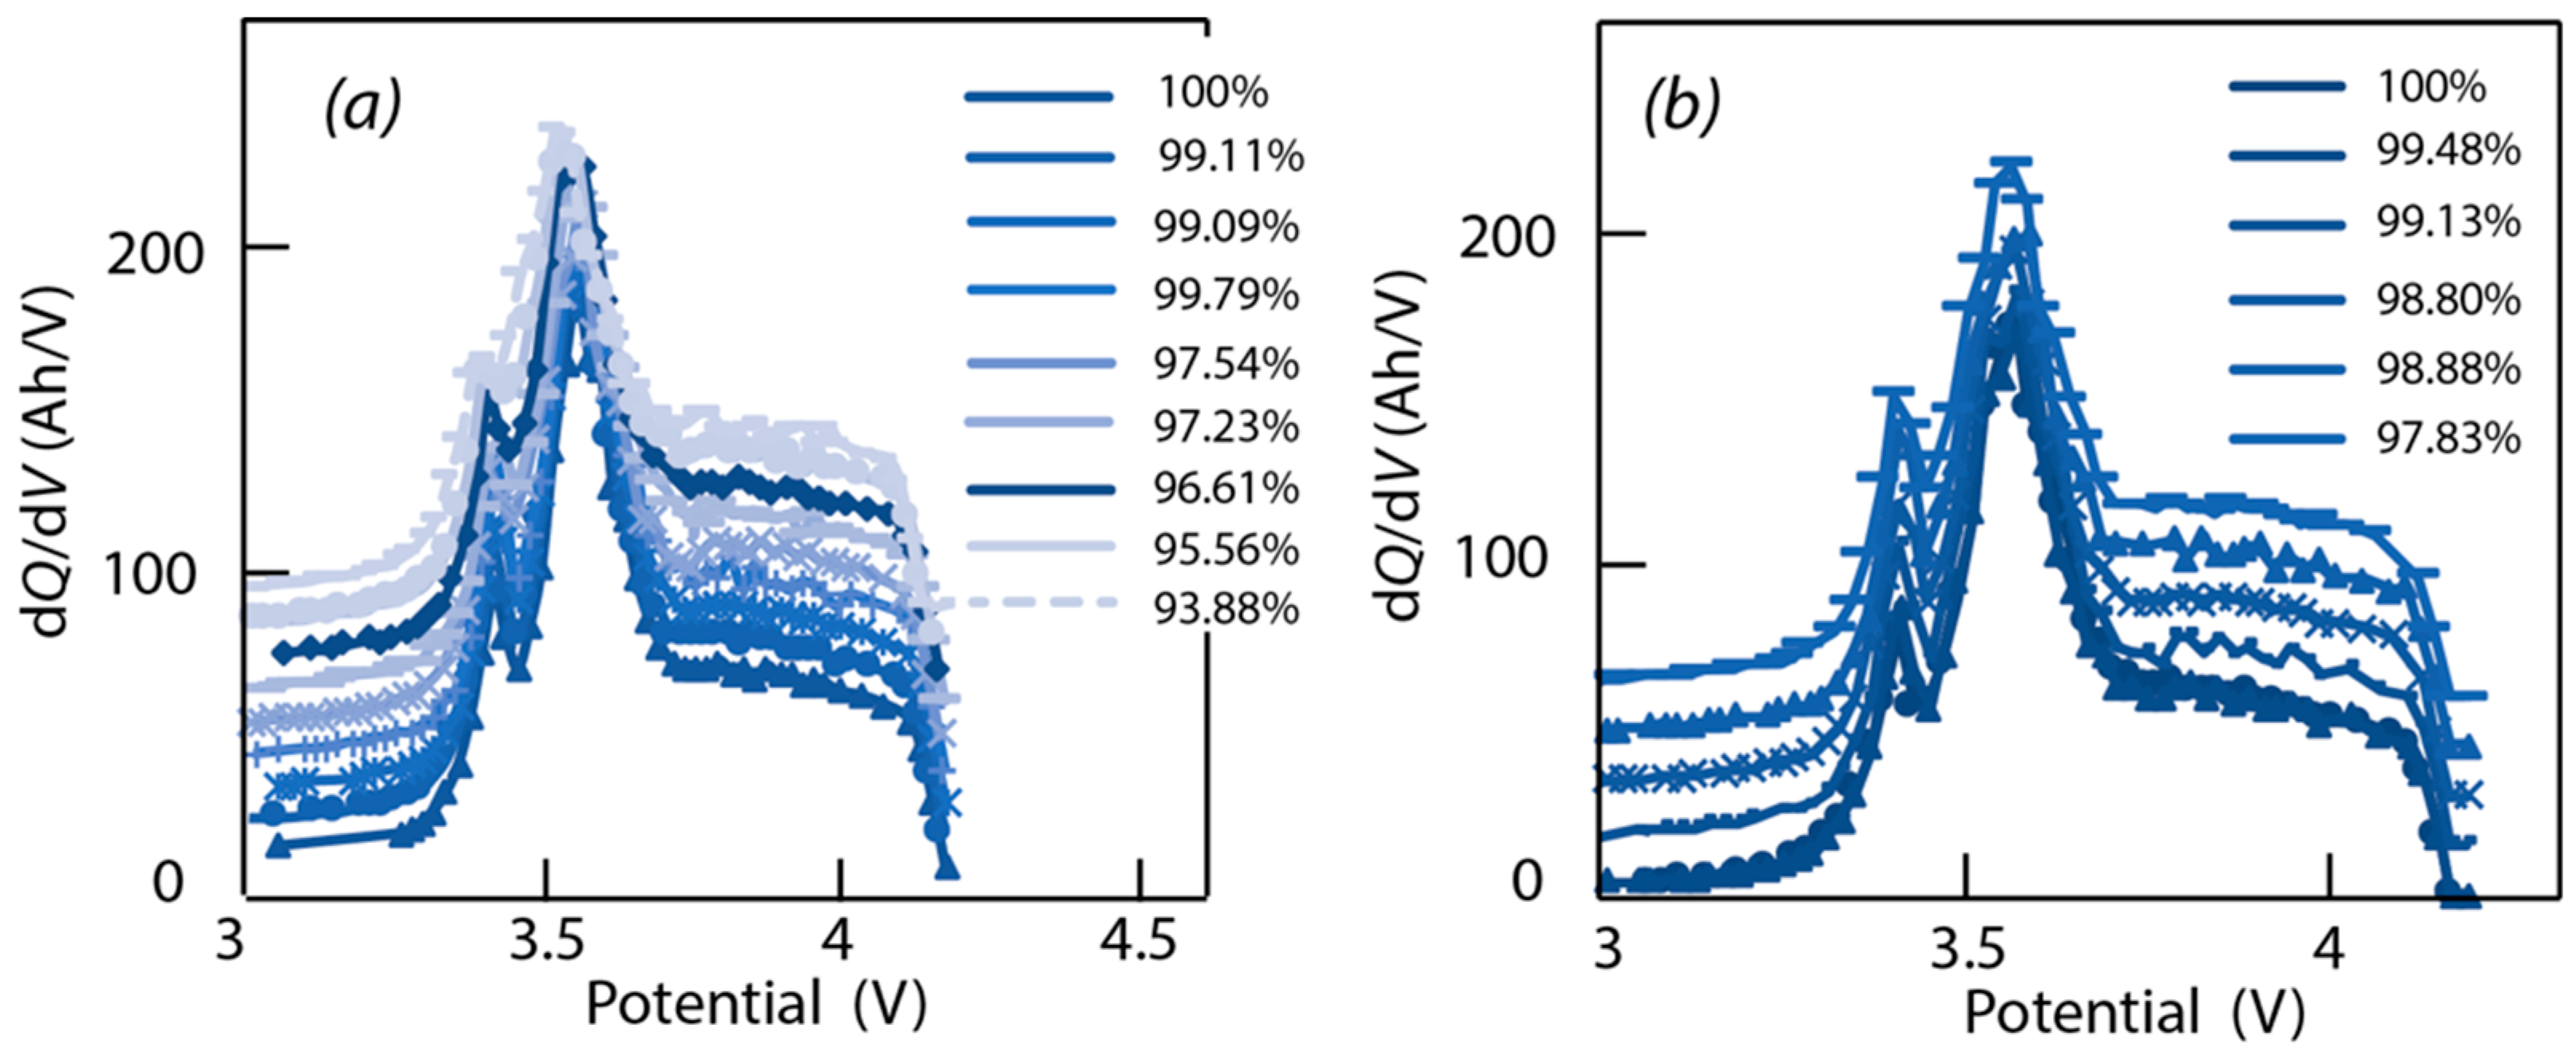
3.2. Incremental Capacity Analysis
4. Discussion
4.1. Background on Aging Mechanisms
- -
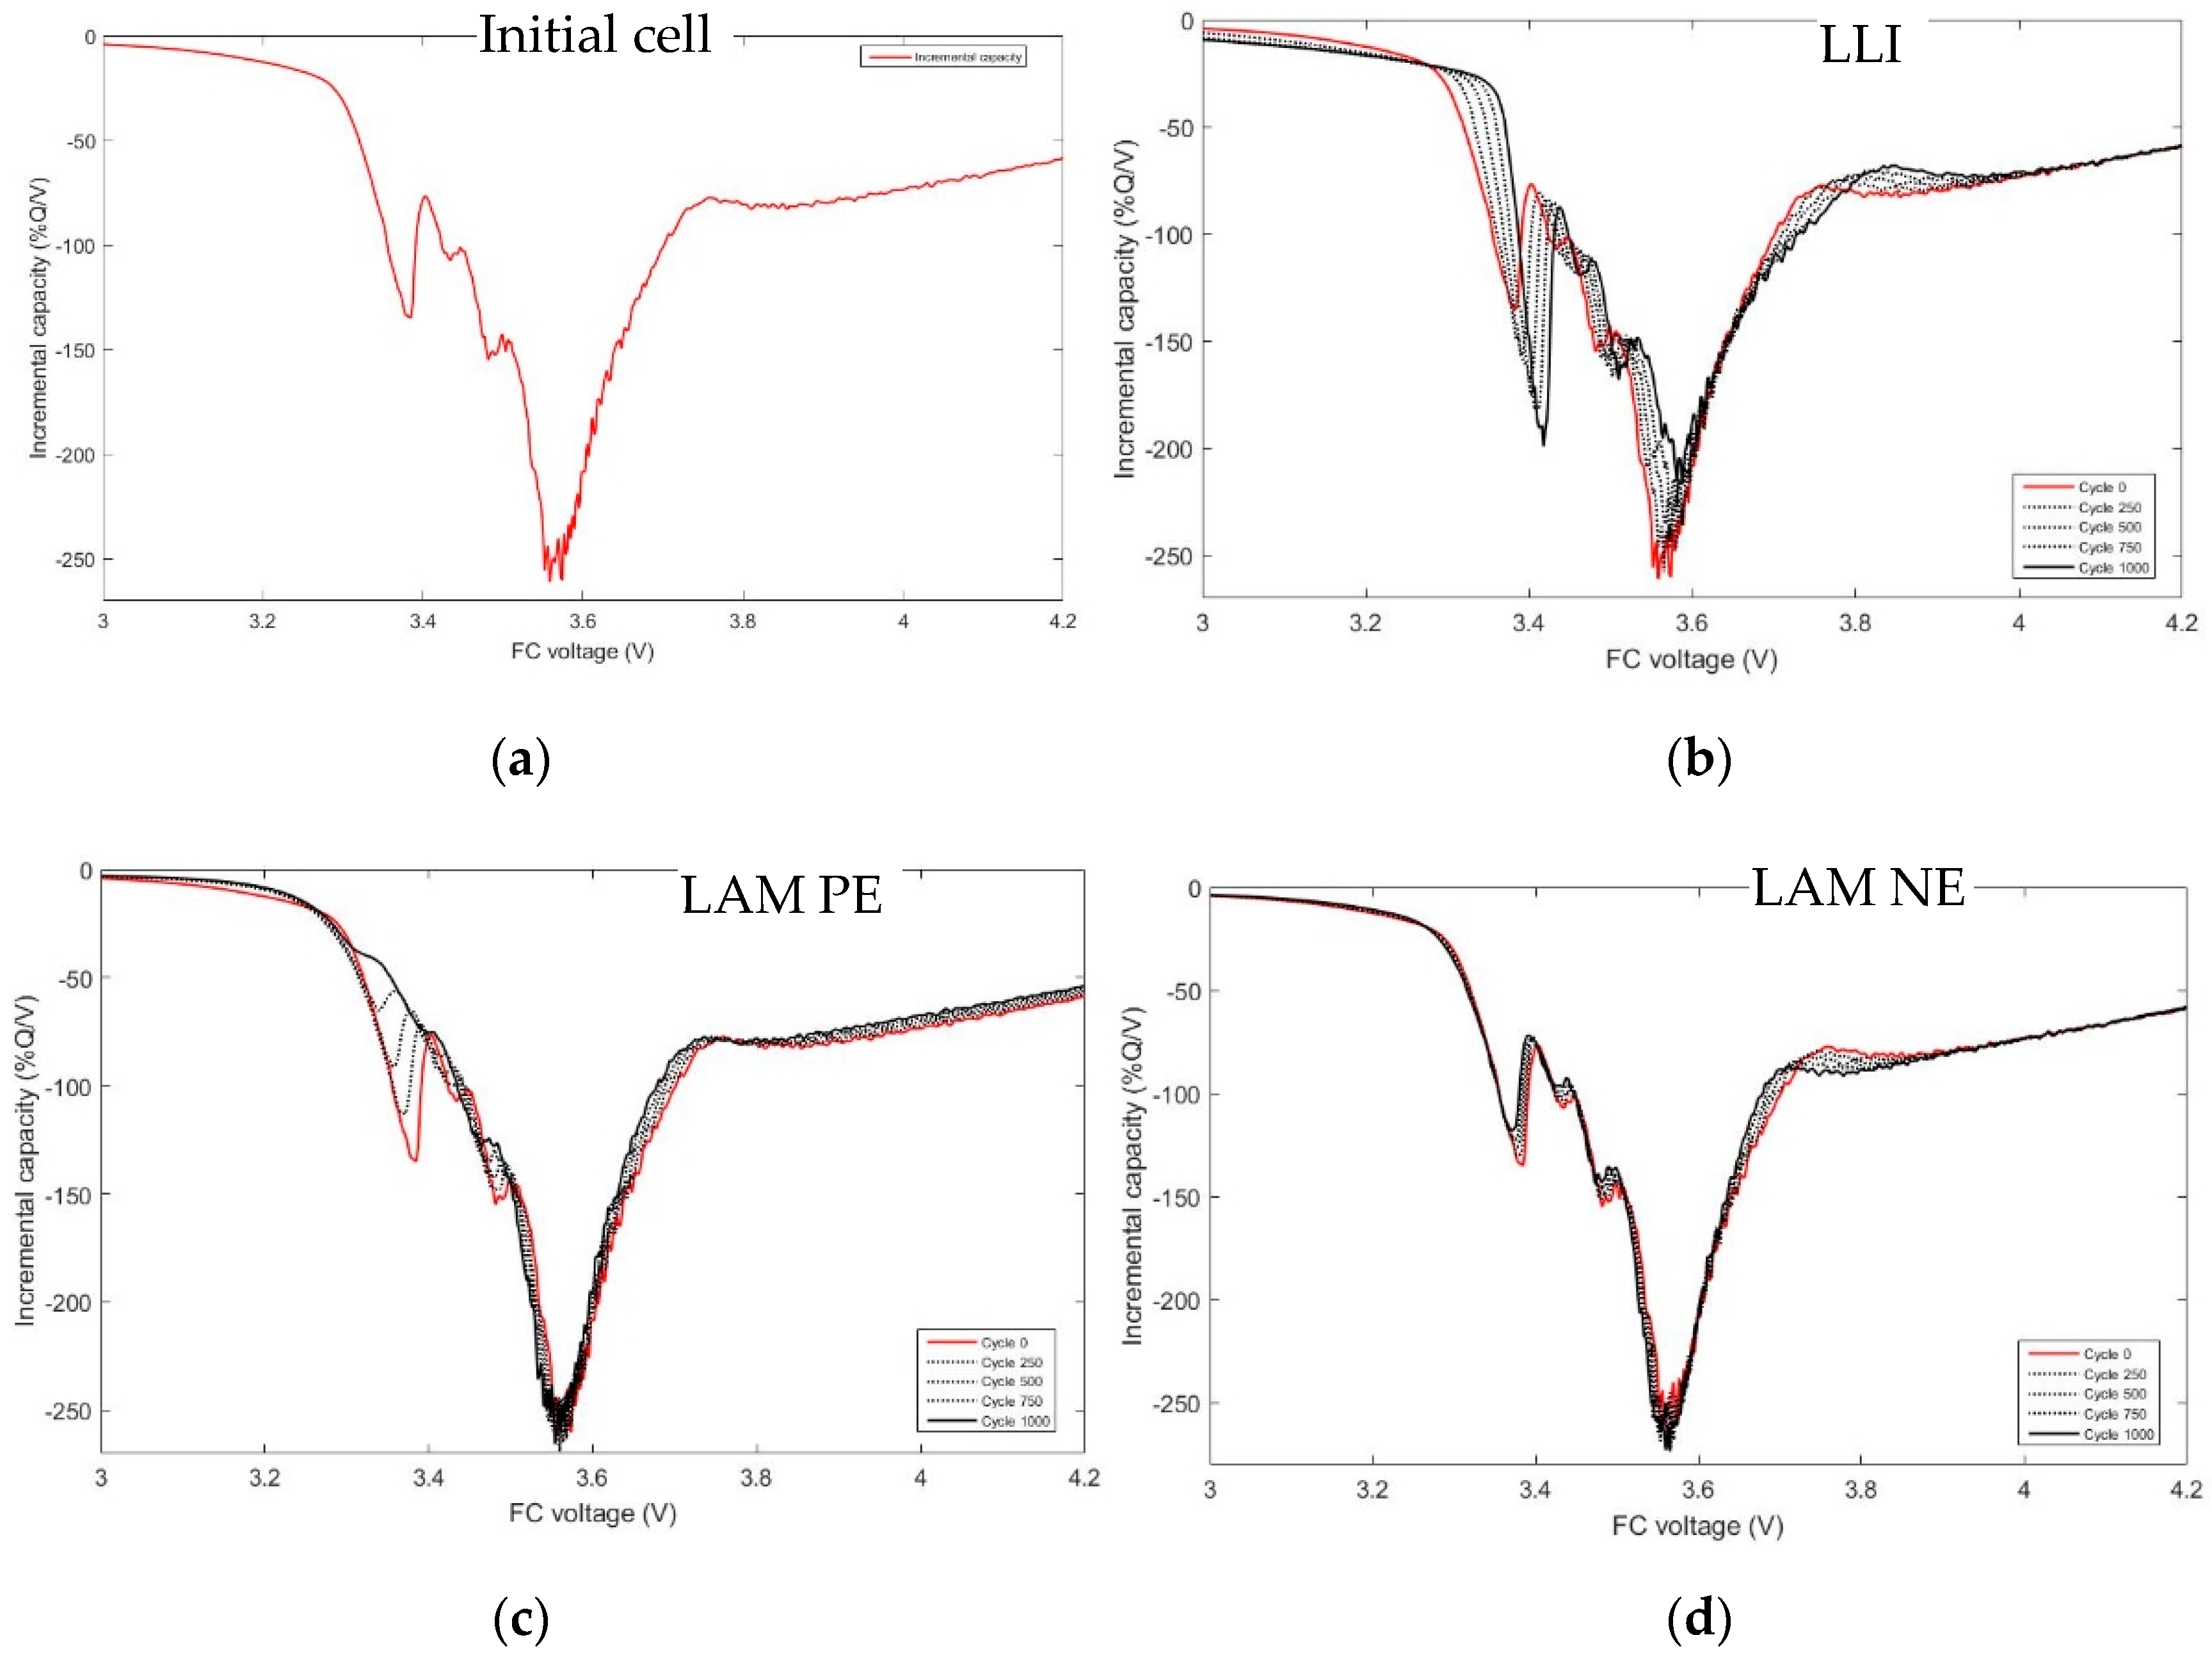
- Loss of lithium inventory (LLI) is caused by the consumption of Li cations by parasitic reactions of which the major remains the well-known SEI growth at the negative electrode. Therefore, less and less lithium ions are available to shuffle back and forth in the electrodes, captured in the electrode bulk or inside the electrolyte aggregates. The reactions lead to by-products released in the electrolyte, which can further cause side reactions [28,29]. This aging cause can often explain the first stages of the aging. The impact on the potential of LLI, as explained by Bloom et al. in [30], is that as the side reactions proceed, the lower potential regions of the NE would be removed, and thus, charging the cell would incompletely lithiate the NE. Compared to its initial state, at the end of charge, the NE is now at a higher potential. To maintain the upper limit value, there would be a shift to compensate at the positive electrode to higher potentials. However, in the graphite, the end of charge is a plateau and the potential of the PE will not very much.
- -
- Loss of active material (LAM): insulation of active material with loss of contacts with the conductive matrix, dissolution of transition metal in the electrolyte, structural changes in the crystalline structure of anode, and cathode active materials due to repeated insertions/disinsertions of ions. LAM appearing at the negative electrode only (LAM NE) and LAM appearing at the positive electrode only (LAM PE) have to be differentiated. Dubarry et al. [28] even separate LAM on delithiated and LAM on lithiated electrodes. The impact of LAM on the potential of PE and NE is well explained in Figure 6 of ref. [31] and by Matadi [16] and Dubarry [32,33].
- -
- Conductivity loss (CL): increasing of the faradic resistance due to mass transport slowdown or ionic conduction in the bulk of the electrode and increasing of the ohmic resistance due to contacts degradations in the electrodes or in the electrolyte conduction. CL only affects the cell voltage, not the capacity.
4.2. Background on ICA
4.3. Data Analysis of ICA
4.4. Verification of Assumptions Based on ‘Alawa’ Tool
- -
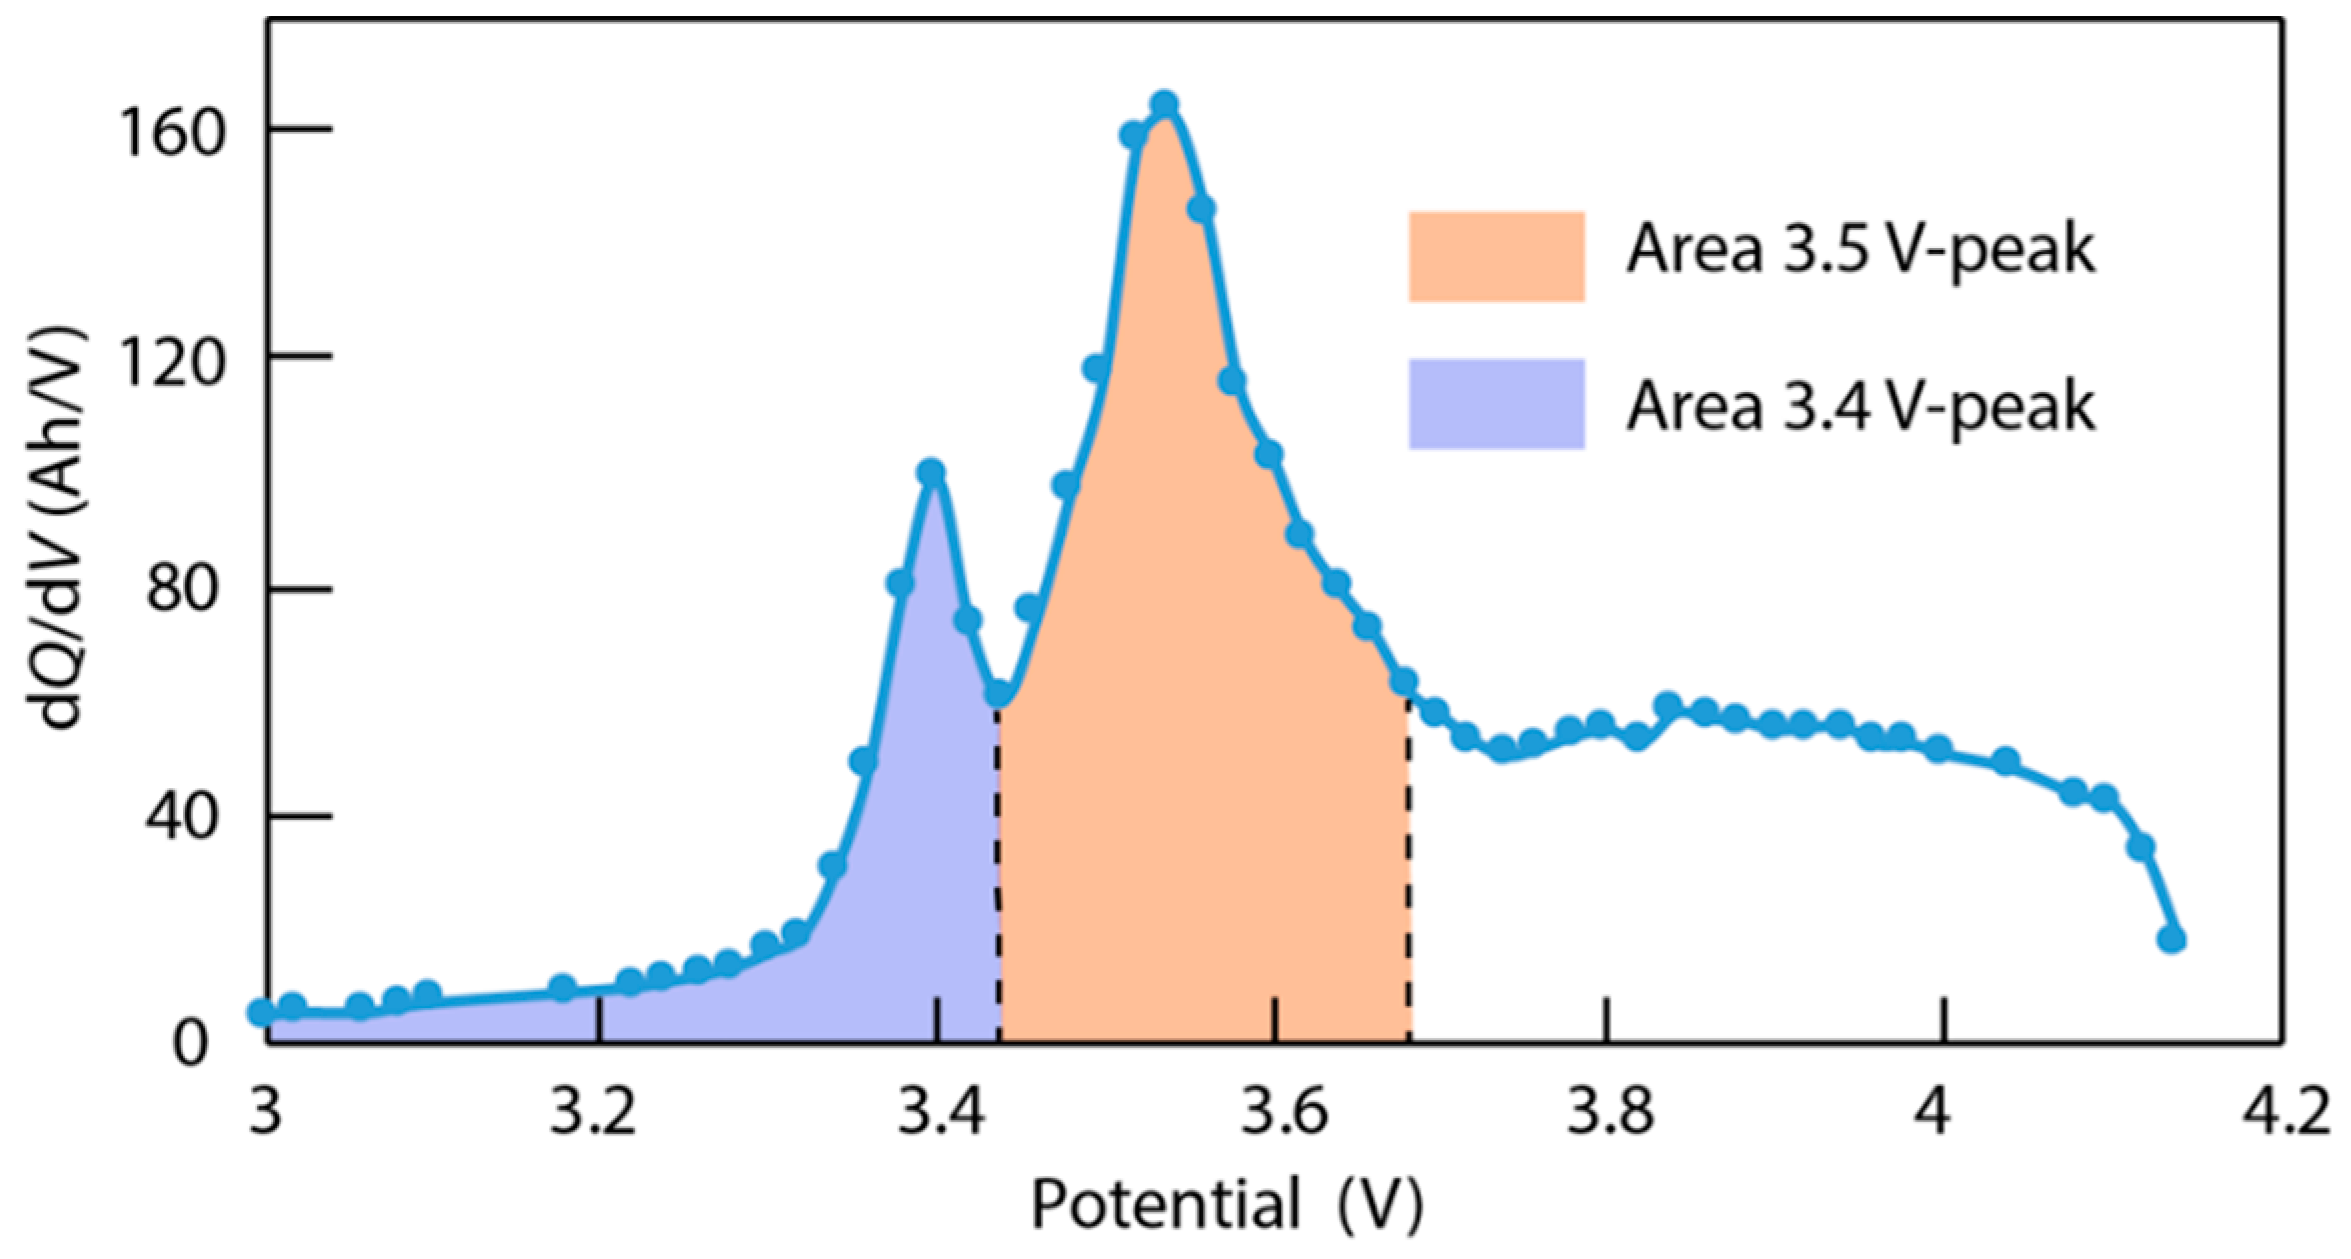
- LLI increases the 3.4 V peak intensity, and reduces the 3.5 V peak intensity. It confirms that less and less lithium is involved in NE stage 2-reaction through cycling. The remainder of the capacity that is not engaged in that stage 2-reaction remains available for the other reactions, thus the growing and earlier start of the 3.4 V peak.
- -
- LAM PE reduces the 3.4 V peak intensity, until it disappears, and moves the 3.5 V peak to lower voltages (slightly) while decreasing its intensity slightly.
- -
- LAM NE decreases slightly the 3.4 V peak and increases slightly the 3.5 V peak intensity.
4.5. Connection between ICA and the Fatigue Model
5. Conclusions
Author Contributions
Funding
Acknowledgments
Conflicts of Interest
References
- Vetter, J.; Novak, P.; Wagner, M.R.; Veit, C.; Moller, K.C.; Besenhard, J.O.; Winter, M.; Wohlfahrt-Mehrens, M.; Vogler, C.; Hammouche, A. Ageing mechanisms in lithium-ion batteries. J. Power Sources 2005, 147, 269–281. [Google Scholar] [CrossRef]
- Broussely, M.; Biensan, P.; Bonhomme, F.; Blanchard, P.; Herreyre, S.; Nechev, K.; Staniewicz, R.J. Main aging mechanisms in Li ion batteries. J. Power Sources 2005, 146, 90–96. [Google Scholar] [CrossRef]
- Grolleau, S.; Delaille, A.; Gualous, H.; Gyan, P.; Revel, R.; Bernard, J.; Redondo-Iglesias, E.; Peter, J. Calendar aging of commercial graphite/LiFePO4 cell—Predicting capacity fade under time dependent storage conditions. J. Power Sources 2014, 255, 450–458. [Google Scholar] [CrossRef]
- Novak, P.; Joho, F.; Lanz, M.; Rykart, B.; Panitz, J.-C.; Alliata, D.; Kötz, R.; Haas, O. The complex electrochemistry of graphite electrodes in lithium-ion batteries. J. Power Sources 2001, 97–98, 39–46. [Google Scholar] [CrossRef]
- Fuller, T.F.; Doyle, M.; Newman, J. Simulation and Optimization of the Dual Lithium Ion Insertion Cell. J. Electrochem. Soc. 1994, 141, 1–10. [Google Scholar] [CrossRef]
- Ramadass, P.; Haran, B.; White, R.; Popov, B.N. Development of First Principles Capacity Fade Model for Li-Ion Cells. J. Electrochem. Soc. 2004, 151, A196–A203. [Google Scholar] [CrossRef]
- Wang, C.Y.; Gu, W.B.; Liaw, B.Y. Micro-Macroscopic Coupled Modeling of Batteries and Fuel Cells I. Model Development. J. Electrochem. Soc. 1998, 145, A3407–A3417. [Google Scholar] [CrossRef]
- Subramanian, V.R.; Tapriyal, D.; White, R. A Boundary Condition for Porous Electrodes. Electrochem. Solid State Lett. 2004, 9, A259–A263. [Google Scholar] [CrossRef]
- Haran, B.S.; Popov, B.N.; White, R. Determination of a hydrogen diffusion coefficient in metal hybrids by impedance spectroscopy. J. Power Sources 1998, 75, A56–A63. [Google Scholar] [CrossRef]
- Ning, G.; Popov, B.N. Cycle life modeling of lithium-ion batteries. J. Electrochem. Soc. 2004, 151, A1584–A1591. [Google Scholar] [CrossRef]
- Delacourt, C.; Safari, M. Life Simulation of a Graphite/LiFePO4 Cell under Cycling and Storage. J. Electrochem. Soc. 2012, 159, 1283–1291. [Google Scholar] [CrossRef]
- Dudézert, C.; Reynier, Y.; Duffault, J.-M.; Franger, S. Fatigue damage approach applied to Li-ion batteries ageing characterization. Mater. Sci. Eng. B 2016, 213, 177–189. [Google Scholar] [CrossRef]
- Badey, Q. Etude des Mécanismes et Modélisation du Vieillissement des Batteries Lithium-ion Dans le Cadre d’un Usage Automobile. Ph.D. Thesis, Université Paris Sud, Orsay, France, 2012. [Google Scholar]
- Baghdadi, I.; Briat, O.; Delétage, J.; Gyan, P.; Vinassa, J. Chemical rate phenomenon approach applied to lithium battery capacity fade estimation. Microelectron. Reliabil. 2016, 64, 134–139. [Google Scholar] [CrossRef]
- Cole, B.; Sohn, J.J.; Bloom, I.; Jones, S.A.; Polzin, E.G. An accelerated calendar and cycle life study of li-ion cells. J. Power Sources 2001, 101, 238–247. [Google Scholar] [CrossRef]
- Matadi Pilipili, B. Etude des Mécanismes de Vieillissement des Batteries Li-ion en Cyclage à Basse Température et en Stockage à Haute Température: Compréhension des Origines et Modélisation du Vieillissement. Ph.D. Thesis, Université Grenoble Alpes, Grenoble, France, 2017. [Google Scholar]
- Delétang, T.; Barnel, N.; Franger, S.; Assaud, L. Transposition of a weighted Ah-throughput model to another Li-ion technology: Is the model still valid? New insights on the mechanisms. In Proceedings of the Coupled Problems Conference, Rhodes, Greece, 12–14 June 2017. [Google Scholar]
- Dubarry, M.; Truchot, C.; Cugnet, M.; Liaw, B.Y.; Gering, K.; Sazhin, S.; Jamison, D.; Michelbacher, C. Evaluation of commercial lithium-ion cells based on composite positive electrode for plug-in hybrid electric behicle applications. Part I: Initial Characterizations. J. Power Source 2011, 196, 10328–10335. [Google Scholar] [CrossRef]
- Delacourt, C.; Kassem, M. Postmortem analysis of calendar-aged graphite LiFePO4 cells. J. Power Sources 2013, 235, 159–171. [Google Scholar] [CrossRef]
- De Hoog, J.; Timmermans, J.-M.; Ioan-Stroe, D.; Swierczynski, M.; Jaguemont, J.; Goutam, S.; Omar, N.; Van Mierlo, J.; Van den Boosche, P. Combined cycling and calendar capacity fade modelling of a NMC oxide cell with real-life profile validation. Appl. Energy 2017, 200, 47–61. [Google Scholar] [CrossRef]
- Schmalstieg, J.; Käbitz, S.; Ecker, M.; Sauer, D.U. A holistic aging model for Li(NiMnCo)O2 based 18650 lithium-ion batteries. J. Power Sources 2014, 257, 325–334. [Google Scholar] [CrossRef]
- Dubarry, M.; Qin, N.; Brooker, P. Calendar aging of commercial Li-ion cells of different chemistries-A review. Curr. Opin. Electrochem. 2018, 9, 106–113. [Google Scholar] [CrossRef]
- Berecibar, M.; Dubarry, M.; Omar, N.; Villarreal, I.; Van Mierlo, J. Degradation mechanism detection for NMC batteries based on Incremental Capacity curves. World Electr. Veh. J. 2016, 8, 350–361. [Google Scholar] [CrossRef]
- Dubarry, M.; Devie, A.; Liaw, B.Y. The Value of Battery Diagnostics and Prognostics. J. Energy Power Sources 2014, 1, 242–249. [Google Scholar]
- Weng, C.; Cui, Y. On-board state of health monitoring of lithium-ion batteries using incremental capacity analysis with support vector regression. J. Power Sources 2013, 235, 36–44. [Google Scholar] [CrossRef]
- Li, Y.; Abdel-Monem, M.; Gopalakrishnan, R.; Berecibar, M.; Nanini-Maury, E.; Omar, N.; van den Bossche, P.; Van Mierlo, J. A quick on-line state of health estimation method for Li-ion battery with incremental capacity curves processed by Gaussian filter. J. Power Sources 2018, 373, 40–53. [Google Scholar] [CrossRef]
- Riviere, E.; Venet, P.; Sari, A.; Meniere, F.; Bultel, Y. LiFePO4 Battery State of Health Online Estimation Using Electric Vehicle Embedded Incremental Capacity Analysis. In Proceedings of the 2015 IEEE Vehicle Power and Propulsion Conference (VPPC), Montreal, QC, Canada, 19–22 October 2015. [Google Scholar]
- Cabelguen, P.E. Analyse de la Microstructure des Matériaux Actifs D’électrode Positive de Batteries Lithium-Ion. Ph.D. Thesis, Université Grenoble Alpes, Grenoble, France, 2016. [Google Scholar]
- Dubarry, M.; Truchot, C.; Liaw, B.Y. Cell degradation in commercial LiFePO4 cells with high-power and high nergy designs. J. Power Source 2014, 258, 408–419. [Google Scholar] [CrossRef]
- Bloom, I.; Walker, L.K.; Basco, J.; Abraham, D.; Christophersen, J.; Ho, C. Differential voltage analyses of high-power lithium cells 4. Cells containing NMC. J. Power Sources 2010, 195, 877–882. [Google Scholar] [CrossRef]
- Dubarry, M.; Truchot, C.; Liaw, B.Y. Synthesize battery degradation modes via a diagnostic and prognostic model. J. Power Sources 2012, 219, 204–216. [Google Scholar] [CrossRef]
- Dubarry, M.; Truchot, C.; Liaw, B.Y.; Gering, K.; Sazhin, S.; Jamison, D.; Michelbacher, C. Evaluation of commercial lithium-ion cells based on composite positive electrode for plug-in hybrid electric behicle applications. Part II: Degradation mechanism under 2C cycle aging. J. Power Source 2011, 196, 10336–10343. [Google Scholar] [CrossRef]
- Dubarry, M.; Svoboda, V.; Hwu, R.; Liaw, B.Y. Incremental Capacity Analysis and Close-to-Equilibrium OCV measurements to quantify capacity fade incommercial rechargeable lithium batteries. Electrochem. Solid State Lett. 2006, 9, A454–A457. [Google Scholar] [CrossRef]
- Fongy, C.; Jouanneau, S.; Guyomrd, D.; Badot, J.C.; Lestriez, B. Electronic and Ionic Wirings Versus the Insertion Reaction Contributions to the Polarization in LiFePO4 Composite Electrodes. J. Electrochem. Soc. 2010, 157, A1347–A1353. [Google Scholar] [CrossRef]
- Bloom, I.; Jansen, A.N.; Abraham, D.P.; Knuth, J.; Jones, S.A.; Battaglia, V.S.; Henriksen, G.L. Differential voltage analyses of high-power lithium cells 1. Technique and application. J. Power Sources 2005, 139, 295–303. [Google Scholar] [CrossRef]
- Bloom, I.; Christophersen, J.; Gering, K. Differential voltage analyses of high-power lithium cells 2. Applications. J. Power Sources 2005, 139, 304–313. [Google Scholar] [CrossRef]
- Li, X.; Wang, Z.; Zhang, L.; Zou, C.; Dorrell, D. State-of-health estimation for Li-ion batteries by combing the incremental capacity analysis with grey relational analysis. J. Power Sources 2019, 410–411, 106–114. [Google Scholar] [CrossRef]
- Buchberger, I.; Seidlmayer, S.; Pokharel, A.; Piana, M.; Hattendorff, J.; Kudejova, P.; Gilles, R.; Gasteiger, H.A. Aging analysis of Graphite/LiNiMnCoO2 cells using XRD, PGAA, and AC Impedance. J. Electrochem. Soc. 2015, 162, 2737–2746. [Google Scholar] [CrossRef]
- Stiaszny, B.; Ziegler, J.C.; Krauß, E.E.; Zhang, M.; Schmidt, J.P.; Ivers-Tiffée, E. Electrochemical characterization and post-mortem analysis of aged LiMn2O4—NMC/graphite lithium ion batteries part ii: Calendar aging. J. Power Source 2014, 195, 61–75. [Google Scholar] [CrossRef]
- Ansean, D.; Dubarry, M.; Devie, A.; Liaw, B.Y. Operando lithium plating quantification and early detection of a commercial LiFePO4 cell cycled under dynamic driving schedule. J. Power Sources 2017, 356, 36–46. [Google Scholar] [CrossRef]

| Cell | Capacity | Cut-Off Voltages | Charging Protocol |
|---|---|---|---|
| NMC/Graphite | 64 Ah | 4.2 V/3 V | CC-CV |
| Cell Number | Temperature/°C | SOC | I Charge | I Discharge |
|---|---|---|---|---|
| 1 | T1 = 10 | 100% | ||
| 2 | T1 = 23 | 100% | ||
| 3 | T1 = 45 | 100% | ||
| 4 | T1 = 55 | 100% | ||
| 5a | T1 = 45 | 15% | 1C | 1D |
| 5b | T1 = 45 | 30% | 1C | 1D |
| 5c | T1 = 45 | 50% | 1C | 1D |
| 5d | T1 = 45 | 80% | 1C | 1D |
| 6a | T1 = 45 | 50% | C/2 | 1D |
| 6b | T1 = 45 | 50% | 1C | D/2 |
| 7a | T1 = 23 | 50% | 1C | 1D |
| 7b | T1 = 23 | 30% | 1C | 1D |
| 8 | T2 = 10 | 50% | 1C | 1D |
| Average Voltage of the Maximum of the 3.5 V Peak | Standard Deviation 3.5 V | Average Voltage of the Maximum of the 3.4 V Peak | Standard Deviation 3.4 V | |
|---|---|---|---|---|
| (45 °C, 15%, 1C/1D) | 3.57 | 0.01 | 3.42 | 0.03 |
| (45 °C, 30%, 1C/1D) | 3.56 | 0.01 | 3.41 | 0.01 |
| (45 °C, 50%, 1C/1D) | 3.55 | 0.01 | 3.43 | 0.04 |
| (45 °C, 80%, 1C/1D) | 3.56 | 0.01 | 3.43 | 0.02 |
| (23 °C, 30%, 1C/1D) | 3.57 | 0.00 | 3.41 | 0.00 |
| (23 °C, 50%, 1C/1D) | 3.55 | 0.01 | 3.42 | 0.03 |
| (10 °C, 50%, 1C/1D) | 3.56 | 0.01 | 3.43 | 0.01 |
| Test Description | Correlation Coefficient HP-3.5 V//Loss Capacity | Correlation Coefficient HP-3.4 V//Loss Capacity |
|---|---|---|
| (45 °C, 15%, 1C/1D) | 0.97 | 0.93 |
| (45 °C, 30%, 1C/1D) | 0.97 | 0.91 |
| (45 °C, 50%, 1C/1D) | 0.95 | 0.78 |
| (45 °C, 80%, 1C/1D) | 0.90 | 0.73 |
| (23 °C, 30%, 1C/1D) | 0.96 | 0.69 |
| (23 °C, 50%, 1C/1D) | 0.98 | 0.92 |
| (10 °C, 50%, 1C/1D) | 0.80 | 0.63 |
| Test | Correlation Coefficient Peak 3.5 V//Ah | Correlation Coefficient |
|---|---|---|
| (45 °C, 15%, 1C/1D) | 0.97 | 0.98 |
| (45 °C, 30%, 1C/1D) | 0.98 | 0.71 |
| (45 °C, 50%, 1C/1D) | 0.94 | 0.76 |
| (45 °C, 80%, 1C/1D) | 0.82 | 0.32 |
| (23 °C, 30%, 1C/1D) | 0.81 | 0.97 |
| (23 °C, 50%, 1C/1D) | 0.98 | 0.93 |
| (10 °C, 50%, 1C/1D) | 0.88 | 0.53 |
| Test | Correlation Coefficient Peak 3.4 V//Ah | Correlation Coefficient |
|---|---|---|
| (45 °C, 15%, 1C/1D) | 0.96 | 0.98 |
| (45 °C, 30%, 1C/1D) | 0.88 | 0.71 |
| (45 °C, 50%, 1C/1D) | 0.84 | 0.76 |
| (45 °C, 80%, 1C/1D) | 0.26 | 0.32 |
| (23 °C, 30%, 1C/1D) | 0.20 | 0.97 |
| (23 °C, 50%, 1C/1D) | 0.86 | 0.93 |
| (10 °C, 50%, 1C/1D) | 0.37 | 0.53 |
| (55 °C, 100%, CAL) | -- | 0.56 |
| (45 °C, 100%, CAL) | -- | 0.85 |
| (10 °C, 100%, CAL) | -- | 0.99 |
| (23 °C, 100%, CAL) | -- | 0.94 |
| Test | Correlation Coefficient Peak 3.4 V//Alpha and Ah/√t + Beta |
|---|---|
| (45 °C, 15%, 1C/1D) | 0.70 |
| (45 °C, 30%, 1C/1D) | 0.92 |
| (45 °C, 50%, 1C/1D) | 0.97 |
| (45 °C, 80%, 1C/1D) | 0.18 |
| (23 °C, 30%, 1C/1D) | 0.78 |
| (23 °C, 50%, 1C/1D) | 0.66 |
| (10 °C, 50%, 1C/1D) | 0.26 |
© 2019 by the authors. Licensee MDPI, Basel, Switzerland. This article is an open access article distributed under the terms and conditions of the Creative Commons Attribution (CC BY) license (http://creativecommons.org/licenses/by/4.0/).
Share and Cite
Plattard, T.; Barnel, N.; Assaud, L.; Franger, S.; Duffault, J.-M. Combining a Fatigue Model and an Incremental Capacity Analysis on a Commercial NMC/Graphite Cell under Constant Current Cycling with and without Calendar Aging. Batteries 2019, 5, 36. https://doi.org/10.3390/batteries5010036
Plattard T, Barnel N, Assaud L, Franger S, Duffault J-M. Combining a Fatigue Model and an Incremental Capacity Analysis on a Commercial NMC/Graphite Cell under Constant Current Cycling with and without Calendar Aging. Batteries. 2019; 5(1):36. https://doi.org/10.3390/batteries5010036
Chicago/Turabian StylePlattard, Tiphaine, Nathalie Barnel, Loïc Assaud, Sylvain Franger, and Jean-Marc Duffault. 2019. "Combining a Fatigue Model and an Incremental Capacity Analysis on a Commercial NMC/Graphite Cell under Constant Current Cycling with and without Calendar Aging" Batteries 5, no. 1: 36. https://doi.org/10.3390/batteries5010036